Embed Size (px)
Citation preview

CONTENTS
Page 1
Leeds West CCG
Integrated Quality & Performance Report
Dec 2014
CONTENTS Page
Strategic Priorities 2
Acute Sector 5
Primary Care 15
Community Sector 19
Mental Health 24
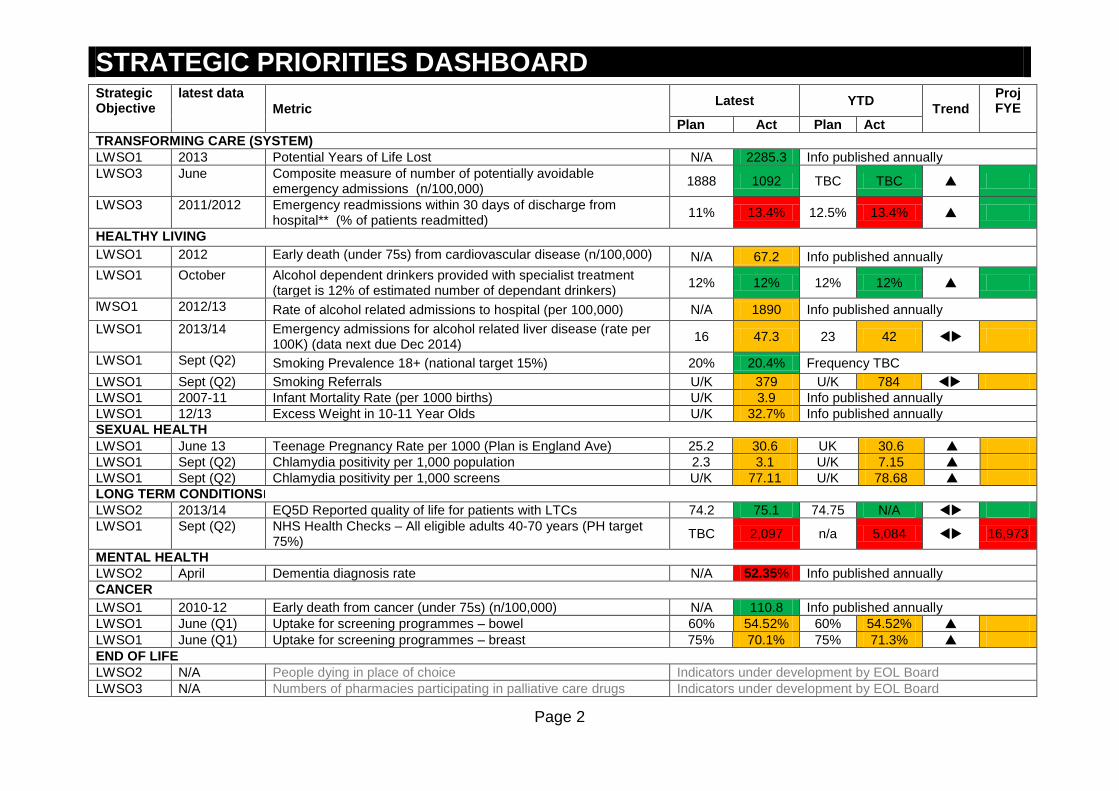
STRATEGIC PRIORITIES DASHBOARD
Page 2
Strategic Objective
latest data
Metric Latest YTD
Trend
Proj FYE
Plan Act Plan Act
TRANSFORMING CARE (SYSTEM)
LWSO1 2013 Potential Years of Life Lost N/A 2285.3 Info published annually
LWSO3 June Composite measure of number of potentially avoidable emergency admissions (n/100,000)
1888 1092 TBC TBC
LWSO3 2011/2012 Emergency readmissions within 30 days of discharge from hospital** (% of patients readmitted)
11% 13.4% 12.5% 13.4%
HEALTHY LIVING
LWSO1 2012 Early death (under 75s) from cardiovascular disease (n/100,000) N/A 67.2 Info published annually
LWSO1 October Alcohol dependent drinkers provided with specialist treatment (target is 12% of estimated number of dependant drinkers)
12% 12% 12% 12%
lWSO1 2012/13 Rate of alcohol related admissions to hospital (per 100,000) N/A 1890 Info published annually
LWSO1 2013/14 Emergency admissions for alcohol related liver disease (rate per 100K) (data next due Dec 2014)
16 47.3 23 42
LWSO1 Sept (Q2) Smoking Prevalence 18+ (national target 15%) 20% 20.4% Frequency TBC
LWSO1 Sept (Q2) Smoking Referrals U/K 379 U/K 784
LWSO1 2007-11 Infant Mortality Rate (per 1000 births) U/K 3.9 Info published annually
LWSO1 12/13 Excess Weight in 10-11 Year Olds U/K 32.7% Info published annually
SEXUAL HEALTH
LWSO1 June 13 Teenage Pregnancy Rate per 1000 (Plan is England Ave) 25.2 30.6 UK 30.6
LWSO1 Sept (Q2) Chlamydia positivity per 1,000 population 2.3 3.1 U/K 7.15
LWSO1 Sept (Q2) Chlamydia positivity per 1,000 screens U/K 77.11 U/K 78.68
LONG TERM CONDITIONS
LWSO2 2013/14 EQ5D Reported quality of life for patients with LTCs 74.2 75.1 74.75 N/A
LWSO1 Sept (Q2) NHS Health Checks – All eligible adults 40-70 years (PH target 75%)
TBC 2,097 n/a 5,084 16,973
MENTAL HEALTH
LWSO2 April Dementia diagnosis rate N/A 52.35% Info published annually
CANCER
LWSO1 2010-12 Early death from cancer (under 75s) (n/100,000) N/A 110.8 Info published annually
LWSO1 June (Q1) Uptake for screening programmes – bowel 60% 54.52% 60% 54.52%
LWSO1 June (Q1) Uptake for screening programmes – breast 75% 70.1% 75% 71.3%
END OF LIFE
LWSO2 N/A People dying in place of choice Indicators under development by EOL Board
LWSO3 N/A Numbers of pharmacies participating in palliative care drugs Indicators under development by EOL Board
STRATEGIC PRIORITIES DASHBOARD
Page 3
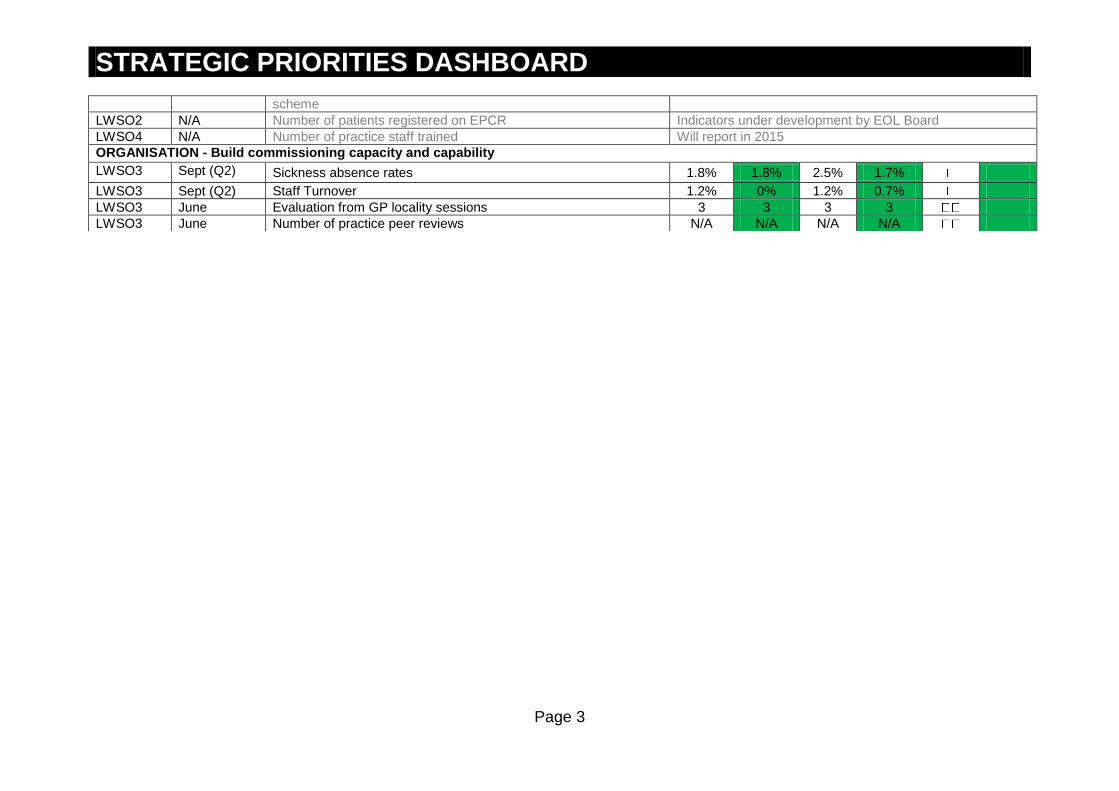
scheme
LWSO2 N/A Number of patients registered on EPCR Indicators under development by EOL Board
LWSO4 N/A Number of practice staff trained Will report in 2015
ORGANISATION - Build commissioning capacity and capability
LWSO3 Sept (Q2) Sickness absence rates 1.8% 1.8% 2.5% 1.7%
LWSO3 Sept (Q2) Staff Turnover 1.2% 0% 1.2% 0.7%
LWSO3 June Evaluation from GP locality sessions 3 3 3 3
LWSO3 June Number of practice peer reviews N/A N/A N/A N/A

STRATEGIC PRIORITIES DASHBOARD
Page 4
STRATEGY DELIVERY SUMMARY In this quarter there are updates on the public health indicators from Leeds City Council (data reflected are the final figures for 2013/14 when referring to YTD figures). The dashboards include intended indicators (whether information available currently or otherwise) and where possible have been updated. The staff turnover and sickness rates have been updated this month but changes are not significant. Links with the CCG OIS, H&WB board indicators or transformation priorities are updated again in this report; however it is the intention to review the transforming care indicators for the next report to reflect citywide transformation indicators which are currently under development. As refreshed version of the planned figures is also included in this report. This is because the annual bench marking figures have been recently released form the HSCIC. The approach taken is that the Plan = best in quartile figure, Actual = the actual rates for Leeds West CCG (most recent) and the YTD (plan) the national averaged rate or the mid-range of best to worst quartile. The board is requested to comment on this approach and provide feedback as appropriate. Leeds City Wide 5 Year Strategic Plan 2015-19: As reported for last month the three Leeds Clinical Commissioning Groups have been working with Leeds City Council, the NHS England Local Area Team and local provider services to describe our future direction for health care services over the next five years. This was delivered on time to NHS England on 20 June 2014 and we are awaiting feedback on the submission. Moving forward the strategic priorities will also reflect the Transformation Programme indicators which are being developed using an Outcomes Based Accountability (OBA) methodology.
TRANSFORMING CARE (READMISSION) The figure shown is latest from national data for readmissions. However, LWCCG which is lower than national. CSU reported readmission rate for LWCCG is currently around 11%. SEXUAL HEALTH This is a key priority for Leeds West CCG. The following key areas and actions have been identified
Improve uptake of contraception for under 25s in primary care.
STRATEGIC PRIORITIES DASHBOARD
Page 5
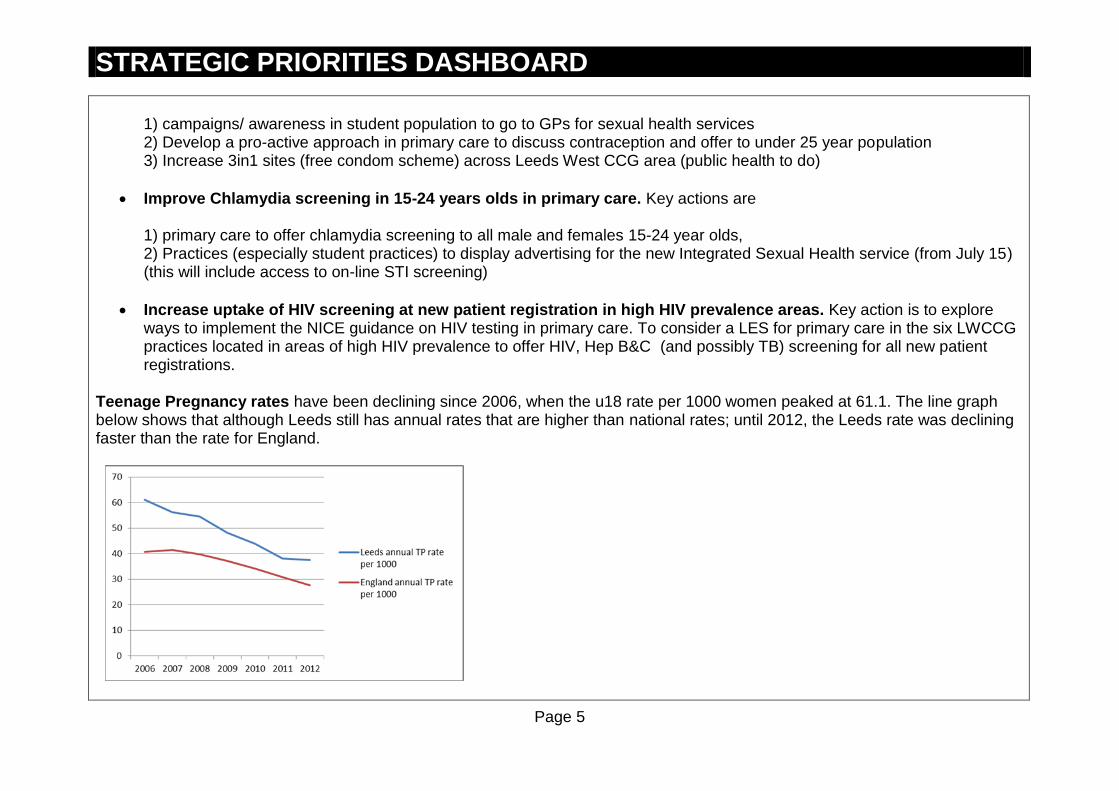
1) campaigns/ awareness in student population to go to GPs for sexual health services 2) Develop a pro-active approach in primary care to discuss contraception and offer to under 25 year population 3) Increase 3in1 sites (free condom scheme) across Leeds West CCG area (public health to do)
Improve Chlamydia screening in 15-24 years olds in primary care. Key actions are 1) primary care to offer chlamydia screening to all male and females 15-24 year olds, 2) Practices (especially student practices) to display advertising for the new Integrated Sexual Health service (from July 15) (this will include access to on-line STI screening)
Increase uptake of HIV screening at new patient registration in high HIV prevalence areas. Key action is to explore ways to implement the NICE guidance on HIV testing in primary care. To consider a LES for primary care in the six LWCCG practices located in areas of high HIV prevalence to offer HIV, Hep B&C (and possibly TB) screening for all new patient registrations.
Teenage Pregnancy rates have been declining since 2006, when the u18 rate per 1000 women peaked at 61.1. The line graph below shows that although Leeds still has annual rates that are higher than national rates; until 2012, the Leeds rate was declining faster than the rate for England.

STRATEGIC PRIORITIES DASHBOARD
Page 6
Leeds annual rate is higher than that of the Yorkshire & Humber region. When compared to statistical neighbours, Leeds’ rate is higher than Sheffield and Bolton, but lower than Stockton-on-Tees and Darlington. BOWEL SCREENING Nationally the bowel screening programme has extended its age range to include 70 – 74 year olds. The Harrogate, York and Leeds cluster are the only site nationally yet to implement this extension. However, following improvements in the LTHT diagnostic waiting times in September and October (and expected delivery in November), a LAT Board meeting is due in December to recommend the age extension begins locally from January 2015.
ACUTE SECTOR DASHBOARD
Page 7
Strategic Objective
latest data ACCESS Latest YTD Trend Proj FYE
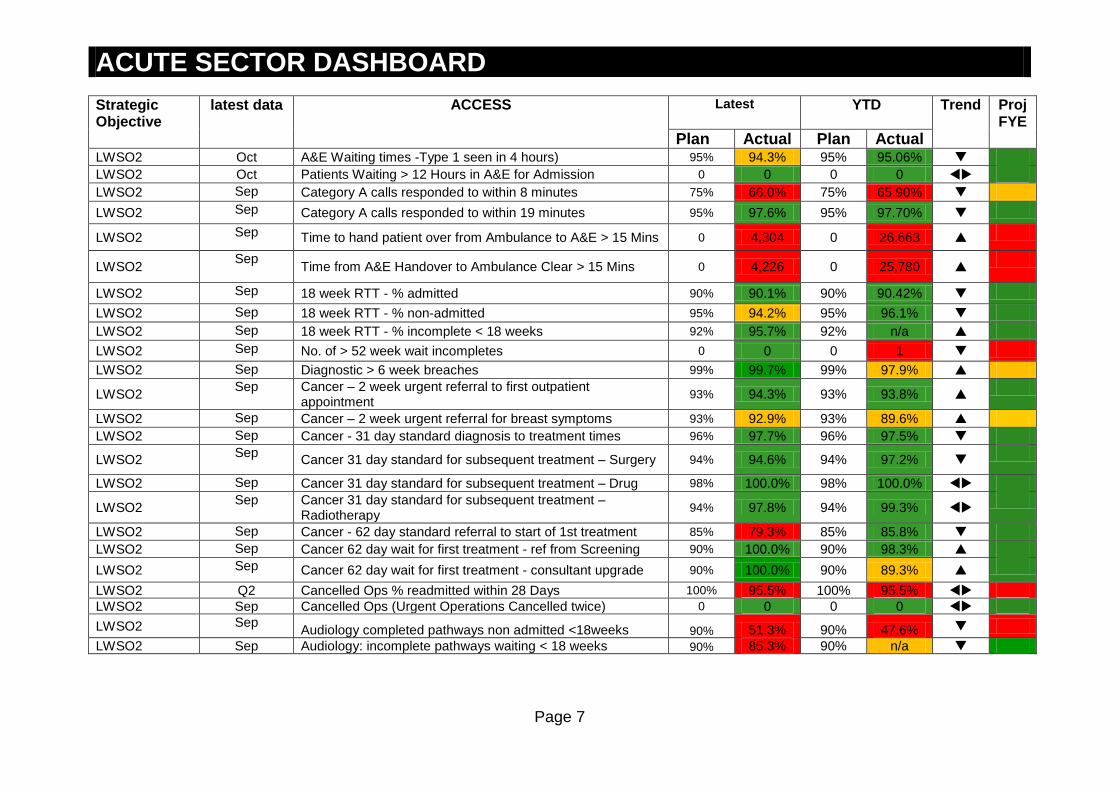
Plan Actual Plan Actual LWSO2 Oct A&E Waiting times -Type 1 seen in 4 hours) 95% 94.3% 95% 95.06%
LWSO2 Oct Patients Waiting > 12 Hours in A&E for Admission 0 0 0 0
LWSO2 Sep Category A calls responded to within 8 minutes 75% 66.0% 75% 65.90%
LWSO2 Sep Category A calls responded to within 19 minutes 95% 97.6% 95% 97.70%
LWSO2 Sep Time to hand patient over from Ambulance to A&E > 15 Mins 0 4,304 0 26,663
LWSO2 Sep
Time from A&E Handover to Ambulance Clear > 15 Mins 0 4,226 0 25,780
LWSO2 Sep 18 week RTT - % admitted 90% 90.1% 90% 90.42%
LWSO2 Sep 18 week RTT - % non-admitted 95% 94.2% 95% 96.1%
LWSO2 Sep 18 week RTT - % incomplete < 18 weeks 92% 95.7% 92% n/a
LWSO2 Sep No. of > 52 week wait incompletes 0 0 0 1
LWSO2 Sep Diagnostic > 6 week breaches 99% 99.7% 99% 97.9%
LWSO2 Sep Cancer – 2 week urgent referral to first outpatient
appointment 93% 94.3% 93% 93.8%
LWSO2 Sep Cancer – 2 week urgent referral for breast symptoms 93% 92.9% 93% 89.6% LWSO2 Sep Cancer - 31 day standard diagnosis to treatment times 96% 97.7% 96% 97.5%
LWSO2 Sep
Cancer 31 day standard for subsequent treatment – Surgery 94% 94.6% 94% 97.2%
LWSO2 Sep Cancer 31 day standard for subsequent treatment – Drug 98% 100.0% 98% 100.0%
LWSO2 Sep Cancer 31 day standard for subsequent treatment –
Radiotherapy 94% 97.8% 94% 99.3%
LWSO2 Sep Cancer - 62 day standard referral to start of 1st treatment 85% 79.3% 85% 85.8%
LWSO2 Sep Cancer 62 day wait for first treatment - ref from Screening 90% 100.0% 90% 98.3%
LWSO2 Sep Cancer 62 day wait for first treatment - consultant upgrade 90% 100.0% 90% 89.3%
LWSO2 Q2 Cancelled Ops % readmitted within 28 Days 100% 95.5% 100% 95.5%
LWSO2 Sep Cancelled Ops (Urgent Operations Cancelled twice) 0 0 0 0
LWSO2 Sep Audiology completed pathways non admitted <18weeks 90% 51.3% 90% 47.6%
LWSO2 Sep Audiology: incomplete pathways waiting < 18 weeks 90% 85.3% 90% n/a

ACUTE SECTOR DASHBOARD
Page 8
Strategic Objective
latest data QUALITY AND SAFETY Latest YTD Trend Proj FYE
Plan Actual Plan Actual
LWSO1 April-13 to March-14
Mortality Rate (SHMI) 100 101
LWSO2 Oct MRSA (LTH) 0 0 0 4
LWSO2 Oct C.diff (LTH) 10 12* 73 72
LWSO2 Q1 Stroke – scan within 1 hour of clock start 43.1% 40.0% N/A N/A
LWSO2 Q1 Stroke – scan within 12 hours of clock start 87.1% 91.3% N/A N/A
LWSO2 Q1 Stroke – proportion of eligible patients given thrombolysis 80% 91.2% N/A N/A
LWSO2 Sept Stroke - admission to stroke unit within 4 hours* 60% 54.2% N/A N/A
LWSO2 Aug Stroke – Patients spending 90% of time on stroke unit* 80% 80.5% N/A N/A
N/A Stroke- Follow up assessment TBC TBC N/A
LWSO2 Patient Safety: NHS Safety Thermometer all providers
LWSO2 Oct Harm Free Care 93.87% 94.12% N/A N/A
LWSO2 Oct Pressure Ulcers - new 1.03% 1.52% N/A N/A
LWSO2 Oct VTE - new 0.44% 0.53% N/A N/A
LWSO2 Oct Falls with harm 0.63% 0.33% N/A N/A
LWSO2 Oct Catheter and new UTIs 0.36% 0.40% N/A N/A
LWSO2 Oct New harms 2.42% 2.64 N/A N/A
LWSO2 Oct Serious Incidents (including pressure ulcers) N/A 15 N/A 63
LWSO2 Oct Never Events 0 1 N/A 4
LWSO2 Sept Maternity Caesarean Section Rate ≤22% 19.9% N/A N/A
LWSO2 Sept Birth Before Arrival (LTH) 1.0% 2.18% 1.0% N/A
LWSO2 Safer Staffing: % of planned registered nurse level
LWSO2 Oct Leeds General Infirmary 89% N/A N/A
LWSO2 Oct St James’s Hospital 90% N/A N/A
LWSO2 Oct Chapel Allerton 102% N/A N/A
LWSO2 Oct Wharfedale 109% N/A N/A
LWSO2 Mid Yorkshire NHS Trust
LWSO2 Oct Pinderfields 87% N/A N/A
LWSO2 Oct Dewsbury and District 91% N/A N/A
LWSO2 Oct Pontefract 90% N/A N/A

ACUTE SECTOR DASHBOARD
Page 9
Strategic Objective
latest data PATIENT EXPERIENCE (LTH): Friends and Family test (FFT)
Latest YTD Trend Proj FYE Plan Actual Plan Actual
LWSO2 Sept FFT - IP % recommended 94% 90% N/A N/A
LWSO2 Sept FFT – IP - Response 36.6% 36.5% N/A N/A
LWSO2 Sept FFT - A/E % recommended 86% 83% N/A N/A
LWSO2 Sept FFT - A/E Response 19.5% 16.4% N/A N/A
LWSO2 Sept FFT Ante Natal % recommended 95% 96% N/A N/A
LWSO2 Sept FFT Ante Natal - Response N/A N/A
LWSO2 Sept FFT Birth % recommended 95% 100% N/A N/A
LWSO2 Sept FFT Birth - Response 21.3% 2.6% N/A N/A
LWSO2 Sept FFT Post Natal Ward % recommended 91% 92% N/A N/A
LWSO2 Sept FFT Post Natal Ward - Response
LWSO2 Sept FFT Post Natal Community Services % recommended 96% 93% N/A N/A
LWSO2 RESOURCES
LWSO2 Sept LTHT Staff Sickness and Absence rates 3.63% 4.1% 3.63% 4.1%
LWSO2 Aug LTHT Financial Position (£) red text = deficit N/A N/A £26,346 £25,667
LWSO2 Aug CIP Delivery N/A N/A £19,505 £13,270
latest data ACTIVITY Plan (YTD)
Actual (YTD)
Plan (FOT)
Actual FOT)
Trend Proj FYE
LWSO3 Sept A&E 42,687 42,786 85,000 85,162
LWSO3 Sept Outpatient Firsts 37,107 39,222 74,167 78,394
LWSO3 Sept Outpatient Follow Ups + 82,320 81,974 164,577 163,922
LWSO3 Sept Outpatient DNA 0 12% 0 12%
LWSO3 Sept Outpatient Procedures 8,977 10,201 17,932 20,380
LWSO3 Sept Elective 18,820 19,193 37,803 38,429
LWSO3 Sept Non Elective 22,533 23,360 45,154 46,668

ACUTE SECTOR DASHBOARD
Page 10
ACCESS A&E – 4 Hour Emergency Care Standard: The Emergency Care Standard continues to be under pressure. For much of the year pressures have been more acute at St James’s which takes the bulk of admissions of acute and elderly medicine patients. However, since the summer there have also been a number of occasions on which the LGI’s performance has also fallen below 95%. There has been an increase in A&E attendances over 2013/14 (up 2.7% on last year in the year to August) as have delayed transfers of care, both of which have added to pressure on the provider. The Strategic Urgent Care Board continues to oversee city-wide actions to reduce delays and support diversion, with additional funding being made available through the national Strategic Resilience Funding. Referral to Treatment Waiting Times The CCG continued to achieve the 90% admitted standard in September, reflecting the improvements at LTHT. It slightly underachieved the 95% non-admitted standard, in line with LTHT’s continued clearance of high volumes of long waiters in specialties such as gastroenterology and dermatology. The 92% incomplete standard continues to be exceeded. The main outstanding inpatient areas of pressures are spinal, vascular, and plastic surgery and the main outpatient pressures are in gastroenterology, allergy and dental specialties. We remain concerned regarding the long first out patient wait times in gastroenterology but the numbers of long waiters are improving each month as LTHT delivers an internal recovery plan. The CCG has commissioned additional gastroenterology providers who are helping to reduce the waits. Waiting times for first outpatient appointments are now monitored on a monthly basis at the Elective Care working group with LTHT. LTHT have also commenced a review of productivity in outpatients. Standards in outpatients are also the subject of a Transformation Board Elective care work-stream project. Mid Yorkshire Hospitals has also greatly improved its long wait position, achieving the 92% incomplete pathways standard in September. Key Actions:
Detailed performance monitoring of LTHT actions and delivery through Elective Care Performance meeting. Diagnostic wait times including Endoscopy LTHT has now achieved the 99% six week diagnostic wait target for September and October and is due to achieve this in November. but the numbers of over 6 week waiters has improved each month with a detailed action plan in place to deliver improvements in the endoscopy services. The endoscopy services are due to achieve 99% from

ACUTE SECTOR DASHBOARD
Page 11
September 14. There were some staffing pressures on MRI services over the summer which have now been addressed. The CCG has procured additional MRI capacity to help maintain and improve waiting times for GP referrals Audiology The Audiology completed performance is low as the team continue to treat all their longest waiting patients and have increased the numbers of appointments offered. The median waiting time for treatment continues to reduce. LTHT will achieve the 90% standard by the end of December 2014 and has plans for ongoing improvements thereafter. The audiology services have recently been reviewed and procurement options considered by SMT. Cancer: Performance against the two week wait standards has been volatile in recent months but has now been achieved and sustained. The 2 week wait breast symptomatic pathway appears to be improving. The city has developed a Leeds Integrated cancer Services Steering group. This is underpinned by a vision to develop a comprehensive cancer centre in Leeds, with primary and secondary care working together. The breast diagnostic pathway is the first pathway to be part of the Leeds Integrated Cancer Service review programme. There are significant remaining challenges on the 62 day pathways. The LWCCG position has been partly impacted on by work at LTHT to increase capacity and treat as many of the longest waiters as possible. Detailed improvement plans for Cancer have been submitted to the LTHT Trust Board and a Leeds integrated cancer service has now been established to ensure that all plans are developed and delivered. The areas which are most underperforming are urology, Gynaecology and Lung surgery. LTHT is predicting achievement of the 85% standard for internal (mostly Leeds) patients and those patients received from other hospitals by day 38 by the end of Q4. However, it cannot guarantee delivery of the overall standard without an improvement in the number of late referrals from District General Hospitals. LTHT has met with each of the referring units and asked them to supply improvement plans to support this improvement, and there is also focus on this from the Cancer Network. A West Yorkshire summit has been held on 25 November to help drive these improvements across the patch, the focus being the late inter provider transfers from other hospitals in the region. Key Actions:
LTHT addressing capacity and pathway constraints in thoracic surgery, gynaecology and urology
CCG will continue to press commissioners to ask them to include minimum waits for cancer pathways that cross between providers in quality requirements for their own providers to help lever improved performance.
Regional work ongoing re late referrals.

ACUTE SECTOR DASHBOARD
Page 12
Delayed Follow-ups: While there have been significant improvements in gastroenterology and colorectal surgery there continue to be unacceptable numbers of delays for follow up appointments. This is the subject of ongoing work within these specialties, supported by the CCG’s work on redesigning these pathways to minimise unnecessary demand. CLINICAL EFFECTIVENESS, QUALITY AND SAFETY Health Care Associated Infections (HCAIs): The C difficile threshold for 2014-15 is 127; the MRSA bacteraemia threshold is 0. The number of C.difficile infections for LTHT in the current financial year is 72 against a year to date threshold of 73; this total includes 13 cases which have been deemed unavoidable in accordance with a regionally agreed process in line with guidance from NHS England. These cases will remain in the overall 2014/15 total for LTHT, but not count towards a total to which financial sanctions will apply, should the annual threshold be exceeded. There have been a total of 4 MRSA infections to date. Key Actions
The Infection Control team have undergone a reconfiguration to encourage more local accountability within the Clinical Service Units, and move towards a facilitative approach rather than a reactive one.
The programme of Hydrogen Peroxide decontamination continues, as does Trust monitoring of application and implementation of infection control protocols.
The Trust has employed a C difficile Nurse Specialist and is reporting improved patient management and support for ward staff as a result; this is also resulting in improved communication with the community Infection Control Team when patients are discharged from hospital.
The Trust continues to review and implement its comprehensive action plan which is monitored at the joint CCG/LTH Quality Meeting where update and challenge takes place at director level.
Stroke Care: Data is retrieved from the Sentinel Stroke National Audit Programme (SSNAP) and the figures included as ‘plan’ represent the national average as there is no national target for the indicators included. Where performance is below the national average figure presented, the RAG rating for the indicator represents that in the SSNAP published data. There is a significant time lag between data submission and publication; the data presented in this report is for Q12014/15. NB: Where the indicator is marked * local pre-publication data has been made available, detailing more accurate and up to date performance. The thresholds for these represent contractual and internal indicators rather than national average. A recovery action plan has been implemented for stroke care and actions to improve and sustain performance are monitored internally through operational delivery meetings with the Clinical Service Unit.
ACUTE SECTOR DASHBOARD
Page 13
LTHT is currently centralising its stroke beds at the LGI in improved accommodation. Performance against Stroke indicators is monitored via the joint monthly Leeds CCGs/LTHT Quality Group. There are 11 NICE quality standards for Stroke care that reflect NICE guidance. This IQPR reports on five of them. A business case was approved to provide follow up assessment for stroke patients and once in place we can produce an indicator for this in the IQPR. Patient Safety NHS Safety Thermometer data used in this report is taken from a monthly point prevalence survey; thresholds for each indicator are therefore based on the England average rather than a monthly or annual objective. Trend arrows are used to show improvement/decline from the previous month. A new indicator ‘new harms’ has been added to this category which demonstrates harms occurring under the influence of LTHT. Pressure Ulcers: Whilst the number of new category three pressure ulcers remains slightly higher than the national average, performance continues along an improvement trajectory in line with LTHT’s extensive programme of work supported by a national CQUIN. Birth before arrival: the proportion of births before arrival at hospital was 2.18%, exceeding the internal target of 1%. Commissioners are working with LTHT to understand this variation and any persisting issues will be reported. Data is not collected nationally for this indicator and therefore there is no national benchmark, though a regional benchmark is being considered. Key Actions
The CCG agreed two further CQUIN indicators for 2014-15 which aim to reduce the numbers of category two and three ulcers still further; one of the indicators requires that the Trust co-ordinate a cross-city approach to reducing pressure ulcers.
Pressure ulcer numbers are now included in the LTHT Ward Healthcheck and reported on Patient Safety Boards on each wards; key actions are implemented where pressure ulcers are highlighted as a specific problem on a ward.
Numbers of pressure ulcers continue to be monitored at the joint monthly Leeds CCGs/LTHT Quality Group. Serious Incidents and Never Events: The cells on the dashboard relating to serious incidents and never events are not coloured. There are no nationally recognised targets or trajectories based on reporting of serious incidents. Incident management theory works on the principle of encouraging a reporting culture and the more issues that are reported the better the learning can be extracted and changes made. Incentivising reductions in reporting runs counter-intuitive to that. It reasonable to colour Never Events however due to the nature of these incidents and there unavoidability. Any Never Event should be red.

ACUTE SECTOR DASHBOARD
Page 14
Four never events have been reported in this financial year to date, all relating to wrong site surgery and 2 of these in the same service. A Never Events Assurance & Challenge meeting is planned to examine these incidents in detail. Never event and serious incident reports of are received by the CCG and reviewed monthly at the Serious Incident Review Panel. Key Actions
Serious incidents and never events are discussed at the joint monthly Leeds CCGs/LTHT Quality Group
SI and never event reports are reviewed at the monthly Leeds CCG Serious Incident Review Panel meeting
Staffing: Leeds West CCG currently receives copies of LTH’s Ward Dashboard which includes staffing information by ward; this is reviewed at the joint CCG LTH Quality Meeting. The CCG is assured that the Trust has a robust mechanism in place for identifying areas where staffing may be an issue and responding quickly and appropriately. However, the data is presented by ward and not aggregated so impractical for inclusion in the IQPR. From June 2014 Trusts are required to submit to their Board a six-monthly report describing the staffing capacity and capability using evidence based tools where possible, and a monthly report containing details of planned and actual staffing on a shift-by-shift basis at ward level for the previous month. This measure shows the overall average percentage of planned day and night hours for registered and non-registered nurses and midwives in hospitals which are filled. Following a recruitment programme, 205 band 5 nurses have commenced employment or received start dates across October/November. In order to retain graduates awaiting their registration, recruits have been offered Band 3 CSW posts in the interim period. PATIENT EXPERIENCE Friends and Family Test: The FFT will be extended to all NHS services in England by the end of March 2015. LTHT have achieved the roll-out of the FFT to day cases children's and outpatient departments ahead of the NHS England deadline. LTHT aims to ensure at least 20% of eligible patients respond to the Friends and Family Test (FFT) question. There has been a change in the methodology of the FFT and the former net promoter score has been replaced by % of respondents who would recommend the service to family and friends. Trend arrows have therefore been removed from these indicators for this report. Ante-natal and Post-natal response rates are omitted from this report as denominator data has not been made available by NHS England. The ‘birth’ response rate for FFT remains significantly less than the national average at 2.6%. Analysis of this issue by LTHT has shown:
Poor data returns from community services with regard to both the denominator (eligible women) and numerator (FFT responses)

ACUTE SECTOR DASHBOARD
Page 15
A reduction in responses across all sites
Poor awareness amongst staff of the implications of not achieving this CQUIN indicator
LGI services return rates are consistently better than those achieved at SJUH This will be followed up at the CCG/LTHT monthly Quality Group
Key Actions:
Introduction of FFT ‘business cards’ to community staff from 1st July 2014. These allow women to complete the question online at a time of their choosing after birth. The Trust is also considering their use in hospital
The CSU are considering piloting texting the FFT questions
Heads of service are considering better sharing of FFT results with staff to raise the profile of its value
FFT co-ordinator continues to work with delivery suite staff to discuss issues.
Head of Patient experience exploring solutions for integrating FFT into current processes.
The Patient Experience Lead is now in post to further focus this improvement work
Friends and Family Test scores are monitored at the monthly CCG/LTH Quality group where appropriate challenge takes place on lower than expected performance
RESOURCES Sickness and Absence: Sickness absence rates are below the regional average and in line with the national average but above the Trust's internal target. The dedicated Attendance Management Team continues to work with managers to ensure attendance is proactively managed at individual, department and CSU level. Cost Improvement Programme (CIP): At the end of Month 5, the Trust reported a deficit of £26.4 million against a planned deficit of £26.9 million, resulting in a favourable variance against plan of £0.5 million. Though the Trust continues to perform in line with its financial plan, the key risk around achieving our financial performance outturn is CIP delivery. With some schemes not due to commence until later in the year, and with a proportion still unidentified, failure to deliver these will have a detrimental impact on the Trust's forecast position. At Month 5 the Trust remains behind on delivering its CIP plan, but this position is currently being mitigated by non-recurrent under spends elsewhere. The forecast plan assumes that all CIP’s are fully delivered by the end of the year. HARROGATE FT PERFORMANCE Harrogate consistently achieves against the National Operational standards.
ACUTE SECTOR DASHBOARD
Page 16
MID YORKSHIRE HEALTHCARE TRUST PERFORMANCE MYHT performance against Cancer standards is volatile, and partly impacted upon by the numbers of late referrals to LTHT which are then treated beyond 62 days which affects the MYHT reported performance. It achieved the 92% incomplete RTT standard in September for the first time but failed the other standards which are affected by this clearance. The Trust has a detailed plan to recover 18 week performance by the end of September including validation, activity maximisation, specialty level plans and an improved governance arrangement for waiting list management which has now been centralised. A particular area of concern is the waits at Mid Yorkshire for Maxillary Facial patients. MYHT has had staffing issues and their wait times for this speciality are growing. This is also impacting on LTHT for this speciality as referrals are diverted.
PRIMARY CARE DASHBOARD
Page 17
Strategic Objective
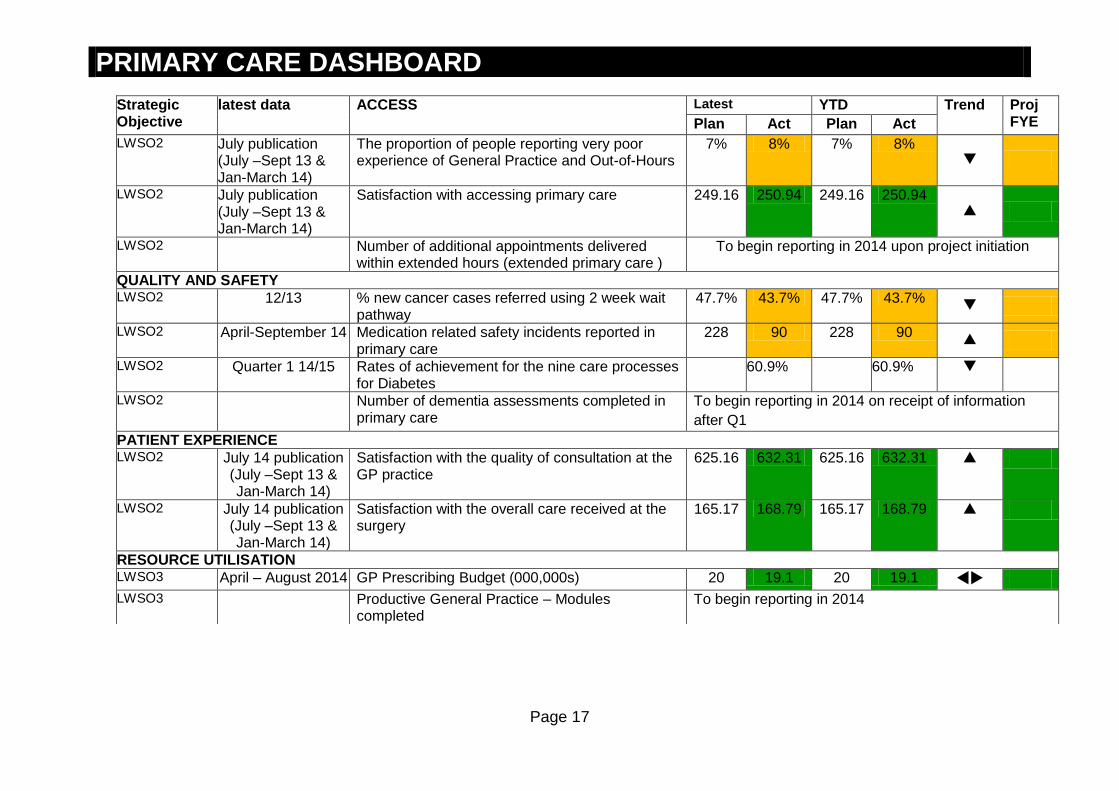
latest data ACCESS Latest YTD Trend Proj FYE Plan Act Plan Act
LWSO2 July publication (July –Sept 13 & Jan-March 14)
The proportion of people reporting very poor experience of General Practice and Out-of-Hours
7% 8% 7% 8%
LWSO2 July publication (July –Sept 13 & Jan-March 14)
Satisfaction with accessing primary care 249.16 250.94 249.16 250.94
LWSO2 Number of additional appointments delivered within extended hours (extended primary care )
To begin reporting in 2014 upon project initiation
QUALITY AND SAFETY LWSO2 12/13
% new cancer cases referred using 2 week wait pathway
47.7% 43.7% 47.7% 43.7%
LWSO2 April-September 14 Medication related safety incidents reported in primary care
228 90 228 90
LWSO2 Quarter 1 14/15 Rates of achievement for the nine care processes for Diabetes
60.9% 60.9%
LWSO2 Number of dementia assessments completed in primary care
To begin reporting in 2014 on receipt of information
after Q1
PATIENT EXPERIENCE LWSO2 July 14 publication
(July –Sept 13 & Jan-March 14)
Satisfaction with the quality of consultation at the GP practice
625.16 632.31 625.16 632.31
LWSO2 July 14 publication (July –Sept 13 & Jan-March 14)
Satisfaction with the overall care received at the surgery
165.17 168.79 165.17 168.79
RESOURCE UTILISATION LWSO3 April – August 2014 GP Prescribing Budget (000,000s) 20 19.1 20 19.1
LWSO3 Productive General Practice – Modules completed
To begin reporting in 2014
PRIMARY CARE DASHBOARD
Page 18
ACCESS Primary Care Development Steering group. Providing extended access is voluntary for practices and therefore we are offering a tiered approach to an enhanced service so that it provides flexibility for those practices that are keen to explore extended access : Level 1 – Increased Capacity through Extended Hours Level 2 – Increased Capacity through Extended Access (5 days) Level 3 – Increased Capacity through Extended Access (7 days) There have been 16 applications approved to date for practices wishing to participate initially at Level 2, all start in November 2014. Applications are in progress from a further 16 practices with those not ready to implement additional capacity before Christmas considering how they may provide additional cover over the four day bank holiday. An implementation group and a monitoring and evaluation group have now been established as sub committees of the primary care steering group. CLINICAL EFFECTIVENESS, QUALITY AND SAFETY Cancer: For the period shown 43.7% of cancers in Leeds West CCG were identified as having been referred via a 2 week wait pathway (National Cancer Intelligence Network). This indicator is also monitored at practice level as part of the Primary Care Assurance Framework. A similar indicator is also available which provides more up to date information 14/15 Q1 – Percentage of new cancers cases treating that were not 2 week waits. This gives a % for Leeds West CCG OF 51.3% compared to the England value of 51%. This is an increase on the previous figure. Cancer data continues to be provided in the Practice MOT. The Locality Team will work closely with NHS England and GP practices through the Primary Care Assurance Framework to address any areas of improvement.

PRIMARY CARE DASHBOARD
Page 19
Medication related safety incidents reported in primary care: The Medicines Optimisation Scheme was released to practices in August 2014; it is through this scheme that practices are required to increase their recording of medication related safety incidences. We expect to now see a steady increase in reporting towards the trajectory over the next few months, September figures were at their highest to date this year. There are still a number of practices who have yet to report an incident and the primary care and medicines management team will continue to review and support practices throughout the year including sharing learning as part of the Practice Manager forums. Training sessions are available from November 14 for practices to attend. In addition the governance team is establishing the process for uploading patient safety incidents that are reported on Datix onto NRLS (National Reporting and Learning System). PATIENT EXPERIENCE Satisfaction with the quality of consultation of the GP practice The score is obtained from outputs of a range of questions and reflects a composite of scores from “The combined percentage of patients who answered positively to questions such as:
Last time you saw or spoke to a GP/nurse from your GP surgery, how good was that GP at giving you enough time?
Last time you saw or spoke to a GP from your GP surgery, how good was that GP/Nurse at Listening to you?
Last time you saw or spoke to a GP/Nurse from your GP surgery, how good was that GP at Explaining tests and treatment?
Last time you saw or spoke to a GP/Nurse from your GP surgery, how good was that GP at involving you in decisions about your care?
How good was that GP/nurse at treating you with care and concern? Excluding those who answered doesn’t apply.
Did you have confidence and trust in the GP/Nurse you saw or spoke to?
How confident are you that you can manage your own health? Satisfaction overall care received at the surgery The score is obtained from outputs of a range of questions and reflects a composite of scores from the combined percentage of patients who answered positively to the following questions: The % of patients who gave a positive answer to ‘Overall how would you describe your experience of your GP surgery?’ The % of patients who gave a positive answer to ‘Would you recommend your GP surgery to someone who has just moved to your local area?’

PRIMARY CARE DASHBOARD
Page 20
Satisfaction overall care received at the surgery The score is obtained from outputs of a range of questions and reflects a composite of scores from the combined percentage of patients who answered positively to the following questions: The % of patients who gave a positive answer to ‘Overall how would you describe your experience of your GP surgery?’ The % of patients who gave a positive answer to ‘Would you recommend your GP surgery to someone who has just moved to your local area?’ Overall, indicators measured through the National GP Patient Survey show a decline on the previous results which is reflected both at CCG and national level. Although satisfaction appears to have decreased, for Leeds West CCG results are higher than the England average (marked as plan). . Recommendations The CCG is piloting the Year of Care approach in 3 West practices facilitates personalised care planning and shared decision making by patients and healthcare professionals working in partnership. Leeds West CCG will continue to promote the Leeds Let’s Change Making Every Contact Count Training programme to increase the effectiveness of conversations with patients and professionals particularly with regard to lifestyle behaviour change. Work on access will commence soon to understand demand and capacity in all practices. The Friend and Family test will be implemented from December 2014 which will provide a more regular update on patient reported satisfaction – if implemented effectively it will provide a wider sample than that of the GP patient survey. RESOURCES GP Prescribing is on track to make savings as compared to budget. Please note this is GP prescribing only. Wave 2 of Productive General Practice commenced on 9th September rolling the programme out to those participating in the South West locality. This brings the total number of practices actively participating in the programme to 18. Wave 1 has completed 3 group sessions and Wave 2 has now completed 2, practices are in process of reviewing their data.

COMMUNITY SERVICES DASHBOARD
Page 21
Strategic Objective
latest data ACCESS
Latest YTD Trend
Proj FYE
Plan Act Plan
Act
LWSO2 Sept 18 week RTT - % non-admitted 95% 100% 95% 100%
LWSO2 TBC 18 week RTT - % non-admitted – Adult IAPT Service by Q4
95% 95.6% 95% N/A
LWSO2 Oct IAPT – Number entering service (LCH) 1378 866 7986 6512
LWSO2 Sept IAPT - Completion as moving to recovery (LCH) 331 196 1587 1353
On request Numbers referred to single point of access (SPOA)
On request % referrals accepted by SPOA
QUALITY AND SAFETY LWSO2 Sept MRSA 0 0 0 1
LWSO2 Sept C. Diff 0 0 0 0
LWSO1 Sept Looked After Children – Health Needs Assessed in 20 working days
95% 100% 95% 100%
LWSO2 Q1 Child Protection Supervision 85% 95.8% 85% 95.8%
LWSO2 Sept Dementia Screening – Community Matrons 90% 90.3% 90% 92.4%
LWSO2 Sept Dementia Screening – eligible Inpatients 90% 90% 90% 96.9%
LWSO2 Oct Patient Safety Thermometer: Harm free care 93.87% 91.53% N/A N/A
LWSO2 Oct Pressure Ulcers - new 1.03% 2.54% N/A N/A
LWSO2 Oct VTE – new 0.44% 0% N/A N/A
LWSO2 Oct Falls with harm 0.63% 0.51% N/A N/A
LWSO2 Oct Catheter and new UTIs 0.36% 0.25% N/A N/A
LWSO2 Sept Serious Incidents 0 6 N/A 34
LWSO2 Sept Never Events(LCH) 0 0 N/A 0
PATIENT EXPERIENCE LWSO2 Sept Patient Complaints 20 114
LWSO2 Sept Complaints Closed in agreed timeframe 100% 88% 100% 98%
LWSO2 Sept End of Life Care – Preferred Place of Death 90% 94.2% 90% 87.3%
RESOURCE UTILISATIONLWSO3 Sept LCH Sickness and Absence Rates 4.3% 4.6% 4.3% 4.9% LWSO3 Sept LCH Annualized Turnover Rate (%) 7-12 12% 7-12 11% WS03 Sept LCH Financial Position FOT (Surplus) N/A N/A 1,400 1400 LWSO3 Sept CIP Savings 541 341 3244 3078

COMMUNITY SERVICES DASHBOARD
Page 22
Summary of Service reviews
CAMHS The review of the CAMHS service and requirements for leeds continues. Leeds West CCG are attending the review meetings. CONTINUING CARE The service continues to be address the backlog (legacy cases) in leeds of historic continuing care assessments. There is one block contract with Allied health care to deliver continuing care which will be supplemented by up to 15 other local providers as required. There are over 1000 patients on the continuing care caseload with a current backlog of appeals to process of 381. Staff have being recruited to support the appeals team of nurses and are expected in post in December 2014. COMMUNITY BEDS REVIEW, a review of all community sited beds in Leeds has commenced, it aims to assess the requirement in Leeds for short term beds, admission reasons, and demographic info on the use of the beds, occupancy levels, funding, costs, and admission reasons. The Strategy is to have a stratified bed base with improved and clearer pathways. COMMUNITY REHABILITATION. A review of all elements of community rehabilitation has commenced, this will cover, use of beds at St Marys Hospital, workforce, pathways, the 7 neurological rehabilitation beds at CRU, the use of the community and stroke rehabilitation community teams, out patients, day hospital services, early supported discharge. MSK Service review completed, and reported due in Dec 2014 Maternity strategy- stakeholder engagement continues at citywide events. Patient Safety: NHS Safety Thermometer data used in this report is taken from a monthly point prevalence survey; thresholds for each indicator are therefore based on the England average rather than a monthly or annual objective. Trend arrows are used to show improvement/decline from the previous month. Pressure ulcers: Pressure ulcers continue to be high priority for targeted work. The numbers of new pressure ulcers remains static but there has been an increase in the numbers acquired in other care settings prior to coming in to LCH. have been agreed and are currently being monitored internally. A whole system workshop was held to produce an agreed set of actions across the health economy that detail how all partners will prioritise this programme of work.
Serious incidents: 6 serious incidents were reported in September totaling 33 in 2014/15 to date. 23 of these relate to category 3 or 4 pressure ulcers. Other categories were slips, trips or falls, absconded patient, MRSA bacteraemia and prisoner in receipt of care.

COMMUNITY SERVICES DASHBOARD
Page 23
CQUIN: LCH remain compliant with all indicators. CQUINS for this year are :
1. Friends and family test 2. NHS Safety thermometer (patient harm indicator) 3. Dementia screening and diagnosis using risk assessment tool, to be increased to cover community beds 4. Best start - children with complex needs, pathway development 5. Integrated neighbourhood teams and MDT working 6. Joint review of discharge incidents between LCH and LTHT
IAPT There continues to be a focus on the delivery of IAPT services. There is a focus on group sessions, and telephone contacts, which benefit some patients groups. IAPT will also be delivered from the Leeds Student Medical Practice. Additional IAPT workers are planned. IAPT: Number of People Entering Treatment: The number of patients that have entered the IAPT service remains below target; the number that have completed and moved to recovery is also below target. The Specialist Business Unit is overseeing delivery of the recovery plan and all actions are being tracked on a weekly basis by the Trust and formally on a monthly basis through the Performance Framework meetings. There is a requirement to submit a two year IAPT trajectory in CCG plans to meet 15% by March 2015. The current proposal is to meet 13.6% in 14/15 and 15% by 15/16. IAPT: Number of people entering recovery: The IAPT services nationally are expected to hit 50% of patients treated entering recovery by 2015. Leeds is achieving this standard. The following actions are being taken to support continued delivery of this standard:
Taking on additional staff (funding has been increased) to offer more appointment slots.
Development of more group work i.e. stress seminars
Purchase of new services such
Review of patient choice options PATIENT EXPERIENCE Nine services are using the revised LCH Patient Satisfaction Survey (PSS) which contains the same question regarding overall satisfaction with service. The FFT is currently being introduced to Leeds Community Health Care and is expected to be in place by

COMMUNITY SERVICES DASHBOARD
Page 24
December. COMPLAINTS: The percentage of complaints closed within an agreed timeframe was 88% - below the threshold of 100%. The current complaints investigation and response process is under review and an action plan is being produced to improve complaints handling within the organisation. Further work will be undertaken with the Business Units to support the strengthening of the process.
RESOURCES
LCH expects to achieve a surplus target of £1.4 m for 2014/15.
CIP delivery year to date is 5% behind planned, due to the non-delivery of part of the vacancy factor savings due to the overspending on pay. The biggest risk to be the achievement of the surplus continues to be the delivery of the £8.0m cost savings. LSECCG have commenced CIP meetings with LCH.
MENTAL HEALTH DASHBOARD
Page 25
Strategic Objective
Latest data ACCESS
Latest YTD Trend Proj FYE
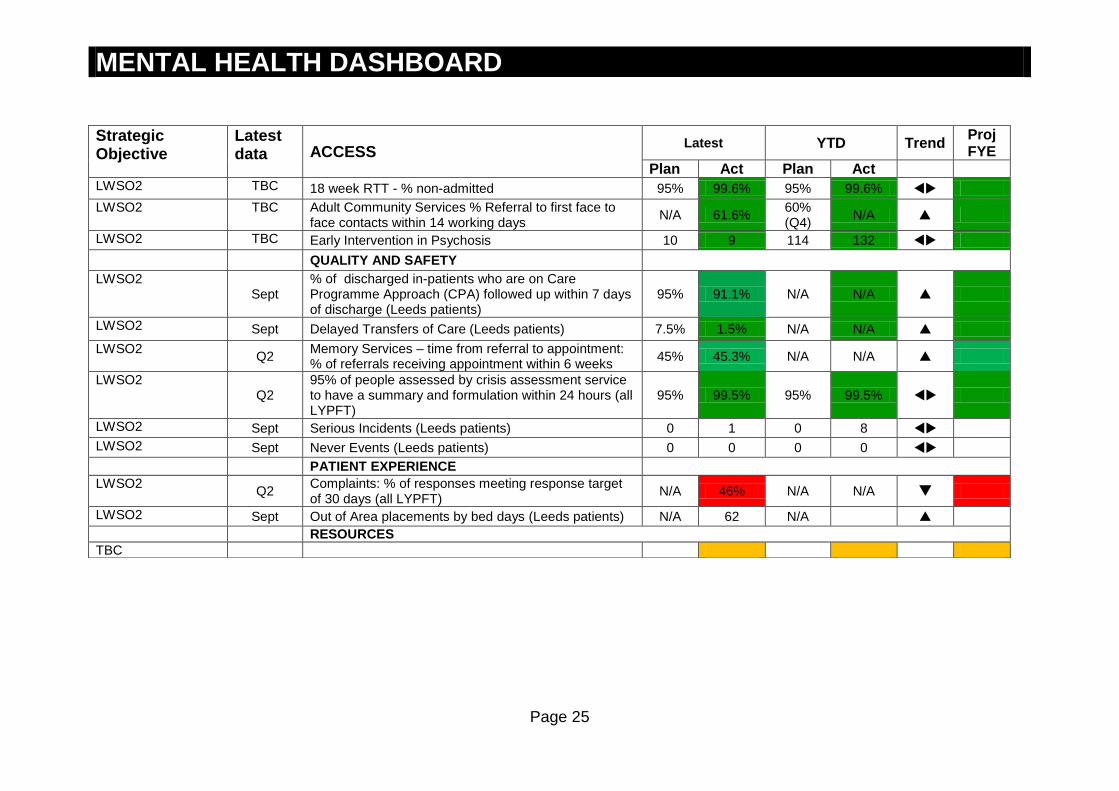
Plan Act Plan Act LWSO2 TBC 18 week RTT - % non-admitted 95% 99.6% 95% 99.6%
LWSO2 TBC Adult Community Services % Referral to first face to face contacts within 14 working days
N/A 61.6% 60% (Q4)
N/A
LWSO2 TBC Early Intervention in Psychosis 10 9 114 132
QUALITY AND SAFETY
LWSO2 Sept
% of discharged in-patients who are on Care Programme Approach (CPA) followed up within 7 days of discharge (Leeds patients)
95% 91.1% N/A N/A
LWSO2 Sept Delayed Transfers of Care (Leeds patients) 7.5% 1.5% N/A N/A
LWSO2 Q2
Memory Services – time from referral to appointment: % of referrals receiving appointment within 6 weeks
45% 45.3% N/A N/A
LWSO2 Q2
95% of people assessed by crisis assessment service to have a summary and formulation within 24 hours (all LYPFT)
95% 99.5% 95% 99.5%
LWSO2 Sept Serious Incidents (Leeds patients) 0 1 0 8
LWSO2 Sept Never Events (Leeds patients) 0 0 0 0
PATIENT EXPERIENCE
LWSO2 Q2
Complaints: % of responses meeting response target of 30 days (all LYPFT)
N/A 46% N/A N/A
LWSO2 Sept Out of Area placements by bed days (Leeds patients) N/A 62 N/A
RESOURCES
TBC
MENTAL HEALTH DASHBOARD
Page 26
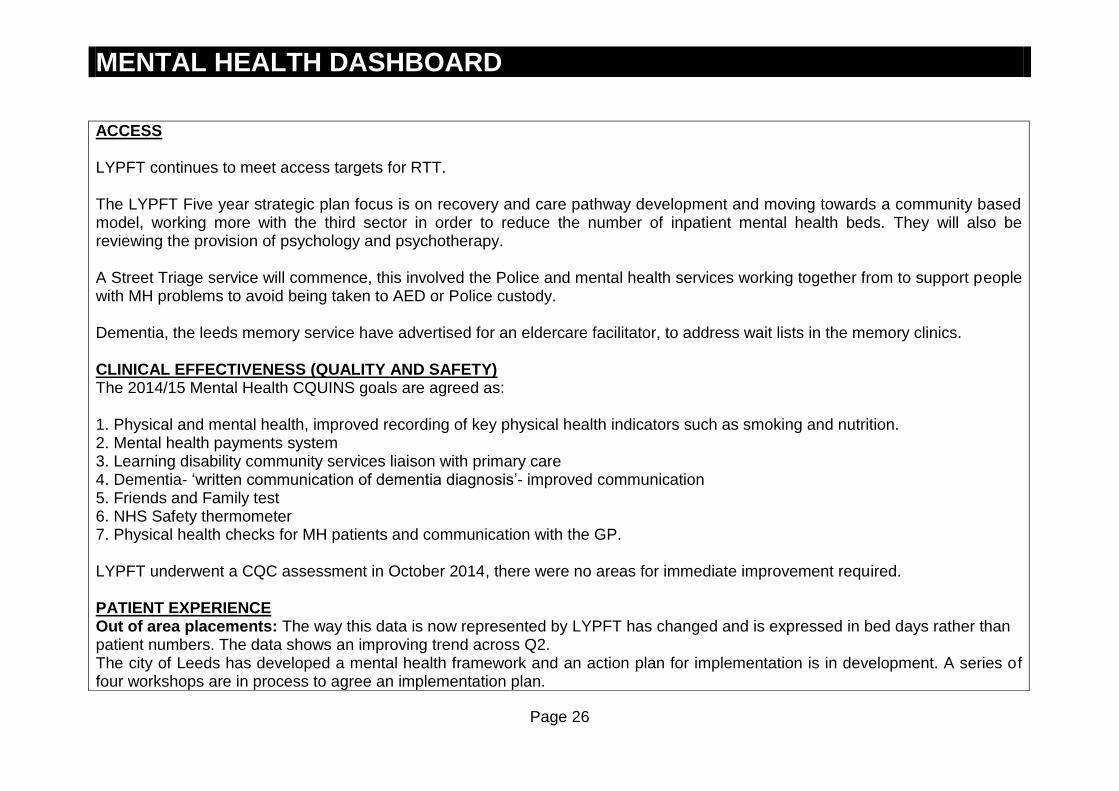
ACCESS LYPFT continues to meet access targets for RTT. The LYPFT Five year strategic plan focus is on recovery and care pathway development and moving towards a community based model, working more with the third sector in order to reduce the number of inpatient mental health beds. They will also be reviewing the provision of psychology and psychotherapy. A Street Triage service will commence, this involved the Police and mental health services working together from to support people with MH problems to avoid being taken to AED or Police custody. Dementia, the leeds memory service have advertised for an eldercare facilitator, to address wait lists in the memory clinics. CLINICAL EFFECTIVENESS (QUALITY AND SAFETY) The 2014/15 Mental Health CQUINS goals are agreed as: 1. Physical and mental health, improved recording of key physical health indicators such as smoking and nutrition. 2. Mental health payments system 3. Learning disability community services liaison with primary care 4. Dementia- ‘written communication of dementia diagnosis’- improved communication 5. Friends and Family test 6. NHS Safety thermometer 7. Physical health checks for MH patients and communication with the GP. LYPFT underwent a CQC assessment in October 2014, there were no areas for immediate improvement required. PATIENT EXPERIENCE Out of area placements: The way this data is now represented by LYPFT has changed and is expressed in bed days rather than patient numbers. The data shows an improving trend across Q2. The city of Leeds has developed a mental health framework and an action plan for implementation is in development. A series of four workshops are in process to agree an implementation plan.
MENTAL HEALTH DASHBOARD
Page 27
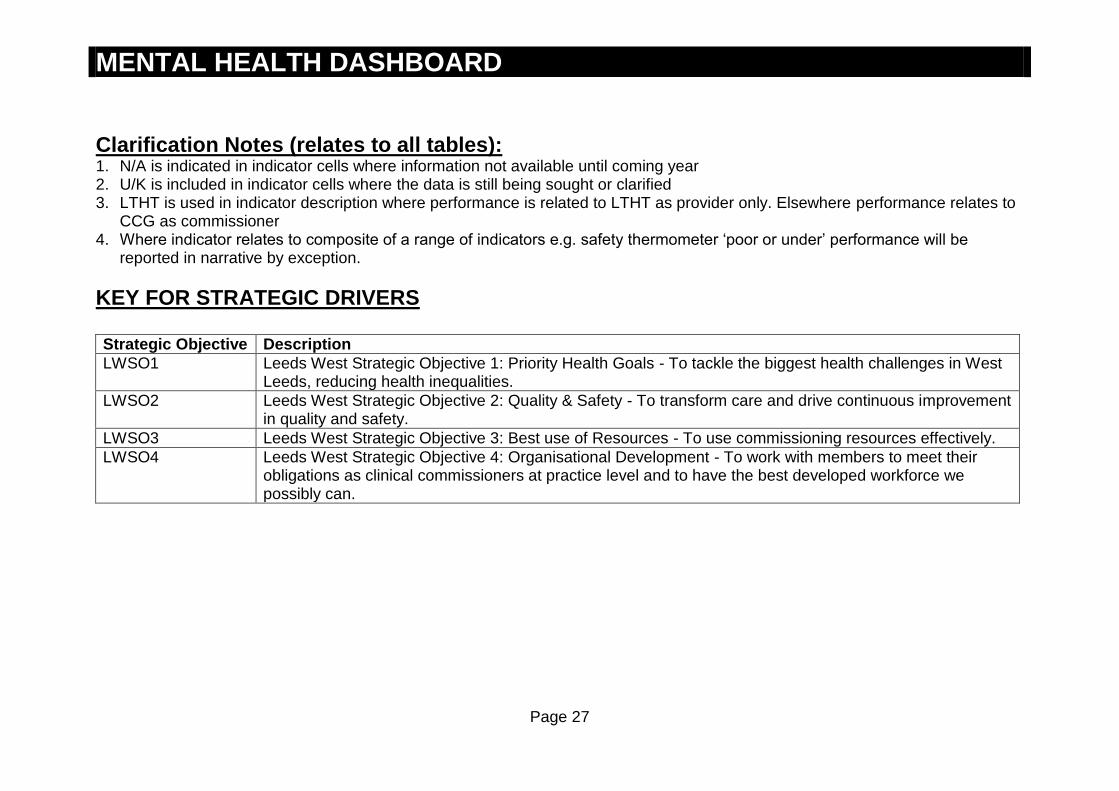
Clarification Notes (relates to all tables): 1. N/A is indicated in indicator cells where information not available until coming year 2. U/K is included in indicator cells where the data is still being sought or clarified 3. LTHT is used in indicator description where performance is related to LTHT as provider only. Elsewhere performance relates to
CCG as commissioner 4. Where indicator relates to composite of a range of indicators e.g. safety thermometer ‘poor or under’ performance will be
reported in narrative by exception.
KEY FOR STRATEGIC DRIVERS Strategic Objective Description
LWSO1 Leeds West Strategic Objective 1: Priority Health Goals - To tackle the biggest health challenges in West Leeds, reducing health inequalities.
LWSO2 Leeds West Strategic Objective 2: Quality & Safety - To transform care and drive continuous improvement in quality and safety.
LWSO3 Leeds West Strategic Objective 3: Best use of Resources - To use commissioning resources effectively.
LWSO4 Leeds West Strategic Objective 4: Organisational Development - To work with members to meet their obligations as clinical commissioners at practice level and to have the best developed workforce we possibly can.

Page 28