Embed Size (px)
Citation preview
~ Pergamon Computers ind. Engng Vol. 28, No. 4, pp. 793-81 I, 1995
Elsevier Science Ltd. Printed in Great Britain 0360-8352(95)00012-7
M O D E R N C O M P U T E R - A I D E D M A I N T E N A N C E O F
M A N U F A C T U R I N G E Q U I P M E N T A N D S Y S T E M S : R E V I E W
A N D P E R S P E C T I V E
JAY LEE National Science Foundation, 4201 Wilson Blvd, Arlington, VA 22230, U.S.A.
(Received 1 February 1995)
Abstract--This paper examines various methods in modern computer-aided maintenance including machine monitoring, fault detection and fault diagnostics. A perspective on proactive maintenance by monitoring the degradation of manufacturing equipment and systems is presented and illustrated. If the behavior of manufacturing equipment and systems can be monitored and measured adaptively then an early warning of possible faults can be generated. By doing this, maintenance personnel can perform early diagnostics and part replacement during regular maintenance hours. The paper also addresses the research needs based on the industrial perspective. The author believes that the development of in-process monitoring of machine degradation and faults is one of the most important research tasks for increasing machine uptime and improving production quality.
INTRODUCTION
A major problem confronting American manufacturers today is how to economically achieve high quality in the goods which they manufacture. There are three ways to achieve consistent high-quality parts: (1) 100% postproduction inspection; (2) in-process machine monitoring and control; (3) zero-defects (Poka-Yoki) design [1] for machines and processes. Postproduction inspection to ensure high-quality products is not economically feasible. If done manually, it takes far more labor to inspect the output of a machine than it does to operate the machine. If done automatically, it requires specialized, automated, inspection equipment which is unique to the product and which can cost far more than the production equipment itself. In both cases, the inspection may miss critical defects and in the manual case may result in excessive reject rates.
Zero-defects design (Poka-Yoki in Japanese) is a mistake-proofing technique employed by many Japanese manufacturers to eliminate the defects early in the design stage. Many Poka-Yoki ideas are developed and implemented by line operators working with engineering staff, tooling or machine specialists. The zero-defects design concept is based on human engineering to simplify the manufacturing process prior to implementing automation. The result is high quality, high morale, and greater participation of operators in improving manufacturing processes, products, and the organization as a whole. Although it sounds easy, it is very difficult to implement zero-defects based design in the U.S. due to an unsympathetic organizational culture. American manufacturers seem to be interested in retrofitting new manufacturing and processing technologies, such as intelligent sensing, automation, and intelligent control systems. The problem is that expensive machines and processes are already built and installed in existing production lines. However, it is essential to improve existing conditions if the U.S. is to be competitive in the global economy [2].
In the in-process monitoring and control approach, a process is set up to produce high-quality parts, then is monitored to determine whether the process or the machine is no longer operating correctly. Statistical process control (SPC) is a popular method for monitoring the trend of process parameters such as dimension tolerance in assembling automobile bodies. However, this technique is being used to monitor the controllable process parameters, such as flow rate, temperature, force and conveyer speed, etc. [3-7]. Currently, no proven technique has been employed to monitor the degradation of a machine and its process in order to adaptively prevent faults or failure [2, 8, 9].
793
794 Jay Lee
Importance Equipment reliability and maintenance drastically affect the three key elements of competitive-
ness~quality, cost, and production lead time. Well-maintained machines hold tolerances better, help reduce scrap and rework, and raise consistency and quality of the part. They increase uptime and yields of good parts, thereby cutting total production costs, and also can shorten lead times by reducing downtime and the need for retooling [2]. The recent rush to embrace computer-inte- grated manufacturing (CIM) has further increased the use of relatively unknown and untested technology. Much of the controller software has been written with the assumption that all equipment works properly and logically, with high reliability. In a CIM system, a fault can cause machine and production downtime and create serious productivity losses.
Typically, when a production system goes down, only a small fraction of the downtime is spent repairing the machine that causes the failure. The greatest part of downtime is spent locating the source of the problem [9]. Difficulty in identifying the causes of system failures has been attributed to several factors, including system complexity and lack of adequate troubleshooting tools [10]. An essential prerequisite for the development of an automated supervision system is a process that can detect faults early. If U.S. machine tool utilization, for example, increased from 50 to 100% (based on unlimited mean-time-between-failure), investment in equipment could be cut in half [2].
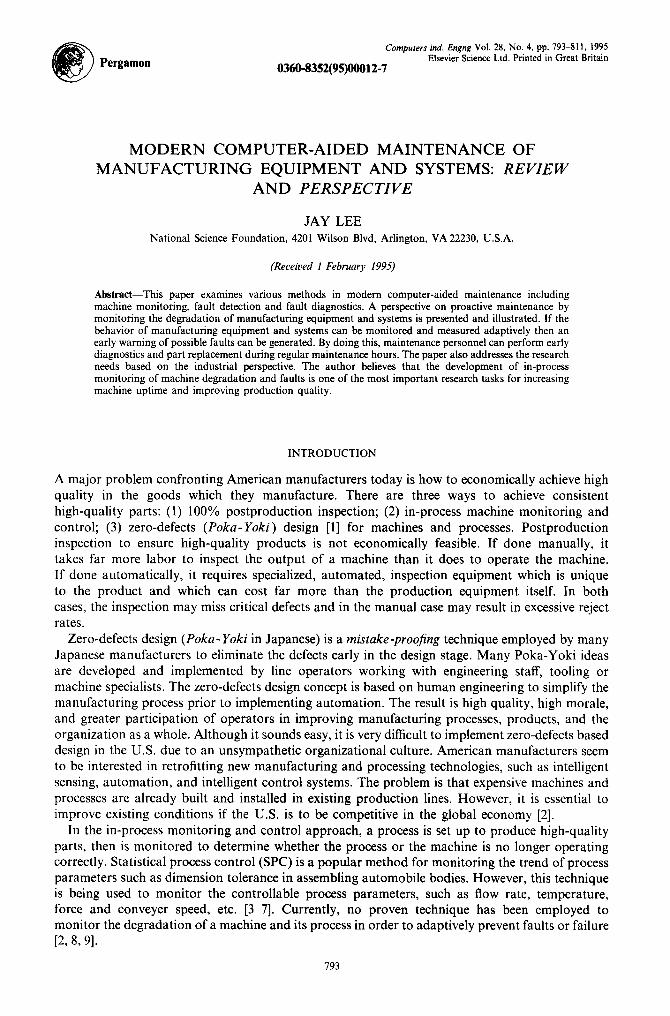
Generally speaking, the operational performance of components, machines and processes can be divided into four states: the normal operation state, the degraded state, maintenance state and the failure state [19]. Figure 1 shows these states. The degraded states can be defined at a gross level or at a detailed level. At a gross level, a component is described as degraded whenever a deterioration occurs but does not cause loss of its function. For example, component degradation occurs whenever corrective maintenance is required, such as a loose belt, a worn brush of a motor, dust on a photosensor, etc., but the components have not failed. Detailed degradation is associated with a given range of characteristics of the components, or performances of the component, such as detailed degraded states for a car battery indicator and temperature indicator, etc. The advantage of defining more detailed degradation states is that we can accurately predict impacts on the failure of the component. When aging occurs, the component and machine generally progress through a series of degradation states before failure occurs. If a degradation condition can be measured and detected, then a proactive and corrective maintenance activities can be performed before a worse degradation condition or failures occur.
A fault is defined as the inability of a system or machine to perform its expected function. A fault manifests itself as a deviation of the system or machine behavior from its specified behavior. Typically, a fault could develop during any stage of degradation. For example, a dust-covered photosensor has a slower response time, which causes an operational delay. A worn gear could introduce a position error for a positioning table or robot arm. Generally speaking, there are three
i
MAINTENANCE STATE
I-
OPERATION STATE
FAILURE STATE
HUMAN ERROR
\',,,i ¢ ./,,,,,o,,,. #
Fig. 1. Definition of machine performance states.

Modern computer-aided maintenance 795
types of faults in a manufacturing system: equipment faults, quality faults, and task faults (introduced by human errors).
Fault detection is the identification of a component or set of components in the system which caused the fault. Fault diagnosis requires collecting and processing large amounts of often incomplete data to determine the nature and severity of equipment and system malfunctions. Ideally, fault diagnosis results in an accurate, unambiguous identification of the component or components responsible for the anomalous behavior.
A maintenance state is the stage of maintenance performed either before the failure (preventive) or after the failure (reactive).
A failure state is caused by degraded components, faults, or human errors. Generally, there are two kinds of failures: (1) soft failure: a failure that can be corrected shortly after it occurs (minutes on average); and (2) hard failure: a failure that causes the machine to be down for a long period of time (hours on average).
Present practice
Today, many factories are still performing maintenance on equipment in a reactive, or breakdown, mode, since traditional process monitoring systems can detect machine or process faults only when they occur. Reactive maintenance is expensive because of extensive unplanned downtime and damage to machinery [2, 9]. In high-performance systems one often cannot tolerate significant degradation in performance during normal system operation. This had led many U.S. manufacturers to look to suppliers to smarter equipment that will ease the need for strong technical support. To avoid machine downtime, some companies have used preventive and predictive maintenance approaches by either using historical maintenance data or by sensing machine conditions. However, there are no maintenance data available for many newly developed machines or advanced manufacturing systems. Adding sensors to monitor machine conditions will also increase machine complexity and will require more highly trained personnel [11]. Therefore, some manufacturers have designed fault detection systems that take system redundancy into account, for example, a system containing several back-up systems.
REVIEW OF RESEARCH WORK
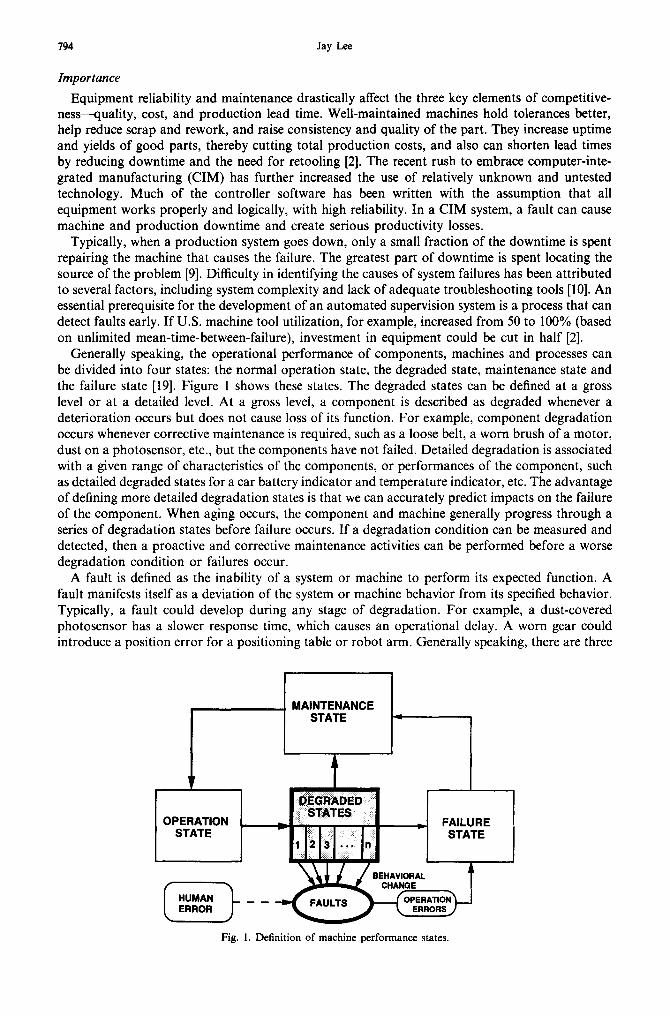
Figure 2 shows the conventional machine performance monitoring system paradigm which includes sensing, process fault detection and diagnostics. Typically, the sensing parameters are sensors, actuators, and time. For example, tool wear can be monitored by using the cutting force, accelerometer, torque, temperature, spindle motor current, acoustic emission (AE) signals and the actual cutting time.
In many manufacturing systems, on-line fault detection is often based on methods using threshold value, logic, state-table, time-window and simulation (use of process inputs to drive a simulation of acceptable system behavior in parallel with the actual system operation). The off-line fault detection and fault diagnostics are normally performed by gathering the data from the sensors and the symptoms from the system, then the problem is diagnosed through signature analysis. Today, neural networks and expert systems are the two most popular approaches in fault diagnostics. The following sections summarize the related research work in monitoring, fault detection and fault diagnostics.
Methods For Detecting Faults
The conventional fault detection methods are: (1) modelling and parameter estimation; and (2) discrete observation. The following subsections discuss these methods.
Modelling and parameter estimation approach
Measurable input signals and output signals can be directly used to monitor changes in a process. The limit and trend checking technique is the most straightforward method in fault detection. The limits are set such that a large enough distance to the appearance of damage is retained. The limit check can also be applied on the trend of the signal. To predict the signal, mathematical models
796 Jay Lee
PROCESS
PROCESS TYPE:
* DISCRETE • CONTINUOUS
H S E N S I N G
PARAMETERS:
• SENSORS • ACTUATORS • TIME
OBSERVED SYMPTOMS (OFF-LINE)
MONITORING (ON-LINE)
t FAULT I _ IFAULT DETECTION I - ~ DIAGNOSTICS
I I
FAULT DIAGNOSTICS DETECTION METHOOS: METHODS: (BASED ON SIGNATURE
1. CONTINUOUS PROCESS ANALYSIS)
* PARAMETER * EXPERT SYSTEM ESTIMATION METHOD * NEURAL NETWORK
2. DISCRETE PROCESS
* THRESHOLD * LOGIC ° STATE-TABLE * TIME WINDOW * SIMULATION
CHANGE OPERA 'ON STRATEGY
STOP OPERATION AND REPAIR
FAULT MANAGEMENT
Fig. 2. The conventional fault monitoring, detection and diagnostic process.
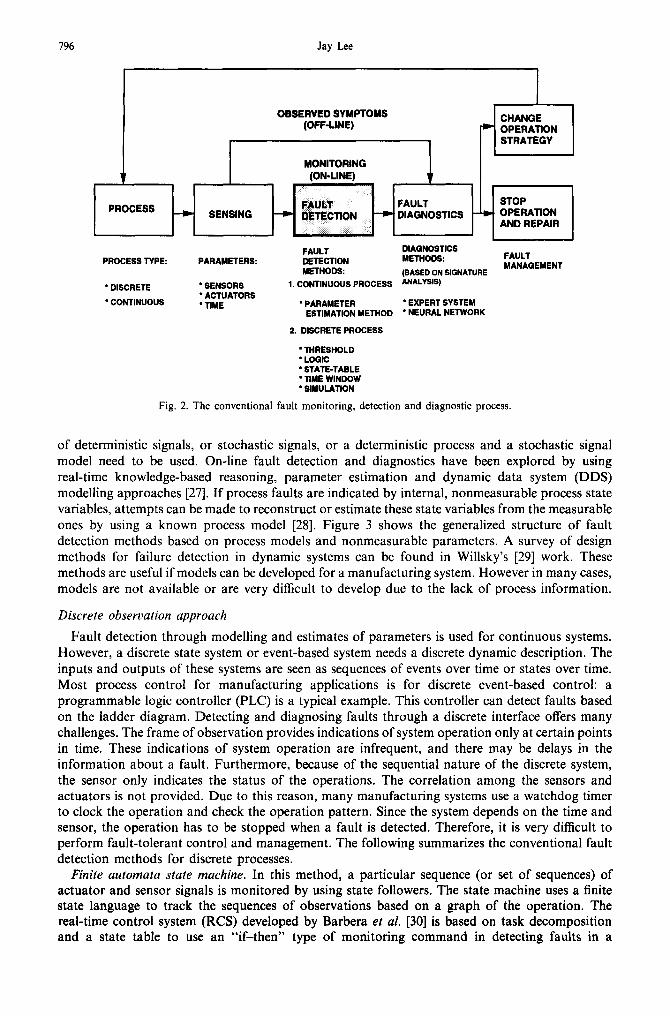
of deterministic signals, or stochastic signals, or a deterministic process and a stochastic signal model need to be used. On-line fault detection and diagnostics have been explored by using real-time knowledge-based reasoning, parameter estimation and dynamic data system (DDS) modelling approaches [27]. If process faults are indicated by internal, nonmeasurable process state variables, attempts can be made to reconstruct or estimate these state variables from the measurable ones by using a known process model [28]. Figure 3 shows the generalized structure of fault detection methods based on process models and nonmeasurable parameters. A survey of design methods for failure detection in dynamic systems can be found in Willsky's [29] work. These methods are useful if models can be developed for a manufacturing system. However in many cases, models are not available or are very difficult to develop due to the lack of process information.
Discrete observation approach
Fault detection through modelling and estimates of parameters is used for continuous systems. However, a discrete state system or event-based system needs a discrete dynamic description. The inputs and outputs of these systems are seen as sequences of events over time or states over time. Most process control for manufacturing applications is for discrete event-based control: a programmable logic controller (PLC) is a typical example. This controller can detect faults based on the ladder diagram. Detecting and diagnosing faults through a discrete interface offers many challenges. The frame of observation provides indications of system operation only at certain points in time. These indications of system operation are infrequent, and there may be delays in the information about a fault. Furthermore, because of the sequential nature of the discrete system, the sensor only indicates the status of the operations. The correlation among the sensors and actuators is not provided. Due to this reason, many manufacturing systems use a watchdog timer to clock the operation and check the operation pattern. Since the system depends on the time and sensor, the operation has to be stopped when a fault is detected. Therefore, it is very difficult to perform fault-tolerant control and management. The following summarizes the conventional fault detection methods for discrete processes.
Finite automata state machine. In this method, a particular sequence (or set of sequences) of actuator and sensor signals is monitored by using state followers. The state machine uses a finite state language to track the sequences of observations based on a graph of the operation. The real-time control system (RCS) developed by Barbera et al. [30] is based on task decomposition and a state table to use an "if-then" type of monitoring command in detecting faults in a
Modem computer-aided maintenance 797
MACHINE OR PROCESS
NORMAL PROCESS MODEL
PROCESS OBSERVATION
FAULT PROCESS MODEL
STATE ~ ) ( PARAMETER ESTIMATION, .ESTIMATION
FAULT DETECTION
GENERATION OF CHANGES AND ERROR SIGNALS
FAULT DECISION
FAULT SIGNATURE
FAULT TIME
FAULT [ CAUSE LOCATION / ( FAULT SIZE / FAULT
FAULT DIAGNOSTICS
Fig. 3. Generalized structure of fault detection methods based on the process model.
manufacturing system. The premise of this approach is that you need a complete understanding of all situations in a process is needed and each condition has to be listed as an "if and then" statement in a state table.
PLC-based logic diagram. Most flexible manufacturing systems use PLC because it is user- friendly. However, for a sophisticated manufacturing system, the PLC has a limited capability because of the inflexibility of the programming system. Recently, many PLC manufacturers, such as GE Fanuc and Siemens have developed a sequential function chart (SFC) to assist the operator in diagnostics [31]. An SFC describes a machine's sequential cycle with the steps and conditions necessary for the transition from one step to the next. Because of its graphical nature, an SFC is much easier to read than a program listing, so that production personnel unskilled in reading PLC programs may well be able to identify machine or process faults. A binary fault file is written to the display when a step timer expires or under certain conditions; each fault bit writes a different device name or short message on the screen. A PLC-based diagnostics system developed for Cummins Engine Co. Ltd. to detect faults in a manufacturing cells is discussed by Bititci and Ross [32]. The detection system was implemented on a PLC in parallel to the system controller, rather than within it. PLC approach is limited since it can only detect fault when it occurs, it is impossible to measure the degradation of a device such as a sensor, to provide the operator with a warning signal.
Simulation. A simulation approach to fault detection uses process inputs to drive a simulation of acceptable system behavior in parallel with the actual system operation. Many researchers have
798 Jay Lee
used simulation models, such as a Petri net model [33]. The model represents the processes of the system and acts as a state observer which listens to interprocess messages and sensors in the manufacturing process. Sequencing is incorporated in the structure of the Petri nets and timing is incorporated by setting upper and lower limits on firing times of each transition. Detection is accomplished by simulating the model along with the system. Barbera [34] at Advanced Technology & Research Corp. (Laurel, MD) has developed an integrated control, design, and simulation tool set for an automated material handling system for mail processing. This tool is based on real-time control system (RCS) methodology. The timing, operation sequence, I/O status and control action are coded at each operation state under a hierarchical programming structure. The work was developed on a Silicon Graphics IRIS workstation and has been demonstrated with many automation applications. This approach is very effective if the simulation model can be continu- ously updated and enhanced since manufacturing environment and conditions change frequently. A robust simulation model should be able to learn and modify itself adaptively. In many cases, the threshold values of fault detection algorithm also have to be re-calibrated from time to time due to the variation of the manufacturing process.
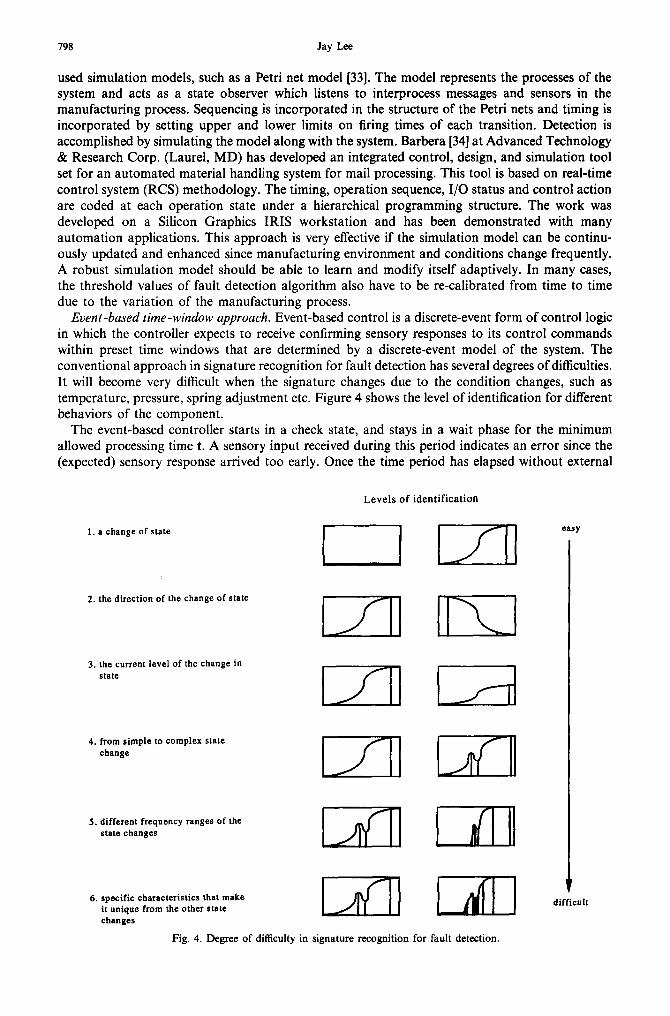
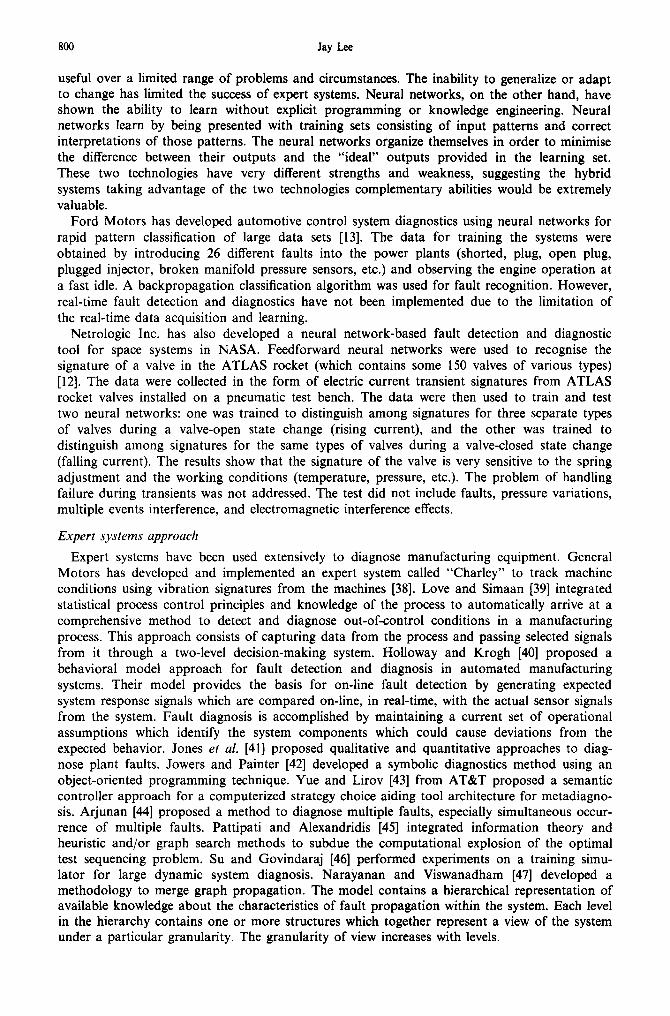
Event-based time-window approach. Event-based control is a discrete-event form of control logic in which the controller expects to receive confirming sensory responses to its control commands within preset time windows that are determined by a discrete-event model of the system. The conventional approach in signature recognition for fault detection has several degrees of difficulties. It will become very difficult when the signature changes due to the condition changes, such as temperature, pressure, spring adjustment etc. Figure 4 shows the level of identification for different behaviors of the component.
The event-based controller starts in a check state, and stays in a wait phase for the minimum allowed processing time t. A sensory input received during this period indicates an error since the (expected) sensory response arrived too early. Once the time period has elapsed without external
Levels of identification
1. achan,oofsta e easy I I
2. the direction of the change of state
3. the current level of the change in state
l J l
4. from simple to complex state change
it unique from the other state changes
Fig. 4. Degree of difficulty in signature recognition for fault detection.
diff cult
Modern computer-aided maintenance 799
interruption the model changes to a window phase, and stays in this phase for a duration specified by the time window. A sensory input is expected to arrive during the period. If the input is received and it tests valid, the appropriate next control command is issued. The check state is updated, and the model changes back to a wait state for another appropriate duration. If the test fails an error is reported. Finally, if the window period has elapsed without receiving the expected sensory input, another error will be processed. The event-based controller moves through its check states in concert with the received inputs, as long as all input signals arrive within their expected time windows. In comparison with the conventional sampled-data logic, event-based controllers demand less precision from their sensors. These sensors can have threshold-like characteristics. The burden of the precision is placed on the time windows rather than on the sensors.
Event-based controllers are less sensitive to the received sensory input, and they can therefore be made more robust. In the sampled-data control paradigm, sensors must be able to measure the actual analog value of the sensed signal, and report it back to the controller. At the sampling time t, the sensed signal S should be larger than S(min) but smaller than S(max). The controller will thus compare the actual measured value of the sensed signal S with the two thresholds S(min) and S(max). The threshold values may be functions of time. In the event-based control paradigm, a simple threshold sensor is used which records when the sensed signal crosses the threshold in either direction. The actual time t of the threshold crossing is then compared with the time window limits t(min) and t(max) which are fixed values than can be predetermined.
Another important advantage of event-based control is that the error messages that are issued by the controller contain information that can be directly used for diagnostic purposes. With the event-based control paradigm, the control process can be readily interfaced with rule-based symbolic reasoning logic in an advanced intelligent automation environment.
Methods for Diagnosing Faults
Most of the fault diagnostics research work is based on signature analysis of the process of component. To diagnose a fault from these recorded, sampled and analyzed data, expert systems and neural networks are the two most popular approaches to searching for the faults. The research using these approaches is surveyed and summarized below.
Neural networks approach
Automated fault detection and a diagnostic systems based on neural networks have been implemented for jet and rocket engines by Dietz et al. [35]. In this approach, fault diagnosis is performed by mapping or associating patterns of input data to patterns representing fault conditions. The expert system, called the integrated expert system (IES), employs neural networks to analyze patterns of engine behavior, and create a set of hypotheses regarding anomalies of engine behavior. The hypotheses generated by the neural network model are then given to the knowledge-based inference model to perform reasoning on the basis of engine design knowledge, heuristic knowledge and fault and repair history.
Greenwood and Stevenson from Netrologic, Inc. [36] have estimated tool wear using neural networks. Uhrig and Guo [37] have used the backpropagation neural network to identify transient operating conditions in nuclear power plants. Franklin et al. [14] from GTE have used the ADALINE and the NADALINE, a one-layer neural network, to monitor fluorescent bulb manufacturing. Two approaches are being compared by Franklin et al. in their research. One employs standard statistical procedures to find correlations between sensor measurement and quality. The sensor data from the production line are collected over a period of time and correlations are made off-line at frequent intervals using analysis, such as linear regression. The second approach is to estimate the correlations incrementally, as the data are collected on-line and in real time. The estimates are updated incrementally using connectionist learning procedures.
HNC, Inc. (San Diego, CA) introduced a product called KnowledgeNet, which is an integrated expert system and neural network approach which eliminate the "black box" approach to neural network applications by providing explanations of network results. Neural networks often complement expert systems. In practice, the best domain expert cannot think of every potential problem, especially as circumstances change over time. For this reason, expert systems are typically
800 Jay Lee
useful over a limited range of problems and circumstances. The inability to generalize or adapt to change has limited the success of expert systems. Neural networks, on the other hand, have shown the ability to learn without explicit programming or knowledge engineering. Neural networks learn by being presented with training sets consisting of input patterns and correct interpretations of those patterns. The neural networks organize themselves in order to minimise the difference between their outputs and the "ideal" outputs provided in the learning set. These two technologies have very different strengths and weakness, suggesting the hybrid systems taking advantage of the two technologies complementary abilities would be extremely valuable.
Ford Motors has developed automotive control system diagnostics using neural networks for rapid pattern classification of large data sets [13]. The data for training the systems were obtained by introducing 26 different faults into the power plants (shorted, plug, open plug, plugged injector, broken manifold pressure sensors, etc.) and observing the engine operation at a fast idle. A backpropagation classification algorithm was used for fault recognition. However, real-time fault detection and diagnostics have not been implemented due to the limitation of the real-time data acquisition and learning.
Netrologic Inc. has also developed a neural network-based fault detection and diagnostic tool for space systems in NASA. Feedforward neural networks were used to recognise the signature of a valve in the ATLAS rocket (which contains some 150 valves of various types) [12]. The data were collected in the form of electric current transient signatures from ATLAS rocket valves installed on a pneumatic test bench. The data were then used to train and test two neural networks: one was trained to distinguish among signatures for three separate types of valves during a valve-open state change (rising current), and the other was trained to distinguish among signatures for the same types of valves during a valve-closed state change (falling current). The results show that the signature of the valve is very sensitive to the spring adjustment and the working conditions (temperature, pressure, etc.). The problem of handling failure during transients was not addressed. The test did not include faults, pressure variations, multiple events interference, and electromagnetic interference effectsl
Expert systems approach
Expert systems have been used extensively to diagnose manufacturing equipment. General Motors has developed and implemented an expert system called "Charley" to track machine conditions using vibration signatures from the machines [38]. Love and Simaan [39] integrated statistical process control principles and knowledge of the process to automatically arrive at a comprehensive method to detect and diagnose out-of-control conditions in a manufacturing process. This approach consists of capturing data from the process and passing selected signals from it through a two-level decision-making system. Holloway and Krogh [40] proposed a behavioral model approach for fault detection and diagnosis in automated manufacturing systems. Their model provides the basis for on-line fault detection by generating expected system response signals which are compared on-line, in real-time, with the actual sensor signals from the system. Fault diagnosis is accomplished by maintaining a current set of operational assumptions which identify the system components which could cause deviations from the expected behavior. Jones et al. [41] proposed qualitative and quantitative approaches to diag- nose plant faults. Jowers and Painter [42] developed a symbolic diagnostics method using an object-oriented programming technique. Yue and Lirov [43] from AT&T proposed a semantic controller approach for a computerized strategy choice aiding tool architecture for metadiagno- sis. Arjunan [44] proposed a method to diagnose multiple faults, especially simultaneous occur- rence of multiple faults. Pattipati and Alexandridis [45] integrated information theory and heuristic and/or graph search methods to subdue the computational explosion of the optimal test sequencing problem. Su and Govindaraj [46] performed experiments on a training simu- lator for large dynamic system diagnosis. Narayanan and Viswanadham [47] developed a methodology to merge graph propagation. The model contains a hierarchical representation of available knowledge about the characteristics of fault propagation within the system. Each level in the hierarchy contains one or more structures which together represent a view of the system under a particular granularity. The granularity of view increases with levels.
Modern computer-aided maintenance 801
For a complex decision-making environment, Jacob and Pirkul [48] proposed a network of knowledge-based systems. Ishida et al. [49] proposed a topological approach based on graph theory for large-scale system diagnosis. Pazzani [50] illustrated an approach to failure-driven learning. When a failure occurs, the diagnostic system uses the learning approach to identify which information from the device models should be incorporated into new rules. There are several popular diagnostics reasoning strategies. Structured reasoning is the simplest approach; decisions are based solely on go/no go information and can be very efficient [51]. Qualitative reasoning uses domain-specific criteria to translate the numerical data into an initial qualitative description [52]. Deep model reasoning is used to run a model of the equipment being diagnosed under various fault assumptions [53, 54]. Fink and Lush [55] have illustrated how to couple deep models with experimental knowledge.
In general, much research has been done in the area of fault diagnostics and fault detection. Little research has been done in the area of in-process machine degradation monitoring for manufactur- ing systems. Some related research work in machine or system degradation and its impact to proactive maintenance are reviewed and summarized as follows.
PERSPECTIVE ON PROACTIVE MAINTENANCE THROUGH DEGRADATION MONITORING--A NEW THINKING PARADIGM
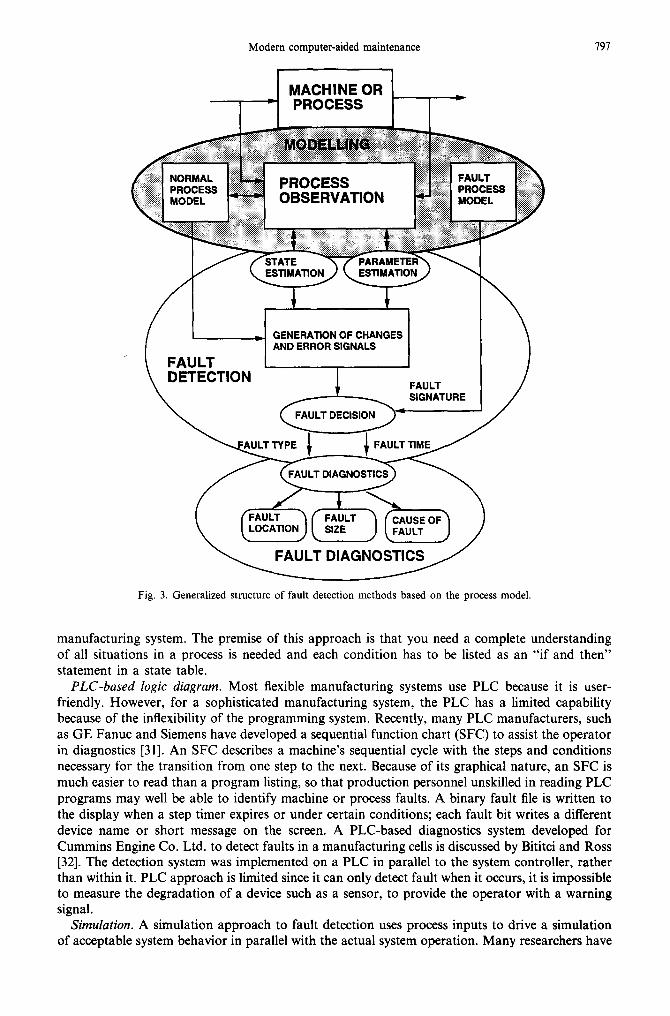
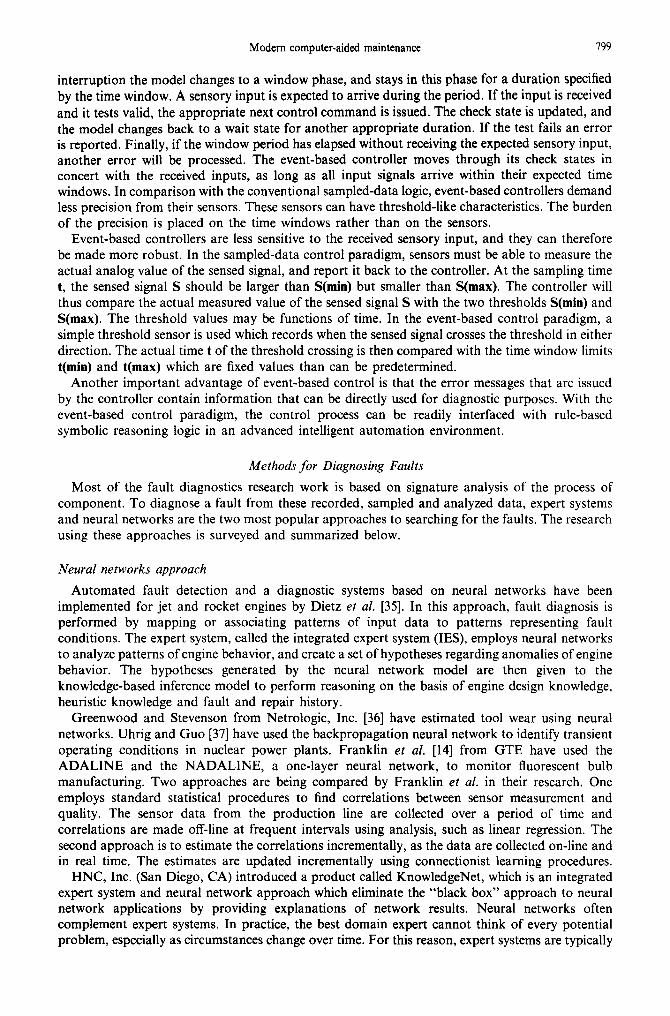
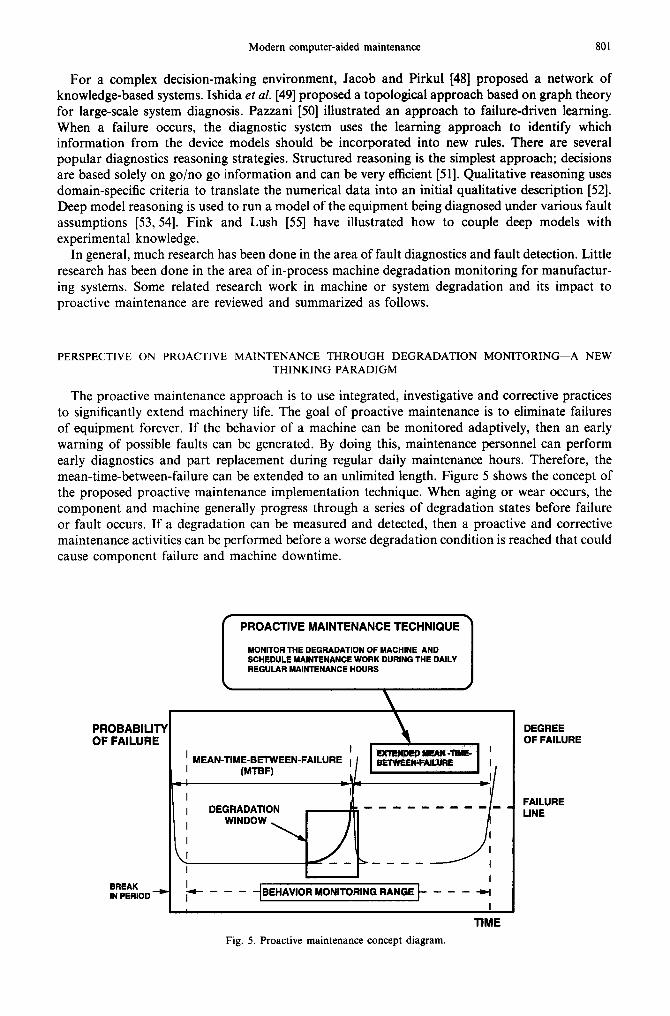
The proactive maintenance approach is to use integrated, investigative and corrective practices to significantly extend machinery life. The goal of proactive maintenance is to eliminate failures of equipment forever. If the behavior of a machine can be monitored adaptively, then an early warning of possible faults can be generated. By doing this, maintenance personnel can perform early diagnostics and part replacement during regular daily maintenance hours. Therefore, the mean-time-between-failure can be extended to an unlimited length. Figure 5 shows the concept of the proposed proactive maintenance implementation technique. When aging or wear occurs, the component and machine generally progress through a series of degradation states before failure or fault occurs. If a degradation can be measured and detected, then a proactive and corrective maintenance activities can be performed before a worse degradation condition is reached that could cause component failure and machine downtime.
PROBABILITY OF FAILURE
BREAK IN PERIOD - ' ~
I PROACTIVE MAINTENANCE TECHNIQUE 1 MONITOR THE DEGRADATION OF MACHINE AND SCHEDULE MAINTENANCE WORK DURING THE DAILY REGULAR MAINTENANCE HOURS
MEAN-TIME-.E EEN-FAILURE I/ I I I (MTBF) IlL I . . . . I i!
- i I D.~-. ~/ I ~ ~ I DEGRADATION I . . . . . . . l I w,,°ow.... / f
_ ', I I I "~ " t B E H A V I O R M O N I T O R I N G R A N G E t . . . . - ~ I I , I
Fig. 5. Proactive maintenance concept diagram.
TIME
DEGREE OF FAILURE
FAILURE LINE
802 Jay Lee
Methods for monitoring degradation Degradation is defined as a decreased performance level when a parameter is measured over
in a specific deviation. Typically, a component can go through a series of degradation states before it fails. There are two types of components in a machine--active components (e.g. motors, sensors and valves), and passive components (e.g. structures and bearings). Subudhi and Taylor [20] at Brookhaven National Laboratory tested electric motors to monitor age-related degradation in nuclear power plants. The plug reverse cycle test method was used to induce accelerated aging in the motor subcomponents. The motor winding temperature, running current, and bearing temperature were continuously monitored. Test results showed that winding temperature is a good indicator for monitoring degradation of insulation. A high bearing temperature or vibration excursion is a clear indication of bearing wear, misalignment or their aging mechanisms.
Hoopingarner and Burns [21] at Pacific Northwest Laboratory studied in ways to monitor aging of diesel generators in nuclear plants. Haynes [22-24] at Oak Ridge National Laboratory has also conducted degradation research on motor-operated valves. His work monitored the valve stem position (using LVDT), springback displacement, actuator output torque, motor current and time of actuation of all control switches. The research led to the conclusion that the single most informative measurement parameter was also the one most easily acquired: the motor current.
Samanta et al. [25] at Brookhaven National Laboratory developed a degradation model using a Markov approach to analyze historic component degradation rates and failure rate data for nuclear power plants. This research showed that degradation can be modeled to identify aging effects. Analysis of their research shows that besides data on components failure, significant information exists on component degraded conditions, including times at which such degraded conditions are observed, and also values of observed parameters that indicate degradation. Often, a component reliability record contains much more information on degradation than failure. The concept behind Samanta's work was to use degradation data from the past maintenance record to develop component reliability characteristics and to understand aging effects. This research treated degradation as a discrete rather than a continuous process.
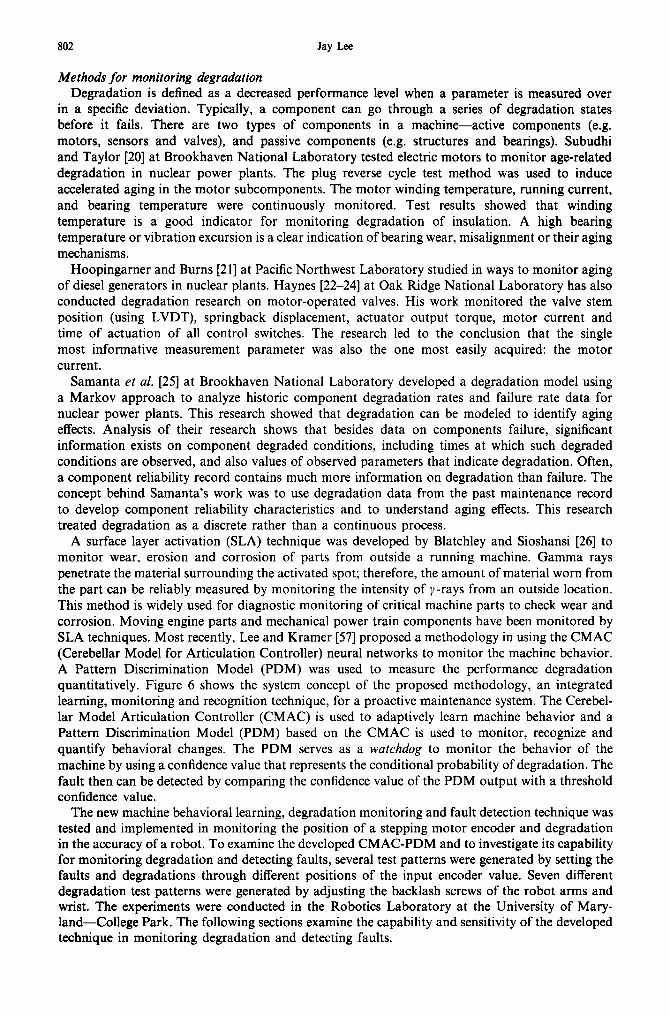
A surface layer activation (SLA) technique was developed by Blatchley and Sioshansi [26] to monitor wear, erosion and corrosion of parts from outside a running machine. Gamma rays penetrate the material surrounding the activated spot; therefore, the amount of material worn from the part can be reliably measured by monitoring the intensity of ~-rays from an outside location. This method is widely used for diagnostic monitoring of critical machine parts to check wear and corrosion. Moving engine parts and mechanical power train components have been monitored by SLA techniques. Most recently, Lee and Kramer [57] proposed a methodology in using the CMAC (Cerebellar Model for Articulation Controller) neural networks to monitor the machine behavior. A Pattern Discrimination Model (PDM) was used to measure the performance degradation quantitatively. Figure 6 shows the system concept of the proposed methodology, an integrated learning, monitoring and recognition technique, for a proactive maintenance system. The Cerebel- lar Model Articulation Controller (CMAC) is used to adaptively learn machine behavior and a Pattern Discrimination Model (PDM) based on the CMAC is used to monitor, recognize and quantify behavioral changes. The PDM serves as a watchdog to monitor the behavior of the machine by using a confidence value that represents the conditional probability of degradation. The fault then can be detected by comparing the confidence value of the PDM output with a threshold confidence value.
The new machine behavioral learning, degradation monitoring and fault detection technique was tested and implemented in monitoring the position of a stepping motor encoder and degradation in the accuracy of a robot. To examine the developed CMAC-PDM and to investigate its capability for monitoring degradation and detecting faults, several test patterns were generated by setting the faults and degradations through different positions of the input encoder value. Seven different degradation test patterns were generated by adjusting the backlash screws of the robot arms and wrist. The experiments were conducted in the Robotics Laboratory at the University of Mary- land--College Park. The following sections examine the capability and sensitivity of the developed technique in monitoring degradation and detecting faults.
Modern computer-aided maintenance 803
Event-Based I Time t Process t Control
~ Sensors
\ s2Sl ~- • ~ • Acquisition ( Machine ~ \ •
[ or = | A1 • Learning
Actuators Cerebellar Modal
Articulation Controller (CMAC)
|ehav!oml Pattern • Recognition
• Monitoring
i P Pattern Dl=crlm!naUon M ~ I (PDM)
Degree of ] Degradation
Fault Detection
TABLE LOOK-UP NEURAL NETWORKS
Fig. 6. System concept of machine degradation monitoring and fault detection using neural networks approach.
EXPERIMENT I--ENCODER POSITION MONITORING AND FAULT DETECTION
The encoder is one of the key elements in a motion control system to provide position feedback for motor or positioning tables. For high-precision motion control systems, such as chip inspection and electronics assembly, the assurance of encoder feedback is critical. Tests were conducted to investigate the feasibility of monitoring degradation and faults by using the developed technique.
Experiment setup
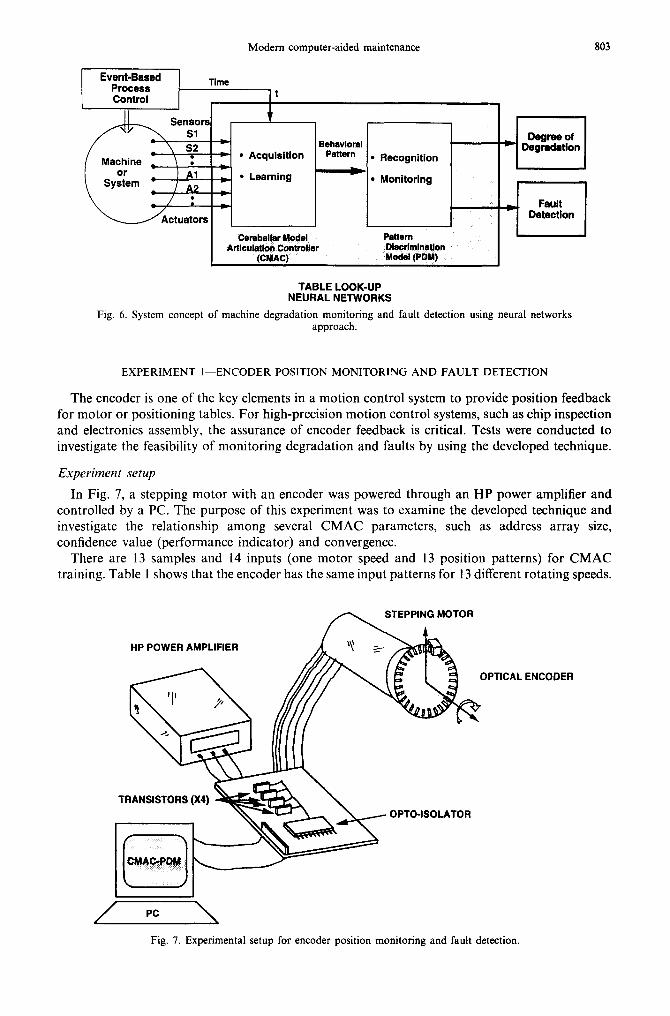
In Fig. 7, a stepping motor with an encoder was powered through an HP power amplifier and controlled by a PC. The purpose of this experiment was to examine the developed technique and investigate the relationship among several CMAC parameters, such as address array size, confidence value (performance indicator) and convergence.
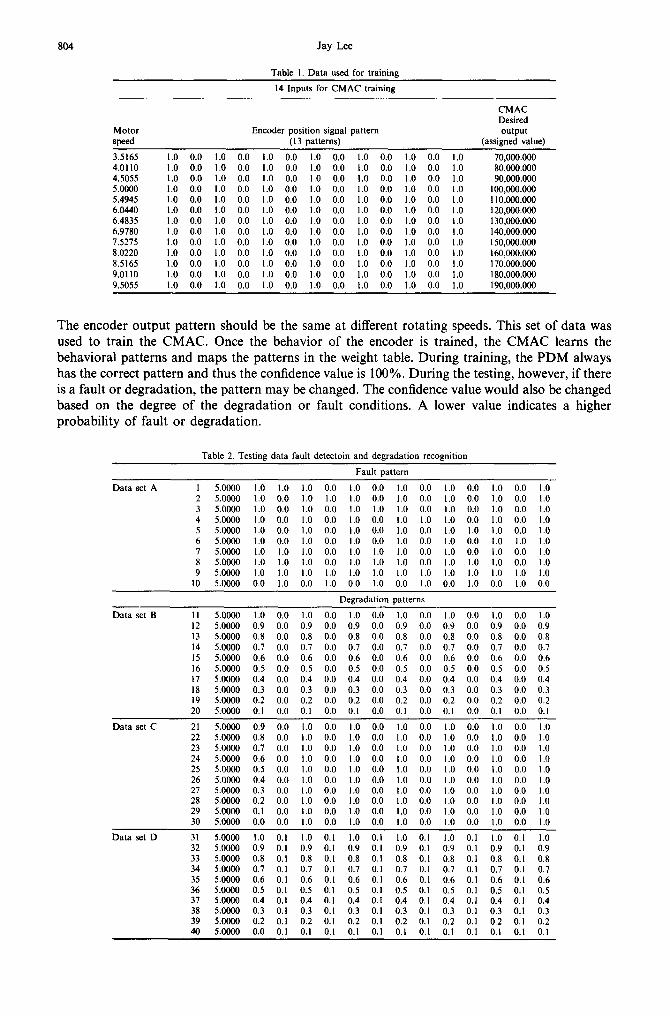
There are 13 samples and 14 inputs (one motor speed and 13 position patterns) for CMAC training. Table 1 shows that the encoder has the same input patterns for 13 different rotating speeds.
//••PPI%G:OTO R
HP POWER AMPLIFIER //~./~, '~ ~
PTICAL ENCODER
TRANSISTORS (X4) - . k ~ ¢ ~ i ~ OPTO-ISOLATOR
/ Pc \
Fig. 7. Experimental setup for encoder position monitoring and fault detection.
804 Jay Lee
Table I. Data used for training
14 Inputs for CMAC training
CMAC Desired
Motor Encoder position signal pattern output speed (13 patterns) (assigned value)
3.5165 1,0 0.0 1.0 0.0 1.0 0.0 1.0 0.0 1.0 0.0 1.0 0.0 1.0 70,000.000 4,0110 1.0 0.0 1.0 0.0 1.0 0.0 1.0 0.0 1.0 0.0 1.0 0.0 1.0 80,000.000 4,5055 1,0 0.0 1.0 0.0 1.0 0.0 1.0 0.0 1.0 0.0 1.0 0.0 1.0 90,000,000 5,0000 1.0 0.0 1.0 0.0 1.0 0.0 1.0 0.0 1.0 0.0 1.0 0.0 1.0 100,000.000 5.4945 1.0 0.0 1.0 0.0 1.0 0.0 1.0 0.0 1.0 0.0 1.0 0.0 1.0 I10,000.000 6,0440 1,0 0.0 1.0 0.0 1.0 0.0 1.0 0.0 1.0 0.0 1.0 0.0 1.0 120,000.000 6,4835 1,0 0.0 1.0 0.0 1.0 0.0 1.0 0.0 1.0 0.0 1.0 0.0 1.0 130,000.000 6.9780 1,0 0.0 1.0 0.0 1.0 0.0 1.0 0.0 1.0 0.0 1.0 0.0 1.0 140,000.000 7.5275 1,0 0.0 1.0 0.0 1.0 0.0 1.0 0.0 1.0 0.0 1.0 0.0 1.0 150,000.000 8.0220 1.0 0.0 1.0 0.0 1.0 0.0 1.0 0.0 1.0 0.0 1.0 0.0 1.0 160,000,000 8.5165 1.0 0.0 1.0 0.0 1.0 0.0 1.0 0.0 1.0 0.0 1.0 0.0 1.0 170,000.000 9.0110 1,0 0.0 1.0 0.0 1.0 0.0 1.0 0.0 1.0 0.0 1.0 0.0 1.0 180,000.000 9.5055 1,0 0.0 1.0 0.0 1.0 0.0 1.0 0.0 1.0 0.0 1.0 0.0 1.0 190,000.000
The encoder output pattern should be the same at different rotating speeds. This set of data was used to train the CMAC. Once the behavior of the encoder is trained, the CMAC learns the behavioral patterns and maps the patterns in the weight table. During training, the PDM always has the correct pattern and thus the confidence value is 100%. During the testing, however, if there is a fault or degradation, the pattern may be changed. The confidence value would also be changed based on the degree of the degradation or fault conditions. A lower value indicates a higher probability of fault or degradation.
Table 2. Testing data fault detectoin and degradation recognition
Fault pattern
Data set A 1 5.0000 1.0 1.0 1.0 0.0 1.0 0.0 1.0 0.0 1.0 0.0 1.0 0.0 1.0 2 5.0000 1.0 0.0 1.0 1.0 1.0 0.0 1.0 0.0 1.0 0.0 1.0 0.0 1.0 3 5.0000 1.0 0.0 1.0 0.0 1.0 1.0 1.0 0.0 1.0 0.0 1.0 0.0 1.0 4 5.0000 1.0 0.0 1.0 0.0 1.0 0.0 1.0 1.0 1.0 0.0 1.0 0.0 1.0 5 5.0000 1.0 0.0 1.0 0.0 1.0 0.0 1.0 0.0 1.0 1.0 1.0 0.0 1.0 6 5.0000 1.0 0.0 1.0 0.0 1.0 0.0 1.0 0.0 1.0 0.0 1.0 1.0 1.0 7 5.0000 1.0 1.0 1.0 0.0 1.0 1.0 1.0 0.0 1.0 0.0 1.0 0.0 1.0 8 5.0000 1.0 1.0 1.0 0.0 1.0 1.0 1.0 0.0 1.0 1.0 1.0 0.0 1.0 9 5.0000 1.0 1.0 1.0 1.0 1.0 1.0 1.0 1.0 1.0 1.0 1.0 1.0 1.0
10 5.0000 0.0 1.0 0.0 1.0 0.0 1.0 0.0 1.0 0.0 1.0 0.0 1.0 0.0
Degradation patterns
Data set B II 5.0000 1.0 0.0 1.0 0.0 1.0 0.0 1.0 0.0 1.0 0.0 1.0 0.0 1.0 12 5.0000 0.9 0.0 0.9 0.0 0.9 0.0 0.9 0.0 0.9 0.0 0.9 0.0 0.9 13 5.0000 0.8 0.0 0.8 0.0 0.8 0.0 0.8 0.0 0.8 0.0 0.8 0.0 0.8 14 5.0000 0.7 0.0 0.7 0.0 0.7 0.0 0.7 0.0 0.7 0.0 0.7 0.0 0.7 15 5.0000 0.6 0.0 0.6 0.0 0.6 0.0 0.6 0.0 0.6 0.0 0.6 0.0 0.6 16 5.0000 0.5 0.0 0.5 0.0 0.5 0.0 0.5 0.0 0.5 0.0 0.5 0.0 0.5 17 5.0000 0.4 0.0 0.4 0.0 0.4 0.0 0.4 0.0 0.4 0.0 0.4 0.0 0.4 18 5.0000 0.3 0.0 0.3 0.0 0.3 0.0 0.3 0.0 0.3 0.0 0.3 0.0 0.3 19 5.0000 0.2 0.0 0.2 0.0 0.2 0.0 0.2 0.0 0.2 0.0 0.2 0.0 0.2 20 5.0000 0.1 0.0 0.1 0.0 0.1 0.0 0.1 0.0 0.1 0.0 0. I 0.0 0.1
Data set C 21 5.0000 0.9 0.0 1.0 0.0 1.0 0.0 1.0 0.0 1.0 0.0 1.0 0.0 1.0 22 5.0000 0.8 0.0 1.0 0.0 1.0 0.0 1.0 0.0 1.0 0.0 1.0 0.0 1.0 23 5.0000 0.7 0.0 1.0 0,0 1.0 0.0 1.0 0.0 1.0 0.0 1.0 0.0 1.0 24 5.0000 0.6 0.0 1.0 0.0 1.0 0.0 1.0 0.0 1.0 0.0 1.0 0.0 1.0 25 5.0000 0.5 0.0 1.0 0,0 1.0 0.0 1.0 0.0 1.0 0.0 1.0 0.0 1.0 26 5.0000 0.4 0.0 1.0 0,0 1.0 0.0 1.0 0.0 1.0 0.0 1.0 0.0 1.0 27 5.0000 0.3 0.0 1.0 0.0 1.0 0.0 1.0 0.0 1.0 0.0 1.0 0.0 1.0 28 5.0000 0.2 0.0 1.0 0,0 1.0 0.0 1.0 0.0 1.0 0.0 1.0 0.0 1.0 29 5.0000 0.1 0.0 1.0 0,0 1.0 0.0 1.0 0.0 1.0 0.0 1.0 0.0 1.0 30 5.0000 0.0 0.0 1.0 0.0 1.0 0.0 1.0 0.0 1.0 0.0 1.0 0.0 1.0
Data set D 31 5.0000 1.0 0.1 1,0 0,1 1.0 0.1 1.0 0.1 1.0 0.1 1.0 0.1 1.0 32 5.0000 0.9 0.1 0.9 0,1 0.9 0.1 0.9 0.1 0.9 0.1 0.9 0.1 0.9 33 5,0000 0.8 0.1 0.8 0,1 0.8 0.1 0.8 0.1 0,8 0.1 0.8 0.1 0.8 34 5.0000 0.7 0.1 0.7 0.1 0.7 0.1 0.7 0.1 0.7 0,1 0.7 0,1 0,7 35 5.0000 0.6 0.1 0.6 0,1 0.6 0.1 0.6 0.1 0.6 0.1 0.6 0.1 0.6 36 5.0000 0.5 0.1 0.5 0.1 0.5 0.1 0.5 0.1 0.5 0.1 0.5 0.1 0.5 37 5.0000 0.4 0.1 0.4 0.1 0.4 0. I 0.4 0.1 0.4 0.1 0.4 0.1 0.4 38 5.0000 0.3 0.1 0.3 0,1 0.3 0.1 0.3 0.1 0.3 0.1 0.3 0.1 0.3 39 5.0000 0.2 0.1 0.2 0.1 0.2 0.1 0.2 0.1 0.2 0.1 0.2 0.1 0.2 40 5.0000 0.0 0.1 0.1 0,1 0.1 0.1 0.1 0.1 0.1 0.1 0.1 0.1 0.1
Modern computer-aided maintenance
Table 3. Testing results--confidence value for different address table sizes
805
Address table size
20 30 40 50 60 70 80 90 100
Data set A I 0 36.67 55 70 68.33 78.57 77.5 82.22 84 2 5 33.33 52.5 62 68.33 72.86 75 78.89 83 3 5 33.33 50 62 73.33 71.43 78.75 77.78 83 4 5 36.67 50 64 68.33 74.29 78.75 82.22 82 5 0 36.67 55 60 68.33 74.29 78.75 78.89 81 6 5 36.67 52.5 60 71.67 75.71 75 78.89 83 7 0 40 50 62 70 75.71 76.25 80 80 8 10 36.67 57.5 60 66.67 71.43 77.5 80 83 9 0 33.33 50 62 73.33 72.86 76.25 81.11 83
10 0 36.67 50 62 68.33 75.71 77.5 77.78 81
Data set B I1 100 100 100 100 100 100 100 100 100 12 85 90 92.5 94 95 95.71 96.25 96.67 97 13 80 86.67 90 92 93.33 94.29 95 95.56 96 14 65 76.67 82.5 86 88.33 90 91.25 92.22 93 15 60 73.33 80 84 88.33 88.57 90 92.22 92 16 50 66.67 75 80 86.67 85.71 87.5 90 90 17 40 60 70 76 83.33 82.86 85 87.78 88 18 30 53.33 65 72 80 80 82.5 85.56 86 19 20 46.67 60 70 76.67 77.14 80 83.33 85 20 10 40 55 66 73.33 74.29 77.5 81.11 83
Data set C 21 85 90 92.5 94 96.67 97.14 97.5 96.67 97 22 80 86.67 90 92 95 95.71 96.25 95.56 96 23 65 76.67 82.5 86 90 91.43 92.5 92.22 93 24 60 73.33 80 84 88.33 90 91.25 91.11 92 25 50 70 77.5 80 85 87.14 88.75 88.89 90 26 40 66.67 72.5 78 81.67 84.29 86.25 87.78 88 27 30 60 67.5 76 78.33 81.43 85 85.56 86 28 20 53.33 62.5 72 75 78.57 82.5 83.33 84 29 10 46.67 57.5 70 73.33 75.71 80 81.11 83 30 0 40 52.5 66 71.67 72.86 77.5 78.89 81
Data set D 31 90 93.33 95 96 98.33 97.14 97.5 98.89 98 32 75 83.33 87.5 90 93.33 92.86 93.75 95.56 95 33 70 80 85 88 91.67 91.43 92.5 94.44 94 34 55 70 77.5 82 86.67 87.14 88.75 91.11 91 35 50 66.67 75 80 86.67 85.71 87.5 91.11 90 36 40 60 70 76 85 82.86 85 88.89 88 37 30 53.33 65 72 81.67 80 82.5 86.67 86 38 20 46.67 60 68 78.33 77.14 80 84.44 84 39 10 40 55 66 75 74.29 77.5 82.22 83 40 0 33.33 50 62 70 71.43 75 78.89 81
Test results
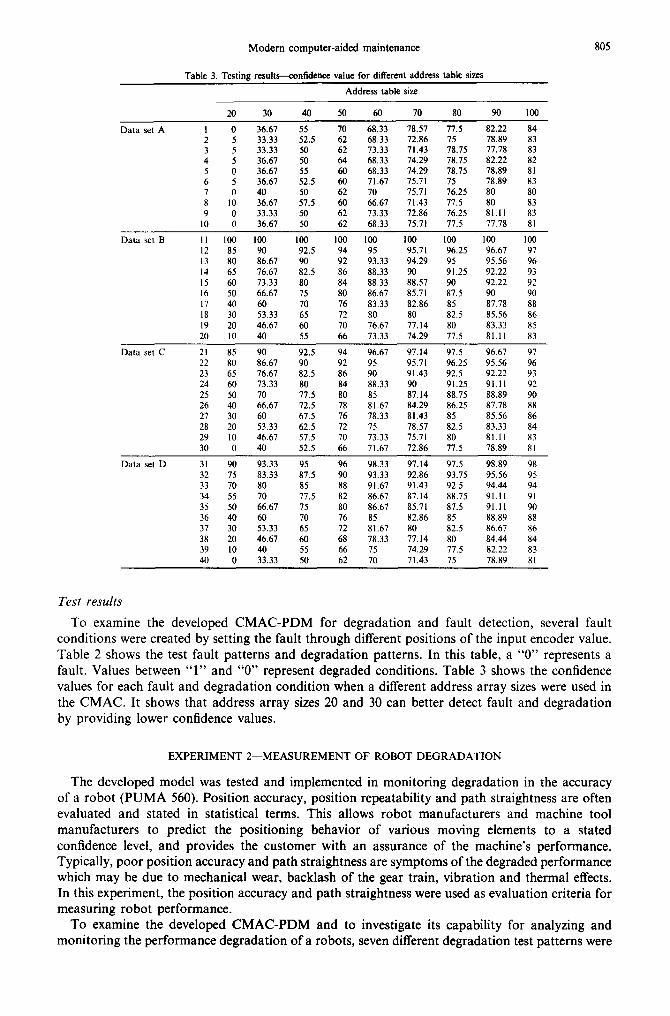
To examine the developed CMAC-PDM for degradation and fault detection, several fault conditions were created by setting the fault through different positions of the input encoder value. Table 2 shows the test fault patterns and degradation patterns. In this table, a "0" represents a fault. Values between "1" and "0" represent degraded conditions. Table 3 shows the confidence values for each fault and degradation condition when a different address array sizes were used in the CMAC. It shows that address array sizes 20 and 30 can better detect fault and degradation by providing lower confidence values.
E X P E R I M E N T 2 - - M E A S U R E M E N T O F R O B O T D E G R A D A T I O N
The developed model was tested and implemented in monitoring degradation in the accuracy of a robot (PUMA 560). Position accuracy, position repeatability and path straightness are often evaluated and stated in statistical terms. This allows robot manufacturers and machine tool manufacturers to predict the positioning behavior of various moving elements to a stated confidence level, and provides the customer with an assurance of the machine's performance. Typically, poor position accuracy and path straightness are symptoms of the degraded performance which may be due to mechanical wear, backlash of the gear train, vibration and thermal effects. In this experiment, the position accuracy and path straightness were used as evaluation criteria for measuring robot performance.
To examine the developed CMAC-PDM and to investigate its capability for analyzing and monitoring the performance degradation of a robots, seven different degradation test patterns were
806 Jay Lee
I 560 ]
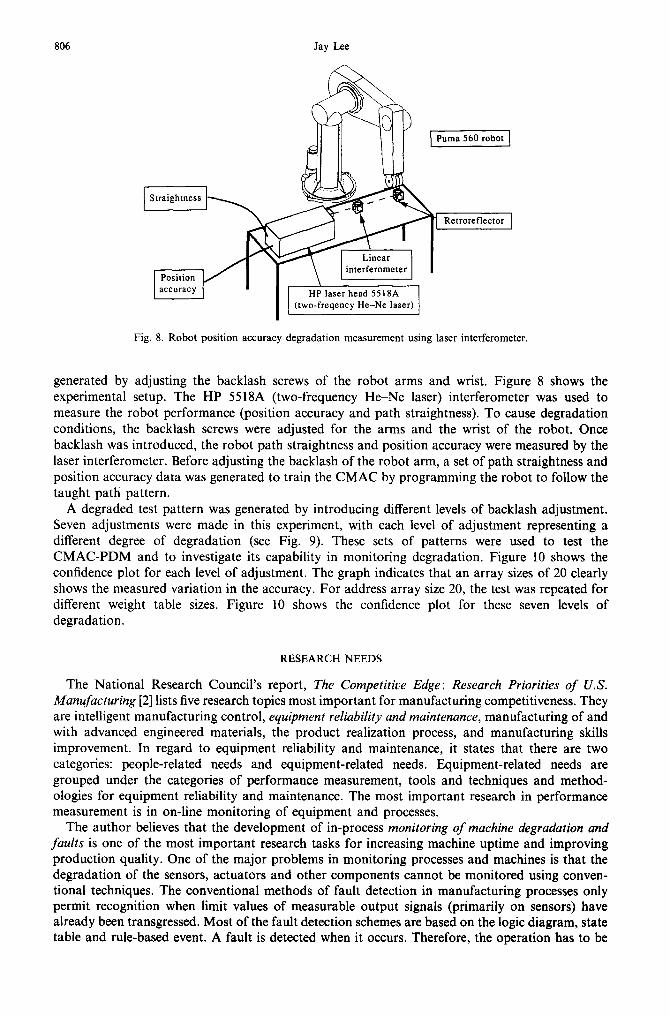
Fig. 8. Robot position accuracy degradation measurement using laser interferometer.
generated by adjusting the backlash screws of the robot arms and wrist. Figure 8 shows the experimental setup. The HP 5518A (two-frequency He-Ne laser) interferometer was used to measure the robot performance (position accuracy and path straightness). To cause degradation conditions, the backlash screws were adjusted for the arms and the wrist of the robot. Once backlash was introduced, the robot path straightness and position accuracy were measured by the laser interferometer. Before adjusting the backlash of the robot arm, a set of path straightness and position accuracy data was generated to train the CMAC by programming the robot to follow the taught path pattern.
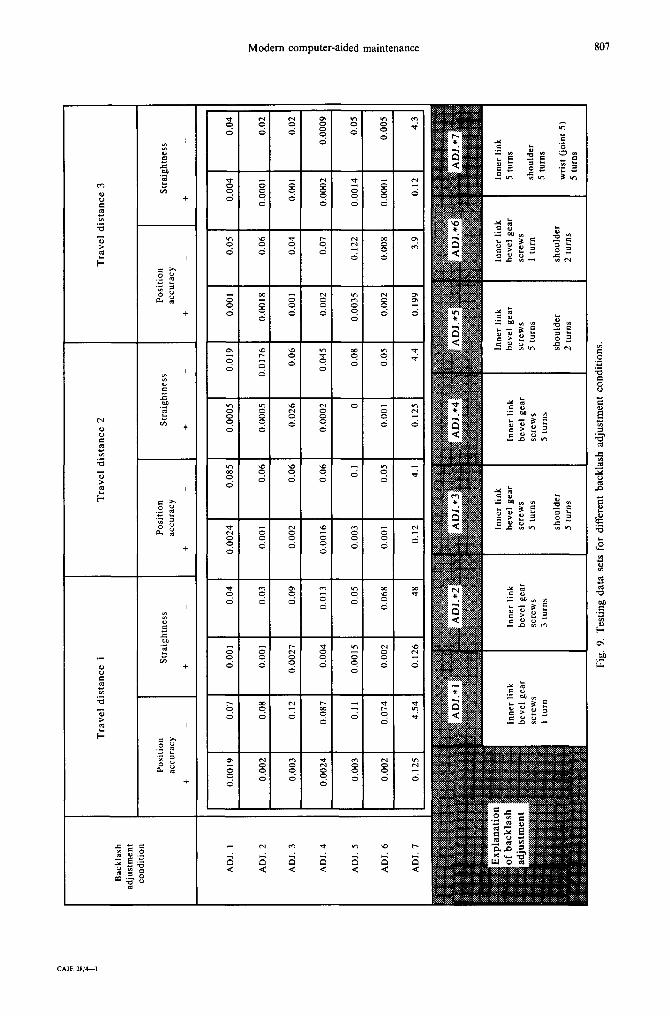
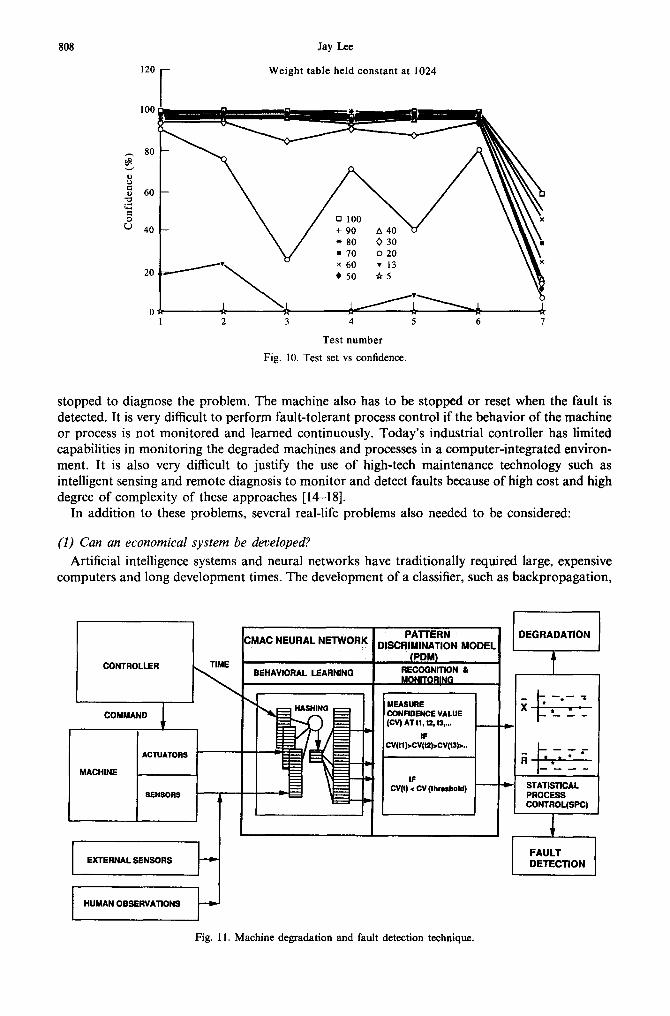
A degraded test pattern was generated by introducing different levels of backlash adjustment. Seven adjustments were made in this experiment, with each level of adjustment representing a different degree of degradation (see Fig. 9). These sets of patterns were used to test the CMAC-PDM and to investigate its capability in monitoring degradation. Figure 10 shows the confidence plot for each level of adjustment. The graph indicates that an array sizes of 20 clearly shows the measured variation in the accuracy. For address array size 20, the test was repeated for different weight table sizes. Figure 10 shows the confidence plot for these seven levels of degradation.
RESEARCH NEEDS
The National Research Council's report, The Competitive Edge: Research Priorities of U.S. Manufacturing [2] lists five research topics most important for manufacturing competitiveness. They are intelligent manufacturing control, equipment reliability and maintenance, manufacturing of and with advanced engineered materials, the product realization process, and manufacturing skills improvement. In regard to equipment reliability and maintenance, it states that there are two categories: people-related needs and equipment-related needs. Equipment-related needs are grouped under the categories of performance measurement, tools and techniques and method- ologies for equipment reliability and maintenance. The most important research in performance measurement is in on-line monitoring of equipment and processes.
The author believes that the development of in-process monitoring of machine degradation and faults is one of the most important research tasks for increasing machine uptime and improving production quality. One of the major problems in monitoring processes and machines is that the degradation of the sensors, actuators and other components cannot be monitored using conven- tional techniques. The conventional methods of fault detection in manufacturing processes only permit recognition when limit values of measurable output signals (primarily on sensors) have already been transgressed. Most of the fault detection schemes are based on the logic diagram, state table and rule-based event. A fault is detected when it occurs. Therefore, the operation has to be
Bac
kla
sh
adju
stm
ent
con
dit
ion
AD
J. 1
AD
J. 2
AD
J. 3
AD
J. 4
AD
J. 5
AD
J. 6
AD
J. 7
Tra
ve
l d
ista
nc
e
1
Po
siti
on
ac
cura
cy
Str
aig
htn
ess
+
Tra
ve
l d
ista
nc
e 2
Po
siti
on
ac
cura
cy
Str
aig
htn
ess
+
Tra
ve
l d
ista
nc
e 3
Po
siti
on
ac
cura
cy
Str
aig
htn
ess
+
0.0
01
9
0.0
02
0.00
3
0.0
02
4
0.0
87
0.0
03
0.0
02
0.1
25
0.07
0.
001
0.08
0.
001
0.1
2
0.0
02
7
0.0
04
0.11
0
.00
15
0.0
02
4.5
4
0.1
26
0.0
74
0.0
4
0.03
0.0
9
0.0
13
0.05
0.0
68
48
0.0
02
4
0.00
1
0.0
02
0.0
01
6
0.0
03
0.00
1
0.1
2
0.0
85
0.0
6
0.0
6
0.06
0.1
0.05
4.1
0.0
00
5
0.0
00
5
0.0
26
0.0
00
2
0.00
1
0.1
25
0.0
19
0.0
17
6
0.0
6
0.0
45
0.08
0.05
4.4
0.00
1
0.0
01
8
0.00
1
0.0
02
0.0
03
5
0.0
02
0.1
99
0.05
0.0
6
0.0
4
0.07
0.1
22
0.0
08
3.9
0.0
04
0.00
01
0.00
1
0.0
00
2
0.0
01
4
0.00
01
0.12
0.0
4
0.0
2
0.0
2
0.0
00
9
0.05
0.0
05
4.3
o 8 E g
Fig
. 9.
T
esti
ng
da
ta
sets
fo
r d
iffe
ren
t b
ack
lash
ad
just
me
nt
con
dit
ion
s.
808
120
100
~. 80
~ 6o
~ 40
20
Jay Lee
- Weight table held constant at 1024
v "~
2 3 4 5 6 7
Test number
Fig. 10. Test set vs confidence.
stopped to diagnose the problem. The machine also has to be stopped or reset when the fault is detected. It is very difficult to perform fault-tolerant process control if the behavior of the machine or process is not monitored and learned continuously. Today's industrial controller has limited capabilities in monitoring the degraded machines and processes in a computer-integrated environ- ment. It is also very difficult to justify the use of high-tech maintenance technology such as intelligent sensing and remote diagnosis to monitor and detect faults because of high cost and high degree of complexity of these approaches [14-18].
In addition to these problems, several real-life problems also needed to be considered:
(I) Can an economical system be developed?
Artificial intelligence systems and neural networks have traditionally required large, expensive computers and long development times. The development of a classifier, such as backpropagation,
CONTROLLER
COMMAND
ACTUATORS
MACHINE
SENSORS
EXTERNAL SENSORS
HUMAN OBSERVA~ONS
I CMAC NEURAL NETWORK
~~ EHAVIORAL LEARNING
PATTERN DISCRIMINATION MODEL
(PDM) RECOGNITION & MONITQR[N~
MEASURE CONFIDENCE VALUE [C~ AT tl, t2, ~,... i
IF .'v(tl )>cv(t2),cv(t3)>..
IF CV(I) < CV (threshold)
Fig. 11. Machine degradation and fault detection technique.
DEGRADATION
t
STATISTICAL PROCESS CONTROL(SPC)
I FAULT DETECTION
Modern computer-aided maintenance 809
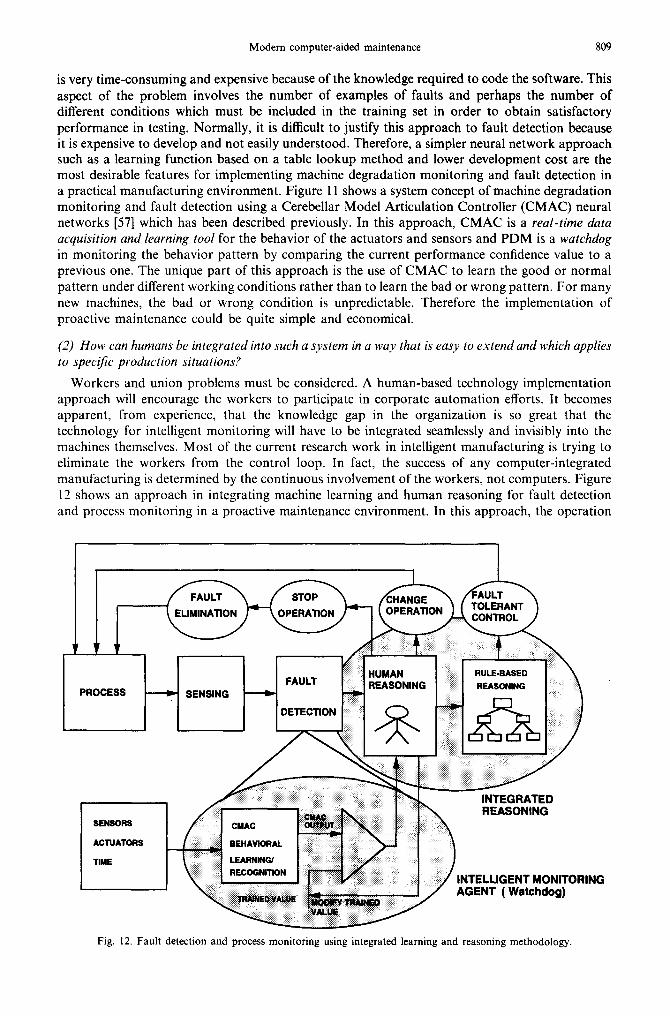
is very time-consuming and expensive because of the knowledge required to code the software. This aspect of the problem involves the number of examples of faults and perhaps the number of different conditions which must be included in the training set in order to obtain satisfactory performance in testing. Normally, it is difficult to justify this approach to fault detection because it is expensive to develop and not easily understood. Therefore, a simpler neural network approach such as a learning function based on a table lookup method and lower development cost are the most desirable features for implementing machine degradation monitoring and fault detection in a practical manufacturing environment. Figure 11 shows a system concept of machine degradation monitoring and fault detection using a Cerebellar Model Articulation Controller (CMAC) neural networks [57] which has been described previously. In this approach, CMAC is a real-time data acquisition and learning tool for the behavior of the actuators and sensors and PDM is a watchdog in monitoring the behavior pattern by comparing the current performance confidence value to a previous one. The unique part of this approach is the use of CMAC to learn the good or normal pattern under different working conditions rather than to learn the bad or wrong pattern. For many new machines, the bad or wrong condition is unpredictable. Therefore the implementation of proactive maintenance could be quite simple and economical.
(2) How can humans be integrated into such a system in a way that is easy to extend and which applies to specific production situations?
Workers and union problems must be considered. A human-based technology implementation approach will encourage the workers to participate in corporate automation efforts, It becomes apparent, from experience, that the knowledge gap in the organization is so great that the technology for intelligent monitoring will have to be integrated seamlessly and invisibly into the machines themselves. Most of the current research work in intelligent manufacturing is trying to eliminate the workers from the control loop. In fact, the success of any computer-integrated manufacturing is determined by the continuous involvement of the workers, not computers. Figure 12 shows an approach in integrating machine learning and human reasoning for fault detection and process monitoring in a proactive maintenance environment. In this approach, the operation
• FAULT "~ _ / ' STOP ELIMINATION ~ O P E R A T I O N
PROCESS ~ SENSING
SENSORS ~ CMAC ACTUATORS BEHAVIORAL
TIME LEARNING/ RECOGNITION
FAULT ~i~ii!iiiiiiiiiiiiiil
. . . . . . . . . TOLERANT CONTROL )
i _ REASONING REASONING
~i~!ilii!iiiii~ili!il
INTEGRATED REASONING
INTELLIGENT MONITORING AGENT (Watchdog)
Fig. 12. Fault detection and process monitoring using integrated learning and reasoning methodology.
810 Jay Lee
is first reasoned by a worker to determine the operatability of the machine. If an additional assistance is needed, a rule-based computer reasoning could be utilized. The author has experienced that the workers in the production line have more creativities if their value has been considered in an operation system, such as a computer-integrated manufacturing system.
(3) How can the technology be successfully applied to the wide variety of production machines found in a typical factory?
There are a variety of machines in the manufacturing factory and controller which range from relays to the latest in microprocessor technology. The technology should be implemented in a modular fashion so that the interface with machine can be integrated by using a building block approach.
SUMMARY
This paper reviewed the research work in machine performance monitoring under the traditional operation paradigm. A proactive maintenance approach is also examined to extend the operation life of machine to an unlimited length by monitoring the degradation process of the machine or manufacturing system. Finally, the research needs for machine performance monitoring was presented.
REFERENCES
1. S. Shingo. POKA-YOKI (Zero-Defects Design). Productivity Press, Cambridge, MA (1989). 2. National Research Council. The Competitiveness Edge: Research Priorities for U.S. Manufacturing. National Academy
Press (1990). 3. S. T. Scott. A three-phase model for quality. Qual. Mag. Jan, 2-4 (1991). 4. H. Park. Assessing machine performance. Am. Mach. Jan, 39-42 (1992). 5. D. Shainin and P. Shainin. OK isn't not enough. Qual. Mag. Feb, 19-22 (1990). 6. E. P. Papadakis. A computer-automated statistical process control method with timely response. J. Engng Costs
Product. Econ. 18, 301-310 (1990). 7. M. Craig. Predicting and optimizing assembly variation. Qual. Mag. Jan, 16-18 (1991). 8. Equipment Should Improve Through Use. Am. Mach. Rept, Sept, 81-100 (1991). 9. G. Mendelbaum and R. Mizuno. Directions in maintenance. Mainten. Technol. Mag. Jan, 45-48 (1992).
10. J. G. Wohl. Cognitive capability versus system complexity in electronic maintenance. IEEE Trans. Syst. Man. Cybernet. SMCI3 624-626 0983).
11. R. J. Meltzer. Sensor reliability of MTBF. Sensor Mag. Jan (1992). 12. Netrologic, Inc. Report on Space Transportation Analysis and Intelligent Space System, NASA SBIR NAS9-17995
(1990). 13. K. Marko. Automotive control system diagnostics using neural network for rapid pattern classification of large data
sets. Proc. Int. Neural Net Society Meeting, Washington, DC, pp. 13-16 (1989). 14. J. A. Franklin, R. S. Sutton and C. W. Anderson. Application of connectionist learning methods to manufacturing
process monitoring. Proc. IEEE 3rd Int. Syrup. on Intelligent Control, pp. 709-712. (1988). 15. Maintenance in the 90's--A Plan to Support the USPS Goal of Automation and Mechanization. USPS Report,
Washington, DC (1990). 16. E. F. Pardue, K. R. Piety and R. Moore. Element of reliability-based machinery maintenance. Sound Vibrat. May, 14-20
(1992). 17. J. C. Fitch. Contaminant monitoring: the overlooked predictive maintenance. Mainten. Technol. Mag. Jnn, 41-46
(1992). 18. J. Lee. Review of computer-aided predictive maintenance technology for machinery, USPS Technology Resource Dept.
Technical Report (1991). 19. Z. Kohavi. Switching and Finite Automata Theory. McGraw-Hill, New York (1978). 20. M. Subudhi and J. H. Taylor. Testing of electric motors for monitoring age related degradation. Nucl. Technol. 84,
5~61 (1989). 21. C. R. Hoopingamer and J. Burns. The Role of Monitoring Diesel Generator Aging. Pacific Northwest Lab. Report For
DOE, DE-AC06-76RLO-1830 (1992). 22. H. D. Haynes. Assessment of diagnostic method for determining degradation of motor-operated valves. Proceedings
of Aging Research Conf. (1992). 23. H. D. Haynes. Check valves: Oak Ridge's New Diagnostics. ASME Mech. Engng May, 64--69 (1991). 24. H. D. Haynes. Condition monitoring of machinery using motor current signal analysis. Sound Vibrat. Sept, 14-25
(1989). 25. P. K. Samanta, W. E. Vesely, M. Subudhi and F. Hsu. Degradation Modelling with Application to Aging and
Maintenance Effectiveness Evaluation. BNL-Nureh-52252, U.S. Nuclear Regulatory Commission Report, Washington, DC (1991).
26. C. Blatchley and P. Sioshansi. Monitoring wear with gamma rays. Mach. Des. Oct, 99-102 (1990).
Modem computer-aided maintenance 811
27. J. Lee. Adaptive control tool monitoring in machining. SME Technical Paper MR86-131, Conference Proceeding of Advanced Machining Technology for Cell and FMS, 5 (1986).
28. R. Isermann. Process fault detection based on modelling and estimation methods. Proc. Int. Federal. of Automatic Control, pp. 387-403 (1984).
29. A. S. Willsky. A survey of design method for failure detection in dynamic system. Automatica 12, 601-611 (1976). 30. A. J. Barbera, M. L. Fitzgerald and J. S. Albus. Concepts for a real time sensory interactive control system architecture.
Proc. 15th Southeastern Syrup. on System Theory, April (1982). 31. W. Fairey. A fault finding hierarchy for PLC-controlled equipment. Programmable Control Magazine, pp. 44-45 (1991). 32. U. S. Bitite and A. Ross. PLC based diagnostics system for FMS. Proc. of 7th Int. Conf. on FMS, pp. 201-211 (1988). 33. R. Valette, J. Cardeso and D. Dubois. Monitoring manufacturing by means of Petri-nets. Proc. IEEE Conf. On
Intelligent Control 0989). 34. A. J. Barbera. Computer Simulation, Design and Control Tool. Technical Notes, Advanced Technology Research Corp.
(1990). 35. W. E. Dietz, E. I. Keich and M. All. Jet and rocket engine fault diagnosis in real time. J. Neut. Network Comput. Sum,
5-19 (1989). 36. F. Stevenson and D. Greenwood. Tool Wear Estimation Using Neural Networks. Netrologic, Inc. Report, San Diego,
CA. 37. R. E. Uhrig and Z. Guo. Use of neural networks to identify transient operating conditions in nuclear plants. Proc.
SPIE, Vol. 1095, Application of Artifical Intelligence VII, pp. 851-856 (1989). 38. R. Marczewski. An expert system for machine tool diagnosis. Proc. 2nd Engng Soc. of Detroit Conf. on Expert System,
Detroit, pp. 161-172 0988). 39. P. Love and M. Simaan. A knowledge-based approach for detection and diagnosis out-of-control events in
manufacturing processes. Proc. IEEE 3rd Int. Conf. in Intelligent Control, pp. 736-741 (1989). 40. L. E. Holloway and B. H. Krogh. Fault detection and diagnosis in manufacturing system: a behavioral model approach.
Proc. the 2nd Int. Conf. on CIM, Troy, NY, pp. 252-259 (1990). 4l. A. H. Jones, B. Porter and R. N. Fripp. Qualitative and quantitative approach to the diagnosis of plant faults. Proc.
IEEE 3rd Int. Syrup. on Intelligent Control, pp. 87-92 (1989). 42. S. Jowers and J. H. Painter. Symbolic diagnosis for intelligent control. Proc. IEEE 3rd Int. Syrup. on Intelligent Control,
pp. 280-290 (1989). 43. O. Yue and Y. Lirov. Metadiagnosis. Proc. IEEE 3rd Int. Syrup. lntell., pp. 303-306 (1989). 44. M. M. Arjunan. Diagnosing multiple faults in intelligent control and automated systems. Proc. IEEE 3rd Int. Syrup.
Imell. Control, pp. 93-97 (1989). 45. K. R. Pattipati and M. Alexandrisis. Application of heuristic and information theory to sequential fault diagnosis. Proc.
IEEE 3rd Int. Syrup. On Intell. Control, pp. 291-296 (1989). 46. Y. L. Su and T. Govindaraj. Fault diagnosis in a large dynamic system: experiments on a training simulator. IEEE
Trans. On Syst. Man. Cybernet. SMC-16 (1986). 47. N. H. Narayanan and N. Viswanadham. A methodology for knowledge acquisition and reasoning in failure analysis
of system. 1EEE Trans. Syst. Man. Cybernet. SMC-17 (1987). 48. V. Jacob and H. Pirkul. A framework for networked knowledge-based system. 1EEE Trans. On Syst. Man. Cybernet.
20, 1990. 49. Y. Ishida, N. Adachi and H. Tokumaru. A topological approach to failure diagnosis of large scale system. IEEE Trans.
On Syst. Man. Cybernet. SMC-15, 129-141 (1985). 50. M. J. Pazzani. Failure-driven learning for fault diagnosis heuristics. IEEE Trans. Syst. Man. Cybernet. SMC-17,
380 394 0987). 51. R. Milne. Strategies for diagnosis. IEEE Trans. Syst. Man. Cybernet. SMC-17, 333-339 (1987). 52. K. D. Forbus. Interpreting observations of physical systems. IEEE Trans. Syst. Man. Cybernet. SMC-17, 350-359
0987). 53. W. C. Yoon and J. M. Hammer. Deep-reasoning fault diagnosis: an aid and a model. IEEE Trans. Syst. Man. Cybernet.
18 (1988). 54. S. Post and A. Sage. An overview of automated reasoning. IEEE Trans, Syst. Man. Cybernet. 20, 202-224 (1990). 55. J. C. Lush and P. K. Fink. Expert system and diagnostic expertise in the mechanical and electrical domains. IEEE Trans.
Syst. Man. Cybernet. SMC-17, 340-349 (1987). 56. J. Lee. In process machine degradation monitoring and fault detection using a neural networks approach. D.Sc.
Dissertation, George Washington University (1992). 57. J. Lee and B. M. Kramer. Analysis of machine degradation using a neural networks approach. J. Manufact. Syst. 12
(1993).


