Embed Size (px)
Citation preview
Emotional Intelligence And Job Performance: Evidence Of
Private Higher Educational Institutions In Malaysia
Lee Yin Su
A research project submitted in partial fulfillment of the
requirement for the degree of
Master of Business Administration
Universiti Tunku Abdul Rahman
Faculty of Accountancy and Management
April 2014

ii
Emotional Intelligence And Job Performance: Evidence Of
Private Higher Educational Institutions In Malaysia
By
Lee Yin Su
This research project is supervised by:
Mr Chong Shyue Chuan
Head of Department
Department of Economics
Faculty of Accountancy and Management

iii
COPYRIGHT @ 2014
ALL RIGHTS RESERVED. No part of this paper may be reproduced, stored in a
retrieval system, or transmitted in any form or by any means, graphic, electronic,
mechanical, photocopying, recording, scanning, or otherwise, without the prior
consent of the authors.

iv
DECLARATION
I hereby declare that:
(1) This MKMA25106 Research Project is the end result of my own work and that
due acknowledgement has been given in the references to all sources of information
be they printed, electronic, or personal.
(2) No portion of this research project has been submitted in support of any
application for any other degree or qualification of this or any other university, or
other institutes of learning.
(3) The word count of this research report is 12,444
Name of Student : Lee Yin Su
Student ID : 08UKM07885
Signature :
Date : 16 April 2014

v
Acknowledgments
This research study would not have been completed without the encouragement and
guidance of many great people. I should like to thank my lovely parents, who are my
daily reminder of all that is good in my life. I should like to thank my supervisor, Mr
Chong Shyue Chuan, who graciously spent his valuable time to guide me through the
difficult chore of wading through and analyzing this study to its conclusion. Also, I
should like to express my very special thanks Dr Chong Chien Fatt, Mr U K Menon,
and Dr Teh Choon Jin, thank you with all my heart for your sharing and motivation
that made this study possible, your sense of vision moves and inspires me. I must also
acknowledge the financial support given by Ms Lai JF from Hotel Indah Sandakan,
who has been a wonderful sponsor of this study, for all costs incurred in printing and
posting of questionnaires.

vi
TABLE OF CONTENTS
COPYRIGHT ........................................................................................................................... iii
DECLARATION ..................................................................................................................... iv
Acknowledgments..................................................................................................................... v
LIST OF TABLES ................................................................................................................... ix
LIST OF FIGURES ................................................................................................................. xi
ABSTRACT ............................................................................................................................ xii
CHAPTER 1 INTRODUCTION ............................................................................................. 1
1.1 Background ............................................................................................................... 1
1.2 Problem Statement .................................................................................................... 3
1.3 Purpose of the study .................................................................................................. 4
1.4 Theoretical Framework ............................................................................................. 5
1.5 Research Questions ................................................................................................... 9
1.6 Research Objectives .................................................................................................. 9
1.7 Significance of Study ................................................................................................ 9
CHAPTER 2 LITERATURE REVIEW ................................................................................ 11
2.1 The Man and Emotional Intelligence ...................................................................... 11
2.2 Job Performance...................................................................................................... 12
2.3 Emotional Intelligence and Job Performance ......................................................... 13
2.4 Types of Emotional Intelligence Measures ............................................................. 14
2.5 The Predictive Power of Bar-On Emotional Quotient Inventory on Performance . 15
2.7 The Proposed Measures .......................................................................................... 20
2.7.1 Intrapersonal Skills and Interpersonal Skills................................................... 20
2.7.2 Adaptability ..................................................................................................... 20
2.7.3 Stress Management ......................................................................................... 21
2.7.4 General Mood ................................................................................................. 21
2.8 Research Model & Research Hypothesis ................................................................ 22
CHAPTER 3 ........................................................................................................................... 25
vii
RESEARCH METHODOLOGY ............................................................................................ 25
3.1 Introduction ............................................................................................................. 25
3.2 Type of Investigation .............................................................................................. 26
3.2.1 Research Philosophy ....................................................................................... 26
3.2.2 Research Approach ......................................................................................... 27
3.2.3 Research Strategy ............................................................................................ 28
3.3 Data Collection Method .......................................................................................... 29
3.3.1 Self-Report ...................................................................................................... 30
3.3.2 Scales .............................................................................................................. 31
3.3.3 Key Variables .................................................................................................. 31
3.4 Sampling Method .................................................................................................... 31
3.5 Data Analysis Approach ......................................................................................... 32
3.6 Limitation ................................................................................................................ 33
CHAPTER 4 ........................................................................................................................... 34
DATA ANALYSIS ................................................................................................................. 34
4.1 Introduction ............................................................................................................. 34
4.2 The Demographics .................................................................................................. 34
4.3 Normality – Kurtosis & Skewness .......................................................................... 37
4.4 Validity and Reliability ........................................................................................... 38
4.5 Components Analysis ............................................................................................. 39
4.5.1 Results from Components Analysis on EQ-I Model ....................................... 39
4.5.2 Results from Components Analysis on RBPS Measures ................................ 42
4.6 Hypotheses Testing ................................................................................................. 44
4.6.1 Results of RBPS Measures by EQ-I Measure ................................................. 44
4.6.2 Results of Total RBPS Measures on Total EQ-I:............................................ 52
4.6.3 Summary of the Results .................................................................................. 53
CHAPTER 5 ........................................................................................................................... 54
DISCUSSION AND CONCLUSION ..................................................................................... 54
5.1 Introduction ............................................................................................................. 54
5.2 Overview of the Study ............................................................................................ 54
5.3 Main Findings ......................................................................................................... 55
5.3.1 Discussion for Hypothesis 1 ........................................................................... 55
5.3.2 Discussion for Hypothesis 2 ........................................................................... 58

viii
5.4 Implications of the Findings ................................................................................... 58
5.4.1 Implications for Employees and Employers ................................................... 58
5.4.2 Implication on Educational Perspective .......................................................... 59
5.5 Limitations of the Study .......................................................................................... 60
5.5.1 Effects of Questionnaire Length ..................................................................... 60
5.5.2 Construct of Emotional Intelligence ............................................................... 61
5.5.3 Self-Report ...................................................................................................... 61
5.6 Recommendations ................................................................................................... 61
5.6.1 Performance Measurement System ................................................................. 61
5.6.2 Length of the EQ-I measure ............................................................................ 62
5.7 Conclusion .............................................................................................................. 62
References ............................................................................................................................... 64
Appendices .............................................................................................................................. 76

ix
LIST OF TABLES
Table 1.1: Five of the Most Commonly Used Emotional Intelligence Instruments ................. 7
Table 1.2: Goleman`s Four-Dimensional Trait-Based Model: A Framework of Emotional
Intelligence Competencies ........................................................................................................ 7
Table 1.3: Role-based Performance Scale’s Item ..................................................................... 8
Table 2.1: EI Personal Factor Model Composite Scales ......................................................... 16
Table 2.2: Five Composite Scales of Bar-On ......................................................................... 17
Table 2.3: Role-based Performance Scale’s Items .................................................................. 19
Table 2.4: Proposed Research Hypotheses for H1 .................................................................. 24
Table 3.1: Advantages and Disadvantages of Survey Method ............................................... 29
Table 3.2: Allocation of Questions from Questionnaire ......................................................... 30
Table 4.1: Demographics ........................................................................................................ 36
Table 4.2: Independent Variable ............................................................................................. 37
Table 4.3: Cronbach`s Alpha Value and the Level of Acceptance ......................................... 38
Table 4.4: The Results of Validity and Reliability Analyses of the EQ-I ............................... 39
Table 4.5: Item Validity and Reliability Analyses of the Dependent Variable ....................... 39
Table 4.6: Principal Components Analysis on Independent Variables ................................... 40
Table 4.7: Reliability Statistic ................................................................................................. 40
Table 4.8: Remaining Items of EI-Q after Principal Components Analysis ........................... 41
Table 4.9: Principal Components Analysis on RBPS Performance Measures ....................... 42
Table 4.10: Reliability Statistic ............................................................................................... 43
Table 4.11: Item Validity ........................................................................................................ 43
Table 4.12: Correlation of the Components of EQ-I and RBPS ............................................. 45
Table 4.13: Regression Analysis of the Job Component of RBPS on EQ-I ........................... 46
Table 4.14: Regression Analysis of the Career Component of RBPS on EQ-I ...................... 47
Table 4.15: Regression Analysis of the Innovator Component of RBPS on EQ-I ................. 48
Table 4.16: Regression Analysis of the Team component of RBPS on EQ-I ......................... 49
Table 4.17: Regression Analysis of the Organization Component of RBPS on EQ-I ............ 50
Table 4.18: Regression Analysis of the Total RBPS on EQ-I ................................................ 51
Table 4.19: Regression Analysis of the Total RBPS on EQ-I ................................................ 52

x
Table 4.20: Significant Relationship between EQ-I & RBPS(Job Performance Measure) .... 53
Table 5.1: Correlation Coefficient Indication between Variables .......................................... 56

xi
LIST OF FIGURES
Figure 1.1: Proposed Research Model (EQ-I Composite Scales & Job Performance Measures
Composite) ................................................................................................................................ 8
Figure 2.1: Index to Abbreviation on EI Sub-Scales .............................................................. 17
Figure 2.2: Proposed Conceptual Framework Showing Research Hypothesis for H1 ........... 23
Figure 2.3: Proposed Conceptual Framework Showing Research Hypothesis for H2 ........... 23
Figure 3.1: Research Onion .................................................................................................... 26
Figure 3.2: Proposed Questionnaire Administration ............................................................... 30

xii
ABSTRACT
This study explored the predictive utility of an Emotional Intelligence measurement
that was based on the Bar-On Emotional Quotient Inventory with regards to the Role-
based Performance Scale’s measure of job performance. The aim of inquiry was to
investigate if the level of Emotional Intelligence score of each academic staff in the
selected private higher educational institutions has its effect on job performance. A
quantitative research approach was adopted with the objective of casting the
researcher’s net widely to selected higher educational institutions in order to obtain as
much data as possible. A questionnaire was sent out to 760 academics and yielded a
response rate of 49.0 per cent. The study later confirmed that a academic`s job
performance can be measured on the basis of five emotional intelligence dimensions
and these dimensions, when tested, attracted a Cronbach’s Alpha of above 0.90. The
result demonstrated a significant relationship between emotional intelligence and job
performance of academic staff in private higher educational institutions. Therefore,
these significant findings shed further lights on the theoretical and practical utility of
the construct of emotional intelligence and job performance, proven to the fact that
Emotional Intelligence is accountable for and could predict Job Performance.

xiii

CHAPTER 1
INTRODUCTION
1.1 Background
In Malaysia as in other countries, higher educational institutions and higher
educational educators have come under constant scrutiny because of the rising
demand for people with talent. Globalization has created new demands and
competition for talent, forcing the country to recognize that people are the most
valuable assets in any national development plans. As a result, increasingly, human
talent is seen as a commodity that is treated like other commercial commodities. The
competition for talent has become as fierce as the competition for other scarce
commercial commodities (Squicciarini & Loikkanen, 2008; Nasional Malaysia Bhd,
2009; Jones et al., 2014).
Higher educational institutions alleviate the scarcity by providing talented
manpower to meet national growth demands (The World Bank, 2012). Malaysian
higher educational institutions are spread across the public and private sectors. In the
last 20 years, enrollments in private higher educational institutions have grown to a
point where students in private institutions constitute more than half of the total
students enrolled across both sectors (Nasional Malaysia Bhd, 2009; Malaysia
Education Blueprint, 2013). Not only has there been an increase of students enrolling
in the private sector, but the numbers enrolling into higher education has also
increased at a tremendous rate (Malaysia Education Blueprint, 2013).

Page 2 of 83
A parallel development with the increased enrollment has been institutional
criticism that higher education institutions are not performing as they should to
produce quality students (Nasional Malaysia Bhd, 2009; The World Bank, 2012).
The lack of qualified lecturers and instructors in higher education has been identified
as one of the causes of the disconnect between employment demands and higher
education (The World Bank, 2012).
Institutional scrutiny aside, the role of private higher educational institutions
has come under increasing criticism by the public, which has imposed job
performance assessment on academics in higher education (Pop-Vasileva, 2011).
Much is expected of the academic. Academic accountability extends to the services
delivered to students and parents with the onus to produce quality students with good
academic performance. Academics have also to be adaptable to cope with the
changing trends in the way higher education is delivered and the numerous policies
and guidelines issued by the authorities. The national demand for graduates with
higher education also adds the pressure on higher educational institutions and
academics working in them. These obligations are far greater than what was required
of them in the past. National demands for trained manpower almost outweigh those
traditional obligations that higher educational intuitions owed to individual student
(Bok, 2005). The obligations do not end there. The internationalization of higher
educational institutions through the admission of foreign students placed additional
burdens on staff to take into account the different cultural values of students (Pop-
Vasileva, 2011).
There is now constant pressure to achieve series of challenging goals as
follows to enhance institutional performance, many of them directed on academic
staff:
• to achieve certain Key Performance Index (KPI) targets such as research
output, publication of academic papers, university rankings, and
internationalization and also turn a profit;

Page 3 of 83
• to increase enrollments and generate returns for their shareholders;
• effective university rankings system has made an impact on the way our
universities are administered and how academics do their work now;
• to work under packed academic calendars with rather short breaks in between.
• to produce graduate that will power Malaysia into becoming an economic
powerhouse in the coming decades
The privatization of higher education has commercialized what was once
regarded as a public good. As a consequence, not only do academics have to account
to the nation and to the students and their parents, but they are also required to be
responsible to what is often described as the bottom line. Traditional academic values
have been altered by these changes (Bok, 2005).
The new demands made on academics require them to be efficient not only in
terms of qualifications and subject disciplines but also to be emotionally fit.
1.2 Problem Statement
The problems facing the academic staff lie in the fact that they concomitantly
deal with multiple stakeholders: the students, the administrators, the faculty, the
school, the community, and the board of trustees. Important also is the fact that each
one of these stakeholders is hard to manage in that different stakeholders have goals
that are conflicting. The presidents as well as the owners of the institutions do not
always have the power to control all these stakeholders, if any at all. Added to this, in
the private sector, academics have also to be concerned with the financial well-being
of their employer. Amidst all this they must maintain academic standards and the
integrity and reputation of their institution (Coaldrake and Stedman, 1998; Bok,
2005).
Traditional academic operational processes and means to weight academic
staff have seemed to fail in because of the drastic changes in the higher education

Page 4 of 83
landscape. According to Bar-On (2006), one variable that has gained popularity in
predicting job performance of academic staff is emotional intelligence. Goleman
(2001) observed that one common value shared by most of the staff whose
performance is effective is that they all have a high degree of emotional intelligence
as the reason for their efficiency and effectiveness. Improved job performance is the
outcome of this great value. He further explained that the best training in the world
will not be compatible to the needs to produce quality manpower if the emotional
intelligence component is not taken into account. Therefore, the following question
arises: how emotionally intelligent are academic staff and do their emotional
intelligence levels show in their job performance.
1.3 Purpose of the study
Traditionally job performance was measured by linking it with the intelligence
or cognitive abilities of the individual. The adequate measure of intelligence was the
intelligence quotient (IQ) test (Singh, 2007). Historically, intelligence (IQ) has been
measured by tests that result in a score being recorded, the higher the score, the better
one’s intelligence (Johnson`s study as cited in Yarrish and Law, 2009). There is
evidence that many successful people performed poorly in school without being ‘A’
students (Scott`s study as cited in Yarrish and Law, 2009). According to Yarrish and
Law (2009), emotional intelligence is thought to be the main factor that contributed to
the success in these individuals. Social and science researchers have shown that IQ
contributed only 20 per cent of a person’s professional success whilst 80 per cent
came from emotional intelligent (EI or EQ) (Crow, 2008; Dulewicz and Higgs, 1999;
Dulewicz and Higgs, 2000).
A mixture of IQ together with EI explains the important of this powerful
combination in creating quality job performance in successful career. The
consequences of which will never be achieved with IQ alone (Dulewicz and Higgs,
1999; Dulewicz and Higgs, 2000; Lam and Kirby, 2002). While the IQ and the

Page 5 of 83
academic degrees may get one to be hired, the level of emotional intelligence will
help to succeed and retain the position offered (Neptune, 2008).
Factually, literature has also shown that EI & IQ of a person are as important
as or more important than standard measurement of intelligent or academic
performance as measured by the institutions of higher education (Shih and Susanto,
2010). EI measures the ability to deal with emotion and contributes to better
adjustment of the individual in the workplace. Hence, a survey of academics in
private higher education institutions to determine their emotional adaptability and
how that links with their job performance may contribute to a more efficient selection
and management of staff those institutions.
1.4 Theoretical Framework
Two different methodologies and theories have been built from the numerous
literatures available in building the EI model for different industries. The first is from
the academic researchers’ perspective that EI is an intellectual concept; the other is
from the training environment that describes EI as a mixture of both practical and
academic competencies that are acquired by a person (Kunnanatt, 2008). There are
several EI measurement instruments available that were developed for corporate use
(see Table 1.1 and Table 1.2). Few studies have been conducted on psychometric
properties of these instruments (Tucker et al, 2000).
Goloman`s (1995, 2001) Four-Dimensional Trait-Based Model (Christie et al,
2007; McEnrue, 2009; Webb, 2009) in Table 1.2 that measure EI with the emotional
competency index, or ECI-2 (McEnrue, 2009), is the most recent model of EI
outlined by Goleman (Goleman, 2001; Christie et al, 2007). Goleman (1995, 2001)
has his stand firmly on the ground that EI is a strong predictor for job performance.

Page 6 of 83
This has been conflicting with many findings from other researchers in the same field
but Goleman managed to bridge the gap. The “Four Dimensional Trait-Based Model”
constructed by him proved that 75 per cent of success in job is the result of higher
scores in emotional competencies (Christie et al, 2007). Emotional Quotient
Inventory (EQ-I) by Bar-On (2005), a psychometric instrument was then tailor-made
to define the same need and outcome. EQ-I predict job performance based on the EI
dimensions constructed in the model (Douglas et al., 2004; Bar, 2005). The job
performance measurement is listed in Table 1.3.
According to Figure 1.1, the model was a refinement of the survey instrument
from Douglas et al (2004), for this study. Five dimensional definitions or composite
scales of EI of Intrapersonal, Interpersonal, Stress Management, Adaptability and
General Mood; and five dimensional definition or composite scale of job performance
of Job, Career, Innovator, Team and Organization are identified. The competencies
stated in Figure 1.1 have been recognized as adding value to Job performance
(Douglas et al., 2004).

Page 7 of 83
Table 1.4: Five of the Most Commonly Used Emotional Intelligence Instruments
Note: Adapted from Tucker, M. L., & Sojka, J. Z., & Barone, F. J., & Mccarth, A. M. (2000). Training
tomorrow`s leaders: Enhancing the emotional intelligence of business graduates. Journal of Education
for Business. Vol. 75, Issue. 6; p. 331
Table 1.4: Goleman`s Four-Dimensional Trait-Based Model: A Framework of Emotional Intelligence
Competencies
Note: Adapted from Goleman, D. (2001). An EI-based theory of performance, in C Cherniss & D
Goleman (Eds). The Emotionally Intelligent Workplace. Jossey-Bass, San Francisco.p. 27-44

Page 8 of 83
Table 1.4: Role-based Performance Scale’s Item
Note: Adapted Welbourne, T. M., & Johnson, D. E., & Erez, A. (1998). The Role-Based Performance
Scale: Validity analysis of a theory-based measure. Academy of Management Journal. Vol.41, Issue. 5;
p. 540-555
Figure 1.4: Proposed Research Model (EQ-I Composite Scales & Job Performance Measures
Composite)

Page 9 of 83
1.5 Research Questions
In summary, the research questions are:
• What are the components of EI that could affect the Job Performance of the
academic staff in private higher education institutions in Klang Valley?
(Is there a significant relationship between each of the EI composite scales,
significant in predicting the Job Performance composite scales?)
• Is there a significant relationship between overall EI competencies and overall
Job Performance of the academic staff in private higher education institutions
in Klang Valley?
1.6 Research Objectives
• To investigate if there is a significant relationship between each of the EI
composite scales, significant in predicting the Job Performance composite
scales.
• To investigate if there is a significant relationship between overall EI
competencies and overall Job Performance of the academic staff in private
higher education institutions in Klang Valley.
1.7 Significance of Study
EI and Job Performance has become a major topic of interest of many
researchers over the past decades. Many of these studies focused on defining and
rebuilding the dimensions that have been embedded in the family of intelligence and
job competencies, to prove that each of these components could be the predictors to

Page 10 of 83
many other instruments to measure social intelligence, personality traits and
performance.
Recent publications have shown that EI from an educational context is as
important as or more important than a standard measurement of intelligence as an
instrument model for educational institutions to measure the students` academic
performance and also to measure academic staff ability to deal with emotion
contribute to better judgment in their workplace. Hence, in this study, a survey of
academic staff in private higher educational institutions to determine such emotional
adaptability on job performance may reveal the importance of EI.

Page 11 of 83
CHAPTER 2
LITERATURE REVIEW
2.1 The Man and Emotional Intelligence
Over the last few decades, Emotional Intelligence (EI) has become a hot topic
among the social and scientific community. The potential efficacy of emotional
intelligence has been found to be overwhelmingly positive in the school, home, and
even at the workplace (Kunnanatt, 2008; Law et al, 2008; Schulze et al., 2007).
Salovey and Mayer (1990) defined EI as proposed in the Four Branch Model,
as a social intelligence that has the ability to drive one person to get along with
another. They claim that EI is an application of emotions functioning in a logical and
intelligent manner monitored by both emotion and reason (Kunnanatt, 2008). It helps
to improve one’s own feelings as well as any other relationship, enable a person to
understand, guide, and manage his own emotions as well as others (Owen, 2004;
Tucker et al, 2000; Morris et al, 2005; Liptak, 2005; Abraham, 2006; Lenaghan et al,
2007).
EI, which has its roots in the literature of psychology, has expanded gradually
to many other academic disciplines. Numerous definitions of EI have been derived
for its essential characteristic that could bring greater outcomes to the readers as well
as the society who wish to practice the essences of it. Peter Salovey and John Mayer

Page 12 of 83
have been the leading researchers on this area However, the true master who brings
the concepts of EI to the highest peak of the point, from the academic world to
commercial industries, was Daniel Goleman (Turker et al, 2000; Lam & Kirby, 2002;
Law et al, 2008). Goleman’s findings on how EI attributed to the job effectiveness,
especially to those who are in the higher level of a company, alarmed the business
sector (Turker et al, 2000).
Goleman (1995) claimed that EI affects performance (Lam and Kirby, 2002)
where a person with high attributes of EI is the one that can recognize and then
effectively deal with their own emotions while at the same time recognize and
empathize with others feeling (Lenaghan et al, 2007). This statement was further
supported by the finding from Wall (2007).
2.2 Job Performance
Job performance is defined as a behavioral attitude that involved in bringing
contribution to organization goals (Viswesvaran & Ones, 2000). The definition of job
performance has been widely studied and researched in many business and HR
literature in the context of organizational management and achievement (Welbourne
et al., 1998), and job performance is now accountable for the credits earned from the
measurement system to judge one`s achievement (Chen and Silverthorne, 2008).
Numerous tools and performance merit systems have been developed by
organizations in both the public and private sectors to screen and enhance the
performance of their members (Suliman et al., 2010). For instance, past studies
indicate that Human Resource Management (HRM) is implemented by various
industries to examine the staff and organization performance (Amin et al., 2013). In
business and education segment, few performance measurements were used to assess
performance such as Key Performance Indicator (KPI), Balance Scorecard (BSC) and
Role Based Performance Scale (Chand & Katou 2007; Welbourne et al., 1998; Amin
et al., 2013).

Page 13 of 83
Ironically, the same method that has been implemented in the commercial
sector has now slowly been spread into educational institutions. Academics are now
being assessed with job performance metric that measured their work both in teaching
and administrative under a series of key performance index. There has been a lot of
debate among the academics on this subject. Many argue that ‘performance’ in the
academic context is simply not appropriate to be justified and the fairness of the
outcomes form the performance measurement are questionable and always subject to
criticism (Ariss & Timmins, 2009).
2.3 Emotional Intelligence and Job Performance
The deliberation and differences between emotions and intellect have been
argued over the past few decades. There are findings contradicting with original
outcomes that claimed that IQ was not a good predictor for individual success and
work performance (Manley, 2009). The validity of such predictor has been cleared
once Goleman (2005) in his study successfully proved that different people with the
same IQ could contribute to different level of success, depending on their level of EI
at the workplace (Goleman, 2001; Manley, 2009).
Role of EI in organization has been widely articulated in performance related
literature (Goldenberg et al., 2006; Singh, 2007). Literature demonstrates that a leader
with great leadership abilities must not only take into account the intellect, but also
the EI that would impinge on the decision which they could probably make (Manley,
2009). Kunnanatt (2008) stated that his finding revealed the validity of EI in
improving the quality of employee effectiveness and organizational performance
(Tucker et al., 2000; Yarrish and Law, 2009; Pollitt, 2007; Shih & Susanto, 2010).
Voices raised against the findings protested that EI has little effect on job
performance but the results of most of the other researchers found that EI and job
performance are positively related (Slaski & Cartwright, 2003; Bar-On, 2005).

Page 14 of 83
The mechanism that formed the concept of EI revealed another chapter in EI
that individual with good EI transforms conflicts to positive outcomes. These
integrating process of EI in one`s proved that employees are no machine by all means
but they carry emotions to work. Result of which, with good attitude together with the
high level of EI they perceived on the job, good effects would be the result (Goleman,
2001; Slaski & Cartwright, 2003; Bar-On, 2005; Peterson and Gonzales (2005);
Pollitt, 2007; Law et al., 2008; Shih and Susanto, 2010).
Afolabi et al. (2010) found that EI execute its characteristics to predict
outcome but only on single task, such as academic performance (Lam & Kirby, 2002),
academic classroom performance (Afolabi et al., 2010), and marketing performance
(Law et al., 2004). However, Daview et al. (1998) revealed that the unique construct
of EI are significant related to many desired on-the-job outcomes from the industries.
Recent literature that based on self-report measures of EI proposed that individual
with high level of EI is the better performers (Law et al., 2004; Bar-On, 2005). Bar-
On (2005) suggested that with the establishment that EI and job performance linked, a
construct to measure one`s intelligence and its relation to job performance is very
much needed. These are found for instance in General Mental Ability Battery; and
Confluencing Counselling Model (Liptak, 2005) which are some of the predictors of
job performance (Law et al., 2008).
2.4 Types of Emotional Intelligence Measures
Several high potential psychometric instruments were developed for various
means to support both the educational and corporate use (Kunnanatt, 2008).
Academics defined these instruments as a competency framework in one`s behavioral
trait for learning, but professionals distinguish them as a tool with the combination of
both practical and personal intelligent traits that could boost the performance and
outcomes (Tucker et al, 2000; Kunnanatt, 2008).

Page 15 of 83
The EI measurement instruments that were developed for commercial use are
listed in Table 1.1 and Table 1.2. in Chapter 1.
Goleman`s The Four Dimensional Trait Based Model measured EI as a core
self-assessment and social desirability with the Emotional Competencies Index (ECI),
to predict performance. The research study has bridged the gap of many scholars who
claimed that EI is not accountable for job performance (Christie et al, 2007; McEnue
et al., 2009; Webb, 2009). However, Bar-On (2005) further proposed that his study on
Bar-On Emotional Quotient Inventory (EQ-I), a psychometric instrument which has
been tailor made to examine the social intelligence of an individual is critical to
predict work performance with the five main dimensions of EI (Douglas et al, 2004).
2.5 The Predictive Power of Bar-On Emotional Quotient
Inventory on Performance
The Bar-On Emotional Quotient Inventory (EQ-I) is a self-report
psychometric instrument that requires 20 - 30 minutes to complete (Bar-On, 2005).
This special measurement is unique and was designed to measure and distinguish the
social intelligence and the emotional facilitation which could eventually contribute to
positive performance and outcome (Douglas et al, 2004; Bar-On, 2005). The
instrument consist of one hundred and thirty three (133) items covering five
composite scales of Intrapersonal, Interpersonal, Stress Management, Adaptability,
and General Mood (Rothmann et al., 2002; Douglas et al., 2004; Conte, 2005;
Douglas et al., 2004; Bar-On, 2005).
The same instrument has been adopted by few researchers to perform
intelligent test for performance prediction. Table 2.1 shows Dries and
Pepermans’(2007) administration of the EQ-I instrument as EI Personal Factor Model,
linking performance and career commitment to EI. Table 2.2 explained results of the

Page 16 of 83
Bar-On`s EQ-I instrument adopted by the researchers, Yuvaraj and Srivastava (2007)
to examine the intelligence competency and innovator component among managerial
staff. Figure 2.1 is the explanation of the sub-scale to Table 2.2.
In this study, EQ-I model was adopted to test on EI composite scales to
predict job performance composite scales. The performance instrument was examined
under Welbourne et al. (1998)`s Role Based Performance Scale (RBPS) ratings.
Table 2.5: EI Personal Factor Model Composite Scales
Note: Adapted from Dries, N., & Pepermans, R. (2007). Using emotional intelligence to identify high
potential: a metacompetency perspective. Leadership & Organization development Journal. Vol. 28,
No. 8; p. 749-770.

Page 17 of 83
Table 2.5: Five Composite Scales of Bar-On
Note: Adapted from Yuvaraj, S., & Srivastava, N. (2007). Are innovative managers emotionally
intelligent? Journal of Management Research. Vol. 7, Issue. 3; p. 169
Figure 2.5: Index to Abbreviation on EI Sub-Scales
Note: Adapted from Yuvaraj, S., & Srivastava, N. (2007). Are innovative managers emotionally
intelligent? Journal of Management Research. Vol. 7, Issue. 3; p. 169
Page 18 of 83
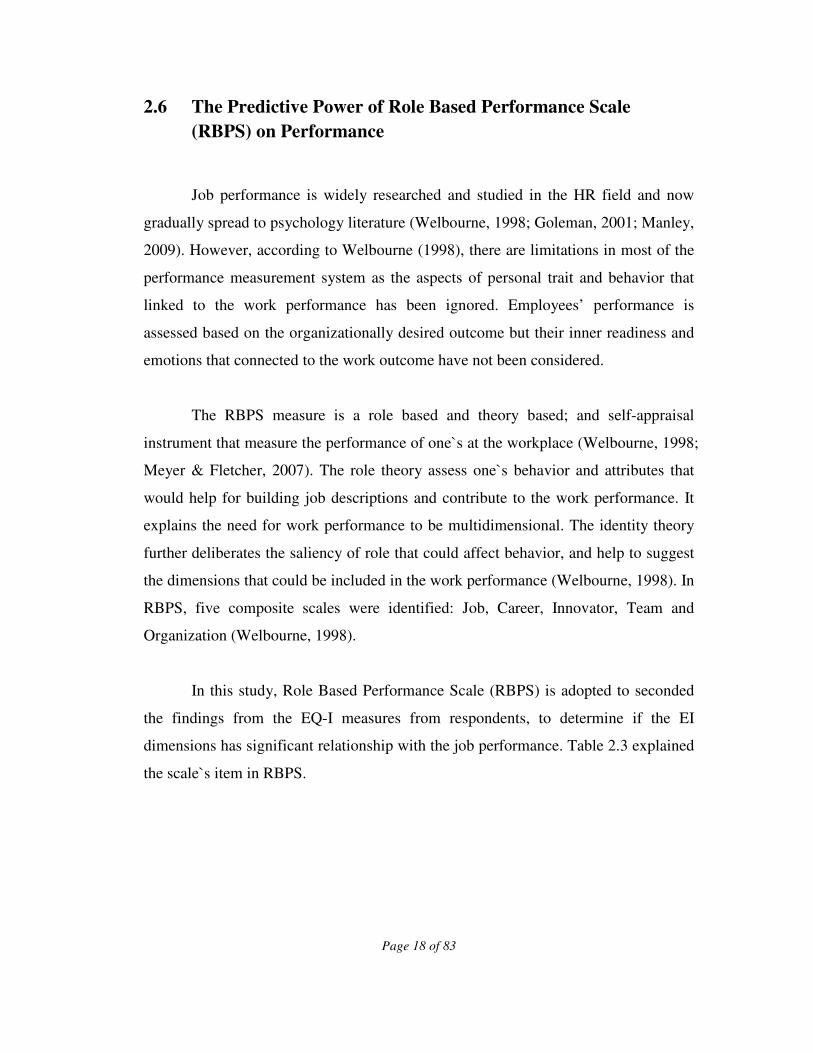
2.6 The Predictive Power of Role Based Performance Scale
(RBPS) on Performance
Job performance is widely researched and studied in the HR field and now
gradually spread to psychology literature (Welbourne, 1998; Goleman, 2001; Manley,
2009). However, according to Welbourne (1998), there are limitations in most of the
performance measurement system as the aspects of personal trait and behavior that
linked to the work performance has been ignored. Employees’ performance is
assessed based on the organizationally desired outcome but their inner readiness and
emotions that connected to the work outcome have not been considered.
The RBPS measure is a role based and theory based; and self-appraisal
instrument that measure the performance of one`s at the workplace (Welbourne, 1998;
Meyer & Fletcher, 2007). The role theory assess one`s behavior and attributes that
would help for building job descriptions and contribute to the work performance. It
explains the need for work performance to be multidimensional. The identity theory
further deliberates the saliency of role that could affect behavior, and help to suggest
the dimensions that could be included in the work performance (Welbourne, 1998). In
RBPS, five composite scales were identified: Job, Career, Innovator, Team and
Organization (Welbourne, 1998).
In this study, Role Based Performance Scale (RBPS) is adopted to seconded
the findings from the EQ-I measures from respondents, to determine if the EI
dimensions has significant relationship with the job performance. Table 2.3 explained
the scale`s item in RBPS.

Page 19 of 83
Table 2.5: Role-based Performance Scale’s Items
Note: Adapted Welbourne, T. M., & Johnson, D. E., & Erez, A. (1998). The Role-Based Performance
Scale: Validity analysis of a theory-based measure. Academy of Management Journal. Vol.41, Issue. 5;
p. 540-555

Page 20 of 83
2.7 The Proposed Measures
2.7.1 Intrapersonal Skills and Interpersonal Skills
The relationship between intrapersonal and interpersonal skills and
performance began to attract attention after the Second World War (Gardner`s study
as cited in Manley, 2009; Hunt and Baruch, 2003). The definitions were evolved from
the past literature that explained both components as ‘the intelligence to deal with
own-self and others; at the same time perceive mutual understanding and creating
positive outcomes’ (Barker, 2002; Polychroniou, 2009).
Goleman (2001) coined the term for EI in the educational context as an
ingredient for effective group and personal performance, as well as to ensure career
success. He claimed that the more EI capabilities of the educators, the higher the
possibility for them to produce quality students with sound academic performance;
and that the students who are trained to be competence in handling their EI would
succeed and perform in their future career (Goleman, 2001; Holt and Jones, 2005;
Whitefield and Kloot, 2006). This in turn explains a two way teacher and student
learning cycle, a lifelong learning in higher education.
2.7.2 Adaptability
The construction of adaptability in EI family has become a new topic in the
literature (Bar-On, 2005). This essential component has been recognized as one`s
ability to succeed in coping with environmental demand and changes; as well as
willing to adapt to changes (Cascio, 1998; Goleman, 2005; Allworth & Hesketh, 1999;
Katsaros et al., 2014).

Page 21 of 83
2.7.3 Stress Management
Stress management, is an emergency management instrument in many
contexts. It is a pre-requisite component for one to manage and order their behavior to
display organizationally required outcome (Juniper, 2003; Douglas, 2003). Bar-On
(2005; 2006) suggests that individual who masters this essential component could
reduce job stress and promote job adaptability in the work place (Dewe and
O`Driscoll, 2002).
2.7.4 General Mood
Mood is an expression to communicate the thinking, the emotion, the anxiety
and cognitive behavioral feedback from one`s inner thoughts, showing one`s
happiness, sadness and optimism (Douglas et al., 2004; Munyon, et al., 2009). The
general mood with living skills is the capacity to recognize one`s feeling (Munyon, et
al., 2009). In Bar-On (2005) studies, general mood explained optimism and happiness.
The instrument was designed to comprehensively leverage one`s general intelligence
proficiency to promote collaboration competency and to predict job performance
(Douglas et al., 2004; Bar-On, 2005).
General mood plays an important role in both emotional intelligence and
emotional competence perspective. It contributes to the learning competence that
could contribute to outstanding performance (Douglas et al., 2004; McEnrue & Shen,
2009). Therefore, in the business and educational realm, general intelligence of EI has
been welcomed and promoted through workshop and talks to both the academics and
students in the institutions (Liptak, 2005; McEnrue & Shen, 2009).

Page 22 of 83
2.8 Research Model & Research Hypothesis
In this study, five independent variables were derived from the literature
review: Intrapersonal, Interpersonal, Stress Management, Adaptability and General
Mood (Figure 2.2); and the dependent variables were Job, Career, Innovator, Team
and Organization (Figure 2.3). The proposed measured variables (Table 2.4) that
formed the hypotheses for this study are as follows:
H1: There is a significant relationship between each of the EI composite scales,
significant in predicting the Job Performance composite scales.
H2: There is a significant relationship between overall EI competencies and overall
Job Performance.

Page 23 of 83
Figure 2.8: Proposed Conceptual Framework Showing Research Hypothesis for H1
Figure 2.8: Proposed Conceptual Framework Showing Research Hypothesis for H2
Page 24 of 83
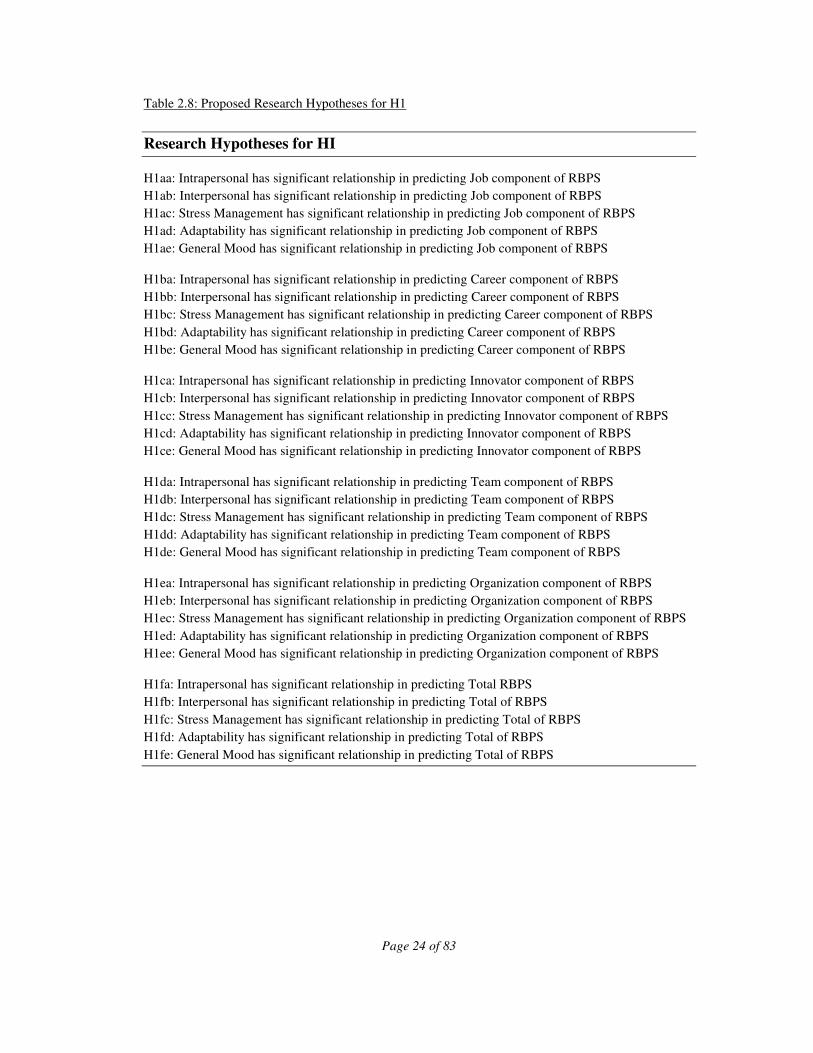
Table 2.8: Proposed Research Hypotheses for H1
Research Hypotheses for HI
H1aa: Intrapersonal has significant relationship in predicting Job component of RBPS
H1ab: Interpersonal has significant relationship in predicting Job component of RBPS
H1ac: Stress Management has significant relationship in predicting Job component of RBPS
H1ad: Adaptability has significant relationship in predicting Job component of RBPS
H1ae: General Mood has significant relationship in predicting Job component of RBPS
H1ba: Intrapersonal has significant relationship in predicting Career component of RBPS
H1bb: Interpersonal has significant relationship in predicting Career component of RBPS
H1bc: Stress Management has significant relationship in predicting Career component of RBPS
H1bd: Adaptability has significant relationship in predicting Career component of RBPS
H1be: General Mood has significant relationship in predicting Career component of RBPS
H1ca: Intrapersonal has significant relationship in predicting Innovator component of RBPS
H1cb: Interpersonal has significant relationship in predicting Innovator component of RBPS
H1cc: Stress Management has significant relationship in predicting Innovator component of RBPS
H1cd: Adaptability has significant relationship in predicting Innovator component of RBPS
H1ce: General Mood has significant relationship in predicting Innovator component of RBPS
H1da: Intrapersonal has significant relationship in predicting Team component of RBPS
H1db: Interpersonal has significant relationship in predicting Team component of RBPS
H1dc: Stress Management has significant relationship in predicting Team component of RBPS
H1dd: Adaptability has significant relationship in predicting Team component of RBPS
H1de: General Mood has significant relationship in predicting Team component of RBPS
H1ea: Intrapersonal has significant relationship in predicting Organization component of RBPS
H1eb: Interpersonal has significant relationship in predicting Organization component of RBPS
H1ec: Stress Management has significant relationship in predicting Organization component of RBPS
H1ed: Adaptability has significant relationship in predicting Organization component of RBPS
H1ee: General Mood has significant relationship in predicting Organization component of RBPS
H1fa: Intrapersonal has significant relationship in predicting Total RBPS
H1fb: Interpersonal has significant relationship in predicting Total of RBPS
H1fc: Stress Management has significant relationship in predicting Total of RBPS
H1fd: Adaptability has significant relationship in predicting Total of RBPS
H1fe: General Mood has significant relationship in predicting Total of RBPS

Page 25 of 83
CHAPTER 3
RESEARCH METHODOLOGY
3.1 Introduction
The earlier chapters in this study introduced and explained the purpose and
significance of EI in predicting Job Performance. Literature from past scholars were
reviewed for the conceptualized constructs and the implied relationship of both EI
and Job Performance. In this chapter, a generic research procedure, ‘the Research
Onion’ listed in Figure 3.1 (Saunders et al., 2009) is adopted to explain the type of
investigation of the study and its methodology under the following headings:
Research Philosophy, Research Approach, Research Strategy, and Research Choice.

Page 26 of 83
Figure 3.1: Research Onion
Note: Adapted from Saunders, M., & Lewis, P., & Thornhill, A. (2009). Research Methods for
Business Students. (5th Ed). Essex, England: Prentice Hall.
3.2 Type of Investigation
3.2.1 Research Philosophy
One of the greatest concerns in this study in the first phase was to contemplate
the best paradigm for this study, a right research method through “views to
investigation” (Saunders et al., 2009). As this study involved facts, social reality and
formation of knowledge and philosophical stance of the natural scholars for a
generalizations outcome (Saunders et al., 2009), hence the philosophy adopted in this
study is positivism.

Page 27 of 83
3.2.2 Research Approach
In this study, a deductive approach was selected. Hypotheses were derived
from literature and together with measured variables that have causal relationship in
between were developed for testing. According to Saunders et al (2009), this
approach was explained as a deductive approach where a logic and rational research
study conclusion will be formed under many various form of available facts.
Following sections were the steps towards the formalization of hypothesis testing:
descriptive analysis, exploratory and evaluation, and hypothesis testing.
3.2.2.1 Descriptive Analysis, Exploratory and Evaluation, and Hypothesis
Testing
In this study, the literature findings and statistics were descriptively analyzed
based on its own specific characteristic. Exploratory analysis was performed as an
analytical technique to define the conceptual fitting of the model with its variables
constructed in the hypotheses postulated in this study (Christian & Sprinkle, 2013).
Two research questions were raised and tested to validate the constructed theory as
explained in the research proposed model for this study listed in Chapter 1, Figure 1.1.
In this study, a quantitative method was adopted to explore the evolving roles and
relationship between EI and Job Performance. Explanation for this selection was that,
very often, qualitative and quantitative approach has been a concerned for many other
researchers. Qualitative analysis is the research paradigm that design and shape
philosophies through a method of inquiry, understand and exploring unstructured data;
and quantitative examine the relationship among measured variables, define and
shape theories through numerical analysis with series data collection from surveys
and questionnaires (Frels & Onwuegbuzie, 2013). As this study involved the second
activity explained in the abovementioned, hence, quantitative approach was selected.
Finally, hypotheses were employed to decide and confirm as to whether the

Page 28 of 83
theoretical hypotheses are confirmed by the empirical evidence, and also to explain
the causal relationship between measured variables (Zikmund, 2003).
3.2.3 Research Strategy
Several methods were used for data collection in this study, where data were
gathered through primary data (questionnaire, surveys, interviews, case study and
pilot studies) and secondary data (articles, academic journals, or other reference
books and dissertations) (Zikmund, 2003). The intention behind was mainly to
provide solid reasoning for researchers to fully understand the theories and
methodologies derived from the literature. In line with this, survey strategy and
measurement strategies were explained as follows.
3.2.3.1 Survey Strategy
Survey is a research method where primary data is gathered from a pool of
selected sample by used of questionnaires (Zikmund, 2003). Various survey strategies
were identified for data collection (Table 3.1) .For instance, through mail, phone, face
to face and online interview. The face to face approach is the most costly and time
consuming, but, the outcomes are always promising (Zikmund, 2003). Hence, it was
considered inappropriate for this study. Phone and online interviews offer almost
quick and immediate response rates but it could be very expensive and researchers
might not be able to meet with the selected pool of respondents as some of calls might
be screened out. Hence, the first two strategies were not suitable for this study. Mail
survey is easy and cost efficient (Barrick et al., 2002). The response rate hit the
lowest among the others survey methods but the targeted sample of respondents was
concentrated and valid. With this, this survey method was adopted in this study.

Page 29 of 83
Table 3.2: Advantages and Disadvantages of Survey Method
Note: Adapted from The Health Communication Unit. (2006). Retrieved August 7, 2013, from
http://www.thcu.ca/infoandresources/publications/surveytable.pdf
3.2.3.2 Measurement Strategies - Emotional Intelligence and Job Performance
Measures
Proposed research model (Figure 1.1) derived from Bar-On Emotional Quotient
Inventory (Bar-On, 2005) and the self-rated Job Based Performance Scale (RBPS) by
Welbourne et al. (1998) were adopted in this study to examination if the five
dimensions or composite scales of EI could predict five dimensions or composite
scales or Job Performance measures.
3.3 Data Collection Method
Survey was conducted with a set of questionnaire adapted from Bar-On
Emotional Quotient Inventory (Bar-On, 2005). Following sections clarified the
explanation.

Page 30 of 83
3.3.1 Self-Report
Self-report was adopted in this study. This self-administered approach was in
the selected list as it promised massive data collection in a short period of time from a
large pool of respondents (McDonald, 2008; Figure 3.2). Listed in Appendix B was a
self-report questionnaire which comprised of three sections (Table 3.2). The first
section covered the demographic profiling of the respondents; second section showed
the five composite scales accessing EI (Intrapersonal, Interpersonal, Stress
Management, Adaptability and General Mood) and third section contained five
composite scales accessing RBPS (Job, Career, Team, Innovator and Organization).
Figure 3.3: Proposed Questionnaire Administration
Note: Adapted from Saunders, M., & Lewis, P., & Thornhill, A. (2009). Research Methods for
Business Students. (5th Ed). Essex, England: Prentice Hall.
Table 3.3: Allocation of Questions from Questionnaire
Section Dimensions/ Scales Allocation of Questions
First - Demographics 1 - 5
Second – EQ-I
Intrapersonal 1 - 32
Interpersonal 33 – 58
Stress Management 59 – 73
Adaptability 74 – 104
General Mood 105 – 133
Third – Job Performance
Job 134 - 137
Career 138 - 141
Innovator 142 - 145
Team 146 - 149
Organization 150 - 153

Page 31 of 83
3.3.2 Scales
Five Point Likert scale with five graduated categories was adopted in this
study to present the respondents response rating on EI score. From the Likert scale, 1
= very seldom or not true of me; 2 = seldom true of me; 3 = sometimes true of me; 4
= often true of me; and 5 = very often true of me or true of me. The RBPS measures
was categorized from Needs much improvement, Needs some improvement,
Satisfactory, to Good.
3.3.3 Key Variables
The independent variables were the five composite scales of EQ-I:
Intrapersonal, Stress Management, Interpersonal, Adaptability and General Mood.
However, the dependent variables were the five component scales of the RBPS: Job,
Innovator, Career, Team, and Organization (Table 1.3 and Figure 1.1).
3.4 Sampling Method
In this study, stratified sampling and simple random sampling method were
adopted to facilitate the process of identifying targeted sample; with nine (9) colleges
and nine (9) university colleges were selected in its respective fashion as listed and
explained in details as follows.
Population of institutions in Klang Valley, Selangor was identified. There
were nine (9) university colleges and eighty five (85) colleges in Selangor (Ministry
of Education Malaysia, 2013; Jabatan Pengajian Tinggi, 2013). It was observed that
some of the colleges were relatively small institutions with only about a hundred
students and operating in shop lots without proper facilities but categorized as college
Page 32 of 83
status. There were also full blown institutions with a status of university colleges or
college having huge campuses and students population (Teh, 2012).
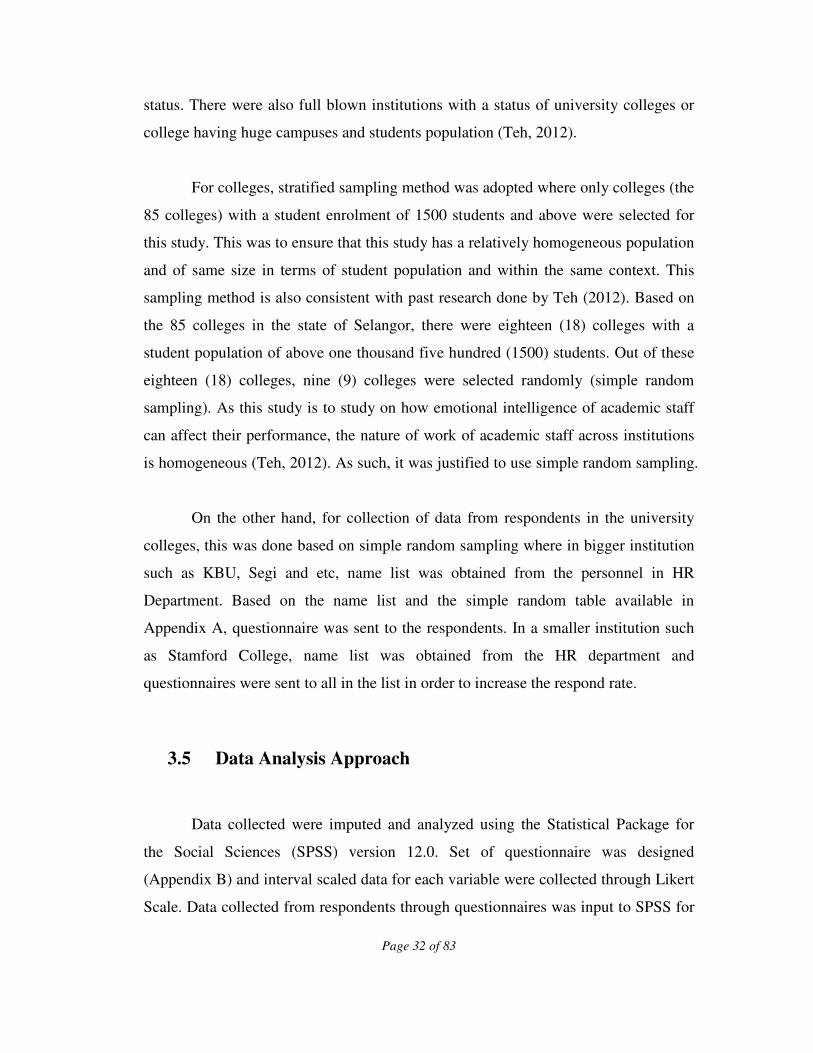
For colleges, stratified sampling method was adopted where only colleges (the
85 colleges) with a student enrolment of 1500 students and above were selected for
this study. This was to ensure that this study has a relatively homogeneous population
and of same size in terms of student population and within the same context. This
sampling method is also consistent with past research done by Teh (2012). Based on
the 85 colleges in the state of Selangor, there were eighteen (18) colleges with a
student population of above one thousand five hundred (1500) students. Out of these
eighteen (18) colleges, nine (9) colleges were selected randomly (simple random
sampling). As this study is to study on how emotional intelligence of academic staff
can affect their performance, the nature of work of academic staff across institutions
is homogeneous (Teh, 2012). As such, it was justified to use simple random sampling.
On the other hand, for collection of data from respondents in the university
colleges, this was done based on simple random sampling where in bigger institution
such as KBU, Segi and etc, name list was obtained from the personnel in HR
Department. Based on the name list and the simple random table available in
Appendix A, questionnaire was sent to the respondents. In a smaller institution such
as Stamford College, name list was obtained from the HR department and
questionnaires were sent to all in the list in order to increase the respond rate.
3.5 Data Analysis Approach
Data collected were imputed and analyzed using the Statistical Package for
the Social Sciences (SPSS) version 12.0. Set of questionnaire was designed
(Appendix B) and interval scaled data for each variable were collected through Likert
Scale. Data collected from respondents through questionnaires was input to SPSS for

Page 33 of 83
analysis. Incomplete questionnaires were excluded. Demographic variables such as
age, gender, monthly expenses, year of service in the organization, and annual
increment were analyzed under descriptive statistic. Factor analyses were performed
to examine the correlations between the EI composite scales and RBPS composite
scales. Regression analysis was performed to prove the validity of the variables of
both EQ-I and RBPS. Multiple linear regression analysis was used to examine the
validation of the hypotheses.
3.6 Limitation
Self-report measures tend to promote bias in reporting where this approach
might invite respondents to provide fake-good responding, to fake their answers in
the questionnaires to promote their good image and hiding their real behavioral
attribute and intention.

Page 34 of 83
CHAPTER 4
DATA ANALYSIS
4.1 Introduction
Data analysis, statistical procedures, and overall results of the current study
are presented in this chapter. The chapter begins with an explanation of the sampling
procedures and descriptive statistics of the demographic variables. The second section
contains the findings of principal components of analyses. The measurement scales of
EQ-I and RBPS measures was assessed by Exploratory factor analysis (EFA) to
confirm the validity and reliability of the variables that could be used to test the
hypotheses proposed in this study. Factor analysis was performed to confirm the first
finding from EFA. This was followed by Kaiser-Mayer-Olkin Test (KMO), Bartlett’s
Test of Sphericity (BTS), Eigenvalue, and Cronbach Alpha. Variables that meet the
acceptable standard of validity were used to test the hypotheses, followed by a
conclusion of the main findings in the last section.
4.2 The Demographics
760 questionnaires were sent to academic staff in 9 colleges and 9 university
colleges in Klang Valley, Selangor. 371 (48.8 per cent response rate) questionnaires
were returned and 3 were not usable. From Table 4.1, 168 of the respondents were

Page 35 of 83
male and 200 were female. In terms of age, the respondents’ age ranged from less
than 30 years old to almost retirement age. 160 (43.5 per cent) of the respondents
were from the age group of 40 to 49, followed by 88 (23.9 per cent) and 84 (22.8 per
cent) of the respondents where age around 30 to 39 and; less than 30. A small portion
of the sample was around 50 to 59 and aged more than 59 namely; 8.7 per cent and
1.1 per cent respectively. 143 (38.9 per cent) of the respondents were in the institution
for 3 to 4 years, 135 (36.7 per cent) for 1 to 2 years, 53 (14.4 per cent) were 5 to 6
years, and the remaining 8 (2.2 per cent) were more than 7 years. Table 8 shows that
113 (30.7 per cent) respondents received 10 per cent and more increment, 104 (28.3
per cent) received 2 per cent to 5.0 per cent increment, 98 (26.6 per cent) received 6
per cent to 9 per cent increment, and 53 (14.4 per cent) received less than 2.0 per cent
increment.
Out of the total respondents, 173 (47.0 per cent) respondents incurred RM3,
001 to RM5, 000 expenses per month. 110 (29.9 per cent) spent RM1, 000 to RM3,
000 per month; 63 (17.1 per cent) spent RM5, 001 to RM10, 000 per month.

Page 36 of 83
Table 4.2: Demographics
Characteristics Percentage
(%)
Gender
Female 54.3
Male 45.7
Age
Less than 30
30 – 39
22.8
23.9
40 – 49 43.5
50 – 59 8.7
More than 59 1.1
Years in Service
Less than 1 year
Between 1 to 2 years
Between 3 to 4 years
7.9
36.7
38.9
Between 5 to 6 years 14.4
More than 7 years 2.2
Monthly Expenses (RM)
Less than RM1,000 5.4
1,000 – 3,000
3,001 – 5,000
5,001 – 10,000
More than 10,000
29.9
47.0
17.1
0.5
Last Increment
Less than 2.0% 14.4
Between 2.0% – 5.0% 28.3
Between 6.0% - 9.0% 26.6
10.0% and above 30.7
Total
Sample size (n)
100.00
(368)

Page 37 of 83
4.3 Normality – Kurtosis & Skewness
All dependent variables were tested to ensure that the assumptions used for
multiple regressions were in place. A distribution of the variables was examined by
the Skewness and kurtosis statistics. The values of Skewness and kurtosis were
assessed to ascertain the normality of the dependent variables. A normal kurtosis
value will be 0. However the value of +/- 1 will be acceptable (Hair, et al., 2006). The
kurtosis value is listed in Table 4.2; this value is within the range of the guideline
given by Hair and others. The Skewness measure of normality described the
symmetry of the distribution of the data around means (Hair, et al., 2006). The
Skewness value for the variables: Intrapersonal, Interpersonal, Stress Management,
Adaptability and General Mood were reported at: 0.437, 0.499, 0.465, -0.219 and
0.041 respectively. As the Skewness values were in within 1 until -1, therefore are
acceptable.
Table 4.3: Independent Variable
Independent Variable Skewness Kurtosis
Intrapersonal
Interpersonal
0.437
0.499
0.353
0.955
Stress Management 0.465 -0.152
Adaptability -0.219 0.61
General Mode 0.041 -0.854

Page 38 of 83
4.4 Validity and Reliability
Cronbach`s alpha reliability test was adopted to test the reliability of this study.
Following is Table 4.3, showing the alpha value according to the rules of thumb.
Table 4.4: Cronbach`s Alpha Value and the Level of Acceptance
Alpha Value Level of Acceptance
> 0.900 Excellent
> 0.800 Good
> 0.700 Acceptable
> 0.600 Questionable
> 0.500 Unacceptable
Note: Adapted from Zikmund, W. G. (2003). Business research Methods. (7th Ed). Thomson South-
Western
Table 4.4 and Table 4.5 show the findings of the reliability analyses for the
EQ-I and Total RBPS measures. In this study, there were 153 items contained in the
questionnaires (Appendix B). Of these 153 items, there were five independent
dependent variables: intrapersonal (32 items), interpersonal (26 items), and stress
management (15 items), adaptability (31 items), and general mood (29 items); and
five dependent variables. A factor analysis was performed to identify the variables.
Kaiser-Mayer-Olkin Test (KMO) was then been conducted to measure the sampling
adequacy.
Results (Table 4.4) derived from the statistical studies shown the alpha value
obtained for Intrapersonal, Interpersonal, Stress Management, Adaptability, General
Mode and Job Performance were at the level of 0.778, 0.875, 0.769, 0.908, 0.910 and
0.974 respectively. Hence, it was confirmed that all the EQ-I composite scales have
met the acceptable standard of reliability analyses and were highly accepted for
statistical test in this study.

Page 39 of 83
Table 4.4: The Results of Validity and Reliability Analyses of the EQ-I
Measure Items
Valid
Factor
Loadings
KMO Bartlett`s
test of
Sphericity
Eigenvalue Variance
Explained
Conbach`s
Alpha
Intrapersonal Skill 5 0.291 – 0.664 0.756 525.902 2.675 53.509 0.778
Interpersonal Skill 9 0.449 – 0.779 0.861 1705.686 1.330 66.169 0.875
Stress Management 3 0.585 – 0.772 0.667 329.727 2.083 69.446 0.769
Adaptability 9 0.395 – 0.881 0.900 2301.228 1.127 70.870 0.908
General Mode 8 0.453 – 0.781 0.898 1842.188 5.002 62.521 0.910
Table 4.4: Item Validity and Reliability Analyses of the Dependent Variable
Measure No of items
Valid
Factor
Loadings
KMO Bartlett`s test of
Sphericity
Eigenvalue Variance
Explained
Conbach`s
Alpha
Total RBPS 20 0.654 – 0.867 0.962 8005.846 1.114 73.092 0.974
4.5 Components Analysis
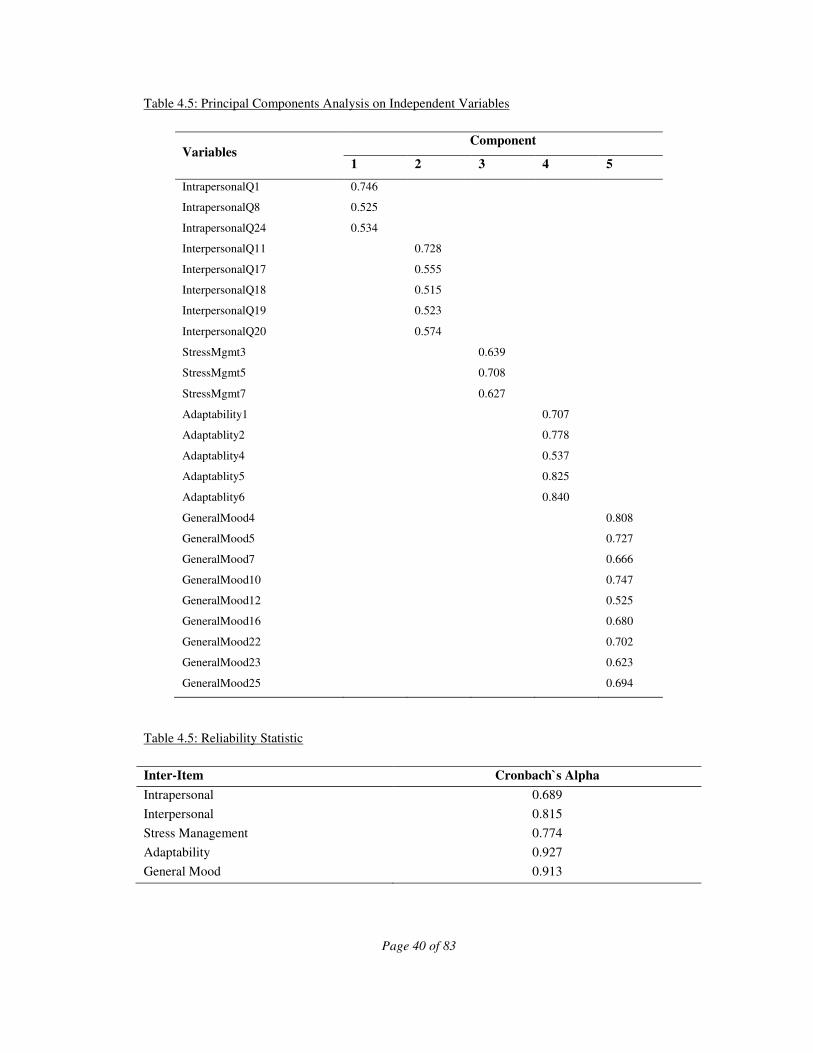
4.5.1 Results from Components Analysis on EQ-I Model
Component analysis, which is known as principal components analysis in
SPSS, was conducted on EQ-I. The rotated method selected was Varimax.
Component analysis is used to summarize most of the original variance in a minimum
number of factors for prediction purpose. Using the 0.50 loading, 29 items were
eliminated from intrapersonal, 21 were eliminated from intrapersonal, 12 were
eliminated from stress management, 26 from adaptability and 20 were eliminated
from general mood. The findings from this analysis are listed in Table 4.6. Results
computed in Table 4.7 listed the Cronbach`s alpha value of the remaining items after
the elimination. Alpha value of 0.60 is questionable but acceptable (Hair et al., 1998).
Hence, these variables (Table 4.8) were acceptable and were retained for hypothesis
testing.
Page 40 of 83
Table 4.5: Principal Components Analysis on Independent Variables
Variables Component
1 2 3 4 5
IntrapersonalQ1 0.746
IntrapersonalQ8 0.525
IntrapersonalQ24 0.534
InterpersonalQ11 0.728
InterpersonalQ17 0.555
InterpersonalQ18 0.515
InterpersonalQ19 0.523
InterpersonalQ20 0.574
StressMgmt3 0.639
StressMgmt5 0.708
StressMgmt7 0.627
Adaptability1 0.707
Adaptablity2 0.778
Adaptablity4 0.537
Adaptablity5 0.825
Adaptablity6 0.840
GeneralMood4 0.808
GeneralMood5 0.727
GeneralMood7 0.666
GeneralMood10 0.747
GeneralMood12 0.525
GeneralMood16 0.680
GeneralMood22 0.702
GeneralMood23 0.623
GeneralMood25 0.694
Table 4.5: Reliability Statistic
Inter-Item Cronbach`s Alpha
Intrapersonal 0.689
Interpersonal 0.815
Stress Management 0.774
Adaptability 0.927
General Mood 0.913

Page 41 of 83
Table 4.5: Remaining Items of EI-Q after Principal Components Analysis
Variables Component
1 2 3 4 5
Intrapersonal My approach in overcoming difficulties is to move step by step. 0.75
I believe that I can stay on top of tough situations. 0.53
When I disagree with someone, I am able to say so. 0.53
Interpersonal I`m good at understanding the way other people feel.
0.73
I have not broken a law of any kind.
0.56
I enjoy those things that interest me.
0.52
I am sensitive to the feelings of others.
0.52
I have good relations with others.
0.57
Stress Management I can handle stress without getting nervous.
0.64
When facing problem, the first thing I do is stop and think.
0.71
I don`t do anything bad in my life.
0.63
Adaptability I`m able to change old habits.
0.71
I believe in my ability to handle most upsetting problems.
0.78
When faced with a difficult situation, I like to collect all the
information about it that I can.
0.54
It`s easy for me to adjust to new conditions.
0.83
I know how to deal with upsetting problem.
0.84
General Mood
I`m optimistic about most things I do.
0.81
I`m fairly cheerful person.
0.73
I am satisfied with my life.
0.67
My friends can tell me intimate things about themselves.
0.75
When trying to solve a problem, I look at each possibility and
then decide on the best way.
0.53
I`m happy with the type of person I am.
0.68
I`m happy with the way I look.
0.70
I like to have fun.
0.62
Looking at both my good points and bad points, I feel good about
myself. 0.69

Page 42 of 83
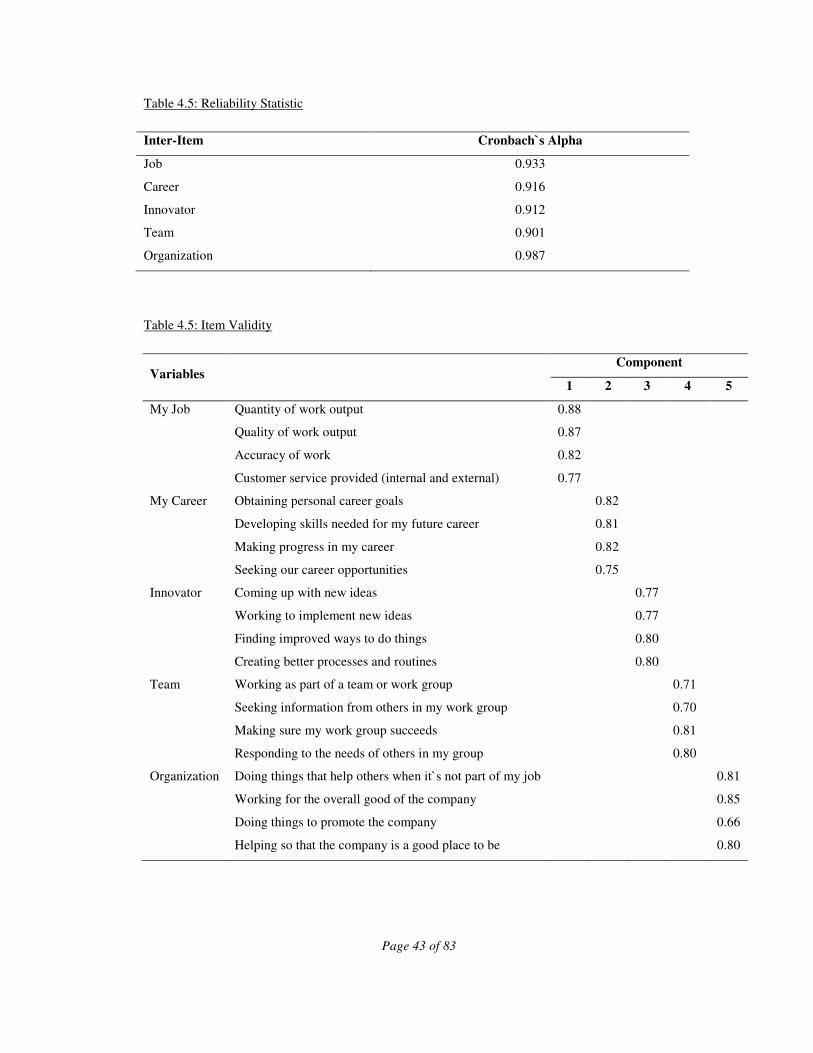
4.5.2 Results from Components Analysis on RBPS Measures
Component analysis, which is known as principal components analysis in
SPSS, was conducted on RBPS measure of performance. The rotated method selected
was Varimaxx. Base on the 0.50 loading criterion, the result are presented as follows
(Table 4.9). Results computed in Table 4.10 shows the Cronbach`s alpha for the
Performance scales for the remaining items which are Job, Career, Innovator, Team
and Organization at 0.933, 0.916, 0.912, 0.901 and 0.987 respectively. Item with
alpha value of 0.80 is good (Hair et al., 1998). With this, these items were acceptable
and were retained (Table 4.11).
Table 4.5: Principal Components Analysis on RBPS Performance Measures
Variables Component
1 2 3 4 5
MyJob1 0.882
MyJob2 0.869
MyJob3 0.817
MyJob4 0.772
MyCareer5 0.823
MyCareer6 0.814
MyCareer7 0.822
MyCareer8 0.748
Innovator9 0.773
Innovator10 0.770
Innovator11 0.797
Innovator12 0.802
Team13 0.705
Team14 0.700
Team15 0.814
Team16 0.795
Organization17 0.809
Organization18 0.850
Organization19 0.660
Organization20 0.804
Extraction Method: Principal Component Analysis.
Rotation Method: Varimax with Kaiser Normalization.
a Rotation converged in 14 iterations.
Page 43 of 83
Table 4.5: Reliability Statistic
Inter-Item Cronbach`s Alpha
Job 0.933
Career 0.916
Innovator 0.912
Team 0.901
Organization 0.987
Table 4.5: Item Validity
Variables Component
1 2 3 4 5
My Job Quantity of work output 0.88
Quality of work output 0.87
Accuracy of work 0.82
Customer service provided (internal and external) 0.77
My Career Obtaining personal career goals
0.82
Developing skills needed for my future career
0.81
Making progress in my career
0.82
Seeking our career opportunities
0.75
Innovator Coming up with new ideas
0.77
Working to implement new ideas
0.77
Finding improved ways to do things
0.80
Creating better processes and routines
0.80
Team Working as part of a team or work group
0.71
Seeking information from others in my work group
0.70
Making sure my work group succeeds
0.81
Responding to the needs of others in my group
0.80
Organization Doing things that help others when it`s not part of my job 0.81
Working for the overall good of the company 0.85
Doing things to promote the company 0.66
Helping so that the company is a good place to be 0.80

Page 44 of 83
4.6 Hypotheses Testing
4.6.1 Results of RBPS Measures by EQ-I Measure
H1: There is a significant relationship between each of the EI composite scales
significant in predicting the performance rating.
From Table 4.12, all EQ-I composite scales have significant correlation with all
composite scales of the performance measures – Role Based Performance Scales; and
Total Role Based Performance Scales.
4.6.1.1 Coefficients Regression of Job Composite Scale of RBPS on EQ-I
Research Hypothesis: H1aa, H1ab, H1ac, H1ad, H1ae (Table: 2.2)
Table 4.13 explained how important each composite scale in EQ-I predicting
Job component of RBPS. The construct are listed: General Mood, Adaptability,
Intrapersonal and Interpersonal and had beta value of 0.419, 0.205, 0.204 and 0.143
respectively. The beta statistic shows that these components are important factors and
predictors in this model. The R-square value was 0.804; showing 80.4 per cent of the
dependent variable can be explained by the independent variables (Table 4.13).
However, Stress Management (b = - 0.008, p = 0.764) seems to be unrelated
to the Job component, however, General Mood (SC Beta = 0.419) is the most
important predictor contributed to the Job Component.

Page 45 of 83
Table 4.6: Correlation of the Components of EQ-I and RBPS
Job Career Innovator Team Org
Total Job Performance
Intrapersonal Interpersonal Stress
Management Adaptability
General Mood
M_MyJob 1.000
M_MyCareer 0.833(**) 1.000
0.000
M_Innovator 0.813(**) 0.840(**) 1.000
0.000 0.000
M_Team 0.780(**) 0.791(**) 0.772(**) 1.000
0.000 0.000 0.000
M_Org 0.840(**) 0.793(**) 0.825(**) 0.830(**) 1.000
0.000 0.000 0.000 0.000
Job
Performance 0.930(**) 0.924(**) 0.921(**) 0.904(**) 0.929(**) 1.000
0.000 0.000 0.000 0.000 0.000
Intrapersonal 0.786(**) 0.726(**) 0.725(**) 0.720(**) 0.745(**) 0.804(**) 1.000
0.000 0.000 0.000 0.000 0.000 0.000
Interpersonal 0.774(**) 0.741(**) 0.700(**) 0.669(**) 0.721(**) 0.784(**) 0.649(**) 1.000
0.000 0.000 0.000 0.000 0.000 0.000 0.000
Stress Management
0.423(**) 0.402(**) 0.436(**) 0.426(**) 0.426(**) 0.458(**) 0.443(**) 0.361(**) 1.000
0.000 0.000 0.000 0.000 0.000 0.000 0.000 0.000
Adaptability 0.834(**) 0.773(**) 0.778(**) 0.775(**) 0.808(**) 0.862(**) 0.777(**) 0.753(**) 0.509(**) 1.000
0.000 .000 0.000 0.000 0.000 0.000 0.000 0.000 0.000
General Mood 0.876(**) 0.808(**) 0.809(**) 0.782(**) 0.833(**) 0.892(**) 0.797(**) 0.831(**) 0.441(**) 0.877(**) 1.000
0.000 0.000 0.000 0.000 0.000 0.000 0.000 0.000 0.000 0.000
** Correlation is significant at the 0.01 level (2-tailed).

Page 46 of 83
Table 4.6: Regression Analysis of the Job Component of RBPS on EQ-I
R R2 Ajd. R2 Standard Error
Model 0.897 0.804 0.802 0.508
SS df MS F Sig.
Regression 384.524 5.000 76.905 297.830 0.000
Residual 93.475 362.000 0.258
Total 477.998 367.000
SC Beta t,Tolerance Sig, VIF
Intrapersonal 0.204 5.058 0.000
Interpersonal 0.143 3.397 0.001
Stress Management -0.008 -0.300 0.764
Adaptability 0.205 3.920 0.000
General Mood 0.419 6.783 0.000
Dependent Variable: Job

Page 47 of 83
4.6.1.2 Coefficients Regression of Career Component of RBPS on EQ-I
Research Hypothesis: H1ba, H1bb, H1bc, H1bd, H1be (Table: 2.2)
Table 4.14 explained how important each composite scale in EQ-I predicting
Career component of RBPS. The construct are listed: General Mood, Interpersonal,
Intrapersonal and Adaptability and had beta value of 0.309, 0.221, 0.192 and 0.189
respectively. The beta statistic shows that these components are important factors and
predictors in this model. The R-square value was 0.696; showing 69.6 per cent of the
dependent variable can be explained by the independent variables (Table 4.14).
However, Stress Management (b = 0.007, p = 0.812) seems to be unrelated to
the Career component, however, General Mood (SC Beta = 0.302) is the most
important predictor contributed to the Job Component.
Table 4.6: Regression Analysis of the Career Component of RBPS on EQ-I
R R2 Ajd. R2 Standard Error
Model 0.834 0.696 0.692 0.577
SS df MS F Sig.
Regression 277.515 5.000 55.503 165.782 0.000
Residual 121.196 362.000 0.335
Total 398.712 367.000
SC Beta t,Tolerance Sig, VIF
Intrapersonal 0.192 3.822 0.001
Interpersonal 0.221 4.222 0.001
Stress Management 0.008 0.238 0.812
Adaptability 0.189 2.897 0.004
General Mood 0.302 3.919 0.001
Dependent Variable: Career

Page 48 of 83
4.6.1.3 Coefficients Regression of Innovator Component of RBPS on EQ-I
Research Hypothesis: H1ca, H1cb, H1cc, H1cd, H1ce (Table: 2.2)
Table 4.15 explained how important each composite scale in EQ-I predicting
Innovator component of RBPS. The construct are listed: General Mood, Adaptability
and Intrapersonal and had beta value of 0.408, 0.204 and 0.167 respectively. The beta
statistic shows that these components are important factors and predictors in this
model. The R-square value was 0.688; showing 68.8 per cent of the dependent
variable can be explained by the independent variables (Table 4.15).
However, Interpersonal (b = 0.093, p = 0.131) and Stress Management (b = -
0.043, p = 0.732) seems to be unrelated to the Innovator component, however,
General Mood (SC Beta = 0.419) is the most important predictor contributed to the
Innovator Component.
Table 4.6: Regression Analysis of the Innovator Component of RBPS on EQ-I
R R2 Ajd. R2 Standard Error
Model 0.829 0.688 0.684 0.567
SS df MS F Sig.
Regression 256.417 5.000 51.283 159.602 0.000
Residual 116.318 362.000 0.321
Total 372.735 367.000
SC Beta t,Tolerance Sig, VIF
Intrapersonal 0.167 3.284 0.001
Interpersonal 0.081 1.516 0.131
Stress Management 0.049 1.440 0.151
Adaptability 0.204 3.098 0.002
General Mood 0.408 5.231 0.001
Dependent Variable: Innovator

Page 49 of 83
4.6.1.4 Coefficients Regression of Team Component of RBPS on EQ-I
Research Hypothesis: H1da, H1db, H1dc, H1dd, H1de (Table: 2.2)
Table 4.16 explained how important each composite scale in EQ-I predicting
Team component of RBPS. The construct are listed: General Mood, Adaptability and
Intrapersonal and had beta value of 0.307, 0.298 and 0.197 respectively. The beta
statistic shows that these components are important factors and predictors in this
model. The R-square value was 0.660; showing 66 per cent of the dependent variable
can be explained by the independent variables (Table 4.16).
Interpersonal (b = 0.058, p = 0.367) and Stress Management (b = 0.029, p =
0.354) seems to be unrelated to the Team component, however, General Mood (SC
Beta = 0.307) is the most important predictor contributed to the Team Component.
Table 4.6: Regression Analysis of the Team component of RBPS on EQ-I
R R2 Ajd. R2 Standard Error
Model 0.812 0.660 0.655 0.589
SS df MS F Sig.
Regression 244.156 5.000 48.831 140.609 0.000
Residual 125.717 362.000 0.347
Total 369.872 367.000
SC Beta t,Tolerance Sig, VIF
Intrapersonal 0.197 3.706 0.001
Interpersonal 0.050 0.902 0.367
Stress Management 0.033 0.927 0.354
Adaptability 0.298 4.334 0.001
General Mood 0.307 3.769 0.001
Dependent Variable: Team

Page 50 of 83
4.6.1.5 Coefficients Regression of Organization Component of RBPS on EQ-I
Research Hypothesis: H1ea, H1eb, H1ec, H1ed, H1ee (Table: 2.2)
Table 4.17 explained how important each composite scale in EQ-I predicting
Organization component of RBPS. The construct are listed: General Mood,
Adaptability and Intrapersonal and had beta value of 0.393, 0.266 and 0.166
respectively. The beta statistic shows that these components are important factors and
predictors in this model. The R-square value was 0.731; showing 73.1 per cent of the
dependent variable can be explained by the independent variables (Table 4.17).
Interpersonal (b = 0.093, p = 0.100) and Stress Management (b = 0.013, p =
0.651) seems to be unrelated to the Organization component, however, General Mood
(SC Beta = 0.393) is the most important predictor contributed to the Organization
Component.
Table 4.6: Regression Analysis of the Organization Component of RBPS on EQ-I
R R2 Ajd. R2 Standard Error
Model 0.855 0.731 0.727 0.522
SS df MS F Sig.
Regression 267.767 5.000 53.553 196.626 0.001
Residual 98.595 362.000 0.272
Total 366.363 367.000
SC Beta t,Tolerance Sig, VIF
Intrapersonal 0.166 3.520 0.001
Interpersonal 0.081 1.647 0.100
Stress Management 0.014 0.453 0.651
Adaptability 0.266 4.334 0.001
General Mood 0.393 5.433 0.001
Dependent Variable: Organization

Page 51 of 83
4.6.1.6 Coefficients Regression - Total RBPS on EQ-I
Research Hypothesis: H1fa, H1fb, H1fc, H1fd, H1fe (Table: 2.2)
Table 4.18 explained how important each composite scale in EQ-I predicting
Total RBPS. The construct are listed: General Mood, Adaptability, Intrapersonal and
Interpersonal; and had beta value of 0.397, 0.251 and 0.201 and 0.127 respectively.
The beta statistic shows that these components are important factors and predictors in
this model. The R-square value was 0.842; showing 84.2 per cent of the dependent
variable can be explained by the independent variables (Table 4.18).
Stress Management (b = 0.017, p= 0.409) seems to be unrelated to the Job
component, however, General Mood (SC Beta = 0.397) is the most important
predictor contributed to the Total RBPS.
Table 4.6: Regression Analysis of the Total RBPS on EQ-I
R R2 Ajd. R2 Standard Error
Model 0.917 0.842 0.839 0.384
SS df MS F Sig.
Regression 283.209 5.000 56.642 384.585 0.000
Residual 53.316 362.000 0.147
Total 336.524 367.000
SC Beta t,Tolerance Sig, VIF
Intrapersonal 0.201 5.554 0.001
Interpersonal 0.127 3.357 0.001
Stress Management 0.020 .827 0.409
Adaptability 0.251 5.344 0.001
General Mood 0.397 7.146 0.001
Dependent Variable: Total RBPS (Job Performance)

Page 52 of 83
4.6.2 Results of Total RBPS Measures on Total EQ-I:
H2: There is a significant relationship between overall EI competencies and
overall Job Performance.
Table 4.19 explained how important Total EQ-I predicting Total RBPS. The
construct had beta value of 0.910. The beta statistic shows that these components are
important factors and predictors in this model. The R-square value was 0.829;
showing 82.9 per cent of the dependent variable can be explained by the independent
variable (Table 4.19).
Table 4.6: Regression Analysis of the Total RBPS on EQ-I
R R2 Ajd. R2 Standard Error
Model 0.910 0.829 0.828 0.397
SS df MS F Sig.
Regression 278.865 1 278.865 1770.132 0.001
Residual 53.316 362 0.147
Total 336.524 367
SC Beta t,Tolerance Sig, VIF
Total EI 0.910 42.073 0.001
Dependent Variable: Total RBPS (Job Performance)

Page 53 of 83
4.6.3 Summary of the Results
This section explained the result derived from the hypotheses 1 (H1) and
hypotheses 2 (H2).
Table 4.20 showing the relationship of the composite scales between EI
components and Job Performance components. The regression revealed that overall
EI were the significant predictor of the Total RBPS.
In detail, General Mood is the most significant important predictor contributed
to the Total RBPS, Job, Career, Innovator, Team and Organization component of
RBPS. However, Stress Management is unrelated not contributing to predict RBPS.
Table 4.6: Significant Relationship between EQ-I & RBPS(Job Performance Measure)
EI Composite Scale
Job Performance Composite Scales Related Not Related
Job General Mood
Intrapersonal
Adaptability
Interpersonal
Stress Management
Career General Management
Interpersonal
Intrapersonal
Adaptability
Stress Management
Innovator General Mood
Adaptability
Intrapersonal
Stress Management
Interpersonal
Team General Mood
Adaptability
Intrapersonal
Interpersonal
Stress Management
Organization General Mood
Adaptability
Intrapersonal
Interpersonal
Stress Management
Total Job Performance General Mood
Adaptability
Intrapersonal
Interpersonal
Stress Management

Page 54 of 83
CHAPTER 5
DISCUSSION AND CONCLUSION
5.1 Introduction
The chapter provides an summary of the study`s results and recommends directions
for future research.
5.2 Overview of the Study
Scholars and literature proposed that EI is significantly related and contributed
to organizational outcomes and one`s performance (Goleman, 1995; George, 2000;
Petrides & Furnham, 2001; Manley, 2009). This study was built to study whether EI
could predict job performance, in a sample of academic staff in university colleges
and colleges in the private higher education sector in Malaysia. In addition, this study
initially sought to determine if EI and the EI composite scales are predictive of job
performance. The Emotional Quotient Inventory (EQ-I; Bar-On, 1997) was used to
assess overall EI as well as the following five composite scales: Intrapersonal,
Interpersonal, Stress Management, Adaptability and General Mood. Multiple
regression analysis was conducted to determine the predictor variables (overall EI and

Page 55 of 83
the five EI composite scales) predicted the criterion variable (job performance
measures).
The results of this study provide evidence that most of the EI components
proposed in this study are significantly related to job performance, except the Stress
Management component of EI. These results support the work of several studies that
proposed EI as important predictor to job performance (Goleman, 1995; George,
2000; Law et al., 2004; Daus & Ashkanasy, 2005; Manley, 2009).
5.3 Main Findings
5.3.1 Discussion for Hypothesis 1
H1: There is a significant relationship between each of the EI composite scales,
significant in predicting the Job Performance composite scales.
One hundred and thirty three (133) items of EQ-I was analyzed using
components analysis on five composite scales of EQ-I: Intrapersonal, Interpersonal,
Stress Management, Adaptability and General Mood. In order to determine if EI has
significant relationship with each composite scale in job performance measures,
bivariate correlation analysis was performed to evaluate the degree of relationship
between measured components/ variables (Figure 4.6). As a result of which, it
revealed that each of the EI composite scales (intrapersonal, interpersonal, stress
management, adaptability and general mood) were significant correlated to all five
components of job performance measures (job, career, innovator, team and
organization). Multiple linear regressions were executed to identify the relationship
between the predictor variables and the response variable. Table 5.1 showing the rule
of thumb of the r value indication.

Page 56 of 83
Table 5.3: Correlation Coefficient Indication between Variables
Correlation coefficient, r Relationship/Strength between variables
r = -1.00 or 1.00 Strength of the linear relationship
+ or - Direction of the relationship
0.000 < r < 0.500 Weak
0.500 ≤ r ≤ 0.900 Strong
> 0.900 Extremely strong
Note: Adapted from Hair, J. J. F., Black, W. C., Babin, B. J., Anderson, R. E., & Tatham, R. L. (2006).
Multivariate data anlysis (6th ed.): Pearson Prentice Hall.
From the findings in Chapter 4, Stress Management was found weakly
correlated to Job component of RBPS with r = 0.423; Career component of RBPS
with r = 0.402; Innovator component of RBPS with r = 0.436; Team component of
RBPS with r = 0.426; Organization component of RBPS with r = 0.426; and total
RBPS, r = 0.458.
Job, Career, Innovator, Team and Organization component with their r value
reported at 0.423, 0.402, 0.436, 0.426 and 0.426 respectively. Meanwhile, overall
RBPS was reported at 0.458. Alternatively, Stress Management was found to have a
weak relationship at r = 0.361. The relationship between Stress Management and
Total RBPS was reported at 0.458. Therefore, it is insufficient evidence to reject the
hypothesis.
Of the five EQ-I components, General Mood (Optimism and Happiness) was
highly correlated with RBPS components and Total RBPS. This finding corroborates
the finding of Dulewicz and Higgs (1999); Higgs (2004); Judge and Erez (2007); Law
et al (2008); and Crow (2008). Individuals with high level of General Mood perform
better as they themselves are instructed to feel good and optimistic. They tend to be
positive and to be confident that they can confidently influence the future, enhance
job competencies and performance. Hence, these results demonstrated that General
Mood has significant relationship with job performance components (Job, Career,
Innovator, Team and Organization) and Total RBPS.

Page 57 of 83
Adaptability was found highly significant and correlated to Job, Career,
Innovator, Team and Organization component of RBPS with their r value reported at
0.834, 0.773, 0.778, 0.775 and 0.808 respectively. Meanwhile, overall RBPS was
reported at 0.862. Therefore, it is sufficient evidence to reject the hypothesis. These
findings corroborate with the finding of Kenneth et al (2008). People with this
characteristic tend to be capable to reduce self-anxiety, flexible, very good at complex
problem solving (Bar-On, 2006; Crow, 2008).
Intrapersonal was found highly significant and correlated to Job, Career,
Innovator, Team and Organization component of RBPS with their r value reported at
0.786, 0.726, 0.725, 0.720 and 0.745 respectively. Meanwhile, overall RBPS was
reported at 0.804. Therefore, it is sufficient evidence to reject the hypothesis. People
with this characteristic bring themselves both consciously and cognitively (Dulewicz
and Higgs, 1999). They are independent and have strong ability to recognize
themselves as an individual who are able to separate from the environment and other
individuals (Dulewicz and Higgs, 1999; Bar-On, 2006; Judge and Erez, 2007; Crow,
2008).
Interpersonal was correlated significantly with Job, Career, Innovator, Team
and Organization component with their r value reported at 0.774, 0.741, 0.700, 0.669
and 0.721 respectively. Meanwhile, overall RBPS was reported at 0.784. Therefore, it
is sufficient evidence to reject the hypothesis.
From the findings from Chapter 4 and listed above, there is sufficient
evidence to support the hypothesis, H1 that components of EQ-I is a good predictor
of each components of RBPS, except for Stress Management component of EQ-I.

Page 58 of 83
5.3.2 Discussion for Hypothesis 2
H2: There is a significant relationship between overall EI competencies and
overall Job Performance.
There are many schools of thoughts on this area where most of them
eventually proved that the achievement and productivity of the organizational is a
result of good performance from its quality staff. A number of researches have been
carried out through various series of performance and competencies measures,
measuring the EI of staff that linked to their satisfaction and commitment at the
workplace, and their job performance. They are very successful person, and they
perform well because they do what is right, and they know what to do (Lawler et al.,
2001, Kunnanatt, 2008; Schumacher et al., 2009; Shahzad et al., 2011; Bazerman &
Tenbrunsel, 2013).
Hence, from the findings, the regression analysis revealed that overall EI
components (EQ-I) was a good predictor of the Total RBPS. They are inter-related.
For hypotheses two, H2; there is sufficient evidence to support the hypothesis.
5.4 Implications of the Findings
5.4.1 Implications for Employees and Employers
EI has received considerable attention in management, human resources, and
organizational behavior and commitment literature in recent years. Many of them
highlighted the importance of EI as a predictor in important spheres such as job
performance, academic performance, sales performance and etc (Welbourne, 1998;
Bar-On, 2005).

Page 59 of 83
The relationship between the emotional intelligence as described in this study
and, work performance would have important implications for not only individuals
but also organizations in their capacity as employers. Many organizations especially
the multi-national corporations are realigning their HR policies and career
development stratagems to favor an emotionally intelligent workplace (Manley, 2009;
Molefe, 2010). Once researchers are able to establish a list of personality traits that
are related to EI, individuals will then have the opportunity to learn how to modify
their personality as well as control their emotions to enhance their job performance.
At the same time, organizations would be able to benefit by recruiting or head
hunting individuals or experts with good profiles that may render them as ideal
employees (Law et al., 2004; Law et al., 2008).
5.4.2 Implication on Educational Perspective
Analyses documented in this study demonstrate that all EI components
exhibited substantial relative importance in the presence of EQ-I model when
predicting job performance. According to William`s study (as cited in Manley, 2009),
Education is not the filling of a pail, but the lighting of a fire. As EI is closely linked
to thinking, self-management and relating to others, hence, this study will form a base
and foundation for future discussion on how academics can perform at their work
place with high level of EI that will contribute to their job performance and at the
same time, to enhance the academic performance of their students (Davies et al., 1998;
Goleman, 2001; Manley, 2009; Molefe, 2010). Also, this study has the potential to
inform and equip the leadership in private higher educational institutions in Malaysia
by installing EI models proposed in this study to formulate policy on performance
evaluation frameworks for academic staff.
Many studies have shown that having high level of EI does not necessarily
translate into a successful future but there is a need for people to understand and
manage their emotions as well as to incorporating EI principles into teaching and
lifelong learning (Merriam & Caffarella, 1999; Manley, 2009; Molefe, 2010). For

Page 60 of 83
instance, children who have an understanding of the role that emotions play in their
life will have a better foundation on which to build successful futures. Hence, the
responsibility now lies with academics to point to students the link between good
emotional intelligence and academic performance. According to Arreola (Arreola`s
study as cited in Molefe, 2010), a teacher who can develop relationships that foster
and encourage student engagement will enhance learning and academic performance.
In the changing environment, educational institutions are being challenged to
develop and offer the EI programmes for staff and students (Manley, 2009). This is
mainly to train and build them to “attain skills that could enable them to handle their
emotion, build their personal behavior, develop their sense of caring and responsible
for others and handle challenging situations effectively and efficiently; and eventually
create quality outcomes (Manley, 2009). Therefore, the findings from this study show
that EI can be taught and has positive effects on student learning and well-being and
also has positive effects on staff morale and self-esteem. ‘It is precisely because EI is
so significant and important that it should not be allowed to be reduced to a bolt-on,
sound bite, and commercially driven business opportunity’ (Molefe, 2010).
5.5 Limitations of the Study
5.5.1 Effects of Questionnaire Length
There is a lot of debate on whether the questionnaire length could affect the
response rate. According to Hogan et al. (1996), one prominent feature of survey that
has often been assumed to affect respondent participation is the length of the survey
questionnaire. In this study, 133-item Bar-On Emotional Quotient Inventory (EQ-I)
was adopted for the EI measurement. This created an invisible restriction, which
could directly or indirectly affects the validity of the respondents ` feedback.

Page 61 of 83
5.5.2 Construct of Emotional Intelligence
The findings of many recent studies revealed that there is still no clear
consensus regarding how emotional intelligence and job performance measurement
should be defined and operationalized. This is due to the large variations in EI and
performance conceptualizations and measuring these dimensions can be difficult or
could bring the researcher to the dead lock (Caruso et al., 2002). Many EI
assessments have been designed within the past two decades; some of the definitions
and measurements are not an exact science and needed constant examination and
assessment (Dulewicz and Higgs, 2000). Hence, the findings and conclusion of this
study will be constrained by the accuracy of the EQ-I.
5.5.3 Self-Report
In this study, EI was examined via a self-report measure. The limitation of
self-report assessments is that the self-report bias may obscured the findings of this
study as the survey responses may not always reflect the respondents` actual behavior.
According to McClelland (1973), people tend to react to situations spontaneously
without clear defined options. Hence, self-report assessments may lead to inaccuracy
response of how people actual react and behave in real-life situations.
5.6 Recommendations
5.6.1 Performance Measurement System
The study may prove to be useful to HR personnel in the rapidly growing
private sector of higher education to develop policies to use EI positively to improve
job performance. It could also help to assist academic leaders in this sector to identify

Page 62 of 83
and formulate staff development programmes. In addition, literature review has
discovered that the absence of a performance culture and a reliable system of
managing performance in the organization often find it extremely difficult to fairly
reward good performers (Molefe, 2010).
5.6.2 Length of the EQ-I measure
Length affects non-response by the way of the respondents' assertiveness and
behavior. Increased length adds to the burden on respondents and pushes more of
them over a brink beyond which they will no longer cooperate and will affect the
validity of the response (Burchell and Marsh, 1992). However, short questionnaire
will help to ensure quality response and encourage more motivated and responsive
respondents (Cape, 2010).
5.7 Conclusion
The purpose of this study was to determine the importance of EI and its effect
on job performance of academic staff in private higher educational institutions. The
findings have demonstrated that EI is a predictor of several variables, including job
performance (Douglas et al., 2004; Higgs, 2004; Bar-On, 2006; Judge and Erez, 2007;
Crow, 2008). The survey conducted for the purpose of this study is instructive to
private higher educational institutions in that they will be able to enhance job
performance of academic staff by factoring in EI in recruitment and HR management.
However, further investigation and evaluation is essential.
The overall results indicated that EI and the EI composite scale of General
Mood, Adaptability, Intrapersonal and Interpersonal predict job performance
components based on RBPS performance measure. These findings are essentially
important because the models or the proposed measurement could be utilized for
recruitment, career advice and personal development (Bar-On, 2005; Bar-On, 2006).

Page 63 of 83
Looking further, the world of higher education nowadays has dominated by
higher educational institutions who aimed at keeping the management and
administration of the institutions flexible and efficient, with quality and performing
manpower (Lucas, 1996; Day & Carroll, 2004). The trend of institutions recognizing
their staff as their most significant asset, the awareness on the importance of EI and
job performance ratings is on the rise.
Goleman states that individuals are born with a general emotional intelligence
that would determine their potential for learning emotional competencies and thus,
the need for people to understand, relate, respect and interact with others (Manley,
2009). Hence, adopting the EI programme in order to lift their standard of education
from ‘one of mediocrity to being innovative’, should be introduced and embedded to
the HR policy for academic staff, and to the educational curriculum structure for
students. This would show positive short term and long term personal benefits, for
both academic staff and students.

Page 64 of 83
References
Abraham, A. (2006). The need for the integration of emotional intelligence skills in
business education. Business Renaissance Quarterly. Vol. 1, Issue. 3; p. 65
Afolabi, O. A., & Awosola, R. K., & Omole, S. O. (2010). Influence of emotional
intelligence and gender on job performance and job satisfaction among
Nigerian policemen. Journal of Social Science. Vol. 2, Issue. 3; p. 147-154
Allworth, E., & Hesketh, B. (1999). Construct-oriented biodata: capturing change-
related and contextually relevant future performance. International Journal of
Selection and Assessment. Vol. 7; p. 97-111.
Amin. M., & Ismail. W. K. W., & Rasid. S. Z. A., & Selemani, R. D. A. (2013). The
impact of human resource management practices on performance: Evidence
from a public university. The TQM Journal. Vol. 26, Iss: 2; p.125-142
Ariss, S.S., &Timmins, S. A. (2009). Employee Education and Job Performance:
Does Education Matter?. International Personnel Management Association.
Vol: 18, Iss: 1; p. 1+. Retrieved 14 April, 2013, from
http://www.questia.com/read/1G1-7519601/employee-education-and-job-
performance-does-education
Bar-On, R. (2005). The Bar-On Model of Emotional-Social Intelligence (ESI).
Retrieved July 11, 2013,
http://www.ressourcesetmanagement.com/Article%20prof%20%20Baron%20
Bar-On, R. (2006). The Bar-On model of emotional-social intelligence. Psicothema.
Vol.18; p. 13-25.

Page 65 of 83
Barker, S. A. (2002). Utilizing cross-cultural curricula to improve interpersonal job
skills Training. Journal of European Industrial Training. Vol. 26, Issue. 1; p.
38-52
Barrick, M. R., & Stewart, G. L., & Piotroeski, M. (2002). Personality and job
performance: test of the mediating effects of motivation among sales
representatives. Journal of Applied Psychology. Vol.78, Issue. 1; p. 43-51
Bazerman, M. H., & Tenbrunsel, A. E. (2013). Why We Fail to Do What's Right and
What to Do about It.Princeton, NJ: Princeton University Press. Retrieved
April 16, 2014, from http://www.questia.com/read/120940742.
Brackett, M.A., & Mayer, J. D. (2003). Convergent, discriminant and incremental
validity of competing measures of emotional intelligence. Personality and
Social Psychology Bulletin. Vol. 29, Iss. 9; p. 1147-58
Bok, D.C. (5th
ed). (2005). Universitites in the marketplace: The commercialization of
higher education. New Jersey: Priceton
Burchell, B., & Marsh, C. (1992) "The Effect of Questionnaire Length on Survey
Response," Quality and Quantity. Vol. 26,p. 233-244
Cape, P. (2010). Questionnaire Length, Fatigue Effects and Response Quality
Revisited. Retrieved November 25, 2013, from
http://www.surveysampling.com/ssimedia/Corporate/white_papers/SSI_Quest
ionLength_WP.image
Cascio, W.F. (1998), Applied Psychology in Human Resource Management, 5th ed.,
Prentice-Hall, Upper Saddle River, NJ.

Page 66 of 83
Caruso, D. R., & Mayer, J. D., & Salovey, P. (2002). Relation of an ability measure
of emotional intelligence to personality. Journal of Personality Assessment.
Vol. 79, Iss: 2; p. 306-320.
Chand, M. and Katou, A. (2007), “The impact of HRM practices on organizational
performance in the Indian hotel industry”, Employee Relations, Vol. 29 No. 6,
pp. 576-594.
Christine, T. Y., & Sprinkle, J. E. (2013). College student perceptions and ideals of
advising: an exploratory analysis. College Student Journal. Vol. 47, Iss:2.
Retrieved January 2, 2014, http://www.questia.com/read/1G1-337070496.
Coaldrake, P., & Stedman, L.(1st ed) (1998). On the brink: Australia`s universities
confronting their future. Australia: McPherson`s Printing Group.
Conte, J. M. (2005). A review and critique of emotional intelligence measures.
Journal of Organizational Behavior. Vol. 26, Issue. 4; p. 433
Crow, G. (2008). Enhancing IQ with EQ at StepStone. Strategic HR Review. Vol: 7,
Iss:1; p. 4-9.
Davies, M., & Stankov, L., & Roberts, R. D. (1998). Emotional intelligence: in search
of an elusive construct. Journal of Personality and Social Psychology. Vol.
75, Iss. 4; p. 989-1015
Day, A. L., & Carroll, S. A. (2004). Using an ability-based measure of emotional
intelligence to predict individual performance, group performance, and group
citizenship behaviours. Personality and Individual Difference. Vol. 34;
p.1443-1458

Page 67 of 83
Daus, C. S., & Ashkanasy, N. M. (2005). The case for the ability-based model of
emotional intelligence in organization behavior. Journal of Organizational
Behaviour. Vol. 26, Iss. 4;453-466
Dewe, P., & O`Driscoll, M. (2002). Stress management interventions: what do
managers actually do? Personal Review. Vol. 31, Issue. 2; p. 143-165 2002
Douglas, C., & Frink, D., & Ferris, G. (2004). Emotional Intelligence as a Moderator
of the Relationship between Conscientiousness and Performance. Journal of
Leadership & Organizational Studies. Vol. 10, Iss. 3; p. 2.
Dries, N., & Pepermans, R. (2007). Using emotional intelligence to identify high
potential: a metacompetency perspective. Leadership & Organization
development Journal. Vol. 28, No. 8; p. 749-770
Dulewicz, V., & Higgs, M. (1999). Can emotional intelligence be measured and
developed? Leadership & Organization Development Journal. Vol. 20; Iss.5;
p. 242-252.
Dulewicz, V., & Higgs, M. (2000). Leadership at the top: The need for emotional
intelligence: Content, construct, and criterion-related validity. Journal of
Managerial Psychology. Vol. 18; p. 405-420.
Frels, R. K., & Onwuegbuzie, A. J. (2013). Administering Quantitative Instruments
with Qualitative Interviews: A Mixed Research Approach. Journal of
Counseling and Development. Retrieved April 16, 2014,
http://www.questia.com/read/1G1-325495868.
George, J. M. (2000). Emotion and leadership: The role of emotional intelligence.
Human relations, Vol. 53, Iss. 8; p. 1027-55.

Page 68 of 83
Goldenberg, I., & Matheson, K., & Mantler, J. (2006). The assessment of emotional
intelligence: a comparison of performance-based and self-report
methodologies”. Journal of Personality Assessment. Vol. 86, Iss. 1; p. 33-45.
Goleman, D. (1995), Emotional Intelligence: Why It Can Matter More Than IQ,
Bantam Books, New York, NY
Goleman, D. (2001). An EI-based theory of performance, in C Cherniss & D
Goleman (Eds). The Emotionally Intelligent Workplace. Jossey-Bass, San
Francisco.p. 27-44
Hair, J. J. F., Black, W. C., Babin, B. J., Anderson, R. E., & Tatham, R. L. (2006).
Multivariate data anlysis (6th ed.): Pearson Prentice Hall.
Higgs, M. (2004). A study of the relationship between emotional intelligence and
performance in UK call centres. Journal of Managerial Psychology. Vol. 19,
Iss. 4; p. 442.
Hunt, J. W., & Baruch, Y. (2003). Developing top managers: the impact of
interpersonal skills training. Journal of Management Development. Vol: 22,
Issue. 8; p. 729-752
Hogan, J., & Holland, B., & Roberts, B. W. (1996). Personality measurement and
employment decisions: Questions and answers. American Psychologist. Vol.
51, Iss: 5; p. 469-477.
Holt, S., & Jones, S. (2005). Performance Improvement. Vol. 44, Iss. 10; p. 15
Jones, R. P., & Lyu, J., & Runyan, R., & Fairhurst, A., & Kim, YK., & Jolly, L.
(2014). Cross cultural consensus: development of the universal leadership

Page 69 of 83
model. International Journal of Retail & Distribution Management. Vol. 42,
Iss: 4; p.240 – 266
Judge, T. A., & Erez, A. (2007). Interaction and intersection: the constellation of
emotional stability and extraversion in predicting performance. Personnel
Psychology. Vol. 60, Iss. 3; p. 573.
Juniper, D. (2003). Leisure counselling in stress management. Work Study. Vol. 52,
Issue. 1; p. 7-12
Katsaros, K. K., & Tsirikas, A. N., Nicolaidis, C. S. (2014). Managers' workplace
attitudes, tolerance of ambiguity and firm performance: The case of Greek
banking industry. Management Research Review. Vol. 37, Iss: 5; p.442 – 465
Krejcie, R. V., & Morgan, D. W. (1970). Determing sample size for research
activities. Educational and Psychological Measurement. Vol. 30; p. 607-610
Kunnanatt, J. T. (2008). Emotional intelligence: theory and description A competency
model for interpersonal effectiveness. Career Development International. Vol.
13, Iss. 7; p. 614-629.
Lam, L. T., & Kirby, S. L. (2002). Is emotional intelligence an advantage? An
exploration of the impact of emotional general intelligence on individual
performance. The Journal of Social Psychology. Vol. 142, Issue.1; p. 133
Law, K. S., & Wong, C. S., & Song, L. J. (2004). The construct criterion validity of
emotional intelligence and its potential utility for management studies.
Journal of Social Psychology. Vol. 89, Iss. 3; p. 483-496
Law, K. S., & Wong, C. S., & Huang, G. H., & Li, X. (2008). The effects of
emotional intelligence on job performance and life satisfaction for the
Page 70 of 83
research and development scientists in China. Asia Pacific Journal of
Management. Vol. 25, Iss. 1; p. 51
Lawler, E. E., & Mohrman, S. A., & Benson, G. (2001). Organizing for High
Performance: Employee Involvement, TQM, Reengineering, and Knowledge
Management in the Fortune 1000: The CEO Report (San Francisco: Jossey-
Bass, 2001), 214, http://www.questia.com/read/117451355.
Lenaghan, J. A., & Buda. R., & Eisner, A. B. (2007). An Examination of the Role of
Emotional Intelligence in Work and Family Conflict. Journal of Managerial
Issues.. Vol. 19, Iss. 1; p. 76
Liptak, J. (2005). Using emotional intelligence to help college students succeed in the
workplace. Journal of Employment Counseling. Vol. 42, Iss. 4; p. 171
Lucas, C. J. (1996). Crisis in the academy: Rethinking higher education in
America.(1st Ed). St Martin`s Press: NY
McDonald, J. D. (2008). Measuring Personality Constructs: The Advantages and
Disadvantages of Self-Reports, Informant Reports and Behavioral
Assessments. Enquire. Vol. 1, Iss:1
Malaysia Educational Blue Print. (2012). Malaysia Educational Blue Print 2013 –
2015. Retrieved April 16, 2014, from
http://www.moe.gov.my/userfiles/file/PPP/Preliminary-Blueprint-Eng.pdf
Manley, G. (2009). Emotional Intelligence and Academic Achievement: What
relevance and implications does this psychological construct called ‘emotional
intelligence’ have for education in New Zealand? Sabbatical Report Term 1.

Page 71 of 83
McClelland, D. C. (1973). Testing for competence rather than for “intelligence”.
American Psychology. Vol. 28; p. 1-14.
McEnrue, M. P., & Groves, K. S., & Shen, W. (2009). Emotional intelligence
development: leveraging individual characterictics. Journal of Management
Development. Ol. 28, No. 2; p. 150-174
Merriam, S., & Caffarella, R. (1999). Learning in adulthood : A comprehensive guide
[Electronic version]. San Francisco: Jossey-Bass. Retrieved December 8,
2005, from the Phoenix Public Netlibrary
Meyer, B. B., & Fletcher, T. B. (2007). Emotional intelligence: a theoretical overview
and implications for research and professional practice in sport psychology.
Journal of Applied Sport Psychology. Vol. 19, Iss. 1; p. 1-15
Molefe, G. N. (2010). Performance measurement dimensions for lecturers at selected
universities: An international perspective. Journal of Human Resource
Management.Vol. 8, Iss: 1; p. 1-13.
Morris, J. A., & Urbanski, J., & Fuller, J. (2005). Using poetry and the visual arts to
develop emotional intelligence. Journal of Management Education. Vol. 29,
Issue. 6; p. 888
Munyon, T. P., & Breaux, D. M., & Rogers, L. M., & Perrewe, P. L., & Hochwarter,
W. (2009). Mood crossover and relational reciprocity. Career Development
International. Vol. 14, Issue. 5; p. 408-427
Nasional Malaysia Berhad. (2009). New Economic Model (NEM) for Malaysia: Part
1, Retrieved August 8, 2013, from http://www.epu.gov.my/epu-
theme/pdf/nem.pdf

Page 72 of 83
Neptune, J. (2008). Importance of EQ skills for On-line Professors.Volume 6 , Issue
4. Retrieved July 6, from
http://www.academicleadership.org/emprical_research/529.shtml
Owen, G. (2004). Emotional intelligence: the driving force for top-executive
performance. Human Resource Management International Digest. Vol. 12,
Issue. 4; p. 2
Peterson, N., & Gonzalez. R. C. (2005). The role of work in people`s lives. Belmon.
CA: Brooks/Cole.
Petrides, K.V., & Furnham, A. (2001). Trait emotional intelligence: psychometric
investigation with reference to established trait taxonomies. European Journal
of Personality. Vol. 15, Iss. 6; p. 425-48
Polychroniou, P. V. (2009). Relationship between emotional intelligence and
transformational leadership of supervisors: The impact on team effectiveness.
Team Performance Management. Vol. 15, Issue. 7/8; p. 343-356
Pollitt, D. (2007). Emotional intelligence at work: a professional guide (3rd ed.).
Training & Management Development Methods. Vol. 21, Iss. 2; p. 701
Pop-Vasileva, A., & Baird, K., & Blair, B. (2011). University corporatization. The
effect on academic work-related attitudes. Accounting, Auditing &
Accountability Journal. Vol. 24, Iss. 4; p. 408-439.
Rothmann, S., & Scholtz, P. E., & Sipsma, J. F., & Sipsma, L. (2002). Personality
preferences and emotional intelligence: implications for small and medium-
sized enterprises.
Page 73 of 83
Saunders, M., & Lewis, P., & Thornhill, A. (2009). Research Methods for Business
Students. (5th Ed). Essex, England: Prentice Hall.
Schulze, R., & Wilhelm, O., & Kyllonen, P.C. (2007) Approaches to the assessment
of emotional intelligence. In Matthews, G., & Zeidner, M., & Roberts,D.
(2007). The science of emotional intelligence knowns and unknowns. New
York: Oxford University Press. (p. 199-229).
Salgado, J. F. (2003). Predicting job performance using FFM and non-FFM
personality measures. Journal of Occupational and Organisational
Psychology. Vol.76; p. 323-346.
Salovey, P., & Mayer, J. D. (1990). Emotional intelligence: Imagination, cognition
and personality. Vol. 9, Issue. 3; p. 185-211
Shahzad, K., & Sarmad, M., & Abbas, M., & Khan, M. A. (2011). Impact of
Emotional Intelligence (EI) on employee’s performance in telecom sector of
Pakistan. African. Journal of Business Management. Vol.5, Iss. 4; p. 1225-
1231.
Shih, H., & Susanto, E. (2010). Conflict management styles, emotional intelligence,
and job performance in public organizations. International Journal of Conflict
Management. Vol. 21 No. 2; p. 147-168
Schumacher, L., & Wheeler, V. J., & Carr, A. S. (2009). The relationship between
emotional intelligence and buyer's performance. Journal of Business &
Industrial Marketing. Vol. 24, Issue: 3; p. 269 – 277.
Singh, K. S. (2007). Role of emotional intelligence in the organizational learning: an
empirical study. Singapore Management Review. Vol. 29, Iss. 2; p. 55

Page 74 of 83
Slaski, M., & Cartwright, S. (2003). Emotional intelligence training and its
implications for stress, health and performance. Stress and Health. Vol. 19,
Iss. 4; p. 233-9
Squicciarini, M., & Loikkanen, T. (2008). Going Global: The Challenges for
Knowledge based Economies. Retrieved May 23, 2013, from
http://mpra.ub.uni-uenchen.de/9663/1/TEM_20_2008_innovation.pdf
Sulaiman, A. M., & Al-Shaikh, F. N. (2006). Emotional intelligence at work: link to
conflict and innovation. Employee Relation. Vol. 29, Issue: 2; p. 208-220
Suliman, A. M., & AbdelRahman, A. A., & Abdalla, A. (2010). Personality traits and
work performance in a duty-free industry Vol. 20, Issue. 1; p. 64-82
Teh, C.J.(2012). Organisational Citizenship Behaviour in Private Institutions of
Higher Education in Malaysia. Unpublished PhD thesis, University of Malaya,
Kuala Lumpur. Malaysia.
The World Bank. (1st Ed). (2012). Putting Higher Education to Work: Skills and
Research for the Grwoth in the East Asia. Washington: The World Bank.
Tucker, M. L., & Sojka, J. Z., & Barone, F. J., & Mccarth, A. M. (2000). Training
tomorrow`s leaders: Enhancing the emotional intelligence of business
graduates. Journal of Education for Business. Vol. 75, Issue. 6; p. 331
Viswesvaran, C., & Ones, D. S. (2000). Perspectives on models of job performance.
International Journal of Selection and Assessment. Vol. 8; p. 216-226
Welbourne, T. M., & Johnson. D. N., & Erez. A. (1998). The Role-Based
Performance Scale: Validity analysis of a theory-based measure. Academy of
Management Journal. Vol.41, Iss:5; p.540-555.

Page 75 of 83
Whitefield, D., & Kloot, L. (2006). Personal and interpersonal skills: The process of
prescribing definitions in an accounting degree. Asian Review of Accounting.
Vol. 14, Issue. 1/2,; p. 2006
Yarrish, K. K., & Law, M. D. (2009). An exploration on the differences in emotional
intelligence of first year students examined across disciplines within the
school of business in a liberal arts college. Contemporary Issues in Education
Research, p. 47
Yuvaraj, S., & Srivastava, N. (2007). Are innovative managers emotionally
intelligent? Journal of Management Research. Vol. 7, Issue. 3; p. 169
Zikmund, W. G. (2003). Business research Methods. (7th
Ed). Thomson South
Western.
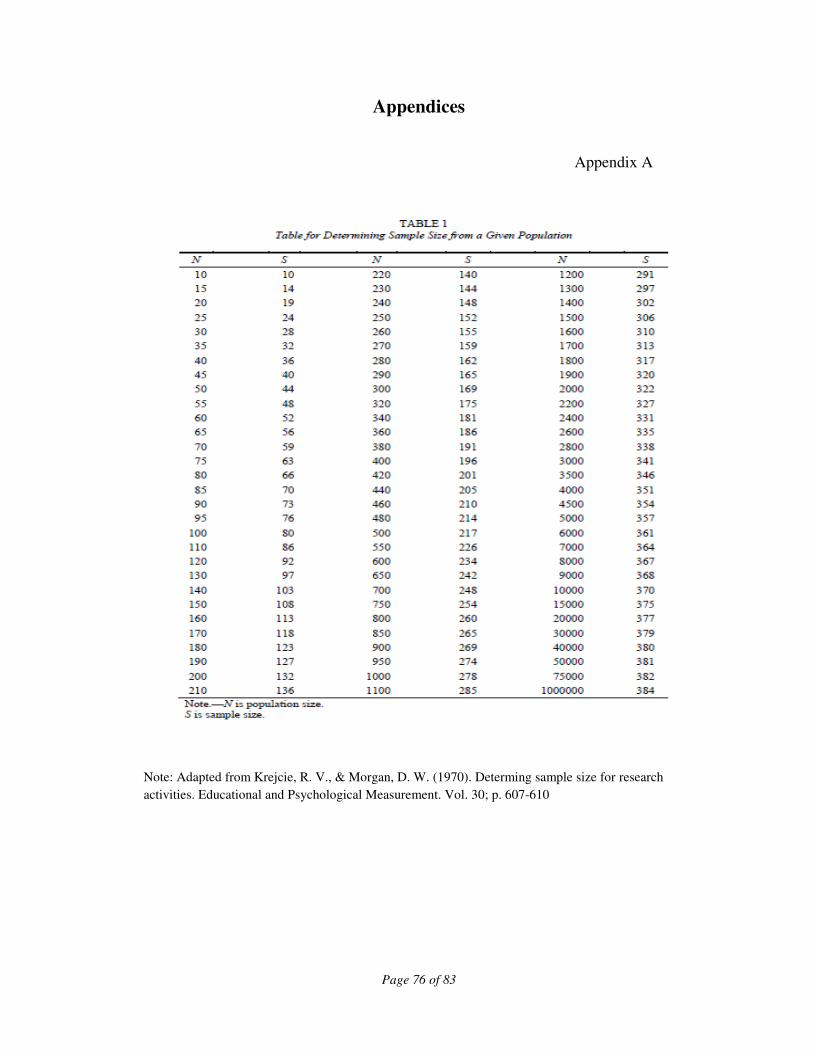
Page 76 of 83
Appendices
Appendix A
Note: Adapted from Krejcie, R. V., & Morgan, D. W. (1970). Determing sample size for research
activities. Educational and Psychological Measurement. Vol. 30; p. 607-610
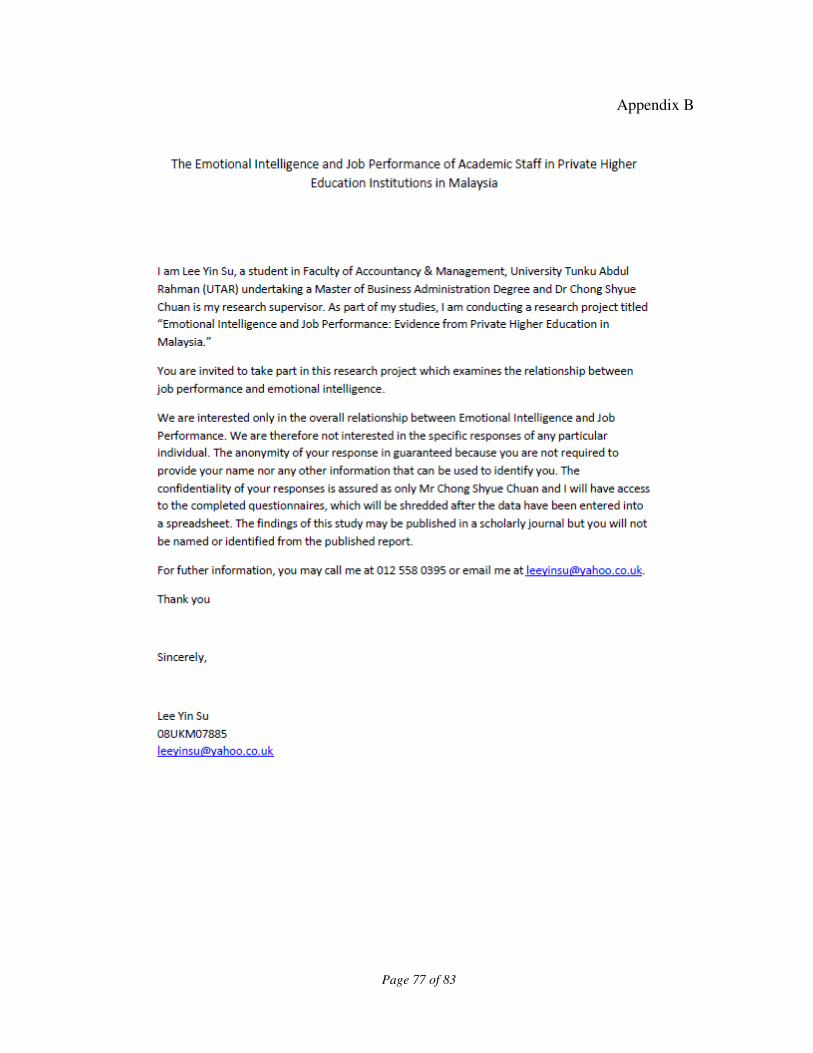
Page 77 of 83
Appendix B

Page 78 of 83
Part A: Demographic Questionnaire
1 Age
□ Less than 30
□ 30 – 39
□ 40 – 49
□ 50 – 59
□ More than 59
2 Gender
□ Male
□ Female
3 Monthly Expenses
□ < RM1000
□ RM1,000 – RM3,000
□ RM3,001 - RM5,000
□ RM5,001 - RM10,000
□ More than RM10,000
4 How long have you worked in this Organization?
□ Less than 1 year
□ between 1 to 2 years
□ between 3 to 4 years
□ between 5 to 6 years
□ 7 years and above
5 What is your last annual increment?
□ Less than 2 %
□ Between 2 % to 5 %
□ Between 6 % to 9 %
□ 10% and above

Page 79 of 83
Part B: Emotional Intelligence of One’s Emotional and Social Intelligence
1 Very seldom or not true of me
2 Seldom true of me
3 Sometimes true of me
4 Often true of me
5 Very often true of me or true of me
I feel that . . .
1 My approach in overcoming difficulties is to move step by step. 1 2 3 4 5
2 I prefer to join in which I'm told pretty much what I do. 1 2 3 4 5
3 I try to make my life as meaningful as I can. 1 2 3 4 5
4 It`s fairly easy for me to express feelings. 1 2 3 4 5
5 I`m unable to show affection. 1 2 3 4 5
6 I feel sure of myself in most situation 1 2 3 4 5
7 I have a feeling that something is wrong with my mind. 1 2 3 4 5
8 I believe that I can stay on top of tough situations. 1 2 3 4 5
9 I lack self-confidence. 1 2 3 4 5
10 When I start talking, it is hard to stop. 1 2 3 4 5
11 I like to get an overview of a problem before trying to solve it. 1 2 3 4 5
12 I prefer others to make decisions for me. 1 2 3 4 5
13 It`s hard for me to understand the way I feel. 1 2 3 4 5
14 In the past few years, I have accomplished little. 1 2 3 4 5
15 I have had strange experiences that can`t be explained. 1 2 3 4 5
16 I have good self-respect. 1 2 3 4 5
17 I do very weird things. 1 2 3 4 5
18
It`s difficult for me to change my opinion about things, once they are
made
1 2 3 4 5
19 Others find it hard to depend on me. 1 2 3 4 5
20 It`s hard to express my intimate feelings. 1 2 3 4 5
21 People don`t understand the way I think. 1 2 3 4 5
22 I see these strange things that others don`t see. 1 2 3 4 5
23 People tell me to lower my voice in discussions. 1 2 3 4 5
24 When I disagree with someone, I am able to say so. 1 2 3 4 5
25 It`s hard for me to accept myself just the way I am. 1 2 3 4 5
26 I feel cut off from my body. 1 2 3 4 5
27 I`m more a follower than a leader. 1 2 3 4 5
28 It`s fairly easy for me to tell people what I think. 1 2 3 4 5
29 I tend to exaggerate. 1 2 3 4 5
30 I feel comfortable with my body. 1 2 3 4 5
31 I am a very strange person. 1 2 3 4 5
32 I have not been embarrassed by anything that has done. 1 2 3 4 5
33 Others think that I lack assertiveness. 1 2 3 4 5
34 I like helping people. 1 2 3 4 5
35 It`s hard for me to smile. 1 2 3 4 5
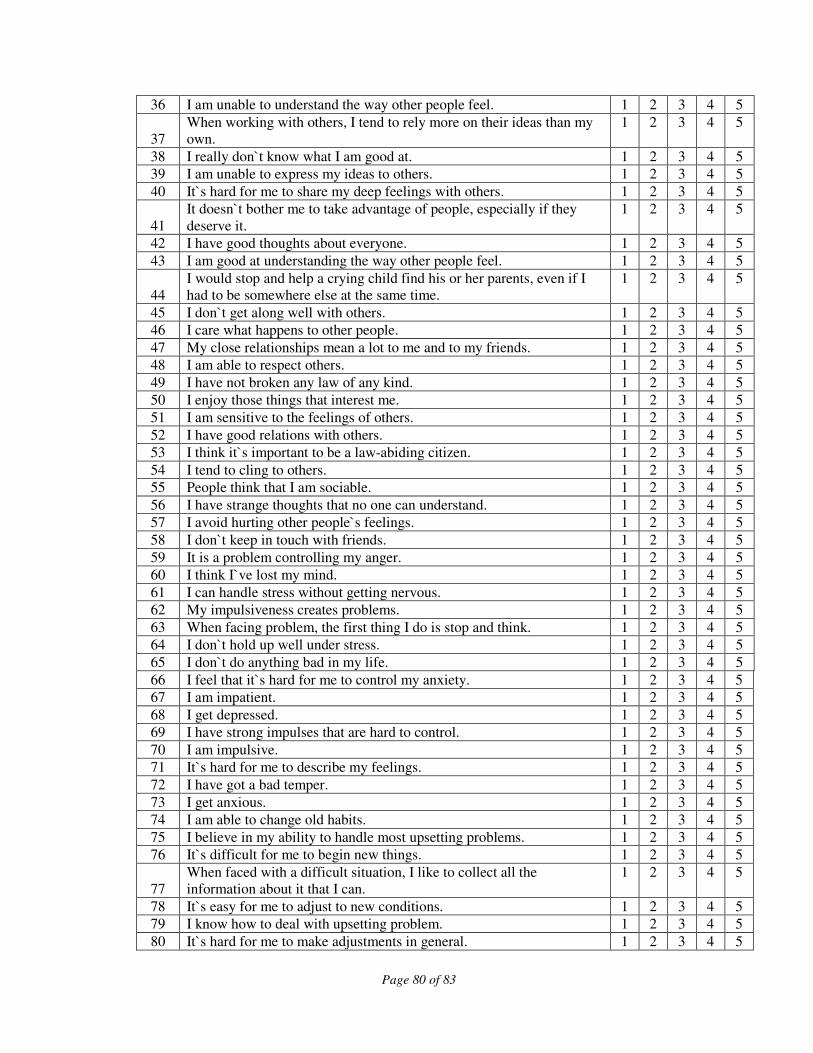
Page 80 of 83
36 I am unable to understand the way other people feel. 1 2 3 4 5
37
When working with others, I tend to rely more on their ideas than my
own.
1 2 3 4 5
38 I really don`t know what I am good at. 1 2 3 4 5
39 I am unable to express my ideas to others. 1 2 3 4 5
40 It`s hard for me to share my deep feelings with others. 1 2 3 4 5
41
It doesn`t bother me to take advantage of people, especially if they
deserve it.
1 2 3 4 5
42 I have good thoughts about everyone. 1 2 3 4 5
43 I am good at understanding the way other people feel. 1 2 3 4 5
44
I would stop and help a crying child find his or her parents, even if I
had to be somewhere else at the same time.
1 2 3 4 5
45 I don`t get along well with others. 1 2 3 4 5
46 I care what happens to other people. 1 2 3 4 5
47 My close relationships mean a lot to me and to my friends. 1 2 3 4 5
48 I am able to respect others. 1 2 3 4 5
49 I have not broken any law of any kind. 1 2 3 4 5
50 I enjoy those things that interest me. 1 2 3 4 5
51 I am sensitive to the feelings of others. 1 2 3 4 5
52 I have good relations with others. 1 2 3 4 5
53 I think it`s important to be a law-abiding citizen. 1 2 3 4 5
54 I tend to cling to others. 1 2 3 4 5
55 People think that I am sociable. 1 2 3 4 5
56 I have strange thoughts that no one can understand. 1 2 3 4 5
57 I avoid hurting other people`s feelings. 1 2 3 4 5
58 I don`t keep in touch with friends. 1 2 3 4 5
59 It is a problem controlling my anger. 1 2 3 4 5
60 I think I`ve lost my mind. 1 2 3 4 5
61 I can handle stress without getting nervous. 1 2 3 4 5
62 My impulsiveness creates problems. 1 2 3 4 5
63 When facing problem, the first thing I do is stop and think. 1 2 3 4 5
64 I don`t hold up well under stress. 1 2 3 4 5
65 I don`t do anything bad in my life. 1 2 3 4 5
66 I feel that it`s hard for me to control my anxiety. 1 2 3 4 5
67 I am impatient. 1 2 3 4 5
68 I get depressed. 1 2 3 4 5
69 I have strong impulses that are hard to control. 1 2 3 4 5
70 I am impulsive. 1 2 3 4 5
71 It`s hard for me to describe my feelings. 1 2 3 4 5
72 I have got a bad temper. 1 2 3 4 5
73 I get anxious. 1 2 3 4 5
74 I am able to change old habits. 1 2 3 4 5
75 I believe in my ability to handle most upsetting problems. 1 2 3 4 5
76 It`s difficult for me to begin new things. 1 2 3 4 5
77
When faced with a difficult situation, I like to collect all the
information about it that I can.
1 2 3 4 5
78 It`s easy for me to adjust to new conditions. 1 2 3 4 5
79 I know how to deal with upsetting problem. 1 2 3 4 5
80 It`s hard for me to make adjustments in general. 1 2 3 4 5

Page 81 of 83
81 It`s easy for me to make friends. 1 2 3 4 5
82 It`s hard for me to make decisions on my own. 1 2 3 4 5
83 I am aware of the way I feel. 1 2 3 4 5
84 Nothing disturbs me. 1 2 3 4 5
85 It`s hard for me to decide on the best solution when solving problems. 1 2 3 4 5
86 If I could get away with breaking the law in certain situations, I would. 1 2 3 4 5
87 I know how to keep calm in difficult situations. 1 2 3 4 5
88 I have not told a lie in my life. 1 2 3 4 5
89 I am generally motivated to continue, even when things get difficult. 1 2 3 4 5
90 I try to continue and develop those things that I enjoy. 1 2 3 4 5
91 It`s hard for me to say "no" when I want to. 1 2 3 4 5
92 I get carried away with my imagination and fantasies. 1 2 3 4 5
93 It`s generally hard for me to make charges in my daily life. 1 2 3 4 5
94 It`s hard for me to face unpleasant things. 1 2 3 4 5
95 It`s hard for me to change my ways. 1 2 3 4 5
96 I try to get as much as I can out of those things that I enjoy. 1 2 3 4 5
97
I can easily pull out of daydreams and tune into the reality of the
immediate situation.
1 2 3 4 5
98
I generally get stuck when thinking about different ways of solving
problems.
1 2 3 4 5
99 It`s hard for me to see people suffer. 1 2 3 4 5
100 I seem to need other people more than they need me. 1 2 3 4 5
101 I don`t have a good idea of what I want to do in life. 1 2 3 4 5
102 It`s difficult for me to stand up for my rights. 1 2 3 4 5
103 It`s hard for me to keep things in the right perspective. 1 2 3 4 5
104 It`s hard for me to enjoy life. 1 2 3 4 5
105 I like everyone I meet. 1 2 3 4 5
106
I try to see things as they really are, without fantasizing or
daydreaming about them.
1 2 3 4 5
107 I am in touch with my emotions. 1 2 3 4 5
108 I am optimistic about most things I do. 1 2 3 4 5
109 I`m fairly cheerful person. 1 2 3 4 5
110 When I am angry with others, I can tell them about it. 1 2 3 4 5
111 I am satisfied with my life. 1 2 3 4 5
112 I don`t get enjoyment from what I do. 1 2 3 4 5
113 I generally hope for the best. 1 2 3 4 5
114 My friends can tell me intimate things about themselves. 1 2 3 4 5
115 I don`t feel good about myself. 1 2 3 4 5
116
When trying to solve a problem, I look at each possibility and then
decide on the best way.
1 2 3 4 5
117 I am fun to be with. 1 2 3 4 5
118 I don`t get that excited about my interests. 1 2 3 4 5
119 I tend to fade out and lose contact with what happens around me. 1 2 3 4 5
120 I am happy with the type of person I am. 1 2 3 4 5
121 Even when upset, I am aware of what`s happening to me. 1 2 3 4 5
122
In handling situations that arise, I try to think of as many approaches
as I can.
1 2 3 4 5
123 I am not happy with my life. 1 2 3 4 5
124 I enjoy weekends and holidays. 1 2 3 4 5

Page 82 of 83
125
I generally expect things will turn out all right, despite setbacks from
time to time.
1 2 3 4 5
126 I am happy with the way I look. 1 2 3 4 5
127 I like to have fun. 1 2 3 4 5
128 I don`t have bad days. 1 2 3 4 5
129
Looking at both my good points and bad points, I feel good about
myself.
1 2 3 4 5
130 I tend to exploide with anger easily. 1 2 3 4 5
131 It would be hard for me to adjust if I were forced to leave my home. 1 2 3 4 5
132 Before beginning something new, I usually feel that I will fail. 1 2 3 4 5
133 I responded openly and honestly to the above questions. 1 2 3 4 5

Page 83 of 83
Part C: Job Performance
Rate yourself according to the following statement
1 Needs much improvement
2 Needs some improvement
3 Satisfactory
4
5
Goods
Excellent
My Job (doing things specifically related to my job description)
134 Quantity of work output 1 2 3 4 5
135 Quality of work output 1 2 3 4 5
136 Accuracy of work 1 2 3 4 5
137 Customer service provided (internal and external) 1 2 3 4 5
My career (obtaining the necessary skills to progress in the organization)
138 Developing personal career goals 1 2 3 4 5
139 Developing skills needed for my future career 1 2 3 4 5
140 Making progress in my career 1 2 3 4 5
141 Seeking our career opportunities 1 2 3 4 5
Innovator (creativity and innovation in my job and organization as a whole)
142 Coming up with new ideas for my workplace 1 2 3 4 5
143 Working to implement new ideas in the workplace 1 2 3 4 5
144 Finding improved ways to do things 1 2 3 4 5
145 Creating better processes and routines at work 1 2 3 4 5
Team (working with co-workers and team members toward success of the organization)
146 Working as part of a team or work group 1 2 3 4 5
147 Seeking information from others in my work group 1 2 3 4 5
148 Making sure my work group succeeds 1 2 3 4 5
149 Responding to the needs of others in my group 1 2 3 4 5
Organization (going above the call of duty in my concern for the organization)
150 Doing things that help others when it`s not part of my job 1 2 3 4 5
151 Working for the overall good of the company 1 2 3 4 5
152 Doing things to promote the company 1 2 3 4 5
153 Helping so that the company is a good place to be 1 2 3 4 5