Embed Size (px)
Citation preview
Journalof Archaeological Science 1989, 16,585-599
Stable Carbon Isotope Ratio Differences Between Bone Collagen and Bone Apatite, and their Relationship to Diet
Julia A. Lee-Thorp”, Judith C. Scaly” and Nikolaas J. van der MerweaJb
(Received 30 March 1988, revised manuscript accepted 20 July 1989)
A large set of 613C values for both the organic (collagen) and inorganic (apatitic) components of bone and tooth is presented for southern African fauna. Equations are obtained to describe variation in the relationship between these two isotopic values (the “apatite-collagen spacing”) with trophiclevel, for herbivores, carnivores and omnivores respectively. The empirically derived equations are slightly different from earlier predic- tions, and the implications are discussed. Differences between apatite and collagen 613C values in a sample ofprehistoric human skeletons from the southwestern Cape coast are considered in the light of relationships derived from fauna1 data. Unexpectedly small isotopic differences seen in many of these skeletons may be attributable to the particular mix of marine and terrestrial components of their diets.
Keywords: STABLE CARBON ISOTOPES, DIET, TOOTH, BONE, COLLAGEN, APATITE, ISOTOPIC DIFFERENCES, TROPHIC LEVEL, AFRICA.
Introduction It has been established in laboratory feeding experiments and in natural systems that stable carbon isotope ratios in animal tissues are related to the 13C content of the diet (DeNiro & Epstein, 1978a,b; Vogel, 1978; Tieszen et al., 1983; Kennedy, 1988). This phenomenon has been widely applied to reconstruction of prehistoric diets and has been reviewed elsewhere (van der Merwe, 1982). Briefly, the method is based upon the differential fractionation of carbon isotopes during CO, fixation by two groups of plants following different photosynthetic pathways. These are known as the C, and C, pathways respectively. Plants following the C, pathway (trees, most shrubs and temperate grasses) are more depleted in 13C than are plants utilizing the C, pathway (tropical grasses). The carbon isotope patterns are passed on through the food chain with some secondary fractionation, so that the tissues of consumers reflect the C,- or Cd-based nature of the diet. This has been very useful for the study of prehistoric diets. For instance, it provides a sensitive measure of the introduction of a C, domesticate such as maize into a C, biome (Vogel & van der Merwe, 1977; van der Merwe & Vogel, 1978). Another application has
“Department of Archaeology, University of Cape Town, Private Bag, Rondebosch 7700, South Africa. halso Departments of Anthropology and Earth and Planetary Sciences, Harvard University, Cambridge, MA 02138, U.S.A.
585 030554403/89/060585+15$03.00/0 0 1989 Academic Press Limited
586 J. A. LEE-THORP ET AL.
been to compare the contributions of marine versus terrestrial C, foods, since marine organisms are isotopically enriched (Tauber, 1981; Chisholm et al., 1982; Hobson & Collier, 1984; Sealy, 1986; Kennedy, 1988).
Although all tissues in the body reflect diet, isotopic values of various tissues in the same individual differ (DeNiro & Epstein, 1978a,b; Vogel, 1978; Tieszen et al., 1983). This is due to differences in tissue composition and turnover time, secondary fractionation effects and synthesis from different constituents of the diet. Since soft tissues rarely survive in archaeological deposits, calcified tissues (bone and teeth) have been the usual sample material for palaeodietary studies. Collagen, the main constituent of the organic phase of bone, has been preferred for isotopic analysis: pure collagen which retains biogenic iso- topic ratios may be readily isolated by appropriate procedures (Hassan, 1975; DeNiro, 1985). Applications in archaeology are consequently limited to the recent past, due to hydrolysis and dissolution of older collagen (Hare, 1980). Typically, in warm and/or wet environments, little or no usable collagen remains after about 10,000 years.
The inorganic phase of calcified tissues is an impure and poorly crystalline calcium phosphate salt analogous to hydroxyapatite: a biological apatite. This material contains carbon in the form of carbonate ions which occur in at least two positions: substituted in the phosphate position in the crystal structure (“structural carbonate”), and adsorbed on to hydration layers and crystal surfaces (“adsorbed carbonate”). The isotopic composition of this carbon is related to diet. Bone and tooth mineral usually survive much longer than collagen, but until recently have received little attention as sample material for palaeodietary studies because it was assumed that post-depositional processes have altered biogenic carbon isotopic ratios in unpredictable ways. Radiocarbon studies in the 1960s demonstrated that dates from purified collagen were reliable, but those from whole bone were not (Berger et al., 1964; Tamers&Pearson, 1965; Sellstedt et al., 1966), and this was ascribed to exchange of biogenic apatite-carbonate with soil CO, and bicarbonates. Indeed, it is well known that apatite may act as a “sponge”, absorbing minerals and ions from the deposit; such changes are known as diagenesis, a general term which refers to all post-mortem changes. By extension, apatite has been largely ignored as sample material for isotopic dietary studies, although a subsequent study demonstrated that radiocarbon dates from apatite could be improved by suitable chemical pretreatment procedures (Hassan, 1975) and the 13C/12C ratio is not as sensitive to post-depositional alteration as 14C measurements. (The 14C content of 1 g of modern carbon is IO-‘* g, while the 13C content is more than 10e2 g.) In contrast, trace elements (usually strontium) have been widely used for dietary reconstruction (for a review see Sillen & Kavanagh, 1982) although bone mineral is the compulsory sample material.
Recent work has stimulated renewed interest in the stable carbon isotope ratios of fossil bone mineral, but the potential of these studies has been diminished by a controversy relating to diagenesis: This debate and later developments have been reviewed elsewhere (Lee-Thorp, 1989) and only the main points will be mentioned here. Sullivan & Krueger (198 1) concluded that suitably pretreated apatite from archaeological specimens yielded reliable !3C/‘2C ratios, which differed from those obtained from collagen by a consistent, fixed amount. This conclusion was challenged on the grounds that many of the archaeo- logical specimens in another study did.not show such a consistent difference, and this was taken as evidence of alteration of the original apatite 13Ci2C ratios (Schoeninger & DeNiro, 1982, 1983). Their “proof ‘, however, was based largely on the assumption that the isotopic values of collagen and apatite should always differ by a fixed amount, an assumption no longer tenable (Krueger & Sullivan, 1984; this study). Indeed, all but a few of the results obtained by Schoeninger & DeNiro (1982) make more sense when trophic effects are considered. Chemical pretreatment procedures also differed in some important respects, as pointed out by Sullivan & Krueger (1983) in their reply.
CARBON ISOTOPE IN RELATION TO DIET 587
More recently, extensive studies using pretreatment procedures similar to those of Sullivan & Krueger (1981) have shown that alteration of the biogenic apatitic carbon isotopic signal does occur, but the effects are only significant in very old specimens (> 100 ka) (Lee-Thorp & van der Merwe, 1987; Lee-Thorp, 1989). In these old fossils, the effects are predictable and may be circumvented to some extent by a comparative tech- nique (Lee-Thorp, 1989; Lee-Thorp et al., 1989). However, the interpretation of ‘3C/‘2C ratios from apatite (and indeed collagen) for dietary information is less clear, and second- ary fractionations between diet, collagen and apatite are not well understood.
A few studies have addressed some aspects of the problem of secondary fractionation. It has been established that the 613C value of bone collagen is 3-6%0 more positive that that of an animal’s diet. Differences of +2.8-3.9%0 have been reported for laboratory mice (DeNiro & Epstein, 1978a), +2.9%0 for laboratory rats on a Lab-Blox diet (Kennedy, 1988), and a mean difference of 5%0 for free-ranging ungulates (Vogel, 1978; Sullivan & Krueger, 1981; Lee-Thorp & van der Merwe, 1987). Estimates for humans include + 5.1%0 (van der Merwe & Vogel, 1978) and +6.1%0 (Chisholm et al., 1982). A fractionation of +4.5%0 has been proposed as a realistic average (Kennedy, 1988), but the figure may vary with dietary quality. There is some debate about the extent to which collagen carbon is derived directly from ingested proteins, and manufactured in the body from carbohydrates. Different mixes offoods in the diets may well affect these relationships (Krueger&Sullivan, 1984; Klepinger, 1984; Klepinger & Mintel, 1986; Parkington, 1986; Sillen et al., 1989a).
Apatite is more enriched in i3C than bone collagen: diet-apatite fractionation has been reported as + 9.6%0 (DeNiro & Epstein, 1978a) and + 12-l 3%0 (Sullivan & Krueger, 198 1; Krueger & Sullivan, 1984; Lee-Thorp & van der Merwe, 1987; Lee-Thorp, 1989). It is generally understood than carbonate ions in apatite are incorporated from blood bicarbonate. An enrichment effect analogous to that demonstrated for gaseous carbon dioxide/dissolved bicarbonate/solid carbonate systems (Emrich et al., 1970) may occur at the interface between plasma bicarbonate and depleted expired CO, (DeNiro & Epstein, 1978b; Land et al., 1980; Sullivan & Krueger, 1981). Measurements of expired CO, in laboratory rats showed 613C values to be similar to metabolite (lipid or glycogen) values (Jacobson et al., 1972), and similar results have been obtained for human subjects (Schoeller et al., 1984).
This effect, however, does not explain the observed range of variation in the isotopic differences between the two phases of bone. A model has been proposed which incorpor- ates the above, but also relates bone collagen and apatite isotopic values to the principal macronutrients (protein, carbohydrates and lipids) in the diet (Krueger & Sullivan, 1984). The model is supported in part by medical research which relates isotopic changes in expired CO, and blood plasma of laboratory rats (Jacobson et al., 1972) and human subjects (Schoeller et al., 1984) to changes in the amounts of fats or carbohydrates (sugars) metabolized as fuel.
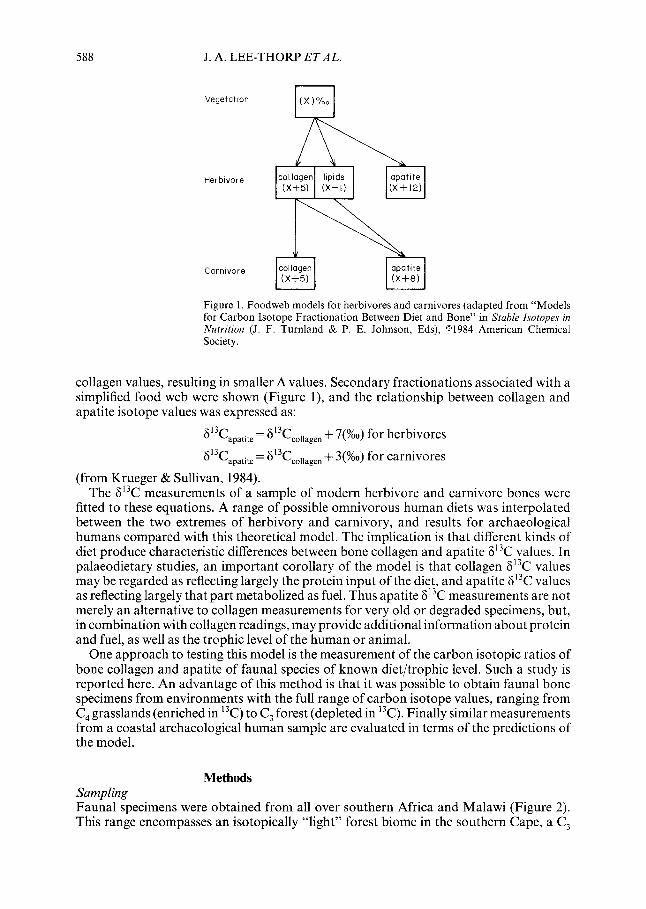
According to the Krueger & Sullivan model, the difference between the 613C values of collagen and apatite (often referred to as the apatite-collagen spacing, here designated A for convenience) changes with trophic level because different macronutrients (proteins, carbohydrates and lipids) assume greater or lesser importance in different diets. Thus herbivores derive protein from plant proteins and transamination of keto-acids (derived from carbohydrates), and energy from carbohydrates. Carnivores derive protein directly from prey protein (mainly meat), and energy from prey lipids and proteins. In both cases collagen reflects the growth aspect and apatite the energy aspect of diet. Since fats are depleted in 13C (isotopically lighter) relative to proteins and carbohydrates of the same plant or organism (Jacobson et al., 1972; Smith & Jacobson, 1976; DeNiro & Epstein, 1978~; Winkler & Schmidt, 1980) an increase in their utilization for energy results in relatively more depleted values for apatite-carbonate. Consequently these are closer to
588 J. A. LEE-THORP ET AL.
vegetatm
Herbivore collagen liplds apat1te (Xf5) (X-l) cx+ 12)
Figure 1. Foodweb models for herbivores and carnivores (adapted from “Models for Carbon Isotope Fractionation Between Diet and Bone” in Stable Isotopes in Nufrifion (J. F. Turnland & P. E. Johnson, Eds), 01984 American Chemical Society.
collagen values, resulting in smaller A values. Secondary fractionations associated with a simplified food web were shown (Figure l), and the relationship between collagen and apatite isotope values was expressed as:
6’3Capatite= 6’3Ccollagen + 7(%0) for herbivores
6’3C =6’3C apatlte co,,agen + 3(%0) for carnivores
(from Krueger & Sullivan, 1984). The 613C measurements of a sample of modern herbivore and carnivore bones were
fitted to these equations. A range of possible omnivorous human diets was interpolated between the two extremes of herbivory and carnivory, and results for archaeological humans compared with this theoretical model. The implication is that different kinds of diet produce characteristic differences between bone collagen and apatite 6i3C values. In palaeodietary studies, an important corollary of the model is that collagen 613C values may be regarded as reflecting largely the protein input of the diet, and apatite 613C values as reflecting largely that part metabolized as fuel. Thus apatite 6r3C measurements are not merely an alternative to collagen measurements for very old or degraded specimens, but, in combination with collagen readings, may provide additional information about protein and fuel, as well as the trophic level of the human or animal.
One approach to testing this model is the measurement of the carbon isotopic ratios of bone collagen and apatite of fauna1 species of known diet/trophic level. Such a study is reported here. An advantage of this method is that it was possible to obtain fauna1 bone specimens from environments with the full range of carbon isotope values, ranging from C, grasslands (enriched in 13C) to C, forest (depleted in 13C). Finally similar measurements from a coastal archaeological human sample are evaluated in terms of the predictions of the model.
Sampling Methods
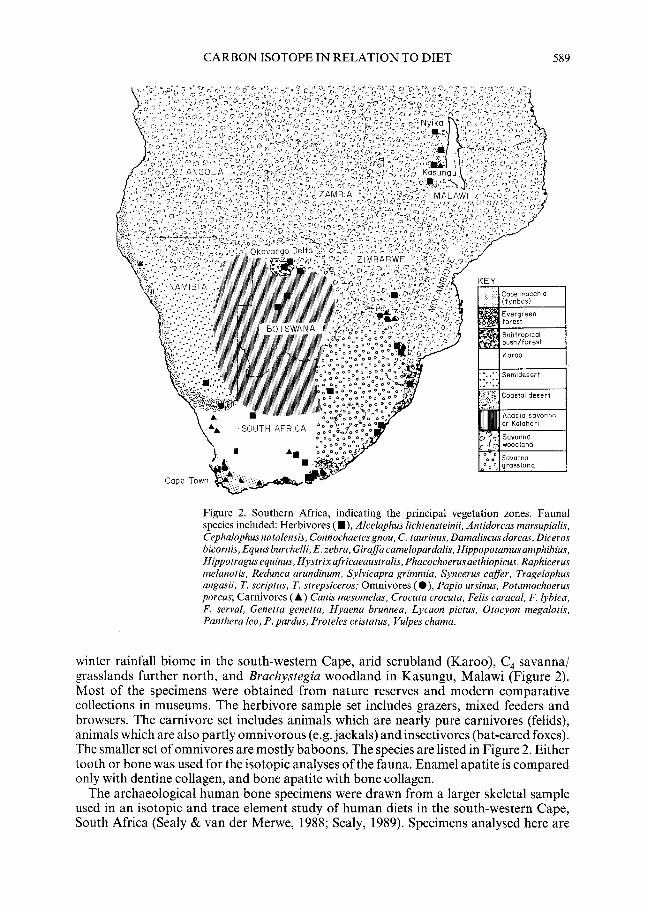
Fauna1 specimens were obtained from all over southern Africa and Malawi (Figure 2). This range encompasses an isotopically “light” forest biome in the southern Cape, a C,
CARBON ISOTOPE IN RELATION TO DIET 589
Figure 2. Southern Africa, indicating the principal vegetation zones. Fauna1 species included: Herbivores ( W), Alcelaphus lichtensteinii, Antidorcas marsupialis, Cephalophus natalensis, Connochaetes gnou, C. taurinus, Damaliscus dorcas, Diceros bicornis, Equus burchelli, E. zebra, Giraffa camelopardalis, Hippopotamus amphibius, Hippotragusequinus, Hystrixafricaeaustralis, Phacochoerusaethiopicus, Raphicerus melanotis, Redunca arundinum. Sylvicapra grimmia, Syncerus caffer, Tragelaphus angasii, T. scriptus, T. strepsiceros; Omnivores (a), Papio ursinus, Potamochoerus porcus; Carnivores (A) Canis mesomelas, Crocuta crocuta, Felis caracal. F. lybica, F. serval, Genetta genetta, Hyaena brunnea, Lycaon pictus, Otocyon megalotis, Panthera leo, P. pardus, Proteles cristatus, Vulpes chama.
winter rainfall biome in the south-western Cape, arid scrubland (Karoo), C, savanna/ grasslands further north, and Brachystegia woodland in Kasungu, Malawi (Figure 2). Most of the specimens were obtained from nature reserves and modern comparative collections in museums. The herbivore sample set includes grazers, mixed feeders and browsers. The carnivore set includes animals which are nearly pure carnivores (felids), animals which are also partly omnivorous (e.g. jackals) and insectivores (bat-eared foxes). The smaller set of omnivores are mostly baboons. The species are listed in Figure 2. Either tooth or bone was used for the isotopic analyses of the fauna. Enamel apatite is compared only with dentine collagen, and bone apatite with bone collagen.
The archaeological human bone specimens were drawn from a larger skeletal sample used in an isotopic and trace element study of human diets in the south-western Cape, South Africa (Sealy & van der Merwe, 1988; Sealy, 1989). Specimens analysed here are
590 J. A. LEE-THORP ET AL.
from coastal burials in shell middens or sand dunes. Only compact femoral bone in good condition was used for these analyses, in order to minimize possible diagenetic effects on the bone apatite. Such effects, if they occurred, are predicatable since the main carbonaceous contaminating agent in shell middens is marine carbonate (mean 613C near O%O).
Preparation Samples were washed and cleaned in an ultrasonic bath, and subdivided for separate collagen and apatite preparation. Collagen was prepared as described previously (Sealy, 1986) by demineralization in 0.2 M hydrochloric acid, and lipids were removed in a methanol: chloroform: water solution (2:1:0.8, v/v). Humic acid contaminants were removed from archaeological specimens using a 0.1 M sodium hydroxide solution. Carbon dioxide was produced by combustion as described previously (Sealy, 1986).
Bothmodern and archaeological apatite samples were prepared by the method described elsewhere (Lee-Thorp, 1989). A 1.5% sodium hypochlorite solution was used to remove organic material, and 1 M acetic acid to remove the more soluble carbonate ions (such as calcite and adsorbed carbonates), as well as the less crystalline and more soluble fractions of apatite. CO, was produced by reaction with 100% phosphoric acid. In all cases, dry $O?yas collected by cryogenic distillation, the yields measured manometrically and the
C/ C ratios measured against a calibrated reference gas in a VG Micromass 602E ratio spectrometer. The results are reported relative to the PDB limestone standard in the configuration:
iwq%o) = (r samp,e/rref-l) x 1000 where r = 13C/‘*C
Precision of duplicate analyses is better than 0.1 %o.
Fauna Results and Discussion
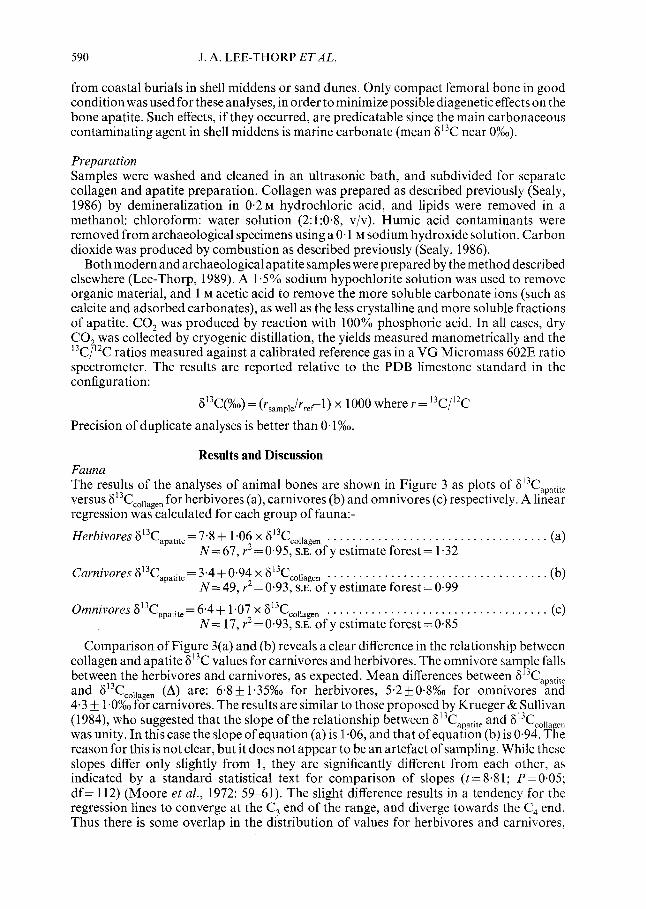
The results of the analyses of animal bones are shown in Figure 3 as plots of 8’3Capar,lc versus 613C co,,agen for herbivores (a), carnivores (b) and omnivores (c) respectively. A linear regression was calculated for each group of fauna:-
Herbivores iS13Capatite= 7.8 + 1.06 x 8’3Cc0,,agen . . . . . . . . . . . . . . . . . . . . . . . . . . . . . . . (a) N= 67, r2 = 0.95, S.E. of y estimate forest = 1.32
Carnivores S’3Capatite = 3.4+ 0.94 x S’3Cc0,,ageen . . . . . . . . . . . . . . . . . . . . . . . . . . . . . . . (b) N= 49, r2 = 0.93, S.E. of y estimate forest = 0.99
Omnivores Ij13Capatite = 6.4 + 1.07 x 6’3Cco,,agen . . . . . . . . . . . . . . . . . . . . . . . . . . . . . (c) N= 17, r* = 0.93, S.E. of y estimate forest =0.85
Comparison of Figure 3(a) and (b) reveals a clear difference in the relationship between collagen and apatite 613C values for carnivores and herbivores. The omnivore sample falls between the herbivores and carnivores, as expected. Mean differences between 813Capatite and ~‘3Ccollagen (4 are: 6.8 f 1.35%0 for herbivores, 5.2*0.X%0 for omnivores and 4.3 + 1.0%0 for carnivores. The results are similar to those proposed by Krueger & Sullivan (1984), who suggested that the slope of the relationship between 813Capatite and S’3Cc0,,a en was unity. In this case the slope of equation (a) is 1.06, and that of equation (b) is 0.94. Tke reason for this is not clear, but it does not appear to be an artefact of sampling. While these slopes differ only slightly from 1, they are significantly different from each other, as indicated by a standard statistical text for comparison of slopes (t = 8.81; P= 0.05; df= 112) (Moore et al., 1972: 59-61). The slight difference results in a tendency for the regression lines to converge at the C3 end of the range, and diverge towards the C, end. Thus there is some overlap in the distribution of values for herbivores and carnivores,
CARBON ISOTOPE IN RELATION TO DIET 591
2 .i o-
-2 (a) Herbivores . n i’mk ,
-4 - . . .
-6 - . . . -8 - . =.
-IO - u, : -I2
n Cl
. 1 . -,4 - . . . :m.p.
-16 -4 f.” -I8 -.
I I I, I,, I I, /
O- -2 - (12) Omnivores -4
. -6 -8 - m .
-O- . -12 - .+ -14 - . -I6 - c -18 -
-20 ’ ’ ’ ’ ’ ’ ’ ’ ’ ’ ’ ’ ’ ’ ’ -22 -20 -18 -16 -14 -12 -10 -8 -6
P3C collagen %o
Figure 3. Fauna: 6’T values of bone or tooth mineral plotted against 6’T of collagen for (a) herbivores, (b) carnivores and (c) omnivores.
most notably in the C, range. Another corollary of the observation that the slopes of the equations are not 1, is that A is not constant for a given trophic level, but varies slightly with environment. For the calculation of apatite from collagen 6r3C values, or vice versa, the appropriate equation shown above should be used rather than simple addition (or subtraction) of A.
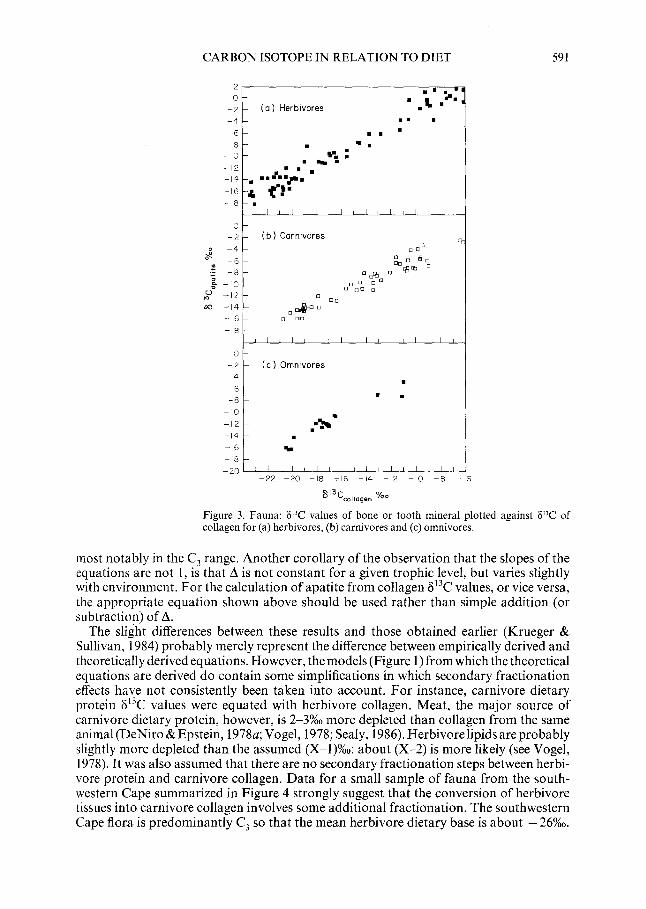
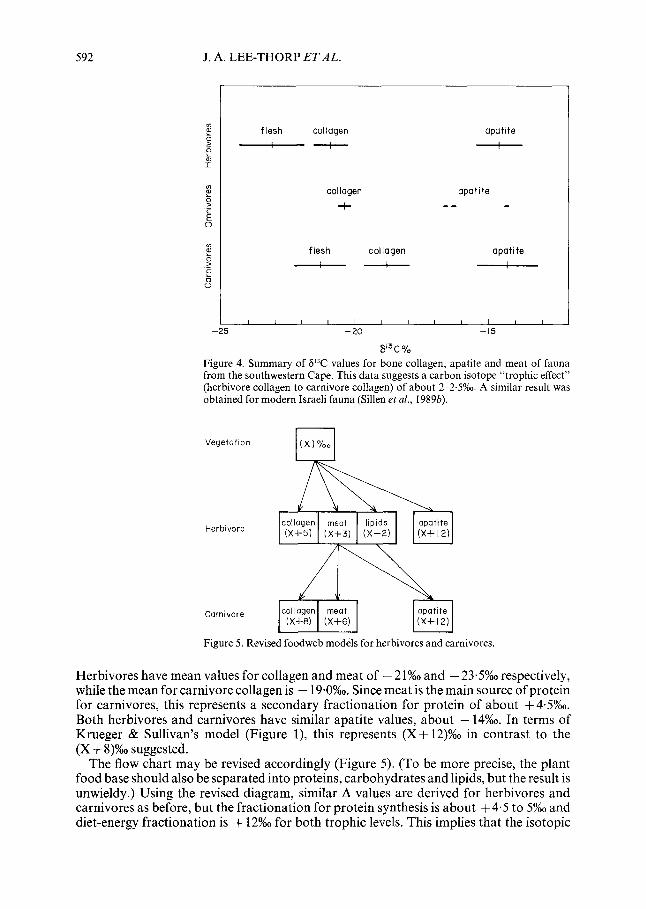
The slight differences between these results and those obtained earlier (Krueger & Sullivan, 1984) probably merely represent the difference between empirically derived and theoretically derived equations. However, the models (Figure 1) from which the theoretical equations are derived do contain some simplifications in which secondary fractionation effects have not consistently been taken into account. For instance, carnivore dietary protein 613C values were equated with herbivore collagen. Meat, the major source of carnivore dietary protein, however, is 2-3%0 more depleted than collagen from the same animal (DeNiro &Epstein, 1978a; Vogel, 1978; Scaly, 1986). Herbivore lipids are probably slightly more depleted than the assumed (x-1)%0: about (X-2) is more likely (see Vogel, 1978). It was also assumed that there are no secondary fractionation steps between herbi- vore protein and carnivore collagen. Data for a small sample of fauna from the south- western Cape summarized in Figure 4 strongly suggest that the conversion of herbivore tissues into carnivore collagen involves some additional fractionation. The southwestern Cape flora is predominantly C, so that the mean herbivore dietary base is about - 26%0.
592 J. A. LEE-THORP ET AL.
z b
flesh collagen
5 -+ $ I
collagen
+
apatlte
apatlte
flesh collagen
-1
opatite
Figure 4. Summary of 6°C values for bone collagen, apatite and meat of fauna from the southwestern Cape. This data suggests a carbon isotope “trophic effect” (herbivore collagen to carnivore collagen) of about 2-2.5%~ A similar result was obtained for modern Israeli fauna (Sillen et al., 1989b).
Vegetation
Herbivore
Carnivore 03 logen meat (X+8) (X+6)
apatite (x+12)
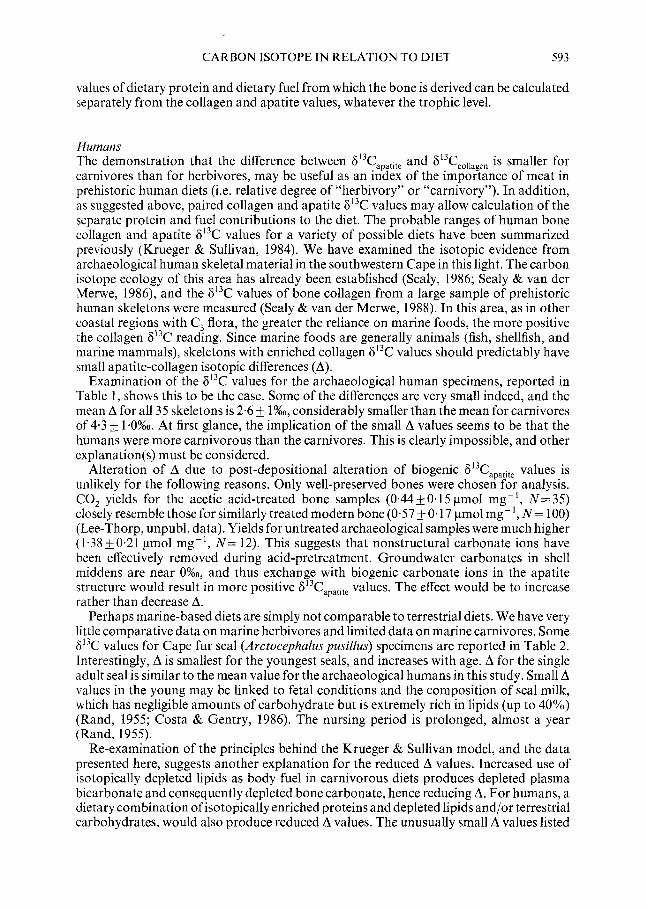
Figure 5. Revised foodweb models for herbivores and carnivores.
Herbivores have mean values for collagen and meat of - 21 %O and - 23.5%0 respectively, while the mean for carnivore collagen is - 19.0%0. Since meat is the main source of protein for carnivores, this represents a secondary fractionation for protein of about +4.5%0. Both herbivores and carnivores have similar apatite values, about - 14%~ In terms of Krueger & Sullivan’s model (Figure l), this represents (X+ 12)%0 in contrast to the (X + 8)%0 suggested.
The flow chart may be revised accordingly (Figure 5). (To be more precise, the plant food base should also be separated into proteins, carbohydrates and lipids, but the result is unwieldy.) Using the revised diagram, similar A values are derived for herbivores and carnivores as before, but the fractionation for protein synthesis is about + 4.5 to 5%0 and diet-energy fractionation is + 12%0 for both trophic levels. This implies that the isotopic
CARBON ISOTOPE IN RELATION TO DIET 593
values of dietary protein and dietary fuel from which the bone is derived can be calculated separately from the collagen and apatite values, whatever the trophic level.
Humans The demonstration that the difference between 8’3Capatite and 8’3Cco,,agen is smaller for carnivores than for herbivores, may be useful as an index of the importance of meat in prehistoric human diets (i.e. relative degree of “herbivory” or “carnivory”). In addition, as suggested above, paired collagen and apatite 613C values may allow calculation of the separate protein and fuel contributions to the diet. The probable ranges of human bone collagen and apatite 613C values for a variety of possible diets have been summarized previously (Krueger & Sullivan, 1984). We have examined the isotopic evidence from archaeological human skeletal material in the southwestern Cape in this light. The carbon isotope ecology of this area has already been established (Sealy, 1986; Sealy & van der Merwe, 1986) and the 613C values of bone collagen from a large sample of prehistoric human skeletons were measured (Sealy & van der Merwe, 1988). In this area, as in other coastal regions with C, flora, the greater the reliance on marine foods, the more positive the collagen F13C reading. Since marine foods are generally animals (fish, shellfish, and marine mammals), skeletons with enriched collagen 613C values should predictably have small apatite-collagen isotopic differences (A).
Examination of the F13C values for the archaeological human specimens, reported in Table 1, shows this to be the case. Some of the differences are very small indeed, and the mean A for all 35 skeletons is 2.6 + 1%0, considerably smaller than the mean for carnivores of 4.3 + 1.0%0. At first glance, the implication of the small A values seems to be that the humans were more carnivorous than the carnivores. This is clearly impossible, and other explanation(s) must be considered.
Alteration of A due to post-depositional alteration of biogenic 8i3Capatite values is unlikely for the following reasons. Only well-preserved bones were chosen for analysis. CO, yields for the acetic acid-treated bone samples (0.4410.15 pmol mgg’, N=35) closely resemble those for similarly treated modern bone (O-57 + 0.17 umol mg- ‘, N = 100) (Lee-Thorp, unpubl. data). Yields for untreated archaeological samples were much higher (1.38 FO.21 pmol mgg’, N= 12). This suggests that nonstructural carbonate ions have been effectively removed during acid-pretreatment. Groundwater carbonates in shell middens are near O%O, and thus exchange with biogenic carbonate ions in the apatite structure would result in more positive Sr3Capatite values. The effect would be to increase rather than decrease A.
Perhaps marine-based diets are simply not comparable to terrestrial diets. We have very little comparative data on marine herbivores and limited data on marine carnivores. Some 613C values for Cape fur seal (Arctocephalus pusillus) specimens are reported in Table 2. Interestingly, A is smallest for the youngest seals, and increases with age. A for the single adult seal is similar to the mean value for the archaeological humans in this study. Small A values in the young may be linked to fetal conditions and the composition of seal milk, which has negligible amounts of carbohydrate but is extremely rich in lipids (up to 40%) (Rand, 1955; Costa & Gentry, 1986). The nursing period is prolonged, almost a year (Rand, 1955).
Re-examination of the principles behind the Krueger & Sullivan model, and the data presented here, suggests another explanation for the reduced A values. Increased use of isotopically depleted lipids as body fuel in carnivorous diets produces depleted plasma bicarbonate and consequently depleted bone carbonate, hence reducing A. For humans, a dietary combination of isotopically enriched proteins and depleted lipids and/or terrestrial carbohydrates, would also produce reduced A values. The unusually small A values listed
594 J. A. LEE-THORP ET AL.
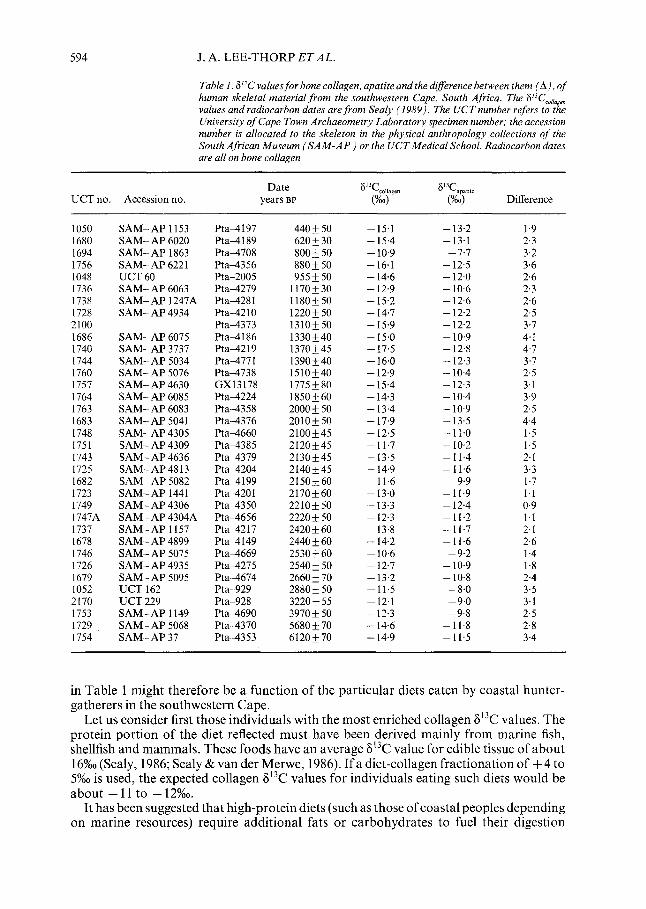
Table I. 6°C valuesfor bone collagen, apatite and the dzrerence between them (A), of human skeletal material from the southwestern Cape, South Africa. The 6”C,,,,, values and radiocarbon dates are from Scaly (1989). The UCTnumber refers to the University of Cape Town Archaeometry Laboratory specimen number; the accession number is allocated to the skeleton in the physical anthropology collections of the South African Museum (SAM-AP ) or the UCTMedical School. Radiocarbon dates are all on bone collagen
Date 6’T collagen 6’T apti,e UCT no. Accession no. years BP (%o) (%O) Difference
1050 1680 1694 1756 1048 1736 1738 1728 2100 1686 1740 1744 1760 1757 1764 1763 1683 1748 1751 1743 1125 1682 1723 1749 1747A 1737 1678 1746 1726 1679 1052 2170 1753 1729 1754
SAM-AP 1153 SAM- AP 6020 SAM- AP 1863 SAM- AP 622 1 UCT 60 SAM- AP 6063 SAM- AP 1247A SAM- AP 4934
Pta4197 Pta-4189 Pta-4708 Pta-4356 Pta-2005 Pta4279 Pta4281 Pta42 10 Pta-4373 Pta4186 Pta4219 Pta-4771 Pta-4738 GX13178 Pta-4224 Pta4358 Pta-4376 Pta4660 Pta-I385 Pta-4379 Pta4204 Pta-4199 Pta-420 1 Pta-4350 Pta-4656 Pta-4217 Pta-4149 Pta4669 Pta-4275 Pta4674 Pta-929 Pta-928 Pta-4690 Pta-4370 Pta-4353
440 + 50 620 f 30 800_+50 880* 50 955 & 50
1170+30 1180+50 122Ok50 1310*50 1330&40 1370f45 1390+40 1510*40 1775 * 80 1850+60
2000 * 50 2010+50 2100+45 2120,45 2130+45 2140+45 2150+60 2170+60 2210+50 2220 f 50 2420 + 60 2440 + 60 2530 k 60 2540 + 50 2660 + 70 2880 + 50 3220 f 55 3970 * 50 5680 + 70 6120+70
-15.1 -15.4 - 10.9 -16.1 - 14.6 - 12.9 - 15.2 - 14.7 -15.9 -15.0
-13.2 - 13.1
-7.7 - 12.5 - 12.0 - 10.6 - 12.6 - 12.2 - 12.2 - 10.9 - 12.8 - 12.3 - 10.4 - 12.3 - 10.4 - 10.9 -13.5 -11.0 - 10.2
1.9 2.3 3.2 3.6 2.6 2.3 2.6 2.5 3.7
SAM- AP 6075 SAM- AP 3737 SAM- AP 5034 SAM- AP 5076 SAM- AP 4630 SAM- AP 6085 SAM- AP 6083 SAM- AP 5041 SAM- AP 4305 SAM- AP 4309 SAM- AP 4636 SAM-AP4813 SAM- AP 5082 SAM-AP 1441 SAM- AP 4306 SAM- AP 4304A SAM- AP 1157 SAM- AP 4899 SAM- AP 5075 SAM-AP 4935 SAM- AP 5095 UCT 162 UCT 229 SAM- AP 1149 SAM- AP 5068 SAM- AP 37
4.1 4.7 3.7 2.5 3.1 3.9 2.5 4.4 1.5 1.5
- 17.5 -16.0 -12.9 -15.4 - 14.3 -13.4 - 17.9 - 12.5 -11.7 - 13.5 - 14.9 -11.6 -13.0 -13.3 - 12.3 -13.8 - 14.2 - 10.6 - 12.7 -13.2 -11.5 - 12.1 - 12.3 - 14.6 - 14.9
-11.4 2.1 -11.6 3.3
-9.9 1.7 -11.9 1.1 - 12.4 0.9 -11.2 1.1 -11.7 2.1 -11.6 2.6
-9.2 - 10.9 - 10.8
-8.0 -9.0 -9.8
-11.8 -11.5
1.4 1.8 2.4 3.5 3.1 2.5 2.8 3.4
in Table 1 might therefore be a function of the particular diets eaten by coastal hunter- gatherers in the southwestern Cape.
Let us consider first those individuals with the most enriched collagen 613C values. The protein portion of the diet reflected must have been derived mainly from marine fish, shellfish and mammals. These foods have an average 6t3C value for edible tissue of about 16%0 (Sealy, 1986; Sealy &van der Merwe, 1986). If a diet-collagen fractionation of +4 to 5%0 is used, the expected collagen F13C values for individuals eating such diets would be about - 11 to - 12%0.
It has been suggested that high-protein diets (such as those of coastal peoples depending on marine resources) require additional fats or carbohydrates to fuel their digestion
CARBON ISOTOPE IN RELATION TO DIET 595
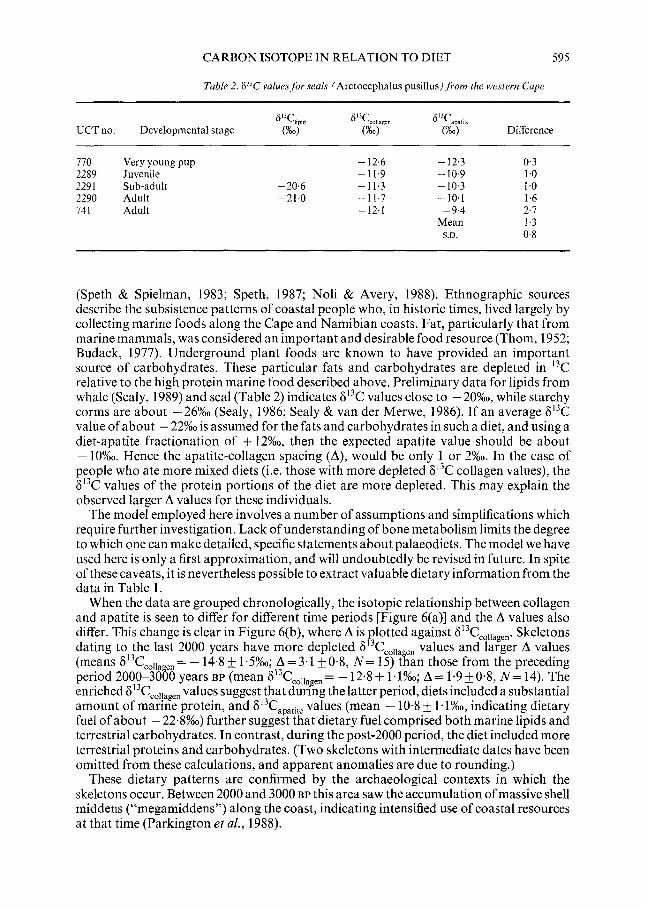
Table 2. F’jC values for seals (Arctocephalus pusillus) from the western Cape
UCT no. Developmental stage Difference
770 2289 2291 2290 741
Very young pup -12.6 -12.3 0.3 Juvenile -11.9 - 10.9 1.0 Sub-adult -20.6 -11.3 - 10.3 1.0 Adult -21.0 -11.7 - 10.1 1.6 Adult - 12.1 -9.4 2.7
Mean 1.3 SD. 0.8
(Speth & Spielman, 1983; Speth, 1987; Noli & Avery, 1988). Ethnographic sources describe the subsistence patterns of coastal people who, in historic times, lived largely by collecting marine foods along the Cape and Namibian coasts. Fat, particularly that from marine mammals, was considered an important and desirable food resource (Thorn, 1952; Budack, 1977). Underground plant foods are known to have provided an important source of carbohydrates. These particular fats and carbohydrates are depleted in 13C relative to the high protein marine food described above. Preliminary data for lipids from whale (Sealy, 1989) and seal (Table 2) indicates 613C values close to - 20%0, while starchy corms are about -26%0 (Sealy, 1986; Sealy & van der Merwe, 1986). If an average 613C value of about - 22%0 is assumed for the fats and carbohydrates in such a diet, and using a diet-apatite fractionation of + 12%0, then the expected apatite value should be about - 10%0. Hence the apatite-collagen spacing (A), would be only 1 or 2%0. In the case of people who ate more mixed diets (i.e. those with more depleted 613C collagen values), the 613C values of the protein portions of the diet are more depleted. This may explain the observed larger A values for these individuals.
The model employed here involves a number of assumptions and simplifications which require further investigation. Lack of understanding of bone metabolism limits the degree to which one can make detailed, specific statements about palaeodiets. The model we have used here is only a first approximation, and will undoubtedly be revised in future. In spite of these caveats, it is nevertheless possible to extract valuable dietary information from the data in Table 1.
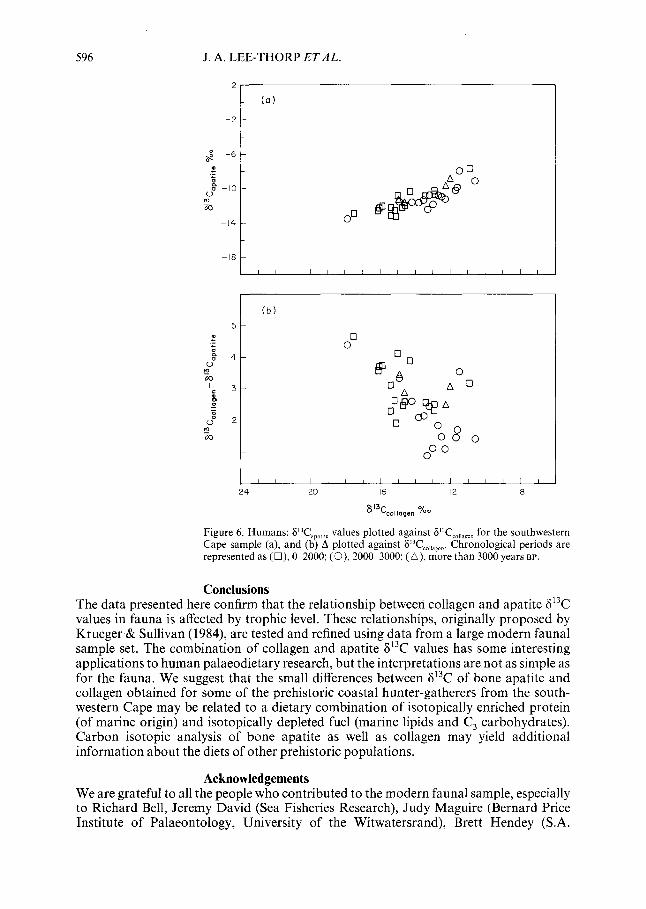
When the data are grouped chronologically, the isotopic relationship between collagen and apatite is seen to differ for different time periods [Figure 6(a)] and the A values also differ. This change is clear in Figure 6(b), where A is plotted against 8’3Cco,,agen. Skeletons dating to the last 2000 years have more depleted 8’3C,,,,a en values and larger A values (means 8’3Cc0,,a en = - 14.8 ) 1.5%0; A = 3.1+ 0.8, N= 15) &an those from the preceding period 2000-3ObO years BP (mean S’3Cco,,agcn = - 12.8 + 1.1%0; A = 1.9 f0.8, N= 14). The enriched 613C co,,agen values suggest that during the latter period, diets included a substantial amount of marine protein, and 813C,p,tite values (mean - 10.8 + 1.1%0, indicating dietary fuel of about - 22.8%,) further suggest that dietary fuel comprised both marine lipids and terrestrial carbohydrates. In contrast, during the post-2000 period, the diet included more terrestrial proteins and carbohydrates. (Two skeletons with intermediate dates have been omitted from these calculations, and apparent anomalies are due to rounding.)
These dietary patterns are confirmed by the archaeological contexts in which the skeletons occur. Between 2000 and 3000 BP this area saw the accumulation of massive shell middens (“megamiddens”) along the coast, indicating intensified use of coastal resources at that time (Parkington et al., 1988).
596 J. A. LEE-THORP ET AL
-1 (0)
-2
0 pJ30 A00
Ej”“8 A O 0 00 0
00 0
Figure 6. Humans: FT,,,,,,, values plotted against 6’T,,,,,,,, for the southwestern Cape sample (a), and (b) A plotted against F’T,,,,,,,,. Chronological periods are represented as (O), O-2000; (0), 2000-3000; (A), more than 3000 years BP.
Conclusions The data presented here confirm that the relationship between collagen and apatite 613C values in fauna is affected by trophic level. These relationships, originally proposed by Krueger & Sullivan (1984), are tested and refined using data from a large modern fauna1 sample set. The combination of collagen and apatite 613C values has some interesting applications to human palaeodietary research, but the interpretations are not as simple as for the fauna. We suggest that the small differences between 613C of bone apatite and collagen obtained for some of the prehistoric coastal hunter-gatherers from the south- western Cape may be related to a dietary combination of isotopically enriched protein (of marine origin) and isotopically depleted fuel (marine lipids and C, carbohydrates). Carbon isotopic analysis of bone apatite as well as collagen may yield additional information about the diets of other prehistoric populations.
Acknowledgements We are grateful to all the people who contributed to the modern fauna1 sample, especially to Richard Bell, Jeremy David (Sea Fisheries Research), Judy Maguire (Bernard Price Institute of Palaeontology, University of the Witwatersrand), Brett Hendey (S.A.
CARBON ISOTOPE IN RELATION TO DIET 597
Museum), and Peter Norton (Cape Nature Conservation). Graham and Margaret Avery (S.A. Museum) and Alan Morris (Anatomy, UCT) permitted the analysis of the human skeletal material. We thank John Vogel (C.S.I.R.) for radiocarbon dates, and Harold Krueger (Geochron) for dates supplied as an award to one of us (J.C.S.). We thank John Lanham, Andrew Sillen, Francis Thackeray, Stanley Ambrose and Harold Krueger for their help and comments. Financial assistance was provided by the Foundation for Research and Development, the University of Cape Town and the Harry Oppenheimer Institute for African Studies.
References Berger, R., Horney, A. G. & Libby, W. F. (1964). Radiocarbon dating of bone and shell from
their organic components. Science 144,999-1001. Budack, K. F. R. (1977). The #Aonin or Topnaar of the lower !Khuiseb Valley and the sea.
Khoisan Linguistic Studies 3, 142. Chisholm, B. S., Nelson, D. E. & Schwartz, H. P. (1982). Stable carbon isotopes as a measure of
marine versus terrestrial protein in ancient diets. Science 216, 1131-l 132. Costa, D. P. & Gentry, R. L. (1986). Free-ranging eneigetics of northern fur seals. In (R. L.
Gentry & G. L. Kooyman, Eds) Furseals-Maternal Strategies at Land and Sea Princeton: Princeton University Press, pp. 79-97.
DeNiro, M. J. (1985). Postmortem preservation and alteration of in vivo bone collagen isotope ratios in relation to palaeodietary reconstruction. Nature 317,8069.
DeNiro, M. J. & Epstein, S. (1978a). Influence of diet bn the distribution of carbon isotopes in animals. Geochimica et Cosmochimica Acta 42,341-351‘.
DeNiro, M. J. & Epstein, S. (1978b). Carbon isotopic evidence for different feeding patterns in two hyrax species occupying the same habitat. Science 201,9OfG908.
Emrich, K., Emhalt, D. H. & Vogel, J. C. (1970). Carbon isotope fractionation during the precipitation of calcium carbonate. Earth and Planetary Science Letters 8,363-371.
Hare, P. E. (1980). The organic geochemistry of bone and its relation to the survival of bone in the natural environment. In (A. K. Behrensmeyer & A. P. Hill, Eds) Fossils in the Making Chicago: University of Chicago Press, pp. 208-219.
Hassan, A. A. (1975). Geochemical and mineralogical studies on bone and their implications for radiocabon dating. Unpublished Ph.D. thesis, Southern Methodist University, Texas.
Hobson, K. A. & Collier, S. (1984). Marine and terrestrial protein in Australian aboriginal diets. Current Anthropology 25,238-240.
Jacobson, B. S., Smith, B. N. & Jacobson, A. V. (1972). Alloxan induced change from carbohydrate to lipid oxidation in rats as determined by the prevalence of C-13 in expired carbon dioxide Biochemical and Biophysical Research Communications 47,398402.
Kennedy, B. V. E. (1988). Variation in 613C values of Post-medieval Europeans. Unpublished Ph.D. thesis, University of Calgary.
Klepinger, L. L. (1984). Nutritional assessment from bone. Annual Review ofAnthropology 13, 75-96.
Klepinger, L. L. & Mintel, R. W. (1986). Metabolic considerations in reconstructing past diet from stable carbon isotope ratios in bone collagen. In (Olin, J. S. & M. J. Blackman, Eds) Proceedings of the 24th International Archaeological Symposium Washington: Smithsonian Institution Press, pp. 4348.
Krueger, H. W. & Sullivan, C. H. (1984). Models for carbon isotope fractionation between diet and bone. In (Turnland, J. F. & P. E. Johnson, Eds) Stable Isotopes in Nutrition ACS Symposium Series, 258, American Chemical Society, 205-222.
Land, L. S., Lundelius, E. L. & Valastro, S. (1980). Isotopic ecology of deer bones. Palaeogeography Palaeoclimatology Palaecoecology 32, 143-15 1.
Lee-Thorp, J. A. (1989). Stable carbon isotopes in deep time: diets offossilfauna andhominids. Unpublished Ph.D. thesis, University of Cape Town.
Lee-Thorp, J. A. & van der Met-we, N. J. (1987). Carbon isotope analysis of fossil bone apatite. South African Journal of Science 83,71-74.
J. A. LEE-THORP ET AL.
Lee-Thorp, J. A., van der Merwe, N. J. & Brain, C. K. (1989). Isotopic evidence for dietary differences between two extinct baboon species from Swartkrans, South Africa. Journal of Human Evolution 18, 183-190.
Moore, P. G., Shirley, E. A. & Edwards, D. E. (1972). Standard Statistical Calculations. London Pitman.
Noli, D. & Avery, G. (1988). Protein poisoning and coastal subsistence. JournalofArchaeologicaZ Science 15,395AOl.
Parkington, J. E. (1986). Comment on Sealy and van der Merwe. Current Anthropology 27(2), 145-6.
Parkington, J., Poggenpoel, C., Buchanan, B., Robey, T., Manhire, T. & Sealy, J. (1988). Holocene coastal settlement patterns in the southwestern Cape. In (G. Bailey & J. Parkington (Eds) The Archaeology of Prehistoric Coastlines Cambridge: University Press, pp. 2241.
Rand, R. W. (1955). Reproduction in the Cape female fur seal, Arctocephaluspusillus (Schreber). Proceedings of the Zoological Society of London 124,7 17-740.
Schoeller, D. A., Brown, C., Nakamura, K., Nakagawa, A., Mazzeo, R. S., Brooks, G. A., Budinger, T. F. (1984). Influence of metabolic fuel on the 13C/12C ratio of breath CO,. Biomedical Mass Spectrometry 11 (1 1), 557-561.
Schoeninger, M. J. & DeNiro, M. J. (1982). Carbon isotope ratios of apatite from fossil bone cannot be used to reconstruct diets of animals. Nature 297,577-578.
Schoeninger, M. J. & DeNiro, M. J. (1983). Reply to carbon isotope ratios of bone apatite & animal diet reconstruction. Nature 301, 178.
Scaly, J. C. (1986). Stable carbon isotopes and prehistoric diets in the south-western Cape Province, South Africa. Cambridge Monographs in African Archaeology 15, BAR International Series 293, Oxford.
Sealy, J. C. (1989). Reconstruction of Later Stone Age diets in the south-western Cape, South Africa: evaluation and application offive isotopic and trace element techniques. Unpublished Ph.D. thesis, University of Cape Town.
Scaly, J. C. & van der Merwe, N. J. (1986). Isotope assessment and the seasonal mobility hypothesis in the south-western Cape of South Africa. Current Anthropology 27,135-l 50.
Sealy, J. C. & van der Merwe, N. J. (1988). Social, spatial and chronological patterning in marine food use as determined by 613C measurements of Holocene human skeletons from the south- western Cape, South Africa. World Archaeology 20 (l), 87-l 02.
Sellstedt, H., Engstrand, L. & Gejvall, N.-G. (1966). New application of radiocarbon dating to collagen residue in bones. Nature 212,5724.
Sillen, A. & Kavanagh, M. (1982). Strontium and paleodietary research: a review. Yearbook of Physical Anthropology 25,67-90.
Sillen, A., Sealy, J. C. & van der Merwe (1989a). Chemistry and paleodietary research: no more easy answers, American Antiquity (In press).
Sillen, A., Sealy, J., Lee Thorp, J., Horwitz, L. K. & van der Merwe, N. J. (19896). Trace element and isotope research in progress: implications for Near Eastern Archaeology. In (I. Hershowitz, Ed.) Proceedings of the Second Symposium on Upper Palaeolithic, Mesolithic and Neolithic Populations of Europe and Mediterranean basin (Tel Aviv, 1987). BAR series (In press).
Smith, B. N. &Jacobson, B. S. (1976). 2HjlH and 13C and 12C ratios for classes ofcompounds isolated from potato tuber. Plant and Cell PhysioZogy 17,1089-1092.
Speth, J. D. (1987). Early hominid subsistence strategies in seasonal habitats. Journal of Archaeological Science 14, 13-29.
Speth, J. D. & Spielman, K. (1983). Energy source, protein metabolism and hunter-gatherer subsistence strategies. Journal of Anthropological Archaeology 2, l-3 1.
Sullivan, C. H. & Krueger, H. W. (1981). Carbon isotope analysis of separate chemical phases in modern and fossil bone. Nature 292,333-335.
Sullivan, C. H. & Krueger, H. W. (1983). Carbon isotope ratios of bone apatite and animal diet reconstruction. Nature 301, 177.
Tamers, M. A. & Pearson, F. J. (1965). Validity of radiocarbon dates on bone. Nature 208, 1053-55.
Tauber, H. (1981). 13C evidence for dietary habits of prehistoric man in Denmark. Nature 292, 332-333.
CARBON ISOTOPE IN RELATION TO DIET
Thorn, H. B. (Ed.) (1952). Journal ofJan van Riebeeck. Vols l-l 11. Cape Town: Balkema (for the van Riebeeck Society).
Tieszen, L. L., Boutton, T. W., Tesdahl, K. G., Slade, N. A. (1983). Fractionation and turnover of stable carbon isotopes in animal tissues: implications for the 6r3C analysis of diet. Oecologia (Berlin) 57,32-37.
van der Merwe, N. J. (1982). Carbon isotopes, photosynthesis, and archaeology. American Scientist 70,596606.
van der Merwe, N. J. & Vogel, J. C. (1978). 13C content of human collagen as a measure of prehistoric diet in woodland North America. Nature 276,815-6.
Vogel, J. C. (1978). Isotopic assessment of the dietary habits of ungulates. South African Journal of Science 74,298-30 1.
Vogel, J. C. & van der Merwe, N. J. (1977). Isotopic evidence for early maize cultivation in New York State. American Antiquity 42 (2), 238-242.
Winkler, F. J. & Schmidt, H.-L. (1980). Einsatzmoglichkiten der 13Cisotopen- Massenspektrometrie in der lebensmitteluntersuching. Zeitschiffiir Lebensmittelunter suchung und -forschung 171,85-94.