Embed Size (px)
Citation preview

Lab 7 – LEDs to the Rescue!
Figure 7.0. Stoplights with LabVIEW Indicators
Have you ever sat in your car stopped at a city intersection waiting for the stoplight to
change and wondering how long the red light will last? Sometimes it seems like forever.
Using a stop watch at a simple two-way intersection, you will find red lasts for 30
seconds, green lasts for 25 seconds, and yellow lasts for 5 seconds. In some states, these
times may be two, three, or four times as long, but the ratios are always the same.
A property of an electronic diode is that in one direction current flows easily (forward
biased), while in the other direction current flow is blocked. Light emitting diodes
(LEDs) have the same property, but in the forward-biased region light is given off and in
the reverse-biased region the LED is dark. Today, LEDs are used as the primary light
elements in stoplights, so understanding how they operate is useful.

Goal: This lab focuses on using NI ELVIS II to illuminate diode properties, diode test
methods, bit patterns for a two-way stoplight intersection, and the use of NI ELVIS II
APIs in a LabVIEW program to run the stoplights automatically. A Multisim challenge
encourages the reader to design a two-way stoplight intersection using discrete transistor-
transistor logic (TTL) ICs.
Required Soft Front Panels (SFPs) Digital diode tester (DMM[►├. ])
Two-wire current-voltage analyzer (2-Wire)
Digital writer (DigOut)
Required Components
Silicon diode
Six LEDs (2 red, 2 yellow, and 2 green)
Six 220 resistors
Exercise 7.1: Testing Diodes and Determining Their Polarity
A semiconductor junction diode is a polar device with a band on one end which indicates
the cathode. The other end is called the anode . While there are many ways to indicate
this polarity in the packaging of a diode, one thing is always the same – a positive voltage
applied to the anode results in the diode being forward-biased so that current can flow.
You can use NI ELVIS II to determine the diode polarity.
Complete the following steps to set up NI ELVIS II for diode and polarity tests:
1. Launch the NI ELVIS II Instrument Launcher strip and select DMM.
2. Click on the diode test button [►├. ]. Click on Run.
3. Connect one of the LEDs to the workstation banana sockets
DMM (V►├. ) and (COM).
When you apply a positive voltage to the cathode, the diode blocks the current.
The display, which reads the same value as it does when no diode is connected
(open circuit), shows the word OPEN (see Figure 7.1).

Figure 7.1. Reverse-biased Diode Reading
When you apply the positive voltage to the anode, the diode allows current to
flow. The display reads a low voltage level.

Figure 7.2. Forward-biased Diode Reading
For example, a silicon rectifying diode in the forward-bias direction displays a voltage
~0.6 V. In the reverse-bias direction, the display shows the word OPEN.
NOTE: You can use this simple test to determine the polarity of a colored LED. Connect
a red LED to your test leads. In one direction, you see light (forward-biased) and, in the
other direction, no light (reverse-biased). The DMM display does not change, but there is
enough current to produce some light. Check closely − the LED is dimly lit and may be
difficult to see with bright lights in the room. When the LED is lit, the red lead connection
is the anode.
The way this works is that the display shows the voltage required to generate a small
current flow of about 1 mA. In the forward-bias region, this voltage level is usually
smaller than the open circuit voltage. In the reverse-bias direction, no current flows and
the tester displays the word “open”. For LEDs, the voltage threshold is often larger than
the open circuit voltage. The 1 mA test is not sufficient to discern the forward-bias test
(GOOD), but it is enough to generate a low light intensity.
End of Exercise 7.1

Exercise 7.2: Characteristic Curve of a Diode
The characteristic curve of a diode, that is, a plot of the current flowing through the
device as a function of the voltage across the diode, best displays the diode’s electronic
properties.
Complete the following steps to display the characteristic curve of a diode:
1. Place a silicon diode across the DMM/Impedance Analyzer pin sockets
DUT+ and DUT-. The anode diode pin goes to the + input. For reference, the
flat side of the LED is the cathode.
2. Launch the NI ELVIS II Instrument Launcher strip and select the Two-Wire
Current-Voltage Analyzer (2-Wire). A new SFP opens so you can display the
characteristic (I-V) curve for the device under test. This SFP applies a test
voltage to the diode from a starting voltage level to an ending level in
incremental voltage steps, all of which you can select.
3. For a silicon diode, set the following parameters:
Start -2 V
Stop +2.0 V
Increment 0.05 V
4. Set the maximum current in either direction to ensure the diode does not
operate in a current region where damage may occur. Check the diode
specifications.
5. Click on Run and see the I-V curve appear.

Figure 7.3. Current-Voltage Characteristic Curve of a Silicon Diode
In the reverse-bias direction, the current should be very small (A) and negative. In the
forward-bias direction, you should see that above a threshold voltage, the current rises
exponentially to the maximum current limit.
6. Change the Display buttons [Linear/Log] to see the curve plotted on a
different scale.
7. Try the Cursor operation. It gives the (I,V) coordinate values as you move the
cursor along the trace.
The threshold voltage is related to the semiconductor material of the diode. For silicon
diodes, the threshold voltage is about 0.6 V, and for germanium diodes, it is about 0.3 V.
One way to estimate the threshold voltage is to fit a tangent line in the forward-bias
region near the maximum current (refer to Figure 7.4). The point where the tangent
intersects the voltage axis defines the threshold voltage. Observe the (I,V) characteristic
curve for a light emitting diode. For this LED, the threshold voltage given by the
intersection of the tangent with the voltage axis is about 1.56 V.

Figure 7.4. Current-Voltage Curve of a Red LED with Tangent Line
8. Using the Two-Wire Current-Voltage Analyzer, determine the threshold
voltage for a red, yellow, and green LED, and complete the chart below.
Red LED ____________ V
Yellow LED ____________ V
Green LED ____________ V
Do you see a trend?
End of Exercise 7.2Exercise 7.3: Manual Testing and Control of a Two-
Way
Stoplight Intersection
Complete the following steps to build and manually test and control a two-way stoplight
intersection.

1. Install two each of red, yellow, and green LEDs on the NI ELVIS II
protoboard, positioned as a two-way stoplight intersection.
Figure 7.5. LED layout of a Two-way Stoplight Intersection
Each LED is controlled by one binary bit on one of the 8-bit parallel ports on the
protoboard. Use digital I/O bit sockets DIO <0 ..7>.
2. Connect the pin socket DIO <0> to the anode of the red LED in the North-
South (Up-Down) direction.
3. Connect the other end of the LED through a 220 resistor to digital ground
(not pictured).
NOTE: The resistor is used to limit the current through the LED.
4. Connect the remaining colored LEDs in a similar fashion.
Here is the complete mapping scheme.
DIO <0> Red N-S direction DIO <4> Red E-W direction
DIO <1> Yellow N-S direction DIO <5> Yellow E-W direction
DIO <2> Green N-S direction DIO <6> Green E-W direction
5. From the NI ELVIS II Instrument Launcher strip, select Digital Writer
(DigOut).

6. Using the vertical slide switches, select any 8-bit pattern and output that
pattern to the NI ELVIS II digital lines. Recall that Bit 0 is connected to the
pin socket on the protoboard labeled DIO <0>.
7. Set the Generation Mode to (Run Continuous) and Pattern to (Manual), as
shown in Figure 7.6.
8. To activate the port, click on the Run button.
Figure 7.6. Digital Writer for Testing LEDs
When all switches (Bits 0-2 and 4-6) are HI, all the LEDs should be lit.
When all these switches are LO, all the LEDs should be off.
You can now use these switches to find out which 8-bit codes are necessary to
control the various cycles of a stoplight intersection.

Here are some clues for an intersection. The basic operation of a stoplight is based
on a 60-second time interval with 30 seconds for red, followed by 25 seconds for
green, followed by 5 seconds for yellow. For example, in a two-way intersection,
the yellow light in the North-South direction is on while the red light in the East-
West direction is on. This modifies the 30-second red timing interval to two
timing intervals: a 25-second cycle followed by a 5-second cycle. There are four
timing periods (T1, T2, T3, and T4) for two-way stoplight intersection operation.
9. Study the following chart to see how a two-way stoplight intersection works.
Direction N-S E-W
Lights RYG RYG 8-Bit Code Decimal Value
Bit # 0 1 2 4 5 6
T1 25 s 0 0 1 1 0 0 00001100 12
T2 5 s 0 1 0 1 0 0 ________ ___________
T3 25 s 1 0 0 0 0 1 ________ ___________
T4 5 s 1 0 0 0 1 0 ________ ___________
10. Use the Digital Writer to determine which 8-bit codes need to be written to the
digital port to control the stoplights in each of the four timing intervals.
For example, timing period 1 requires the code 00101000. Computers read the
bits in the reverse order (least significant bit on the right). This code then becomes
00010100. In the white box above the Manual Pattern Line switches display, you
can read the radix of the switch pattern in binary {00010100}, decimal {20}, or
hexadecimal {14}.
11. Click on the black ^ to left of the white display box to change the radix. You
can use this feature to determine the numeric codes for the other timing
intervals T2, T3, and T4. If you output the 8-bit code for each of the timing
intervals in sequence, you can manually operate the stoplights.
NOTE: You can also change the radix in the Line States display by clicking on the white
x beside the Numeric Value display.
Repeating this four-cycle sequence automates your intersection.
End of Exercise 7.3
Exercise 7.4: Automatic Operation of the Two-Way Stoplight
Intersection
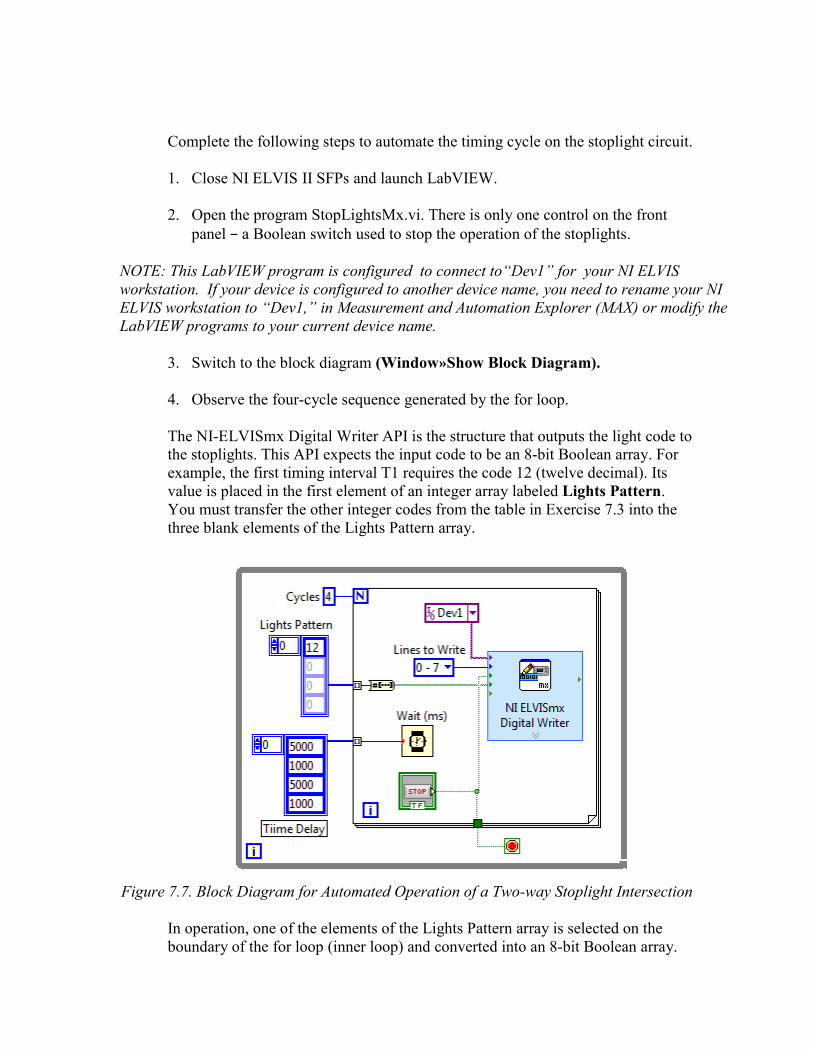
Complete the following steps to automate the timing cycle on the stoplight circuit.
1. Close NI ELVIS II SFPs and launch LabVIEW.
2. Open the program StopLightsMx.vi. There is only one control on the front
panel − a Boolean switch used to stop the operation of the stoplights.
NOTE: This LabVIEW program is configured to connect to“Dev1” for your NI ELVIS
workstation. If your device is configured to another device name, you need to rename your NI
ELVIS workstation to “Dev1,” in Measurement and Automation Explorer (MAX) or modify the
LabVIEW programs to your current device name.
3. Switch to the block diagram (Window»Show Block Diagram).
4. Observe the four-cycle sequence generated by the for loop.
The NI-ELVISmx Digital Writer API is the structure that outputs the light code to
the stoplights. This API expects the input code to be an 8-bit Boolean array. For
example, the first timing interval T1 requires the code 12 (twelve decimal). Its
value is placed in the first element of an integer array labeled Lights Pattern.
You must transfer the other integer codes from the table in Exercise 7.3 into the
three blank elements of the Lights Pattern array.
Figure 7.7. Block Diagram for Automated Operation of a Two-way Stoplight Intersection
In operation, one of the elements of the Lights Pattern array is selected on the
boundary of the for loop (inner loop) and converted into an 8-bit Boolean array.

In a similar way, the appropriate time delay is selected at the for loop boundary
and passed to the Wait function.
The timing intervals are stored in the four elements of the Time Delay array. To
speed up operation, the 25-second time interval is reduced to 5 seconds and the 5-
second time interval is reduced to 1 second.
End of Exercise 7.4
What’s Cool!
LEDs are amazing devices. If you multiply the threshold voltage, VT, times the electronic
charge, e, the product is energy that is close to the band gap energy of the semiconductor
material used to manufacture the semiconductor diode. Further, in the forward-biased
region, the light from the LED has an energy of hc/ where h is Planck’s constant, c is
the speed of light, and is the wavelength of the center of the energy distribution.
Conservation of energy yields the equation:
eVT ~ hc/
From the LED specifications, you can determine the wavelength or the LED color. For
example, red LEDs have a wavelength of about 560 nm. From the I-V characteristic
curve of the LED (see Exercise 7.2), you can measure the threshold voltage VT. If you
plot VT versus 1/ for the three different colored LEDs, you find a straight line with a
slope approximately equal to (hc/e), a mixture of three fundamental constants of nature.
Multisim Challenge: Design a Control Circuit for a Two-Way Stoplight
Intersection
Modern-day stoplights use a cluster of red, yellow, or green LEDs to produce the
stoplight signals. In this lab, you have learned about the electrical and optical
characteristics of visible LEDs. You have used colored LEDs to form a simple two-way
stoplight intersection and a LabVIEW program to control the light sequences. With
Multisim, you can design a stoplight controller using discreet logic ICs. A stoplight
program requires a shift register and variable delays. Recall that the red light is on for (25
+ 5) seconds, the green light for 25 seconds, and the yellow light for 5 seconds. Load the
Multisim program called Stop Light Timing. Study the operation carefully.
This program uses two 7474 Dual D edge-triggered flip-flop ICs to form a 4-bit shift
register. It uses a special clock circuit to generate the timing sequence 25, 5, 25, 5
seconds. This program controls only one set of red, yellow, and green stoplights. Your
challenge is to modify the program so that it can control two sets of stoplights in a two-
way stoplight intersection.