Embed Size (px)
DESCRIPTION
the next one
Citation preview

203.343 Advanced Genetics
and Genomics
Lecture 5
July 27th 2015
Olin Silander
Mary-Claire King and BRCA1
Listen: http://themoth.org/posts/storytellers/mary-claire-king

Gene Linkage and Linkage Disequilibrium
Why do different loci have the same demographic histories?
Tishkoff et al. (2007)
LCTlactase-phlorizin
hydrolase

Gene Linkage and Linkage Disequilibrium
selection increases LD
selection decreases local nucleotide diversity
selection increases the frequency of rare alleles relative to what you would expect
Gene Linkage and Linkage Disequilibrium
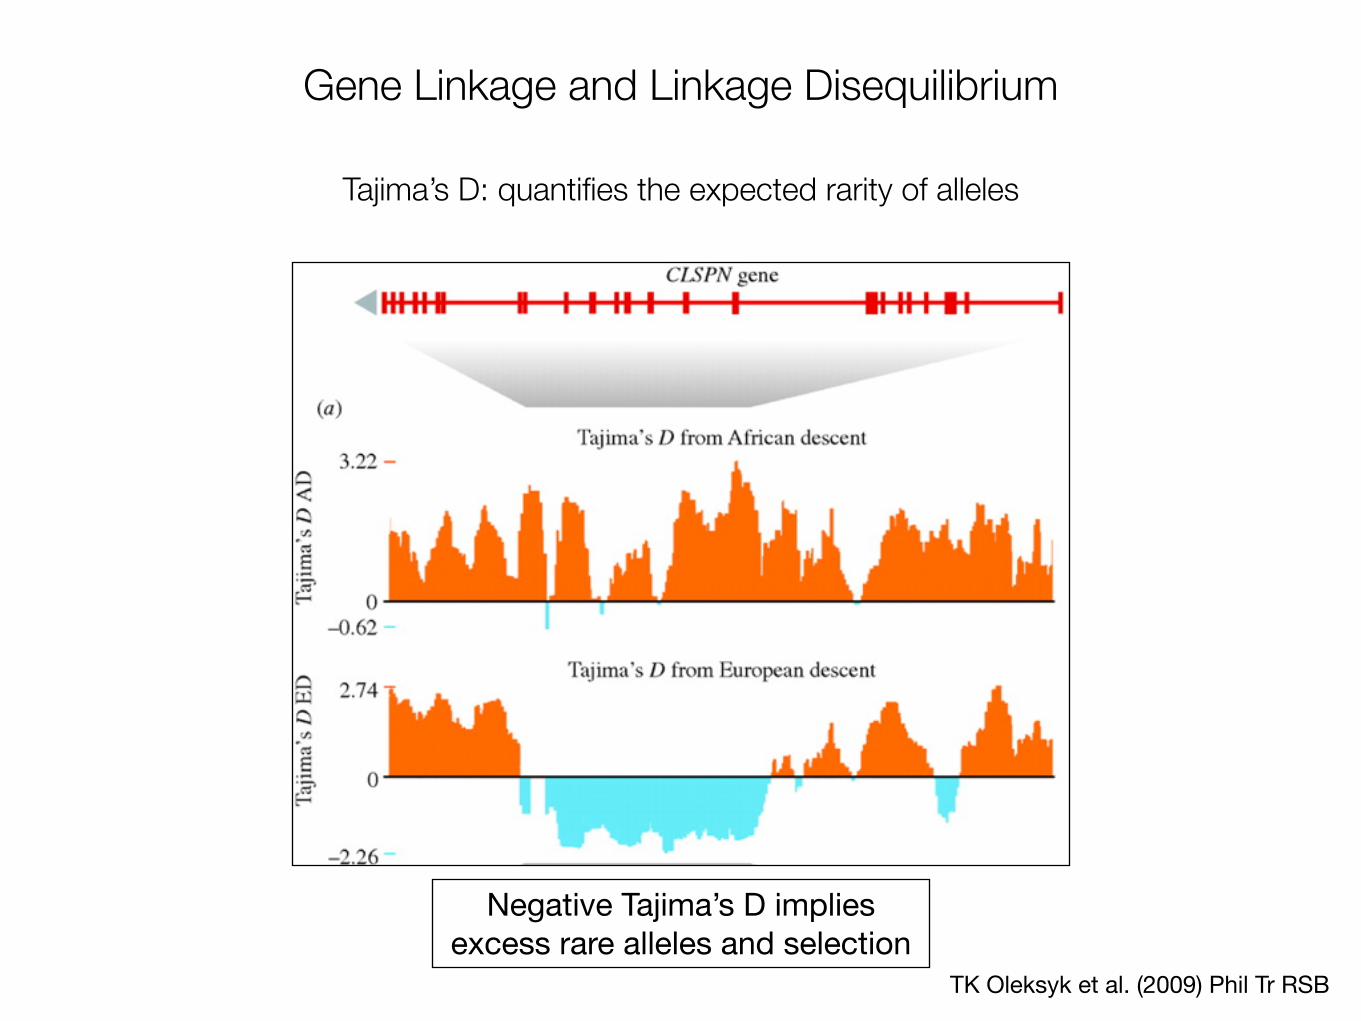
Tajima’s D: quantifies the expected rarity of alleles
TK Oleksyk et al. (2009) Phil Tr RSB
Negative Tajima’s D implies excess rare alleles and selection

Gene Linkage and Linkage Disequilibrium
TK Oleksyk et al. (2009) Phil Tr RSB
Negative Tajima’s D implies excess rare alleles and selection
Tajima’s D: quantifies the expected rarity of alleles

Gene Linkage and Linkage Disequilibrium
Why do different loci have the same demographic histories?
H Alhaddad, R Khan et al. (2013) PLOS One
?
? ?
Birman♀♂ pair
after WWII
Burmesesingle ♀in 1930
Manxbred since
1800

Gene Linkage and Linkage Disequilibrium
Why do different loci have the same demographic histories?
Burmese
BirmanManx
population bottleneck (drift)
Birman♀♂ pair
after WWII
Burmesesingle ♀in 1930
Manxbred since
1800
H Alhaddad, R Khan et al. (2013) PLOS One

Linkage Disequilibrium - Data
Paigen and Petkov (2010) Nat. Rev. Gen.
recombination rate varies by >10-fold

SNP diversity and effective population size
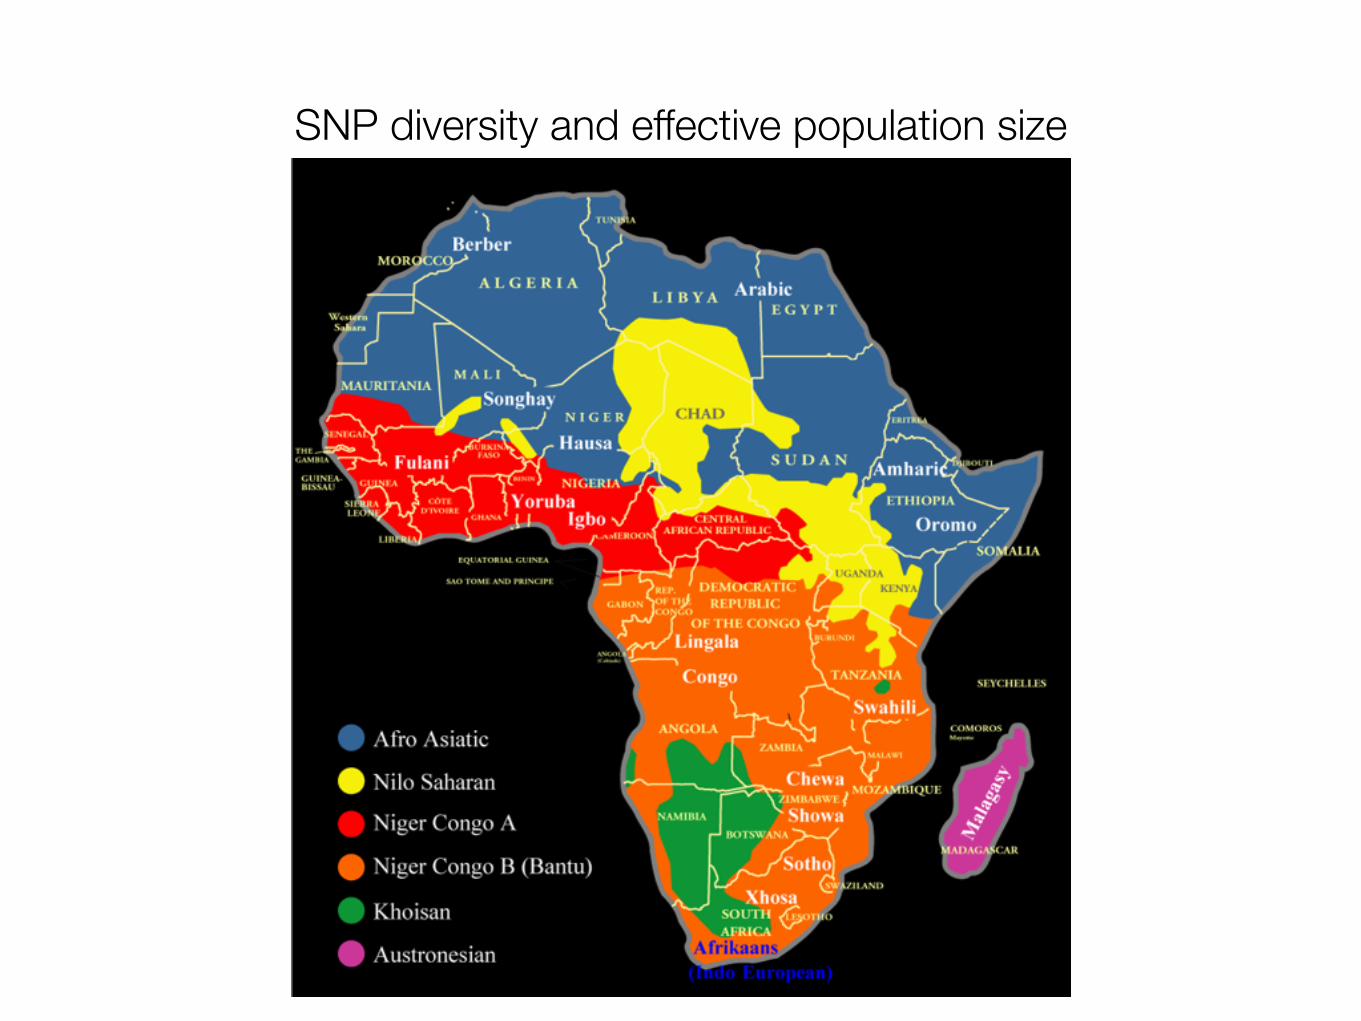
SNP diversity and effective population size

SNP diversity
HapMap III

Linkage analysis
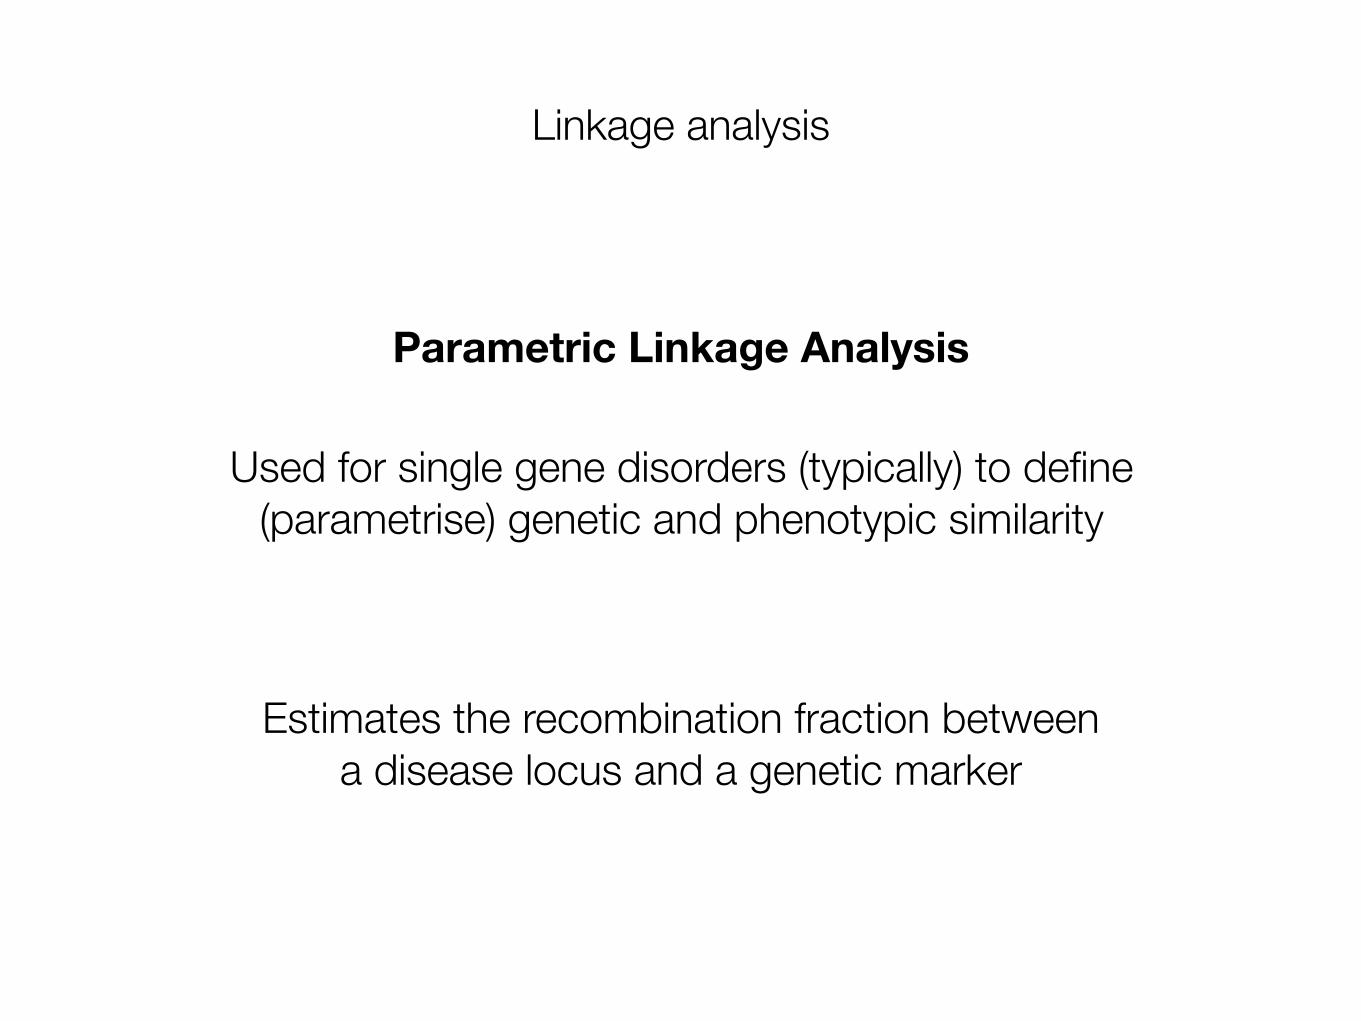
Parametric Linkage Analysis
Used for single gene disorders (typically) to define (parametrise) genetic and phenotypic similarity

Linkage analysis
Parametric Linkage Analysis
Used for single gene disorders (typically) to define (parametrise) genetic and phenotypic similarity
Requires: (1) Pedigree (2) Phenotypes (3) Marker genotypes

Linkage analysis
Parametric Linkage Analysis
Used for single gene disorders (typically) to define (parametrise) genetic and phenotypic similarity
Requires: (1) Pedigree (2) Phenotypes (3) Marker genotypes

Linkage map
linkage group
Linkage analysis
Parametric Linkage Analysis
Used for single gene disorders (typically) to define (parametrise) genetic and phenotypic similarity
Estimates the recombination fraction between a disease locus and a genetic marker

Parametric Linkage Analysis
Marker locus with two Alleles, A1 and A2
Hypothesis: disease mutation is dominant
Hypothesis: disease locus is linked to marker locus

A2/A2 A1/A1
A1/A1A1/A2
A1/A2A1/A2A1/A2A1/A1A1/A1A1/A2A1/A2
Parametric Linkage Analysis
Disease originally associated with marker allele A2

A2/A2 A1/A1
A1/A1A1/A2
A1/A2A1/A2A1/A2A1/A1A1/A1A1/A2A1/A2
Parametric Linkage Analysis
Disease originally associated with marker allele A2
Segregates with marker allele A2 in 6 meioses (disease allele is dominant)

A2/A2 A1/A1
A1/A1A1/A2
A1/A2A1/A2A1/A2A1/A1A1/A1A1/A2A1/A2
Parametric Linkage Analysis
Disease originally associated with marker allele A2
Segregates with marker allele A2 in 6 meioses (disease allele is dominant)
Separates from marker allele A2 in one instance
disease allele no longer with marker allele A2 → recombination
event must have occurred

Parametric Linkage Analysis
Need to compare two Likelihoods to understand whether the A locus is linked to the disease

Need to compare two Likelihoods to understand whether the A locus is linked to the disease
Parametric Linkage Analysis
likelihood of the data if locus A and disease locus (D) are linked

Need to compare two Likelihoods to understand whether the A locus is linked to the disease
Parametric Linkage Analysis
likelihood of the data if locus A and disease locus (D) are linked
likelihood of the data if locus A and the disease locus are not linked
A D
A
D

Parametric Linkage Analysis
Summarised as the ratio of the likelihoods
L( recomb.)
L( recomb = 1/2 )LOD = log10 [ ]
^
best estimate

A2/A2 A1/A1
A1/A1A1/A2
A1/A2A1/A2A1/A2A1/A1A1/A1A1/A2A1/A2
Parametric Linkage Analysis
Disease originally associated with marker allele A2
Segregates with marker allele A2 in 6 meioses (disease allele is dominant)
Separates from marker allele A2 in one instance

calculating likelihoods
Parametric Linkage Analysis

A2/A2 A1/A1
A1/A1A1/A2
A1/A2A1/A2A1/A2A1/A1A1/A1A1/A2A1/A2
Parametric Linkage Analysis
maximum likelihood recombination rate between locus A and D = 0.14 likelihood = 0.057
if recomb. rate between locus A and D = 0.5 likelihood = 0.0078

Parametric Linkage Analysis
maximum likelihood recombination rate between locus A and D = 0.14 likelihood = 0.057
if recomb. rate between locus A and D = 0.5 likelihood = 0.0078
L( recomb.)
L( recomb = 1/2 )LOD = log10 [ ]
^
best estimate (maximum likelihood estimate)

Parametric Linkage Analysis
maximum likelihood recombination rate between locus A and D = 0.14 likelihood = 0.057
if recomb. rate between locus A and D = 0.5 likelihood = 0.0078
L( recomb.)
L( recomb = 1/2 )LOD = log10 [ ]
^
best estimate (maximum likelihood estimate)
LOD = 0.86
Need LOD > 2 to have some confidence that marker and disease locus are linked.
LOD > 3 strong evidence of linkage

A2/A2 A1/A1
A1/A1A1/A2
A1/A2A1/A2A1/A2A1/A1A1/A1A1/A2A1/A2
Parametric Linkage Analysis
maximum likelihood recombination rate between
locus A and D = 0.08 likelihood = 0.032
if recomb. rate between locus A and D = 0.5 likelihood = 0.00024
A2/A2 A1/A1
A1/A1A1/A2
A1/A2A1/A2A1/A2A1/A1A1/A1A1/A2A1/A2
Two families Disease allele segregates with A2 in 11 instances
Disease allele separates from A2 in 1 instance
LOD = 2.12 → some confidence that locus A and the disease locus are linked
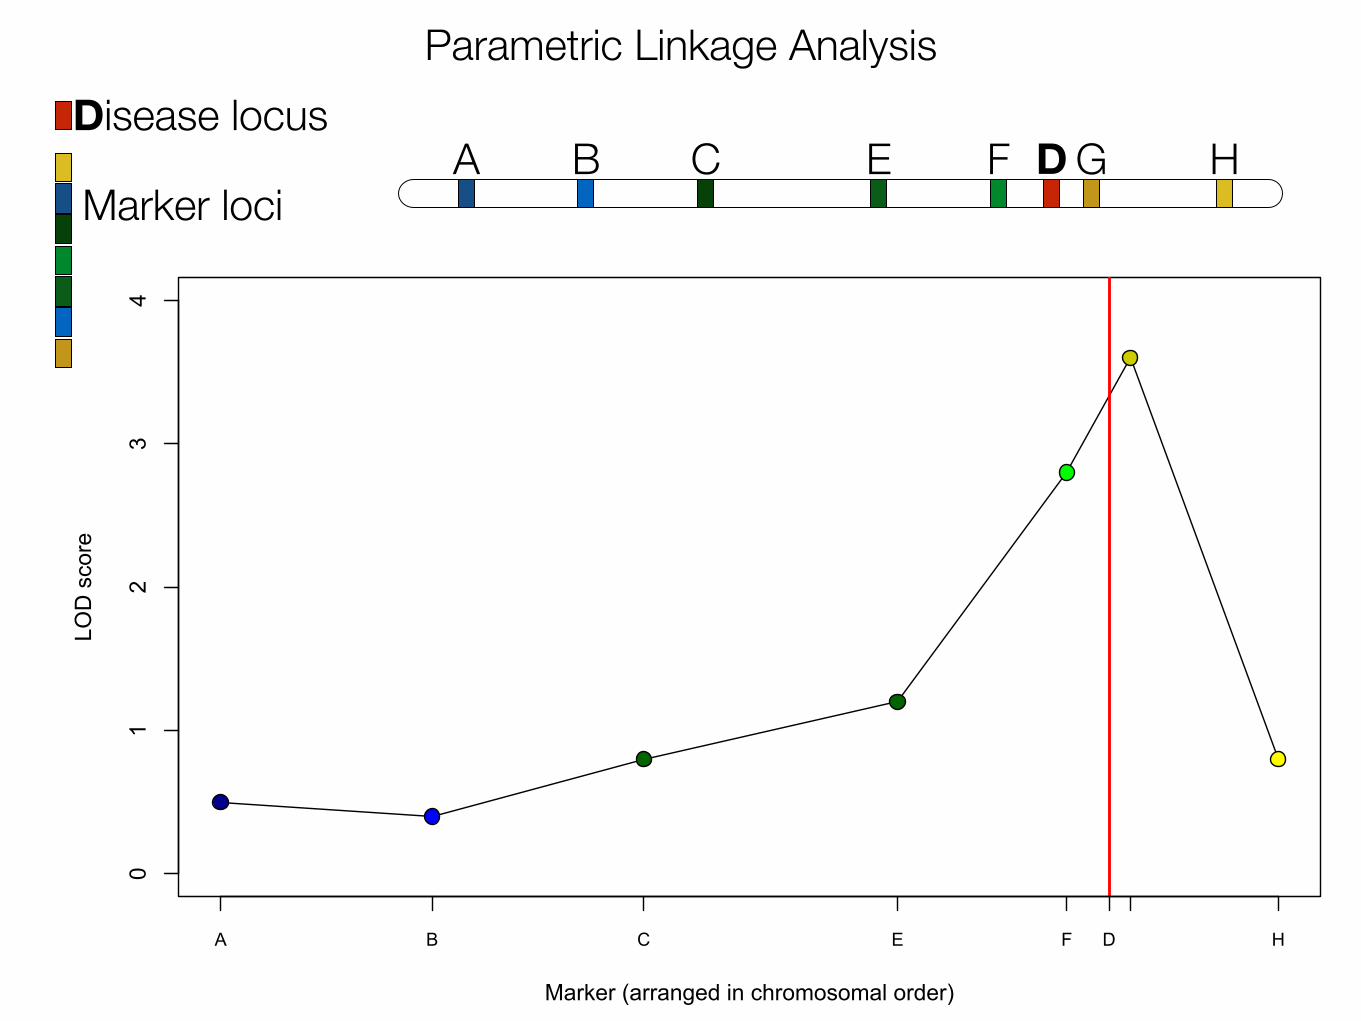
Parametric Linkage Analysis
E DCBA F G HDisease locus
Marker loci0
12
34
Marker (arranged in chromosomal order)
LOD
sco
re
A B C E F D H

Parametric Linkage Analysis

Parametric Linkage Analysis

Parametric Linkage Analysis

Parametric Linkage Analysis

Association Studies
Linkage Studies (pedigrees)
Association Studies (populations)

Association Studies
June 2006

June 2007

June 2009

June 2011

June 2013

Association Studies
A/A A/C C/C230
review!
260 23

Association Studies
A/A A/C C/C230
review!
260 23
minor allele?
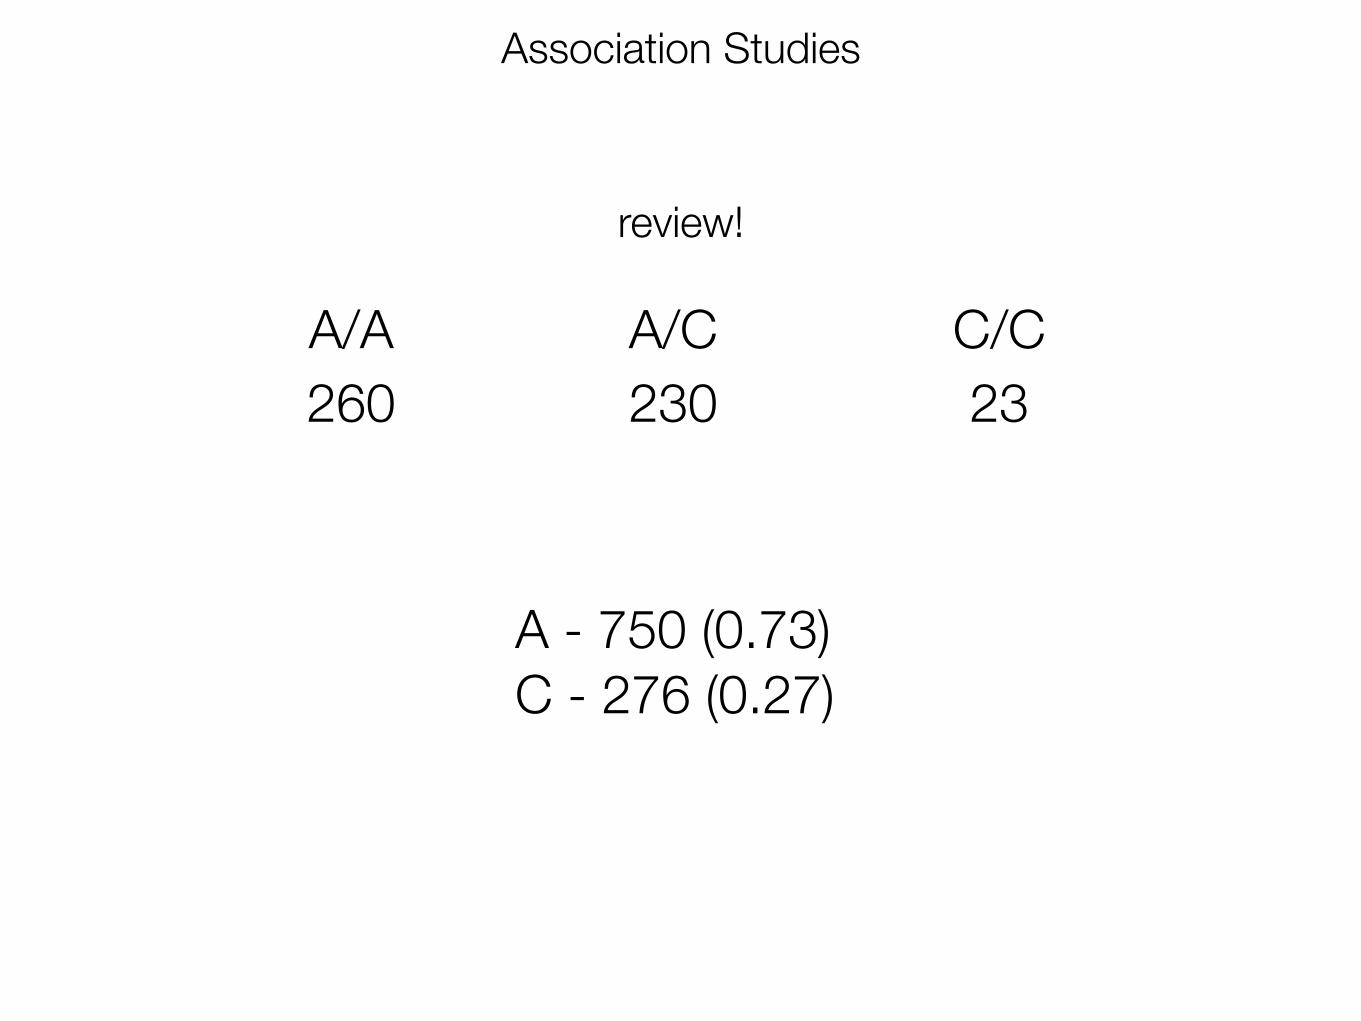
Association Studies
A/A A/C C/C230
review!
260 23
A - 750 (0.73) C - 276 (0.27)

Association Studies
A/A A/C C/C230
review!
260 23
A - 750 (0.73) C - 276 (0.27)
HWE?

Association Studies
A/A A/C C/C230
review!
260 23274 202
A - 750 (0.73) C - 276 (0.27)
37

Association Studies
A/A A/C C/C230
review!
260 23274 202 37
0.72 3.88 5.29
HWE?UNLIKELY

Association Studies

Association Studies
casecasecasecasecasecase
controlcontrolcontrolcontrolcontrolcontrol
0 1 2 1 0 2 1 0 20 1 2 1 0 2 1 1 12 1 2 1 0 2 0 0 20 2 2 2 1 1 2 0 01 2 2 1 1 2 1 2 20 1 2 0 0 1 0 2 2
1 0 0 0 1 0 2 1 22 1 0 1 0 2 1 0 00 1 0 1 0 2 2 1 21 0 0 2 0 2 1 0 20 1 0 1 0 2 1 0 10 2 0 1 2 1 0 2 2

Association Studies
casecasecasecasecasecase
controlcontrolcontrolcontrolcontrolcontrol
0 1 2 1 0 2 1 0 20 1 2 1 0 2 1 1 12 1 2 1 0 2 0 0 20 2 2 2 1 1 2 0 01 2 2 1 1 2 1 2 20 1 2 0 0 1 0 2 2
1 0 0 0 1 0 2 1 22 1 0 1 0 2 1 0 00 1 0 1 0 2 2 1 21 0 0 2 0 2 1 0 20 1 0 1 0 2 1 0 10 2 0 1 2 1 0 2 2

Parametric Linkage Analysis


