Embed Size (px)
Citation preview

1
Geology 4182: Physical HydrogeologySpring 2009
TTH 9:00-10:30 AME207 Howe-Russell
• Instructor: Jeffrey A. Nunn• Office:Room E339 Howe-Russell• Telephone:578-3353/0081• e-mail: [email protected]• Office hours: 2:30 to 4:30 M or by appointment
Resources
• Class web page http://www.geol.lsu.edu/jnunn/gl4182/– Course outline, exam schedule– Outlines of each lecture– Post grades
• Text: C. W. Fetter, Applied Hydrogeology, 4th Edition
Classroom Conduct• Turn off cell phones and other electronic
devices• Put away newspapers, magazines etc.• Arrive on time• If you MUST leave early, let me know and
leave quietly

2
Evaluation
• Four Problem Sets (140 points)• Four Individual Projects (200 points) • Group Project (100 points)• Blog participation (60 points)• Three Exams (300 points)
CxC Certified: Written & Technological Communication
This course is certified as a “Communication-Intensive Course” and meets all of the requirements explained on the CxC Web site: http://cxc.lsu.edu., including the following: Emphases on formal and informal assignments in written communication and technological communication, class time spent on communication, 40% of the final grade based on communication projects, revisions after faculty feedback on 2 formal projects (one for each emphasis), and a student/faculty ratio of 35:1. Because it meets these requirements, students may count it toward “Distinguished Communicator” certification on LSU transcripts.
Technological CommunicationIndividual Projects• Excel Program of Laplace’s Method• Well Test Software• Basin 2 simulations of driving forces• Louisiana Groundwater Usage (with graphs
using google application)Group Project• Environmental Consulting Firm Video

3
Hydrologic Reservoirs
The Distribution of Water on EarthThe Distribution of Water on Earth
Figure 13.1
4
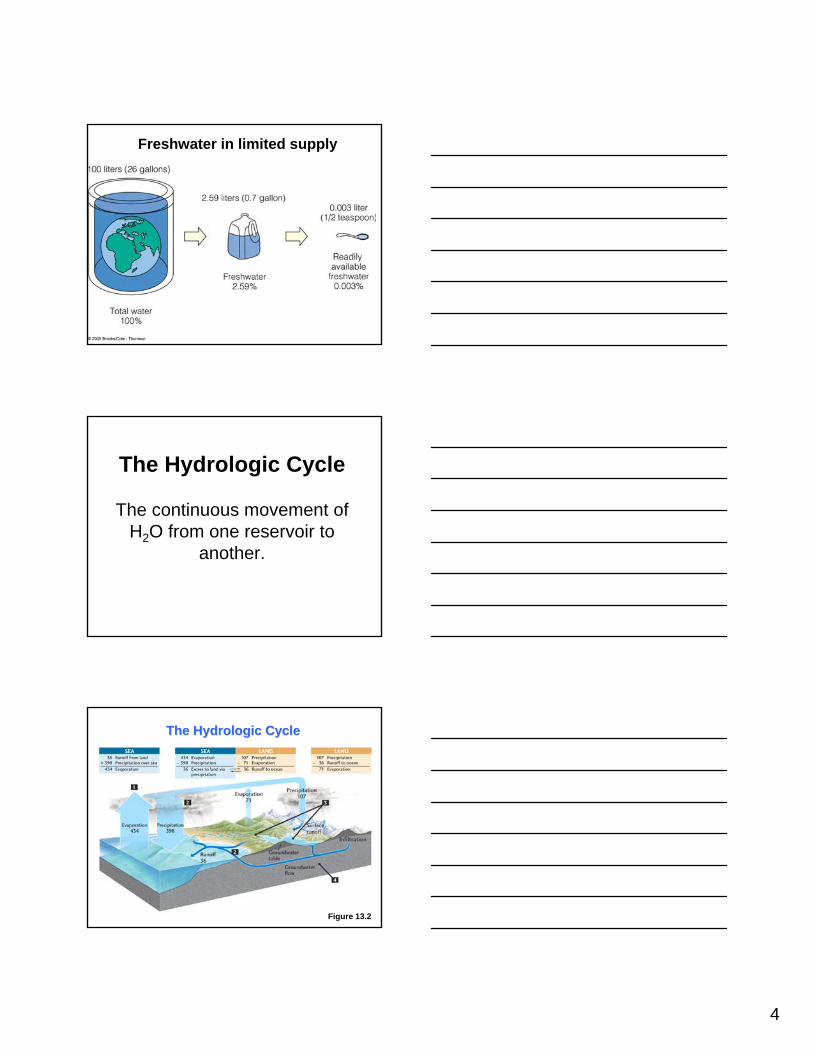
Freshwater in limited supply
The Hydrologic Cycle
The continuous movement of H2O from one reservoir to
another.
Figure 13.2
The Hydrologic CycleThe Hydrologic Cycle
5
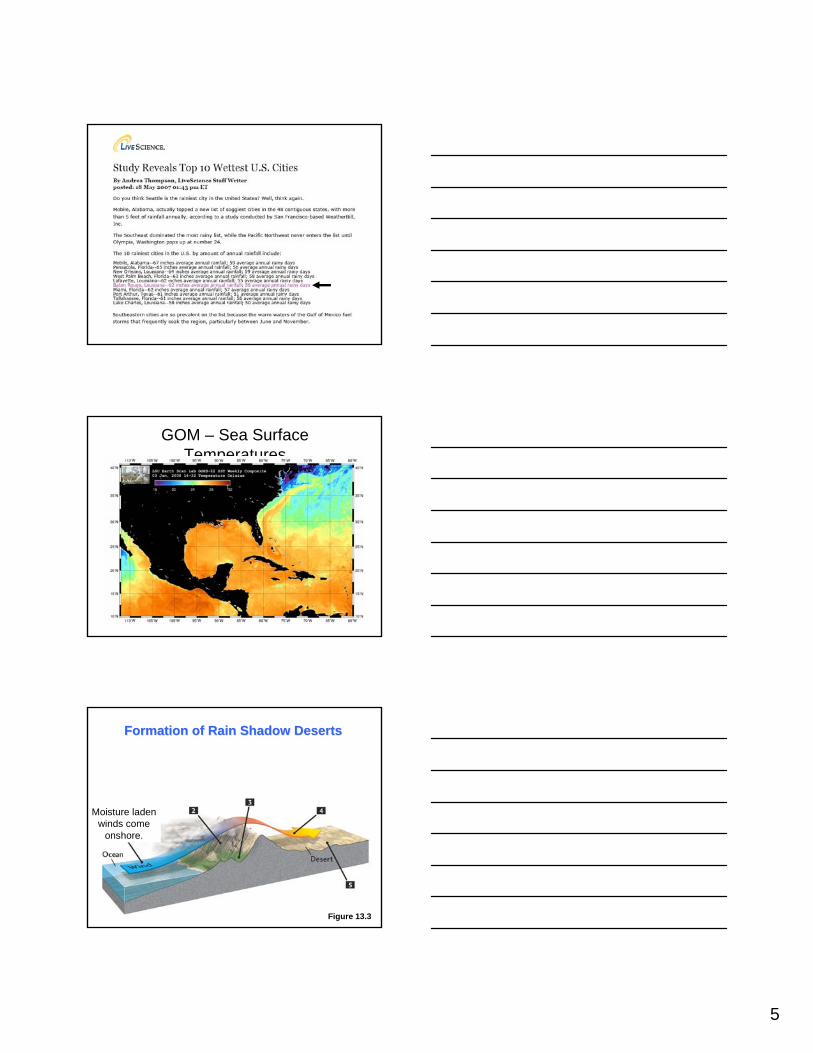
GOM – Sea Surface Temperatures
Figure 13.3
Formation of Rain Shadow DesertsFormation of Rain Shadow Deserts
Moisture laden winds come
onshore.

6
Figure 13.3
Formation of Rain Shadow DesertsFormation of Rain Shadow Deserts
Moisture laden winds come
onshore.
Moist airmassrise and cool,
causing precipitation…
Figure 13.3
Formation of Rain Shadow DesertsFormation of Rain Shadow Deserts
Moisture laden winds come
onshore
Moist airmassrise and cool,
causing precipitation…
…resulting in a rainy windward
slope.
Figure 13.3
Formation of Rain Shadow DesertsFormation of Rain Shadow Deserts
Moisture laden winds come
onshore
Moist airmassrise and cool,
causing precipitation…
…resulting in a rainy windward
slope
Moisture-depleted airmasssink and warm,
reducing relative humidity…

7
Figure 13.3
Formation of Rain Shadow DesertsFormation of Rain Shadow Deserts
Moisture laden winds come
onshore
Moist airmassrise and cool,
causing precipitation…
…resulting in a rainy windward
slope
Moisture-depleted airmasssink and warm,
reducing relative humidity…
…forming arain shadowrain shadow on the
leeward side of the mountains.
Figure 13.4.a
Average U.S. Annual PrecipitationAverage U.S. Annual Precipitation
Figure 13.4.b
Average U.S. Annual RunoffAverage U.S. Annual Runoff

8
Table 13.1: Table 13.1: Average Discharges of Major Rivers of the WorldAverage Discharges of Major Rivers of the World

9
Figure 13.16
U.S. Groundwater Withdrawals: 1950U.S. Groundwater Withdrawals: 1950--19951995
Artesian Well
Baton Rouge in 1943?
10
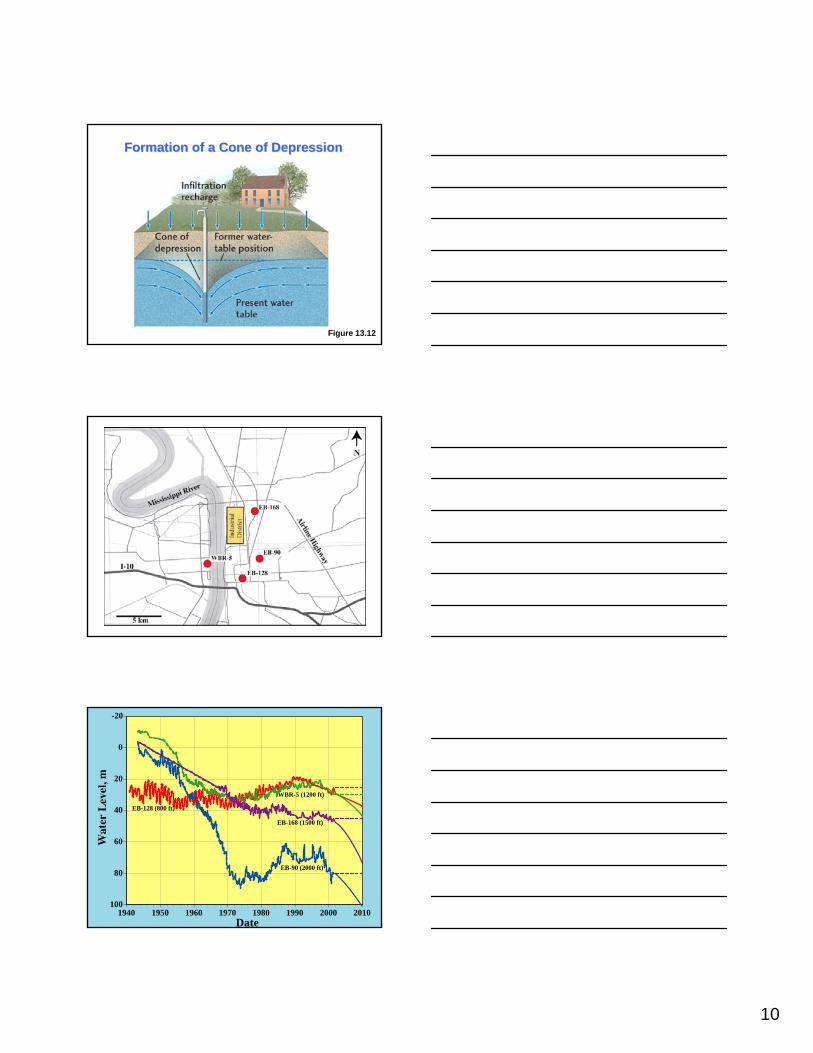
Figure 13.12
Formation of a Cone of DepressionFormation of a Cone of Depression
100
80
60
40
20
0
-20
Date
EB-168 (1500 ft)
EB-90 (2000 ft)
1940 1950 1960 1970 1980 1990 2000 2010
EB-128 (800 ft)
WBR-5 (1200 ft)

11
Figure 13.4.a
Average U.S. Annual PrecipitationAverage U.S. Annual Precipitation
Figure 13.13
Fissures and depressionsFissures and depressionscaused by caused by
ground subsidence ground subsidence due to due to overpumpingoverpumping
of groundwaterof groundwater

12
Figure 13.14
The thickness of the fresh The thickness of the fresh groundwater floating on top of groundwater floating on top of the salty groundwater is the salty groundwater is affected by the balance affected by the balance between between groundwater groundwater recharge and recharge and discharge discharge
Figure 13.14
If the rate of discharge increases If the rate of discharge increases too much (by too much (by overpumpingoverpumping), the ), the saltwater will rise, causing saltwater will rise, causing saltwater intrusionsaltwater intrusionin the well in the well
InvertedCone of depression
GROUND-WATER WITHDRAWALS IN LOUISIANA, 1960-2000
15251438
1764
1341 1299
16341562
11731029
0
200
400
600
800
1000
1200
1400
1600
1800
2000
1960 1965 1970 1975 1980 1985 1990 1995 2000
WIT
HD
RA
WA
LS, I
N M
ILLI
ON
GA
LLO
NS
PER
DA
Y

13
G R O UN D- WATER WITHDR AWALS , 2 0 0 0( 1, 6 0 0 MILL IO N G ALLO NS P ER D AY )
P u b lic S u p p ly2 2 %
In d u st r y17 %
P o w e r G e n e r a t io n2 %
R u r a l D o me st ic3 %
L ive st o c k0 %
Ir r ig a t io n4 8 %
A q u a c u l t u r e8 %
Irrigation Farming
Salt accumulation at soil surface from evaporation of irrigation water, CA

14
0 - 2
2 - 1 0
1 0 - 5 0
5 0 - 1 0 0
1 0 0 - 2 0 0
GROUND-WATER WITHDRAWALS,IN MILLION GALLONS PER DAY
Box 13.2
The OgallalaThe OgallalaAquifer:Aquifer:
““Mining Mining GroundwaterGroundwater””
Figure 13.18Figure 13.18
The Winter Park Sinkhole, FloridaThe Winter Park Sinkhole, Florida
15
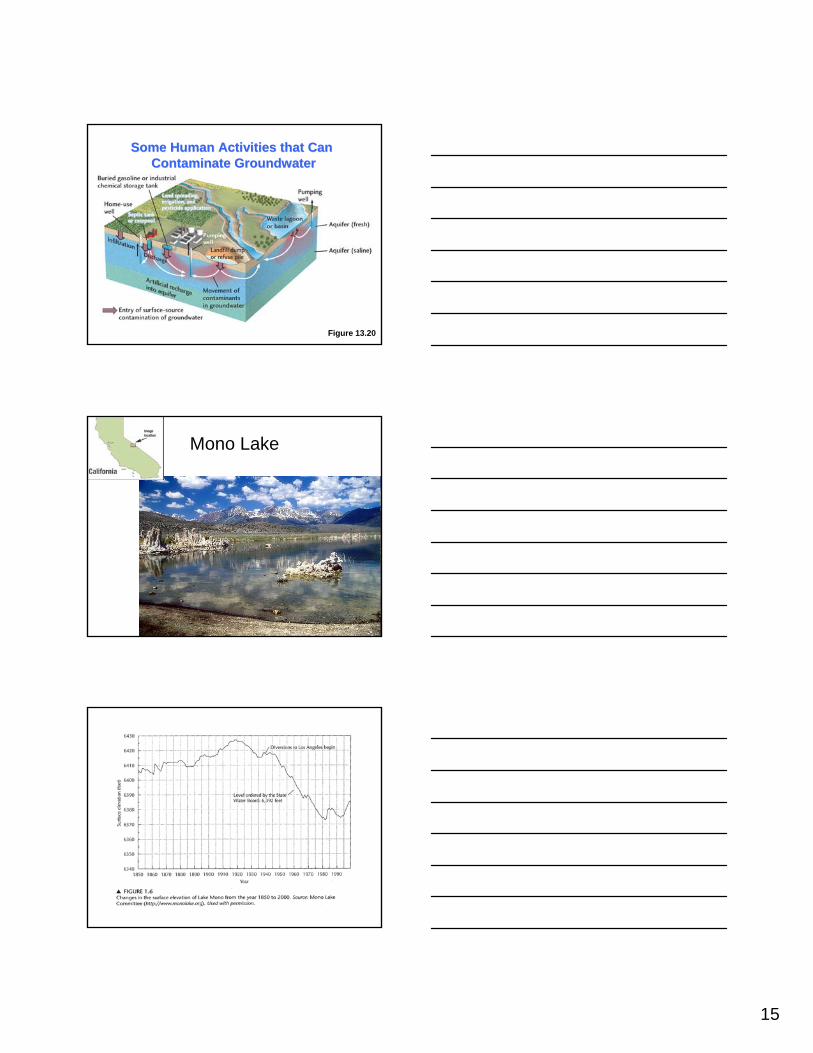
Figure 13.20
Some Human Activities that Can Some Human Activities that Can Contaminate GroundwaterContaminate Groundwater
Mono Lake
16
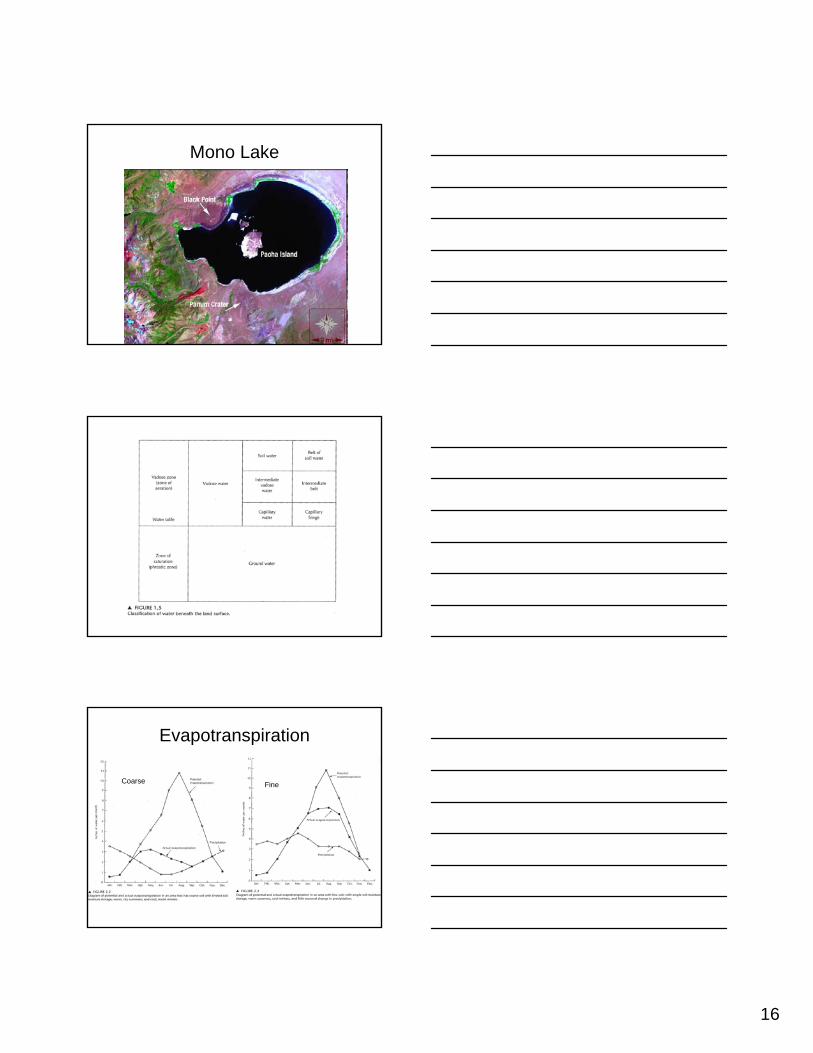
Mono Lake
Evapotranspiration
Coarse Fine

17
Infiltration Capacity
Infiltration Capacity and Precipitation Rate
Infiltration, Storage & Overland Flow

18
Interflow
Baseflow and Water-table Gradient
Base-flow Recession

19
Recession Constant
Overland Flow vs. Baseflow
Gaining/Losing Streams

20
Changes during Floods
Induced Infiltration

21
Baseflow Recessions

22