Embed Size (px)
Citation preview
Lecture Unit 5Section 5.4
Testing Hypothesesabout Proportions
1

Example
Cellphone companies have discovered that college students, their biggest customers, have difficulty setting up all the features of their smart phones, so they have developed what they hope are simpler instructions.
The goal is to have at least 96% of customers succeed. The new instructions are tested on 200 students, of whom 188 (94%) were successful.
Is this evidence that the new instructions fail to meet the companies’ goal?
2

3
The Dow Jones Industrial Average closing prices for the bull market 1982-1986:
4
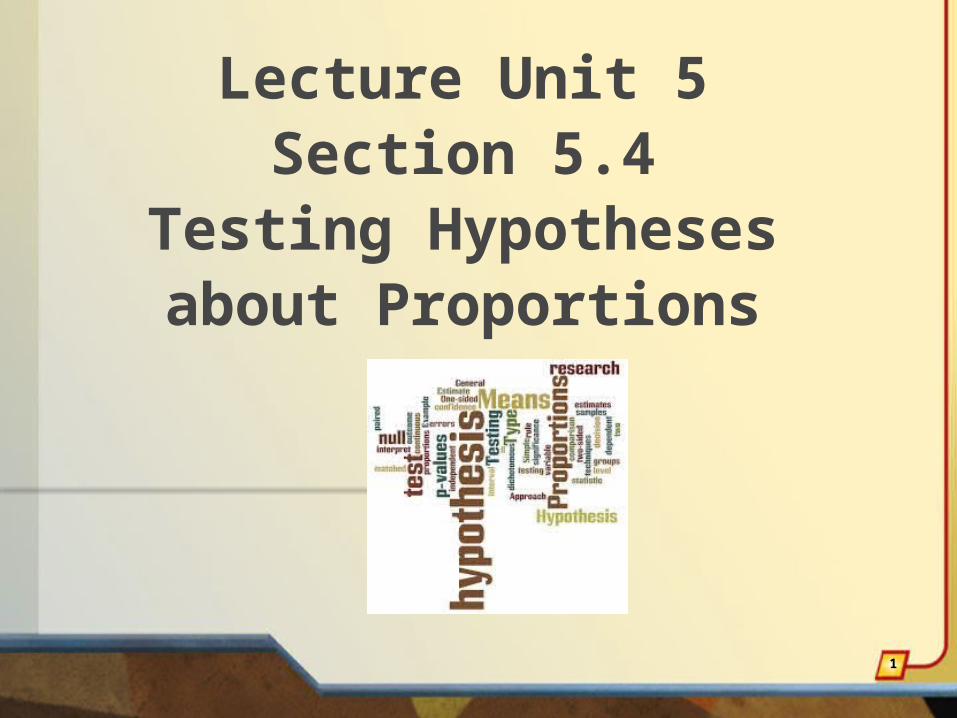
QUESTION: Is the Dow just as likely to move higher as it is to move lower on any given day?
Out of the 1112 trading days in that period, the average increased on 573 days (sample proportion = 0.51530.
That is more “up” days than “down” days.
But is it far enough from 0.50 to cast doubt on the assumption of equally likely up or down movement?
ˆ 0.5153is greater than 0.50, but ?p
5
Rigorous Evaluation of the data: Hypothesis Testing
To test whether the daily fluctuations are equally likely to be up as down, we assume that they are, and that any apparent difference from 50% is just random fluctuation.
Hypotheses
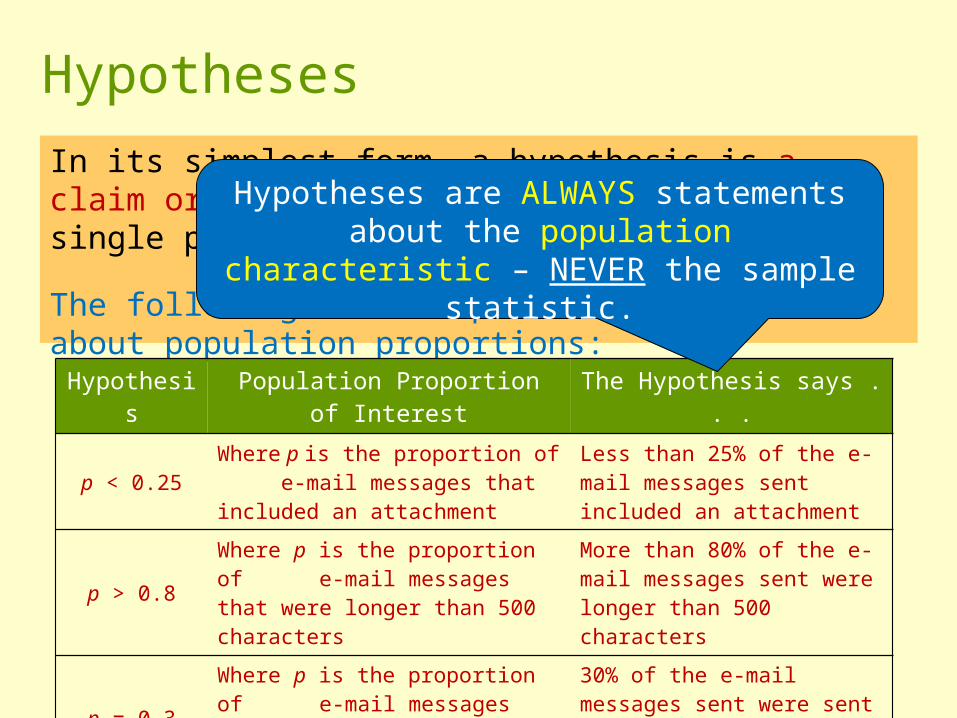
In its simplest form, a hypothesis is a claim or statement about the value of a single population parameter.
The following are examples of hypotheses about population proportions:
Hypothesis
Population Proportion of Interest The Hypothesis says . . .
p < 0.25Where p is the proportion of e-mail messages that included an attachment
Less than 25% of the e-mail messages sent included an attachment
p > 0.8Where p is the proportion of e-mail messages that were longer than 500 characters
More than 80% of the e-mail messages sent were longer than 500 characters
p = 0.3Where p is the proportion of e-mail messages that were sent to multiple recipients
30% of the e-mail messages sent were sent to multiple recipients
Hypotheses are ALWAYS statements about the population characteristic –
NEVER the sample statistic.
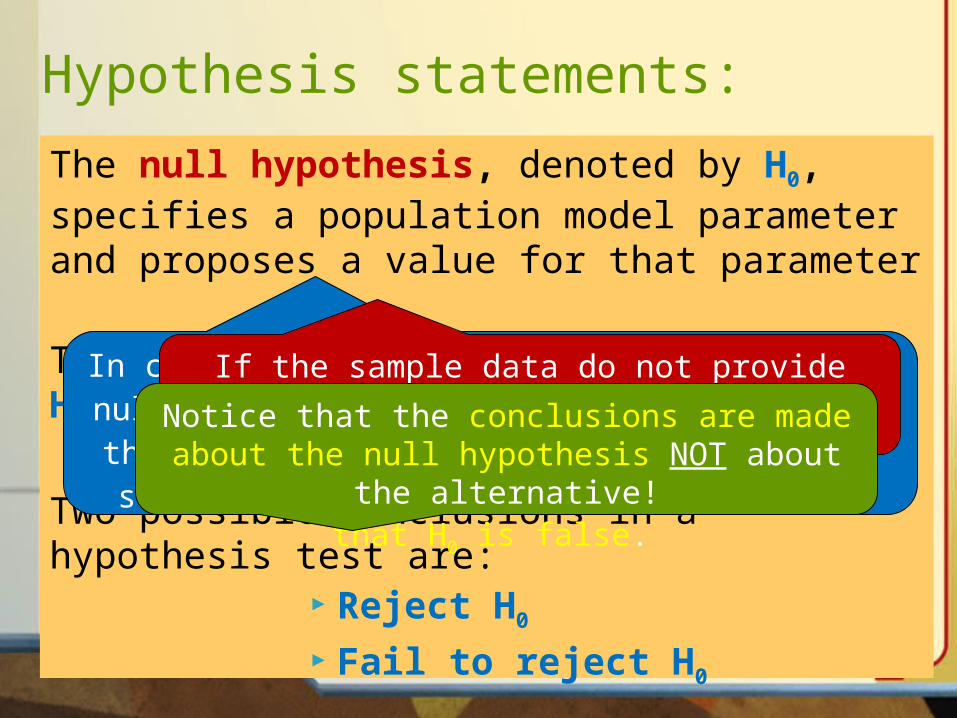
Hypothesis statements:
The null hypothesis, denoted by H0, specifies a population model parameter and proposes a value for that parameter
The alternative hypothesis, denoted by Ha, is the competing claim.
Two possible conclusions in a hypothesis test are:
Reject H0
Fail to reject H0
In carrying out a test of H0 versus Ha, the null hypothesis H0 is rejected in favor of the
alternative hypothesis Ha ONLY if the sample data provide convincing evidence that H0 is false.
If the sample data do not provide such evidence, H0 is not rejected.Notice that the conclusions are made about
the null hypothesis NOT about the alternative!
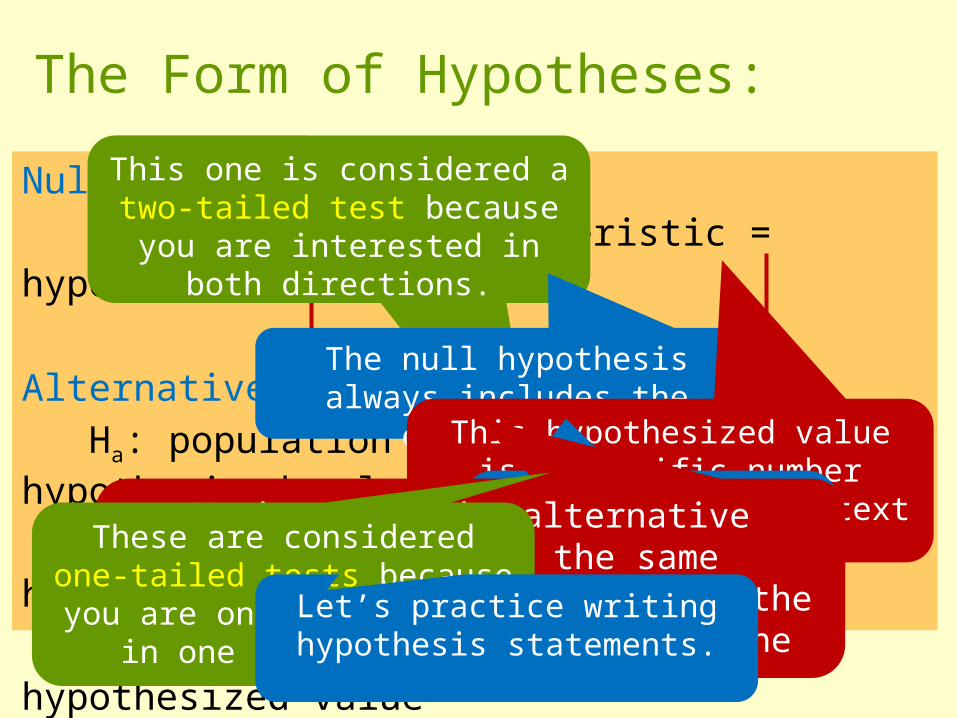
The Form of Hypotheses:
Null hypothesis H0: population characteristic = hypothesized value
Alternative hypothesis Ha: population characteristic > hypothesized value Ha: population characteristic < hypothesized value Ha: population characteristic ≠ hypothesized value
This one is considered a two-tailed test because you are
interested in both directions.
The null hypothesis always includes the equal case.
This hypothesized value is a specific number determined
by the context of the problemThis sign is determined by the
context of the problem.
Notice that the alternative hypothesis uses the same population characteristic
and the same hypothesized value as the null hypothesis.
These are considered one-tailed tests because you are
only interested in one direction.
Let’s practice writing hypothesis statements.
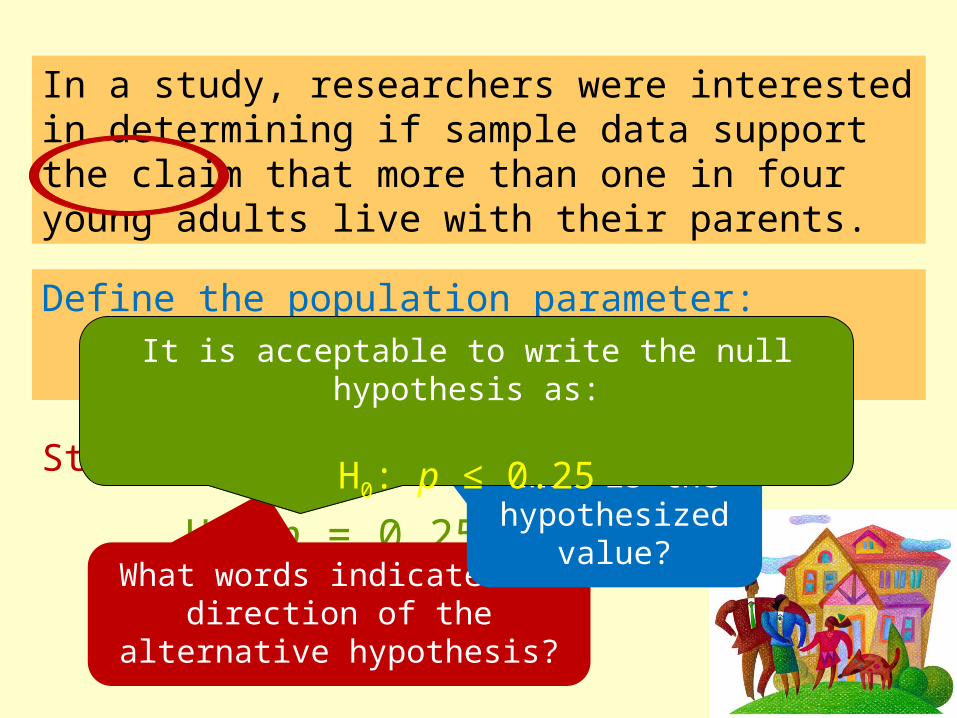
In a study, researchers were interested in determining if sample data support the claim that more than one in four young adults live with their parents.
H0: p = 0.25
Ha: p > 0.25
Define the population parameter:p = the proportion of young adults who
live with their parents
State the hypotheses :
What words indicate the direction of the alternative
hypothesis?
What is the hypothesized
value?
It is acceptable to write the null hypothesis as:
H0: p ≤ 0.25
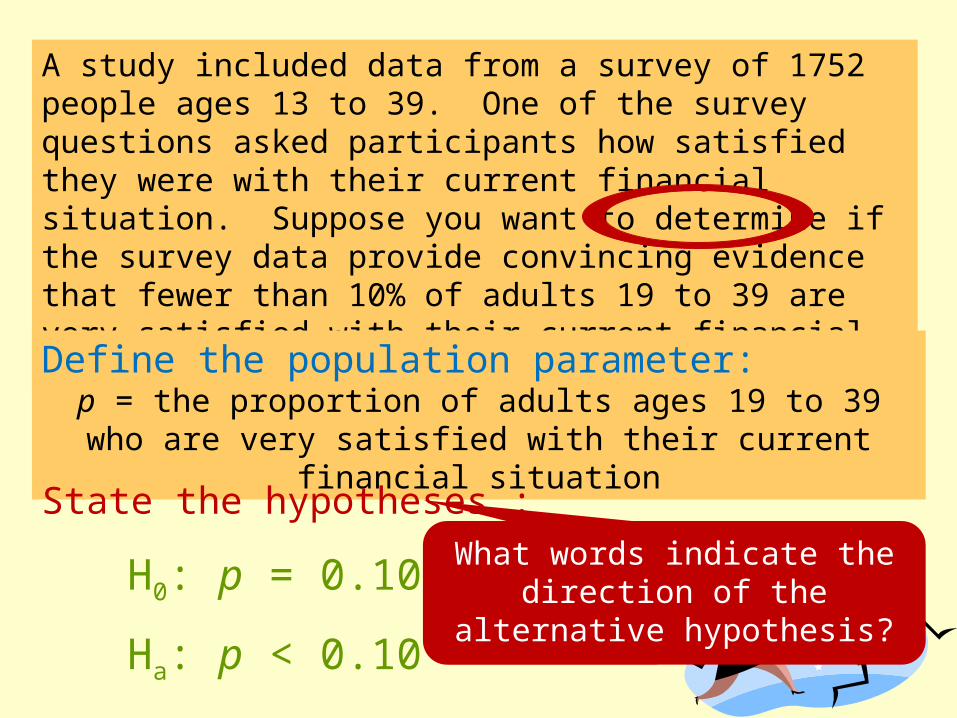
A study included data from a survey of 1752 people ages 13 to 39. One of the survey questions asked participants how satisfied they were with their current financial situation. Suppose you want to determine if the survey data provide convincing evidence that fewer than 10% of adults 19 to 39 are very satisfied with their current financial situation.
H0: p = 0.10
Ha: p < 0.10
What words indicate the direction of the alternative
hypothesis?
Define the population parameter:p = the proportion of adults ages 19 to 39 who are very satisfied with their current financial situation
State the hypotheses :
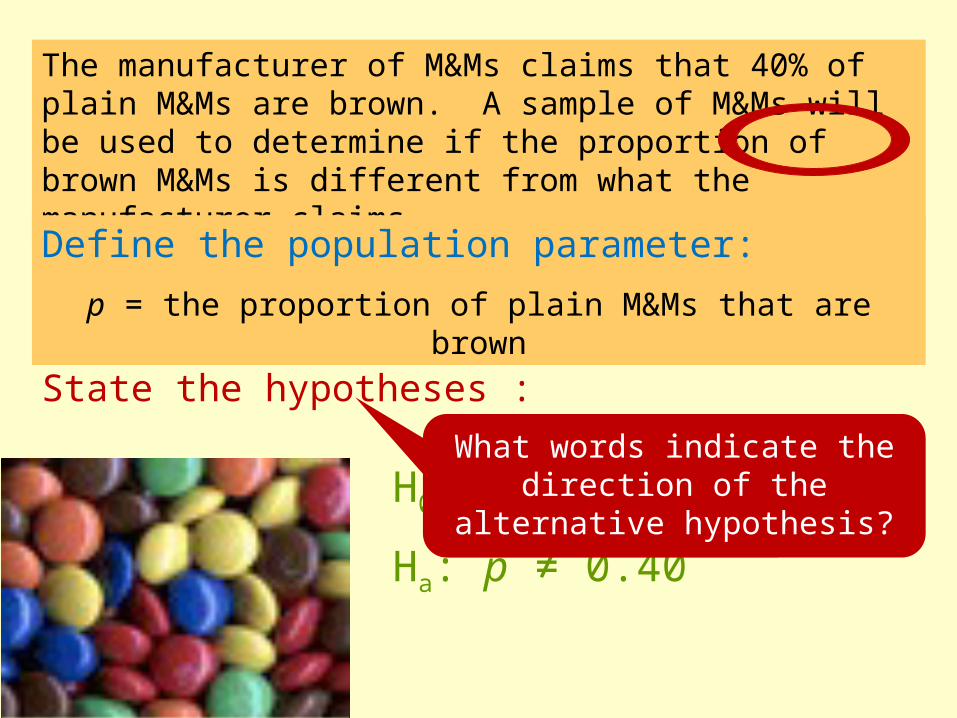
The manufacturer of M&Ms claims that 40% of plain M&Ms are brown. A sample of M&Ms will be used to determine if the proportion of brown M&Ms is different from what the manufacturer claims.
H0: p = 0.40
Ha: p ≠ 0.40
What words indicate the direction of the alternative
hypothesis?
Define the population parameter:
p = the proportion of plain M&Ms that are brown
State the hypotheses :
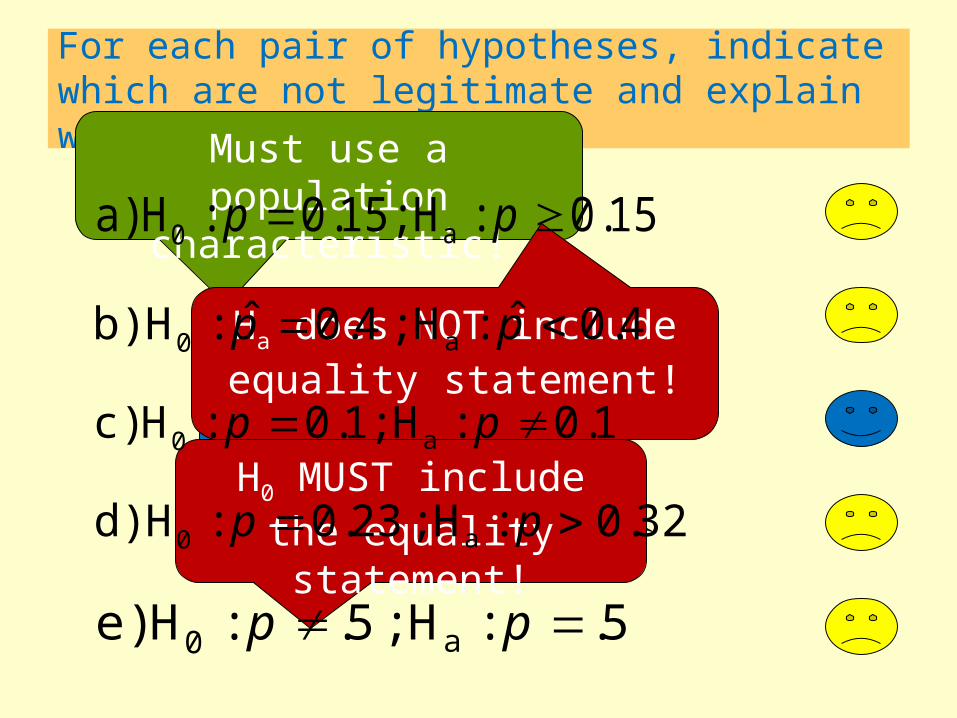
For each pair of hypotheses, indicate which are not legitimate and explain why
4.0ˆ:H;4.0ˆ:H b) a0 pp
1.0:H;1.0:H c) a0 pp
32.0:H;23.0:H d) a0 pp
15.0:H;15.0:H a) a0 ppMust use a population
characteristic!
Must use same number as in H0!
Ha does NOT include equality statement!
5.:H;5.:H e) a0 pp
H0 MUST include the equality statement!
13
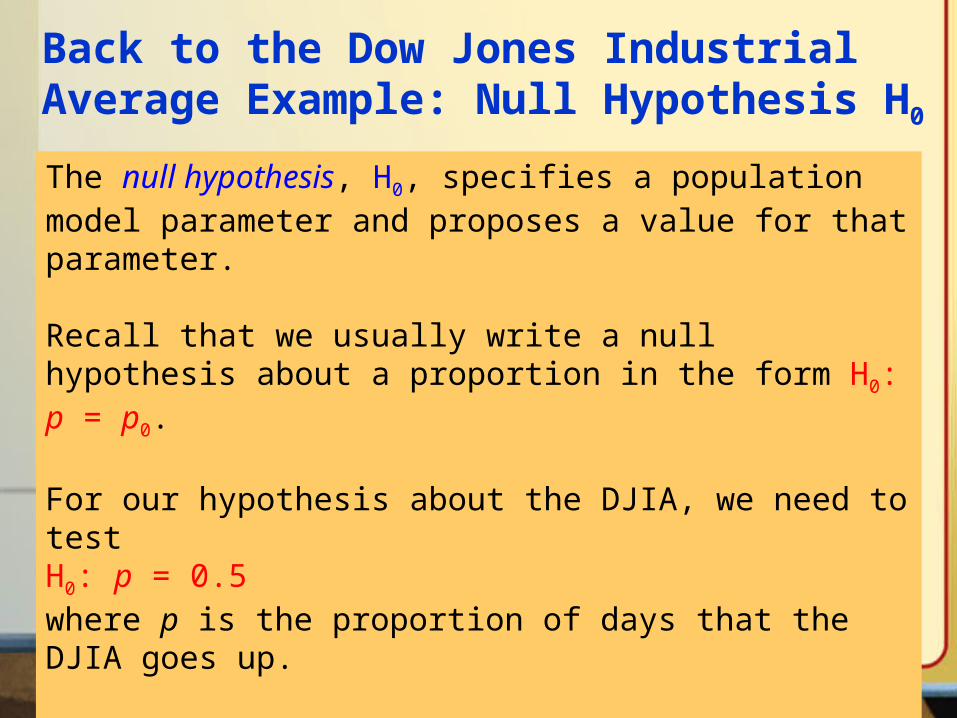
Back to the Dow Jones Industrial Average Example: Null Hypothesis H0The null hypothesis, H0, specifies a population model parameter and proposes a value for that parameter.
Recall that we usually write a null hypothesis about a proportion in the form H0: p = p0.
For our hypothesis about the DJIA, we need to test H0: p = 0.5where p is the proportion of days that the DJIA goes up.
14
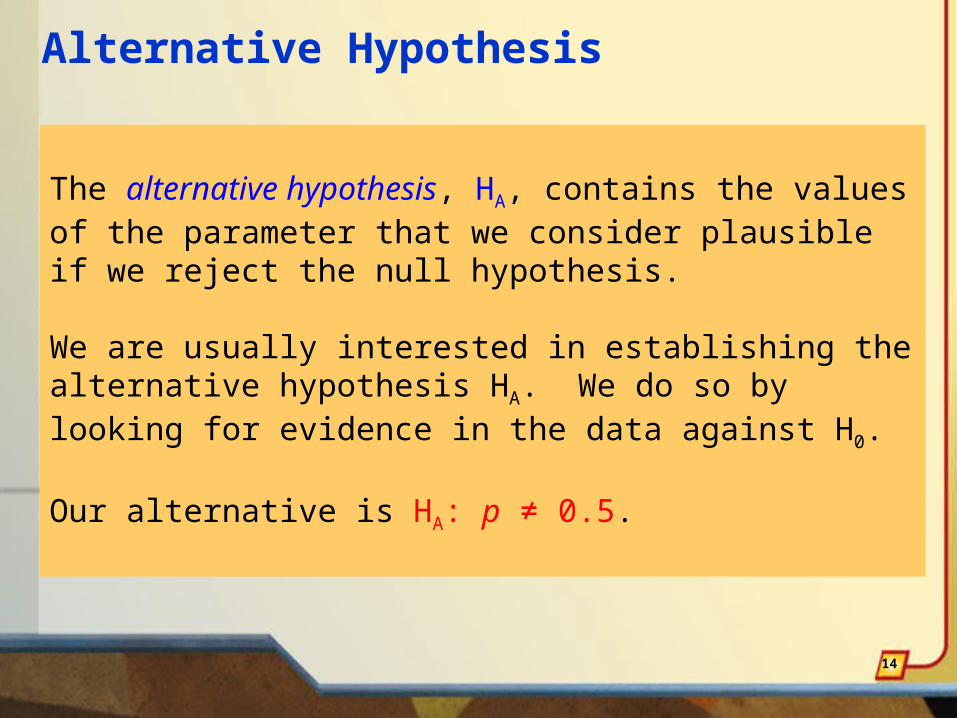
Alternative Hypothesis
The alternative hypothesis, HA, contains the values of the parameter that we consider plausible if we reject the null hypothesis.
We are usually interested in establishing the alternative hypothesis HA. We do so by looking for evidence in the data against H0.
Our alternative is HA: p ≠ 0.5.
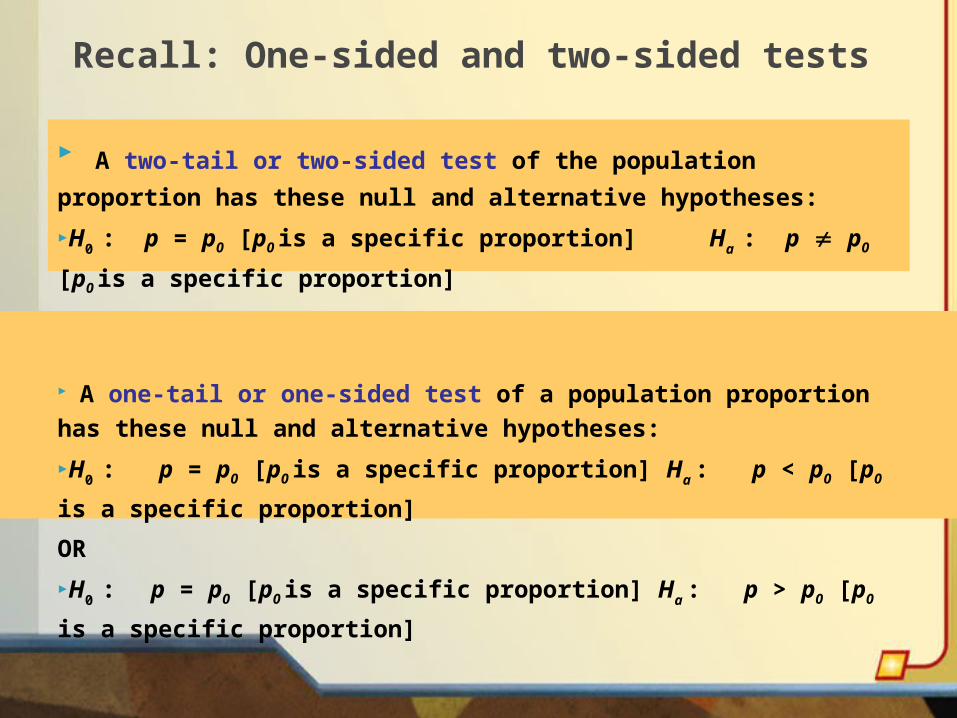
Recall: One-sided and two-sided tests
A two-tail or two-sided test of the population proportion has these null and
alternative hypotheses:
H0 : p = p0 [p0 is a specific proportion] Ha : p p0 [p0 is a specific proportion]
A one-tail or one-sided test of a population proportion has these null and
alternative hypotheses:
H0 : p = p0 [p0 is a specific proportion] Ha : p < p0 [p0 is a specific proportion]
OR
H0 : p = p0 [p0 is a specific proportion] Ha : p > p0 [p0 is a specific proportion]
16
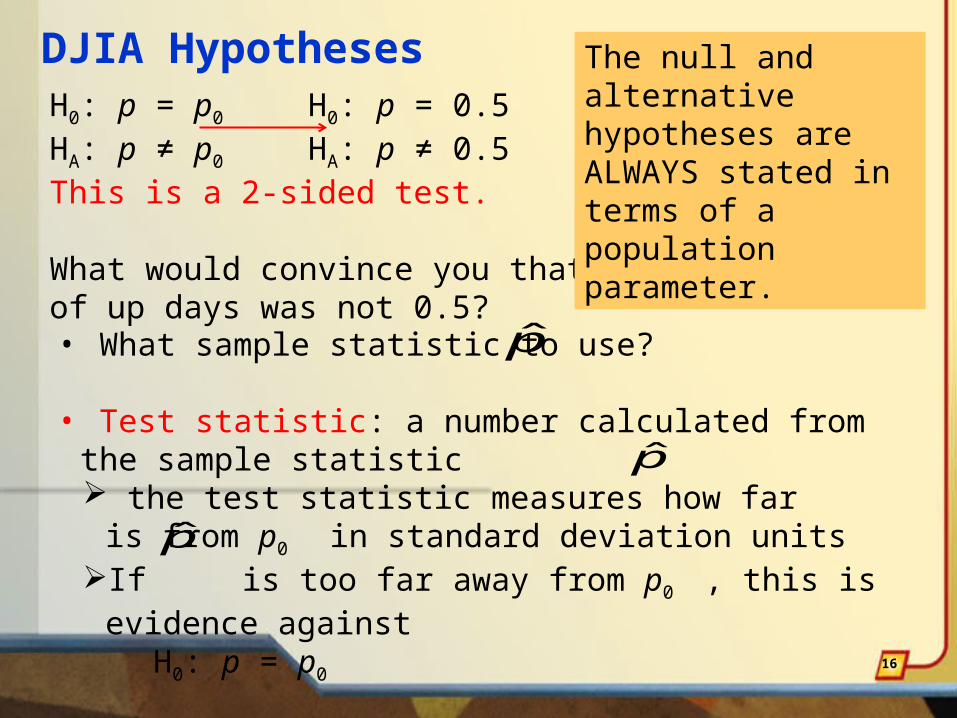
DJIA HypothesesH0: p = p0 H0: p = 0.5HA: p ≠ p0 HA: p ≠ 0.5This is a 2-sided test.
What would convince you that the proportion of up days was not 0.5?• What sample statistic to use?
• Test statistic: a number calculated from the sample statistic the test statistic measures how far is from p0 in
standard deviation unitsIf is too far away from p0 , this is evidence against
H0: p = p0
p̂
p̂
p̂
The null and alternative hypotheses are ALWAYS stated in terms of a population parameter.
17
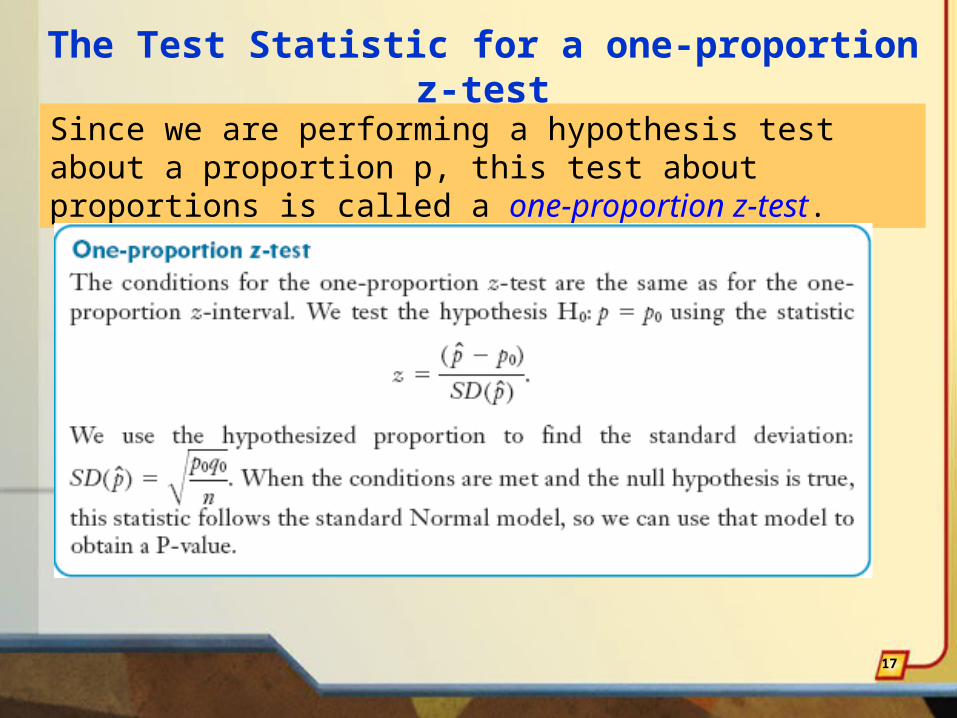
The Test Statistic for a one-proportion z-test
Since we are performing a hypothesis test about a proportion p, this test about proportions is called a one-proportion z-test.
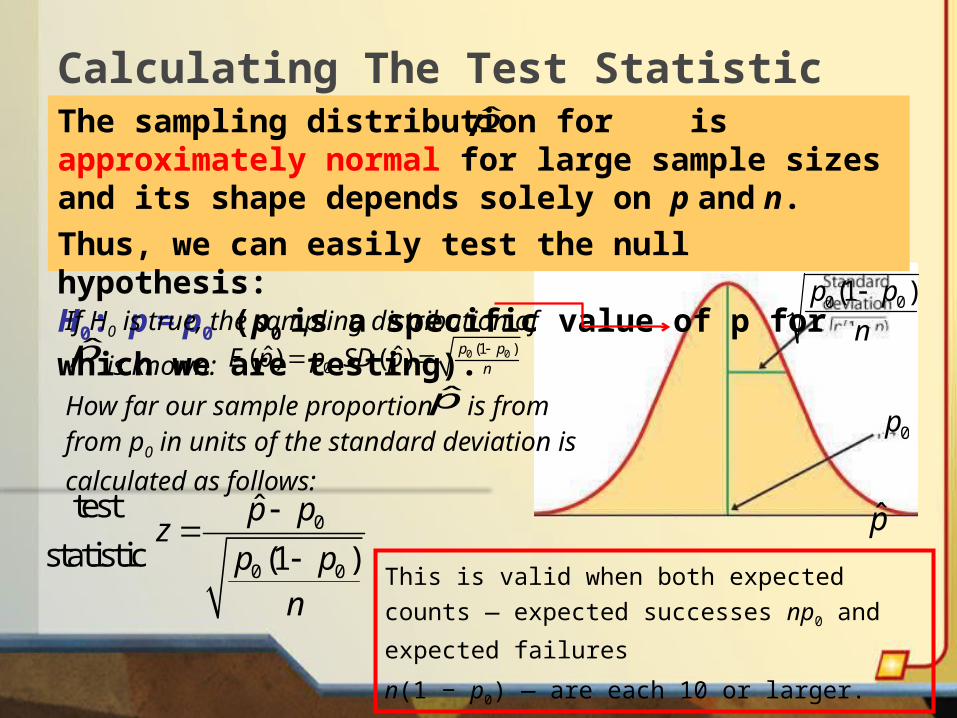
Calculating The Test StatisticThe sampling distribution for is approximately normal for large sample sizes and its shape depends solely on p and n.
Thus, we can easily test the null hypothesis:H0: p = p0 (p0 is a specific value of p for which we are testing).
0
0 0
test ˆ
statistic (1 )
p pz
p p
n
If H0 is true, the sampling distribution of
is known:
How far our sample proportion is from from p0 in units of the standard deviation is
calculated as follows:
This is valid when both expected counts —
expected successes np0 and expected failures
n(1 − p0) — are each 10 or larger.
p0(1 p0)
n
p0
ˆ p
p̂
p̂
p̂ 0 0(1 )0ˆ ˆ( ) , ( ) p p
nE p p SD p
19
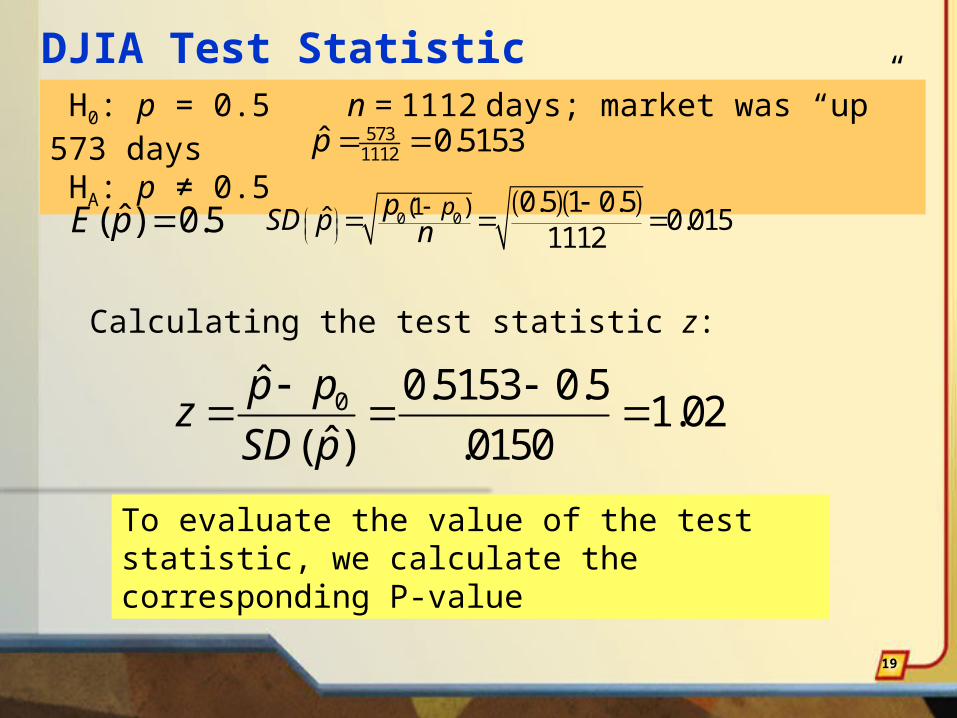
DJIA Test Statistic H0: p = 0.5 n = 1112 days; market was “up” 573 days HA: p ≠ 0.5
0 0(1 ) 0.5 1 0.5
ˆ 0.0151112
ppSD p n
5731112
ˆ 0.5153p
ˆ( ) 0.5E p
Calculating the test statistic z:
0ˆ 0.5153 0.51.02
ˆ( ) .0150
p pz
SD p
To evaluate the value of the test statistic, we calculate the corresponding P-value
20
P-Values: Weighing the evidence in the data against H0
The P-value is the probability, calculated assuming the null hypothesis H0 is true, of observing a value of the test statistic more extreme than the value we actually observed.
The calculation of the P-value depends on whether the hypothesis test is 1-tailed(that is, the alternative hypothesis is HA :p < p0 or HA :p > p0)or 2-tailed(that is, the alternative hypothesis is HA :p ≠ p0).
21
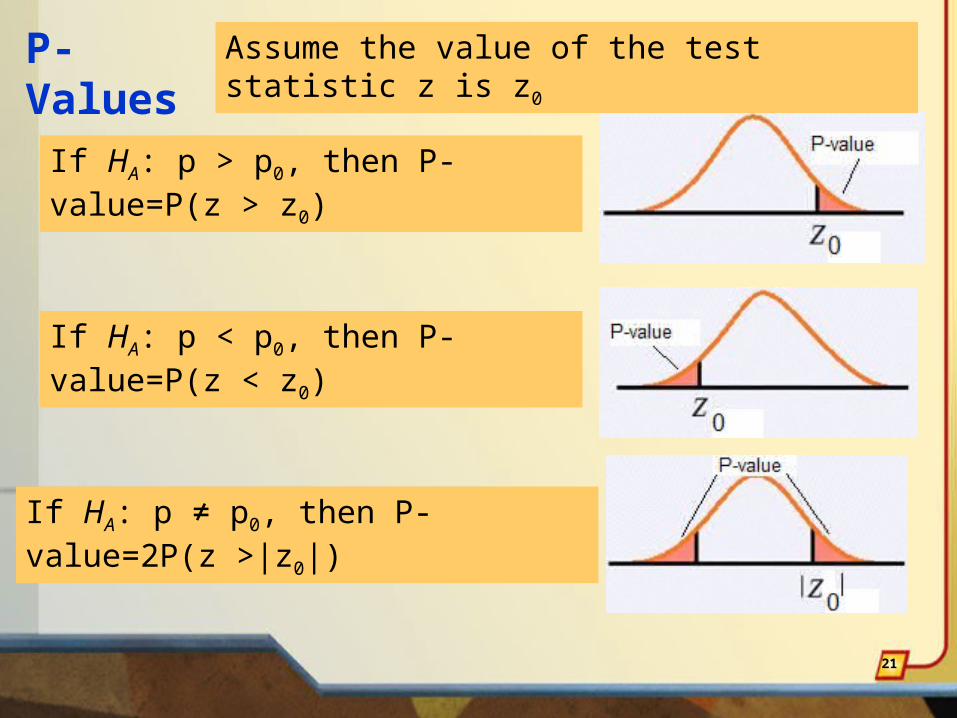
P-Values
If HA: p > p0, then P-value=P(z > z0)
Assume the value of the test statistic z is z0
If HA: p < p0, then P-value=P(z < z0)
If HA: p ≠ p0, then P-value=2P(z >|z0|)
22
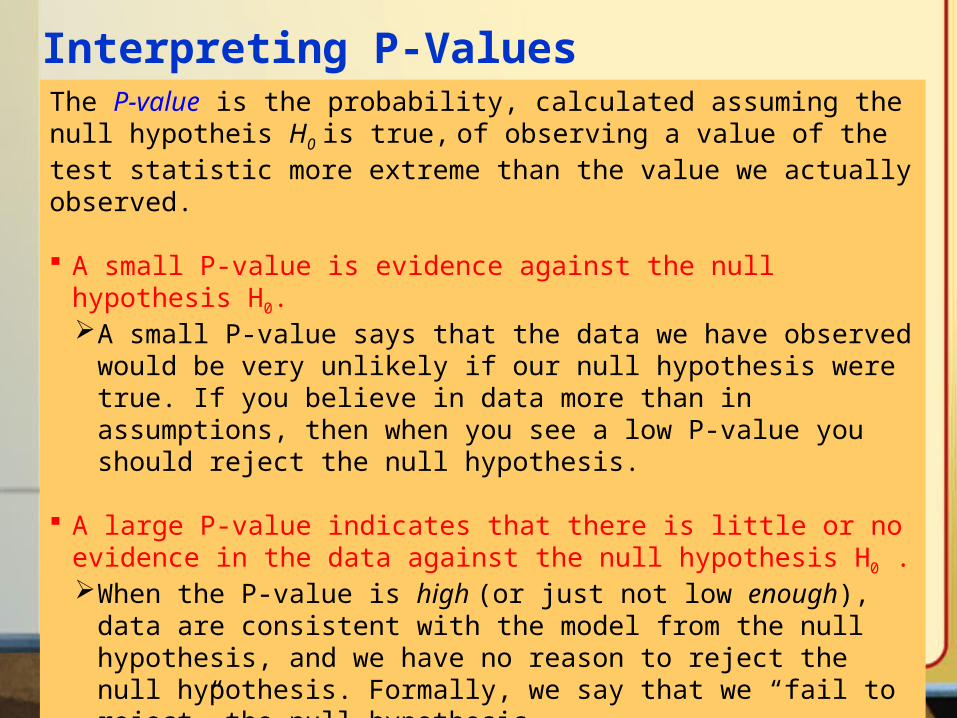
Interpreting P-ValuesThe P-value is the probability, calculated assuming the null hypotheis H0 is true, of observing a value of the test statistic more extreme than the value we actually observed.
A small P-value is evidence against the null hypothesis H0. A small P-value says that the data we have observed would be very
unlikely if our null hypothesis were true. If you believe in data more than in assumptions, then when you see a low P-value you should reject the null hypothesis.
A large P-value indicates that there is little or no evidence in the data against the null hypothesis H0 .When the P-value is high (or just not low enough), data are
consistent with the model from the null hypothesis, and we have no reason to reject the null hypothesis. Formally, we say that we “fail to reject” the null hypothesis.
23
Interpreting P-Values
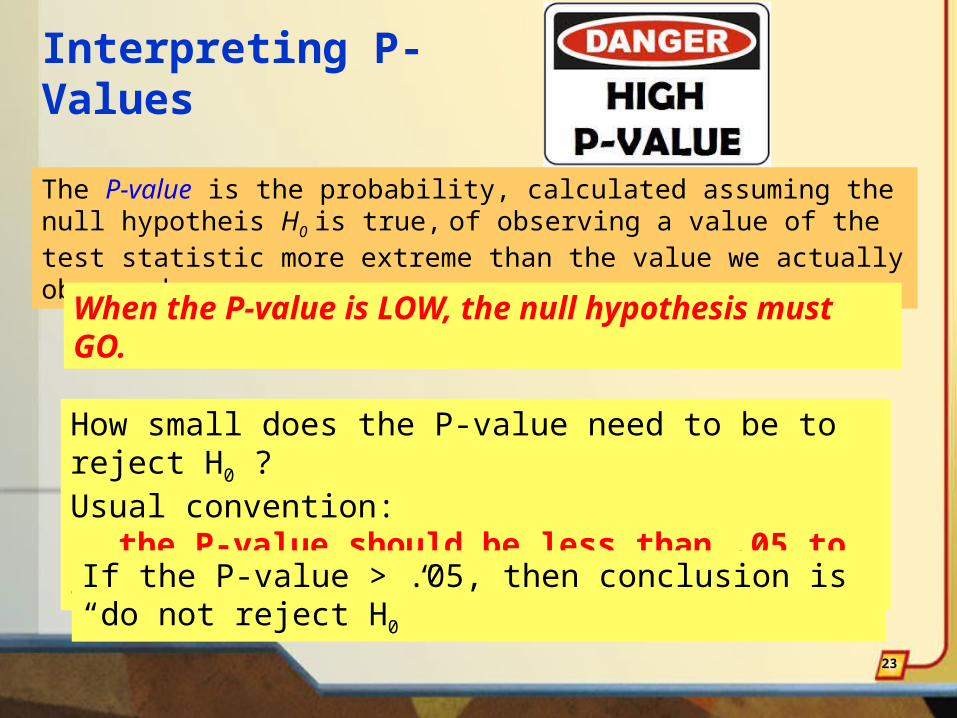
The P-value is the probability, calculated assuming the null hypotheis H0 is true, of observing a value of the test statistic more extreme than the value we actually observed.
When the P-value is LOW, the null hypothesis must GO.
How small does the P-value need to be to reject H0 ?Usual convention:
the P-value should be less than .05 to reject H0
If the P-value > .05, then conclusion is “do not reject H0”
24
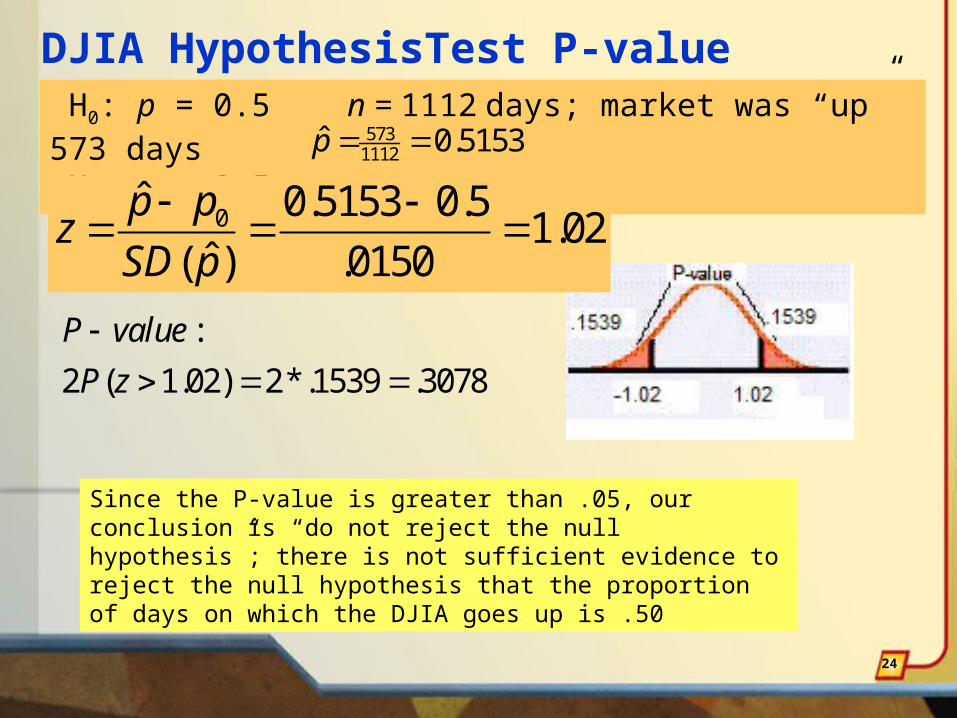
DJIA HypothesisTest P-value (cont.) H0: p = 0.5 n = 1112 days; market was “up” 573 days HA: p ≠ 0.5
5731112
ˆ 0.5153p
0ˆ 0.5153 0.51.02
ˆ( ) .0150
p pz
SD p
Since the P-value is greater than .05, our conclusion is “do not reject the null hypothesis”; there is not sufficient evidence to reject the null hypothesis that the proportion of days on which the DJIA goes up is .50
:
2 ( 1.02) 2*.1539 .3078
P value
P z
25
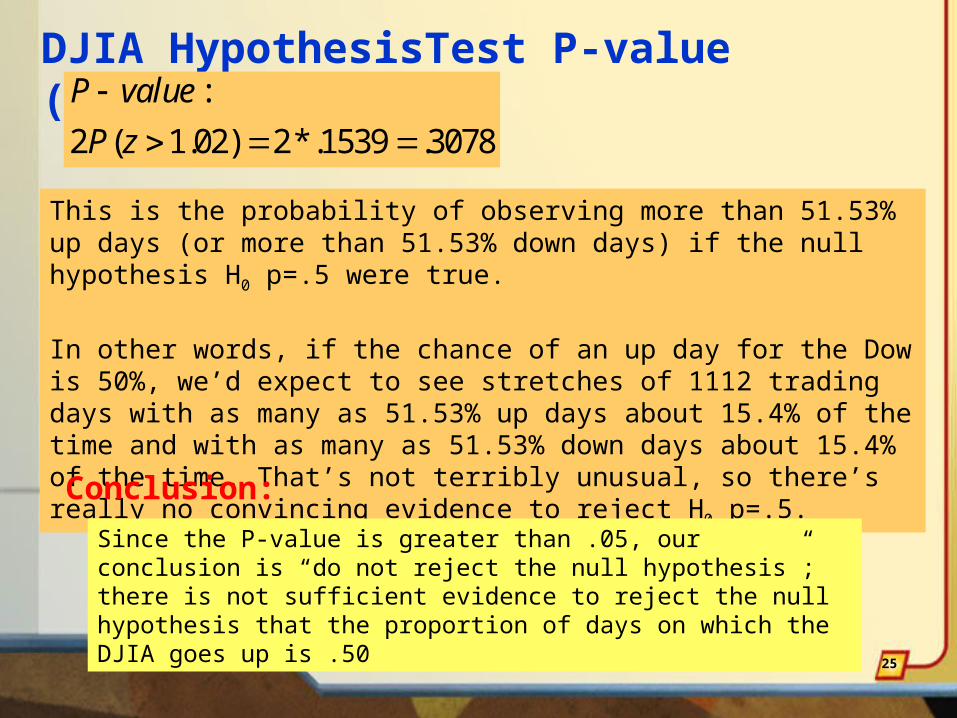
DJIA HypothesisTest P-value (cont.)
This is the probability of observing more than 51.53% up days (or more than 51.53% down days) if the null hypothesis H0 p=.5 were true.
In other words, if the chance of an up day for the Dow is 50%, we’d expect to see stretches of 1112 trading days with as many as 51.53% up days about 15.4% of the time and with as many as 51.53% down days about 15.4% of the time. That’s not terribly unusual, so there’s really no convincing evidence to reject H0 p=.5.
Conclusion:
Since the P-value is greater than .05, our conclusion is “do not reject the null hypothesis”; there is not sufficient evidence to reject the null hypothesis that the proportion of days on which the DJIA goes up is .50
:
2 ( 1.02) 2*.1539 .3078
P value
P z
26
A Trial as a Hypothesis Test
We started by assuming that the probability of an “up” day was .50
Then we looked at the data and concluded that we couldn’t say otherwise because the proportion that we actually observed wasn’t far enough from .50
This is the logic of jury trials. In British common law, the null hypothesis is that the defendant is not guilty (“innocent until proven guilty”)H0 : defendant is innocent; HA : defendant is guilty
The government has to prove your guilt, you do NOT have to prove your innocence.The evidence takes the form of facts that seem to contradict the presumption of innocence. For us, this means collecting data.
27
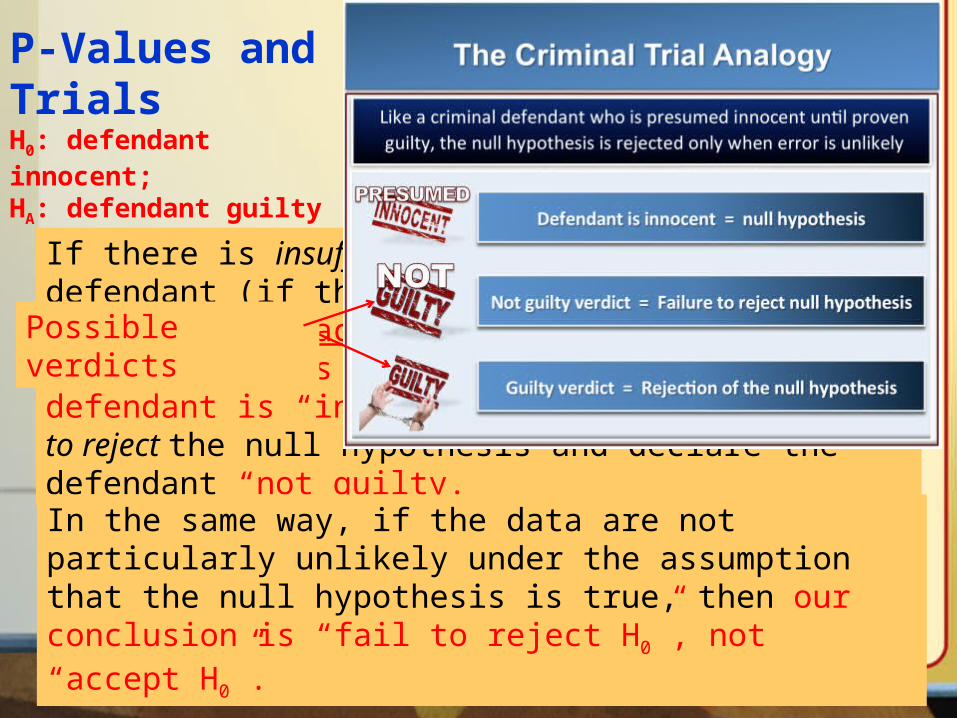
If there is insufficient evidence to convict the defendant (if the P-value is not low), the jury does NOT accept thenull hypothesis and declare that the defendant is “innocent”. Juries can only fail to reject the null hypothesis and declare the defendant “not guilty.”
In the same way, if the data are not particularly unlikely under the assumption that the null hypothesis is true, then our conclusion is “fail to reject H0”, not “accept H0”.
Possible verdicts
P-Values and TrialsH0: defendant innocent;HA: defendant guilty

Medication side effects (hypothesis test for p)Arthritis is a painful, chronic inflammation of the joints.
An experiment on the side effects of the pain reliever ibuprofen
examined arthritis patients to find the proportion of patients who suffer
side effects. If more than 3% of users suffer side effects, the FDA will
put a stronger warning label on packages of ibuprofenSerious side effects (seek medical attention immediately):
Allergic reaction (difficulty breathing, swelling, or hives),Muscle cramps, numbness, or tingling,Ulcers (open sores) in the mouth,Rapid weight gain (fluid retention),Seizures,Black, bloody, or tarry stools,Blood in your urine or vomit,Decreased hearing or ringing in the ears,Jaundice (yellowing of the skin or eyes), orAbdominal cramping, indigestion, or heartburn,
Less serious side effects (discuss with your doctor):Dizziness or headache,Nausea, gaseousness, diarrhea, or constipation,Depression,Fatigue or weakness,Dry mouth, orIrregular menstrual periods
What are some side effects of ibuprofen?
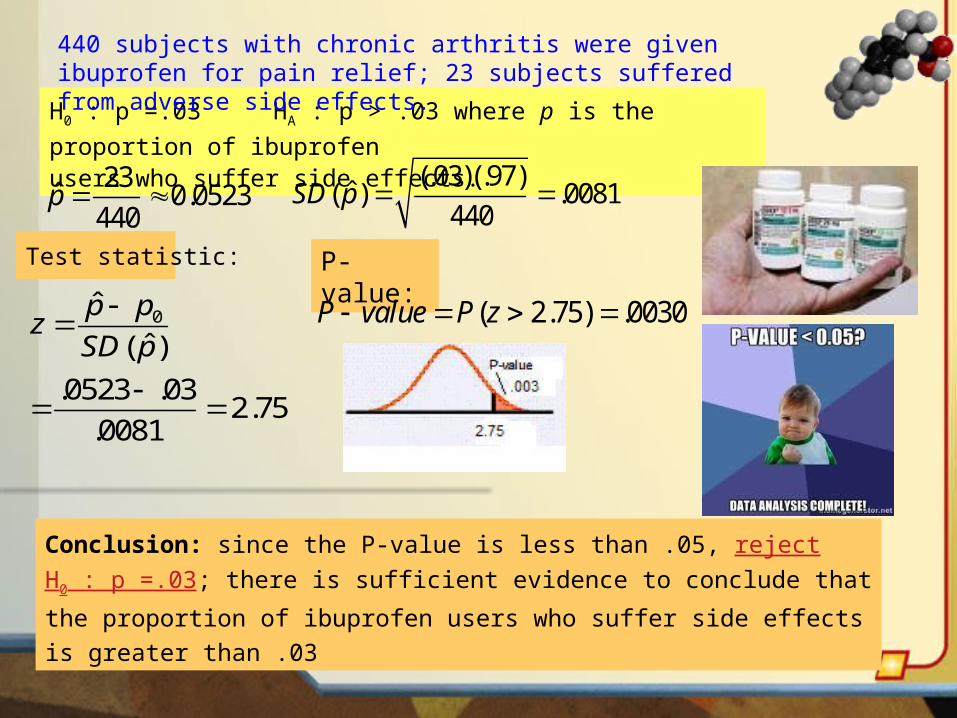
Test statistic:
H0 : p =.03 HA : p > .03 where p is the proportion of ibuprofen
users who suffer side effects.
0ˆ
ˆ( )
.0523 .032.75
.0081
p pz
SD p
23ˆ 0.0523
440p
Conclusion: since the P-value is less than .05, reject H0 : p =.03; there is
sufficient evidence to conclude that the proportion of ibuprofen users who
suffer side effects is greater than .03
( 2.75) .0030P value P z
440 subjects with chronic arthritis were given ibuprofen for pain relief; 23 subjects suffered from adverse side effects.
(.03)(.97)ˆ( ) .0081
440SD p
P-value:
Chap 9-30
Example: one-proportion z test
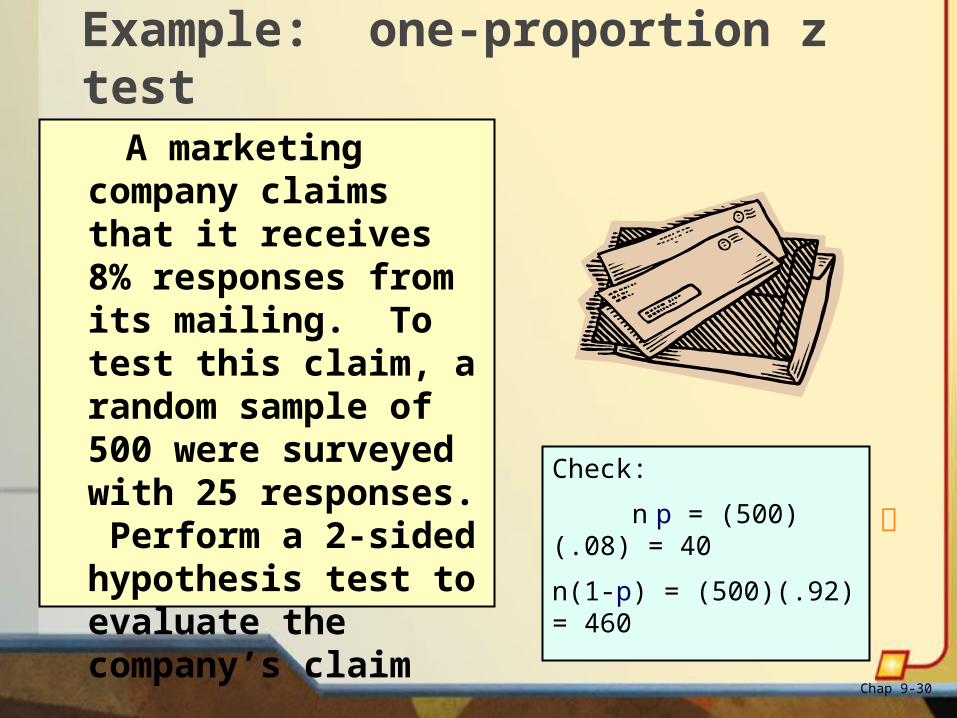
A marketing company claims that it receives 8% responses from its mailing. To test this claim, a random sample of 500 were surveyed with 25 responses. Perform a 2-sided hypothesis test to evaluate the company’s claim
Check:
n p = (500)(.08) = 40
n(1-p) = (500)(.92) = 460
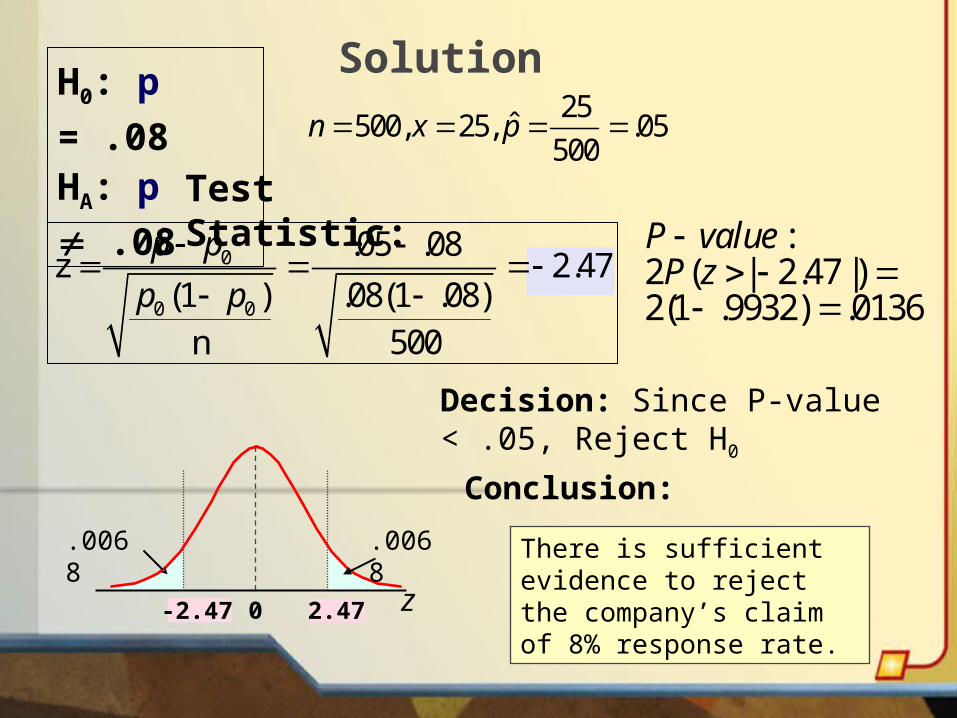
SolutionH0: p = .08
HA: p ¹ .08Test Statistic:
Decision: Since P-value < .05, Reject H0
Conclusion:
z0
.0068.0068
2.47
There is sufficient evidence to reject the company’s claim of 8% response rate.
0
0 0
ˆ .05 .08z 2.47
(1 ) .08(1 .08)500n
p p
p p
-2.47
25ˆ500, 25, .05
500n x p
:2 ( | 2.47 |)2(1 .9932) .0136
P valueP z
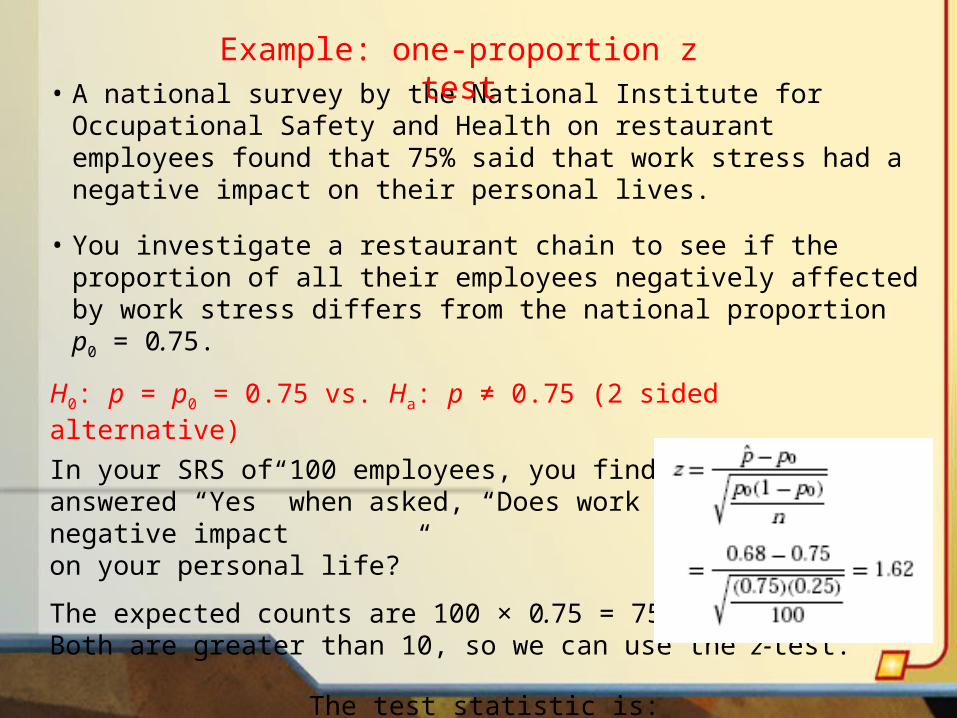
• A national survey by the National Institute for Occupational Safety and Health on restaurant employees found that 75% said that work stress had a negative impact on their personal lives.
• You investigate a restaurant chain to see if the proportion of all their employees negatively affected by work stress differs from the national proportion p0 = 0.75.
H0: p = p0 = 0.75 vs. Ha: p ≠ 0.75 (2 sided alternative)
In your SRS of 100 employees, you find that 68 answered “Yes” when asked, “Does work stress have a negative impacton your personal life?”
The expected counts are 100 × 0.75 = 75 and 25. Both are greater than 10, so we can use the z-test.
The test statistic is:
Example: one-proportion z test
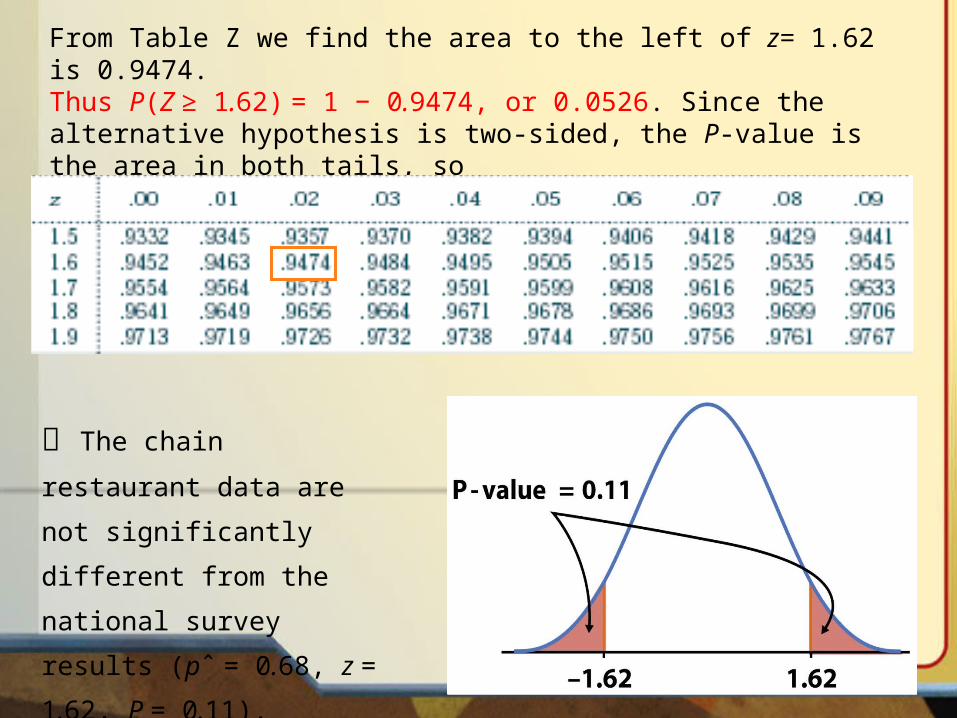
From Table Z we find the area to the left of z= 1.62 is 0.9474. Thus P(Z ≥ 1.62) = 1 − 0.9474, or 0.0526. Since the alternative hypothesis is two-sided, the P-value is the area in both tails, so
P –value = 2 × 0.0526 = 0.1052 0.11.
The chain restaurant data
are not significantly different
from the national survey
results (pˆ = 0.68, z = 1.62,
P = 0.11).