Embed Size (px)
Citation preview
Lecture Presentation Software to accompany
Investment Analysis and Portfolio Management
Seventh Editionby
Frank K. Reilly & Keith C. Brown
Chapter 15
Company Analysis and Stock Valuation
• After analyzing the economy and stock markets for several countries, you have decided to invest some portion of your portfolio in common stocks
• After analyzing various industries, you have identified those industries that appear to offer above-average risk-adjusted performance over your investment horizon
• Which are the best companies?• Are they overpriced?
Company Analysis and Stock Valuation
• Good companies are not necessarily good investments
• Compare the intrinsic value of a stock to its market value
• Stock of a great company may be overpriced
• Stock of a growth company may not be growth stock

• Growth companies have historically been defined as companies that consistently experience above-average increases in sales and earnings
• Financial theorists define a growth company as one with management and opportunities that yield rates of return greater than the firm’s required rate of return
Growth Companies
Growth Stocks
• Growth stocks are not necessarily shares in growth companies
• A growth stock has a higher rate of return than other stocks with similar risk
• Superior risk-adjusted rate of return occurs because of market undervaluation compared to other stocks
Defensive Companies and Stocks
• Defensive companies’ future earnings are more likely to withstand an economic downturn
• Low business risk
• Not excessive financial risk
• Stocks with low or negative systematic risk
Cyclical Companies and Stocks
• Cyclical companies are those whose sales and earnings will be heavily influenced by aggregate business activity
• Cyclical stocks are those that will experience changes in their rates of return greater than changes in overall market rates of return
Speculative Companies and Stocks
• Speculative companies are those whose assets involve great risk but those that also have a possibility of great gain
• Speculative stocks possess a high probability of low or negative rates of return and a low probability of normal or high rates of return
Value versus Growth Investing• Growth stocks will have positive
earnings surprises and above-average risk adjusted rates of return because the stocks are undervalued
• Value stocks appear to be undervalued for reasons besides earnings growth potential
• Value stocks usually have low P/E ratio or low ratios of price to book value
Economic, Industry, and Structural Links to Company Analysis
• Company analysis is the final step in the top-down approach to investing
• Macroeconomic analysis identifies industries expected to offer attractive returns in the expected future environment
• Analysis of firms in selected industries concentrates on a stock’s intrinsic value based on growth and risk
Economic and Industry Influences• If trends are favorable for an industry, the
company analysis should focus on firms in that industry that are positioned to benefit from the economic trends
• Firms with sales or earnings particularly sensitive to macroeconomic variables should also be considered
• Research analysts need to be familiar with the cash flow and risk of the firms

Structural Influences• Social trends, technology, political, and
regulatory influences can have significant influence on firms
• Early stages in an industry’s life cycle see changes in technology which followers may imitate and benefit from
• Politics and regulatory events can create opportunities even when economic influences are weak
Company Analysis
• Industry competitive environment
• SWOT analysis
• Present value of cash flows
• Relative valuation ratio techniques
Firm Competitive Strategies
• Current rivalry
• Threat of new entrants
• Potential substitutes
• Bargaining power of suppliers
• Bargaining power of buyers

Firm Competitive Strategies• Defensive strategy involves positioning firm so
that it its capabilities provide the best means to deflect the effect of competitive forces in the industry
• Offensive strategy involves using the company’s strength to affect the competitive industry forces, thus improving the firm’s relative industry position
• Porter suggests two major strategies: low-cost leadership and differentiation
Porter's Competitive Strategies
• Low-Cost Strategy– The firm seeks to be the low-cost
producer, and hence the cost leader in its industry
• Differentiation Strategy– firm positions itself as unique in the
industry

Focusing a Strategy• Select segments in the industry
• Tailor strategy to serve those specific groups
• Determine which strategy a firm is pursuing and its success
• Evaluate the firm’s competitive strategy over time
SWOT Analysis
• Examination of a firm’s:
– Strengths
– Weaknesses
– Opportunities
– Threats
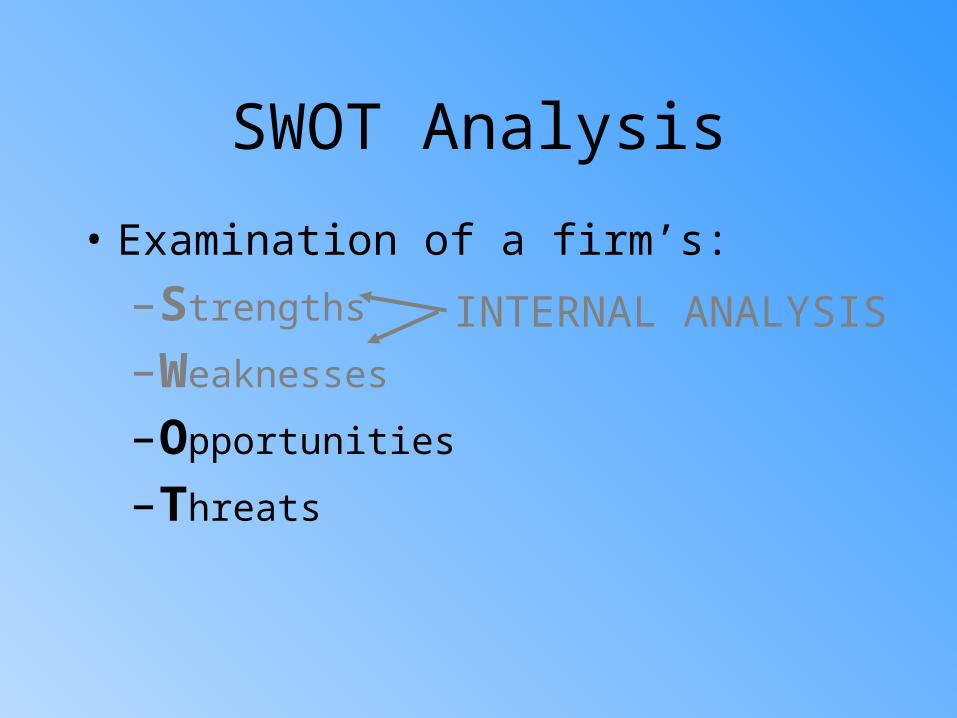
SWOT Analysis
• Examination of a firm’s:
– Strengths
– Weaknesses
– Opportunities
– Threats
INTERNAL ANALYSIS
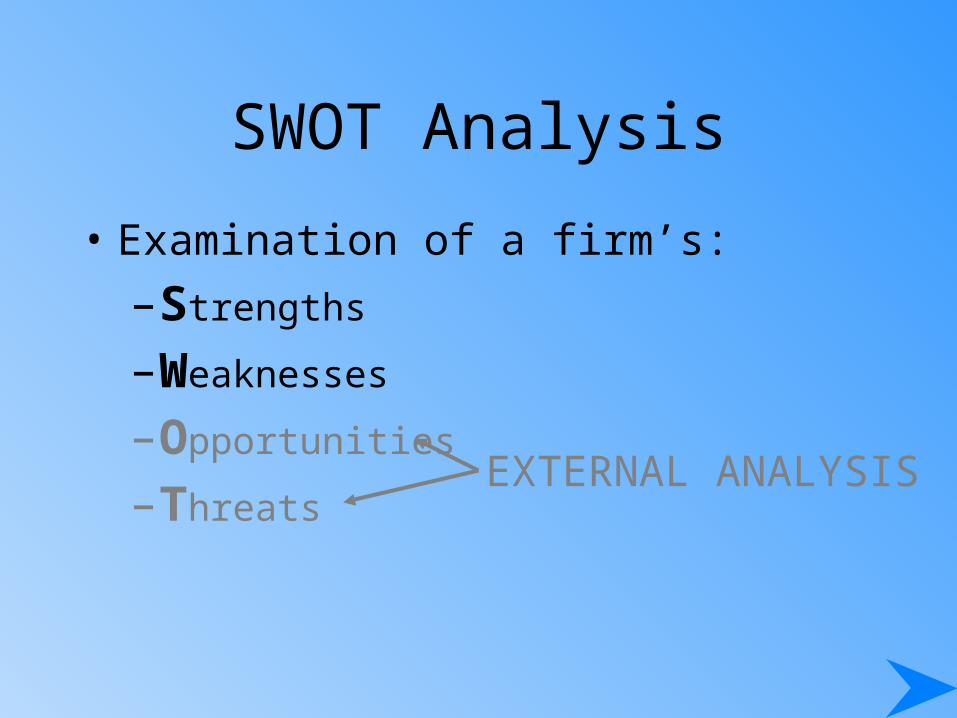
SWOT Analysis
• Examination of a firm’s:
– Strengths
– Weaknesses
– Opportunities
– ThreatsEXTERNAL ANALYSIS

Some Lessons from Peter Lynch
Favorable Attributes of Firms1. Firm’s product should not be faddish
2. Firm should have some long-run comparative advantage over its rivals
3. Firm’s industry or product has market stability
4. Firm can benefit from cost reductions
5. Firms that buy back shares show there are putting money into the firm
Tenets of Warren Buffet
• Business Tenets
• Management Tenets
• Financial Tenets
• Market Tenets
Business Tenets
• Is the business simple and understandable?
• Does the business have a consistent operating history?
• Does the business have favorable long-term prospects?

Management Tenets
• Is management rational?
• Is management candid with with its shareholders?
• Does management resist the institutional imperative?
Financial Tenets
• Focus on return on equity, not earnings per share
• Calculate “owner earnings”• Look for companies with high profit
margins• For every dollar retained, make sure the
company has created at least one dollar of market value
Market Tenets
• What is the value of the business?
• Can the business be purchased at a significant discount to its fundamental intrinsic value?
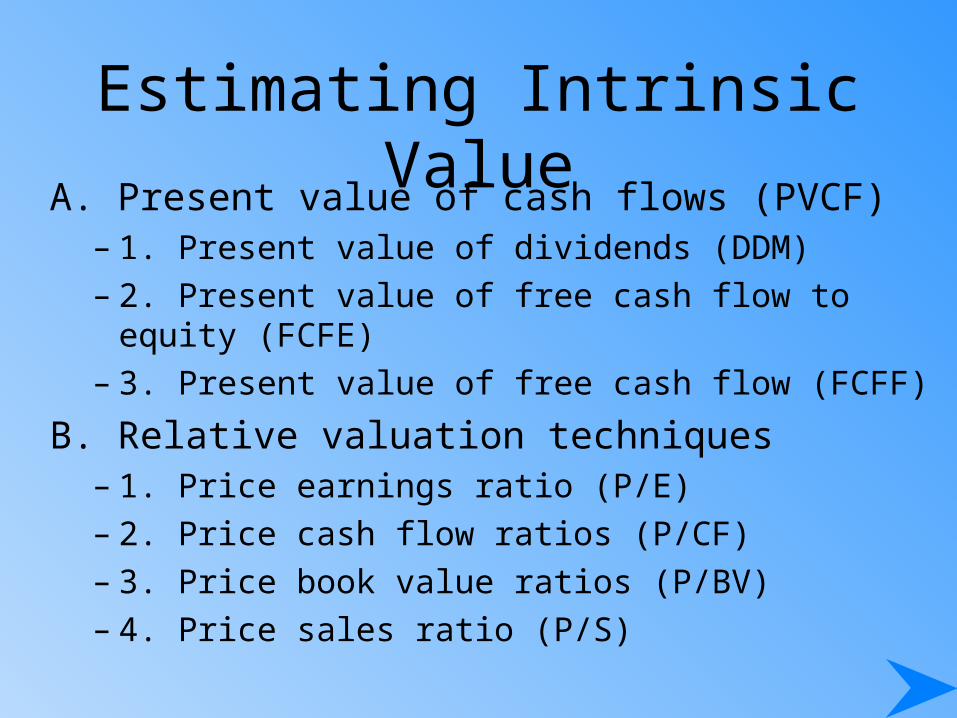
Estimating Intrinsic ValueA. Present value of cash flows (PVCF)
– 1. Present value of dividends (DDM)– 2. Present value of free cash flow to equity (FCFE)– 3. Present value of free cash flow (FCFF)
B. Relative valuation techniques– 1. Price earnings ratio (P/E)– 2. Price cash flow ratios (P/CF)– 3. Price book value ratios (P/BV)– 4. Price sales ratio (P/S)

Present Value of Dividends
• Simplifying assumptions help in estimating present value of future dividends
• Assumption of constant growth rate
Intrinsic Value = D1/(k-g)
D1= D0(1+g)
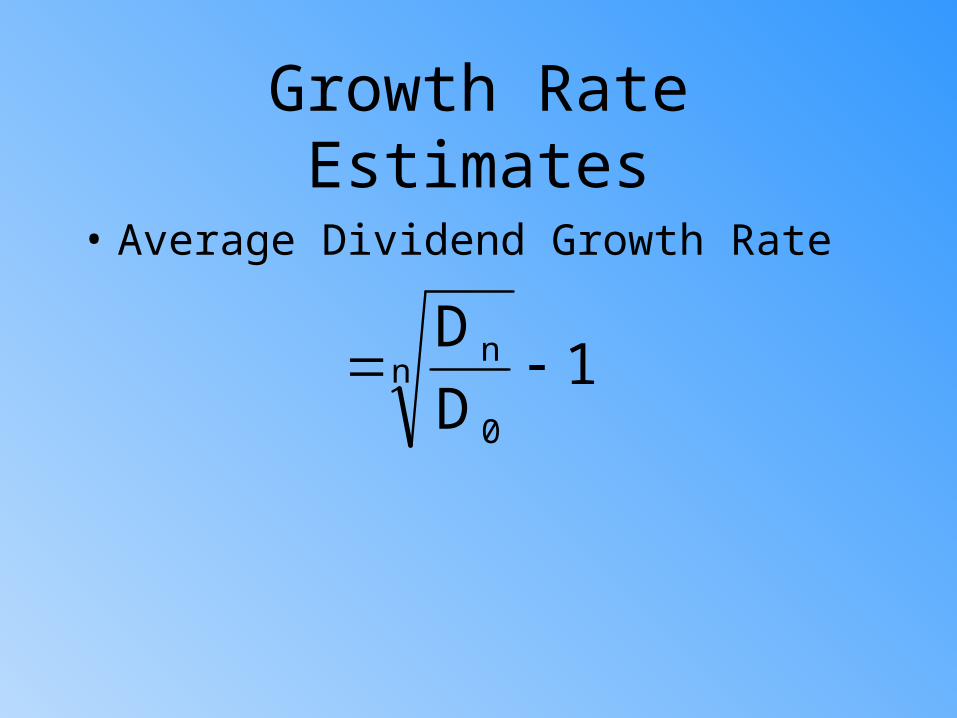
Growth Rate Estimates
• Average Dividend Growth Rate
1D
Dn
0
n
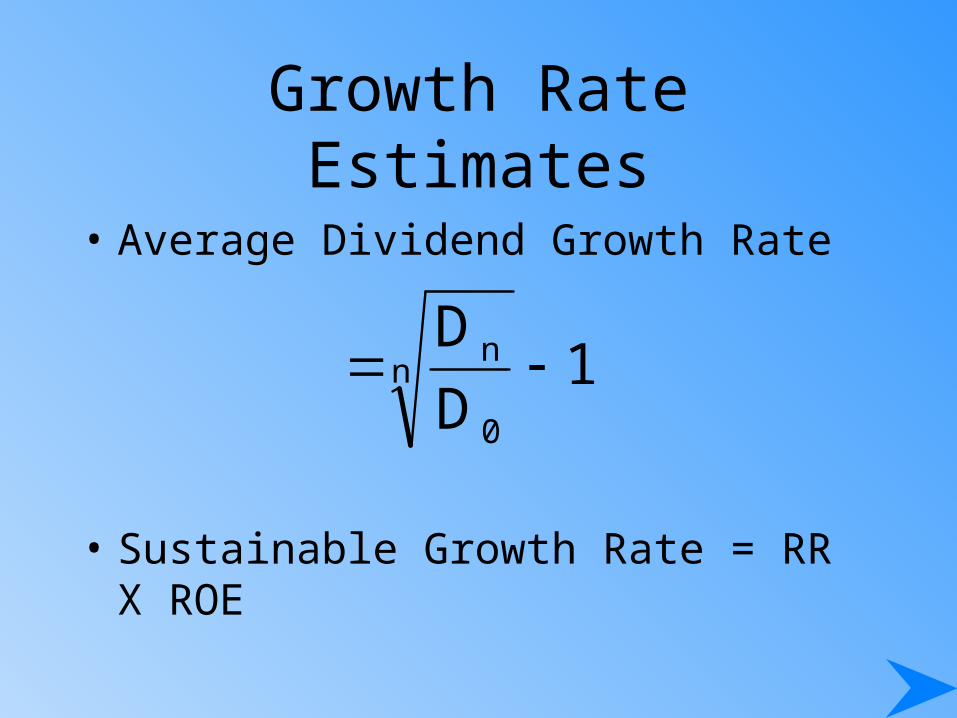
Growth Rate Estimates
• Average Dividend Growth Rate
• Sustainable Growth Rate = RR X ROE
1D
Dn
0
n
Required Rate of Return Estimate
• Nominal risk-free interest rate
• Risk premium
• Market-based risk estimated from the firm’s characteristic line using regression
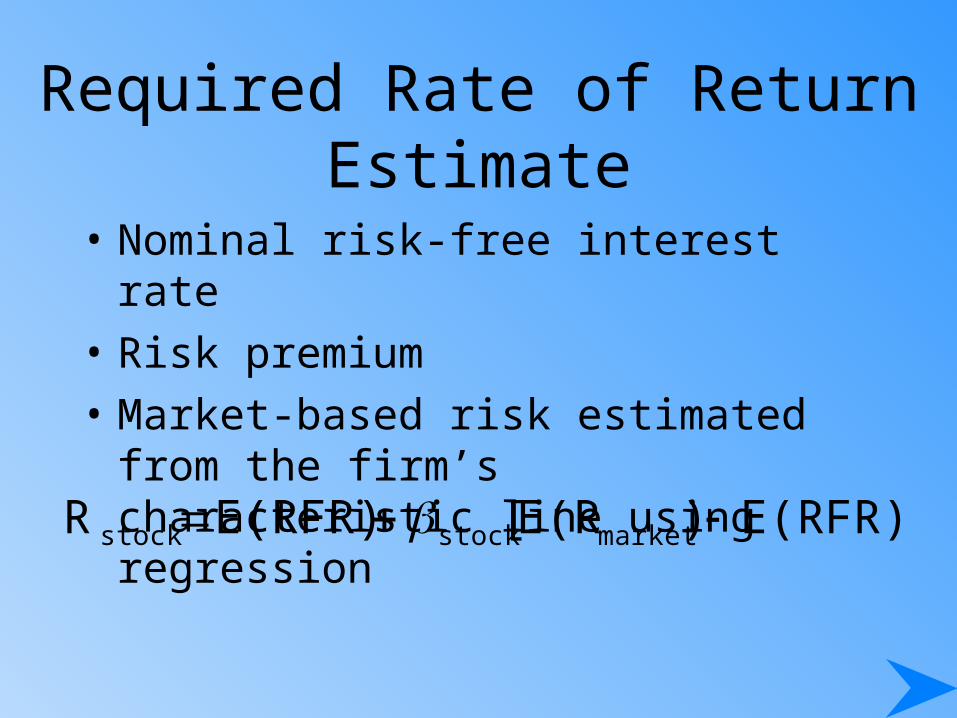
Required Rate of Return Estimate
• Nominal risk-free interest rate
• Risk premium
• Market-based risk estimated from the firm’s characteristic line using regression
E(RFR)])E(R[E(RFR)R marketstockstock
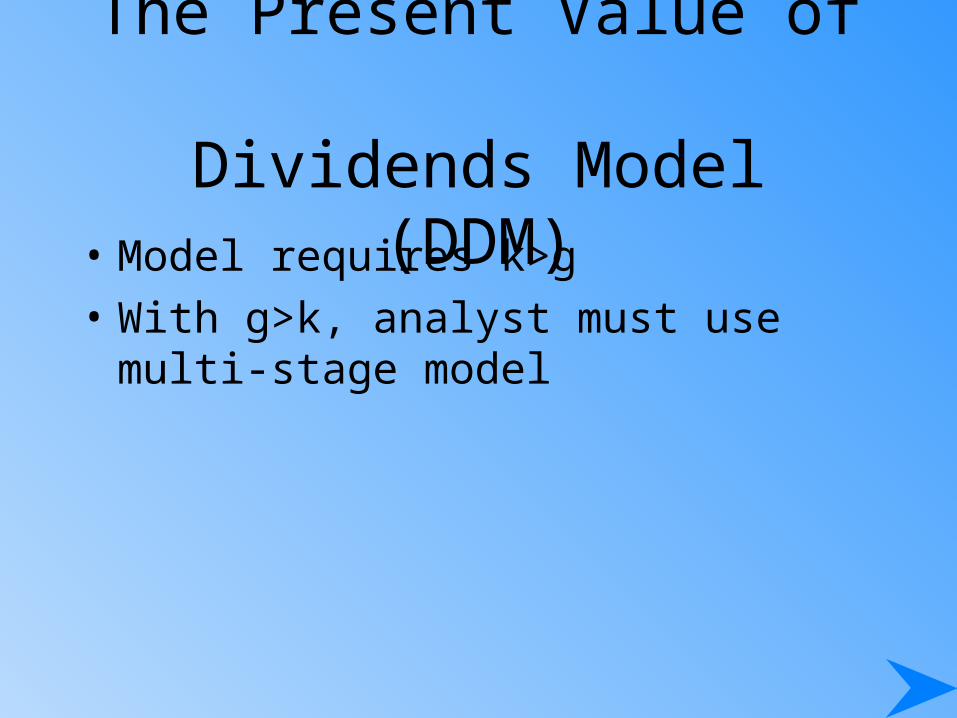
The Present Value of Dividends Model (DDM)
• Model requires k>g
• With g>k, analyst must use multi-stage model
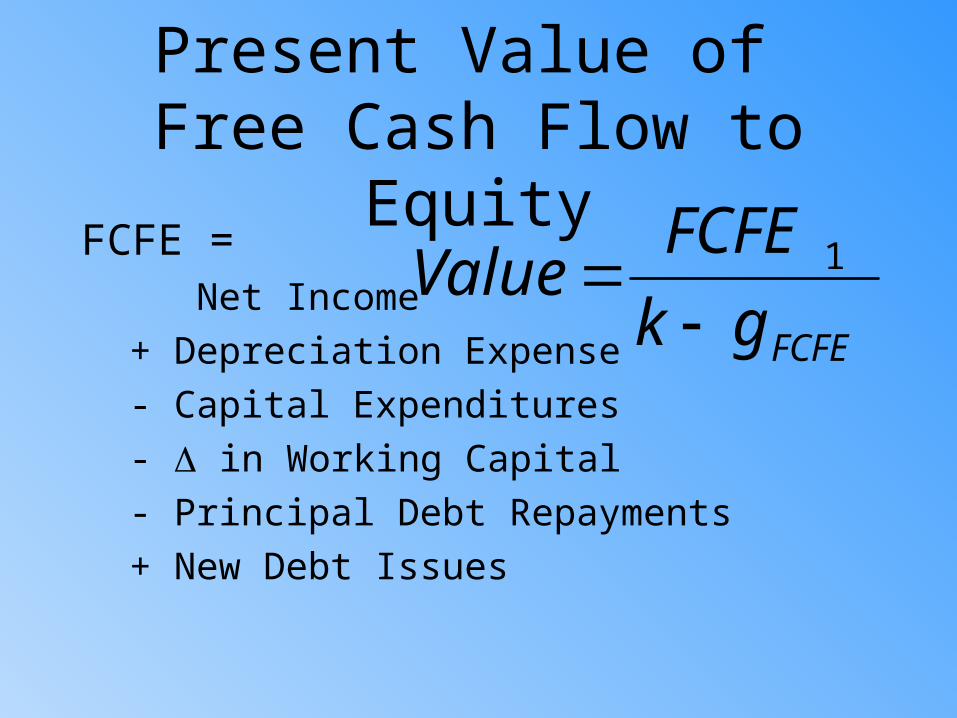
Present Value of Free Cash Flow to Equity
FCFE = Net Income
+ Depreciation Expense
- Capital Expenditures
- in Working Capital
- Principal Debt Repayments
+ New Debt Issues
FCFEgk
FCFEValue
1
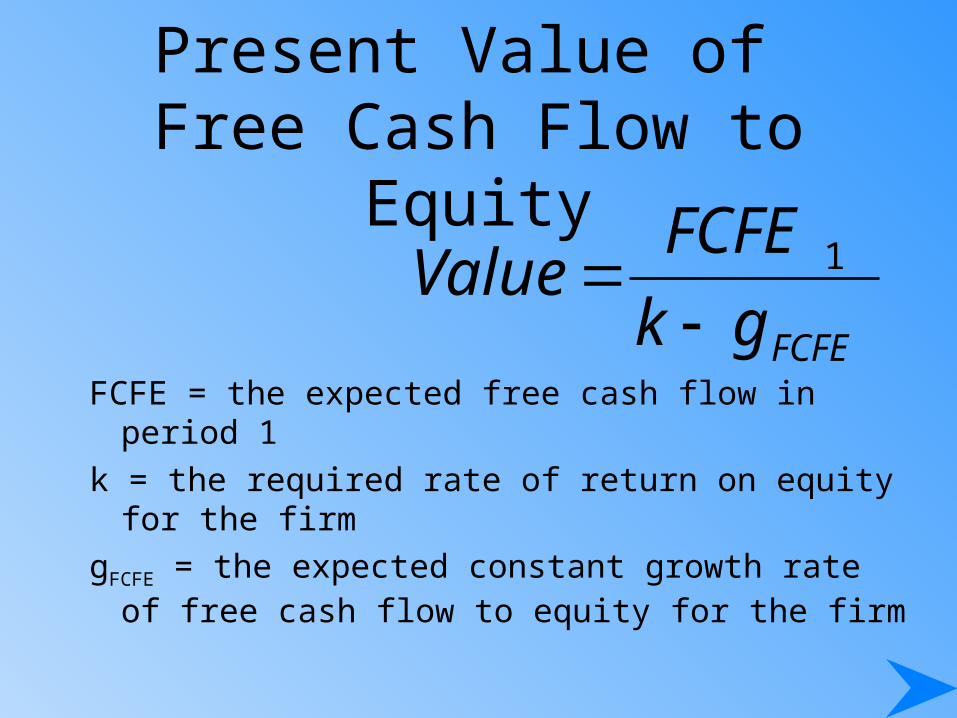
Present Value of Free Cash Flow to Equity
FCFE = the expected free cash flow in period 1
k = the required rate of return on equity for the firm
gFCFE = the expected constant growth rate of free cash flow to equity for the firm
FCFEgk
FCFEValue
1

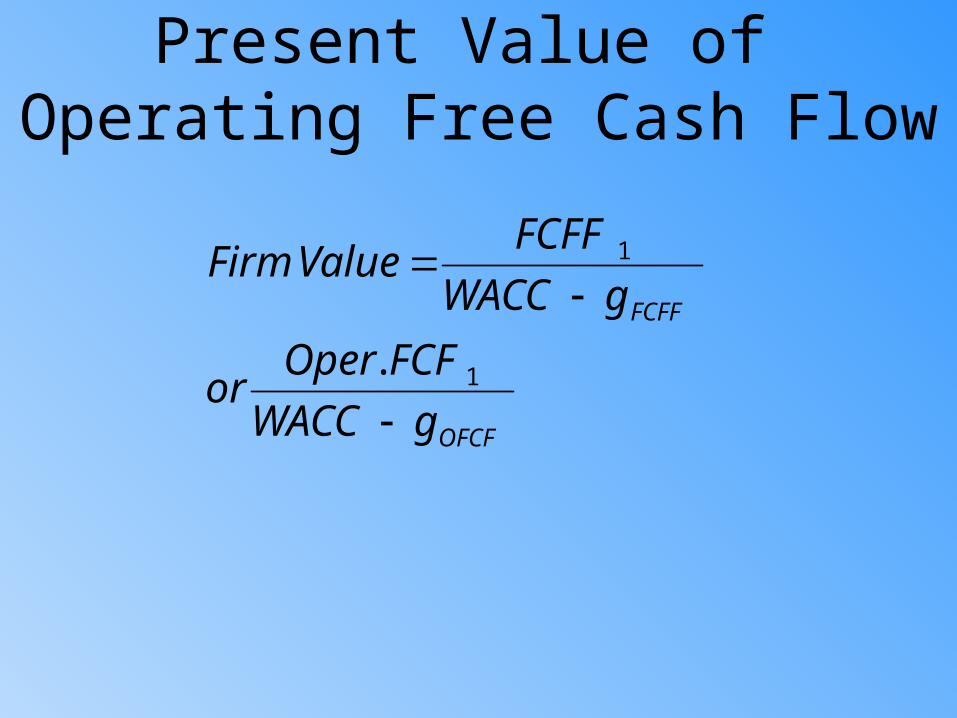
Present Value of Operating Free Cash Flow
Discount the firm’s operating free cash flow to the firm (FCFF) at the firm’s weighted average cost of capital (WACC) rather than its cost of equity
FCFF = EBIT (1-Tax Rate)+ Depreciation Expense - Capital Spending
- in Working Capital - in other assets
Present Value of Operating Free Cash Flow
OFCF
FCFF
gWACC
FCFOperor
gWACC
FCFFValueFirm
1
1
.
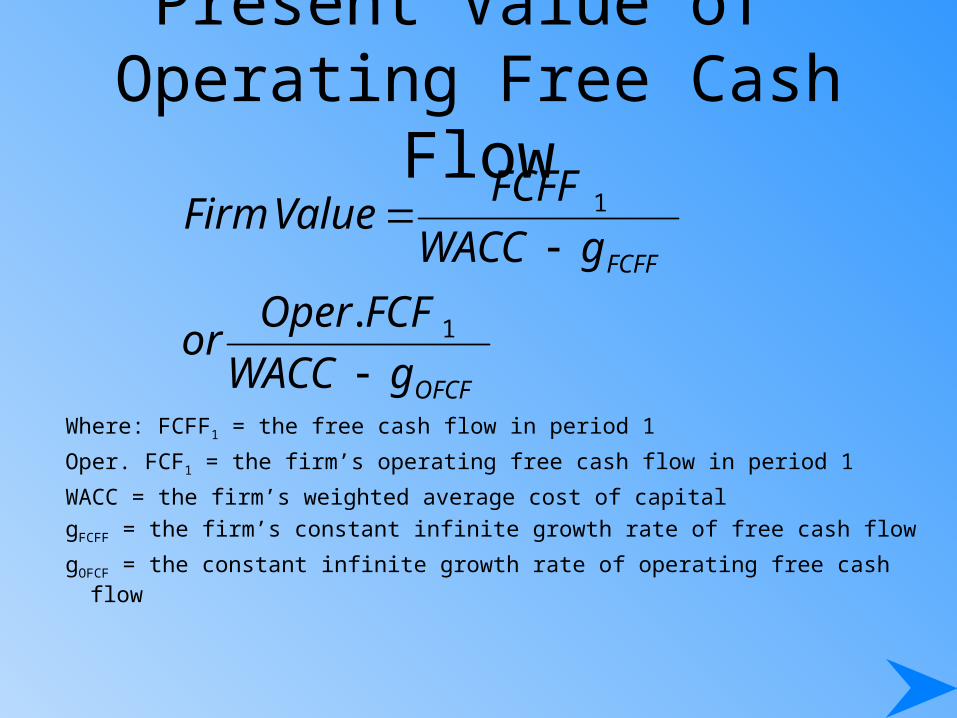
Present Value of Operating Free Cash Flow
Where: FCFF1 = the free cash flow in period 1
Oper. FCF1 = the firm’s operating free cash flow in period 1
WACC = the firm’s weighted average cost of capital
gFCFF = the firm’s constant infinite growth rate of free cash flow
gOFCF = the constant infinite growth rate of operating free cash flow
OFCF
FCFF
gWACC
FCFOperor
gWACC
FCFFValueFirm
1
1
.

An Alternate Measure of Growth
g = (RR)(ROIC)
where:– RR = the average retention rate– ROIC = EBIT (1-Tax Rate)/Total Capital
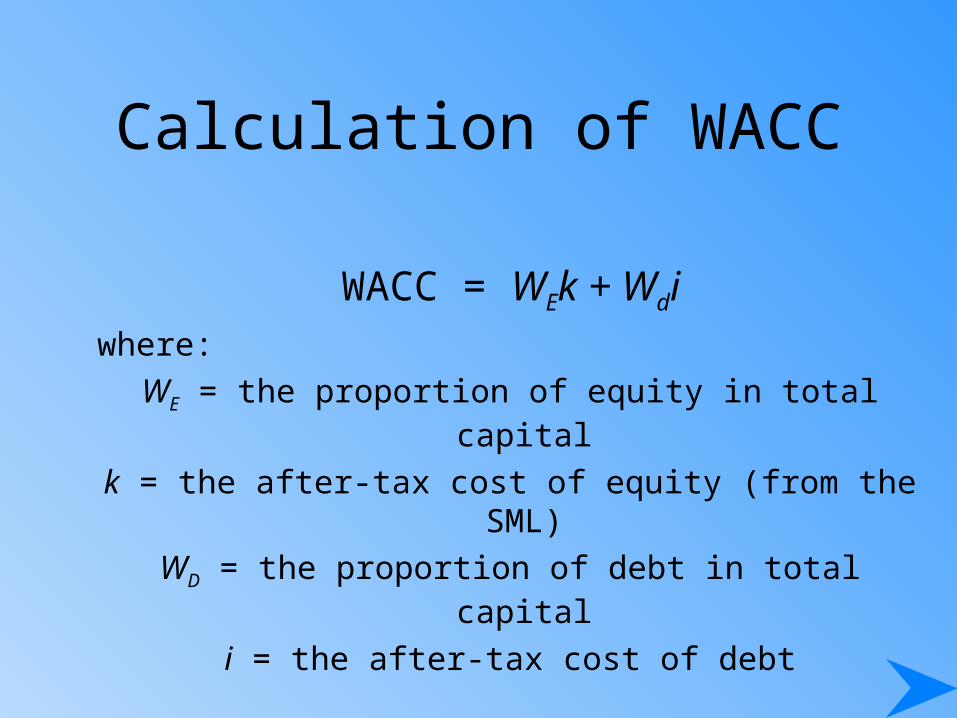
Calculation of WACC
WACC = WEk + Wdiwhere:
WE = the proportion of equity in total capital
k = the after-tax cost of equity (from the SML)
WD = the proportion of debt in total capital
i = the after-tax cost of debt

Relative Valuation Techniques
• Price Earnings Ratio– Affected by two variables:– 1. Required rate of return on its equity (k)– 2. Expected growth rate of dividends (g)
• Price/Cash Flow Ratio
• Price/Book Value Ratio
• Price-to-Sales Ratio
gk
EDEP
11
1
//

Analysis of Growth Companies
• Generating rates of return greater than the firm’s cost of capital is considered to be temporary
• Earnings higher the required rate of return are pure profits
• How long can they earn these excess profits?
• Is the stock properly valued?

Analysis of Growth Companies
• Growth companies and the DDM– constant growth model not appropriate
• Alternative growth models– no growth firm
E = r X Assets = Dividends
k
Eb
k
EV
1v
Ek
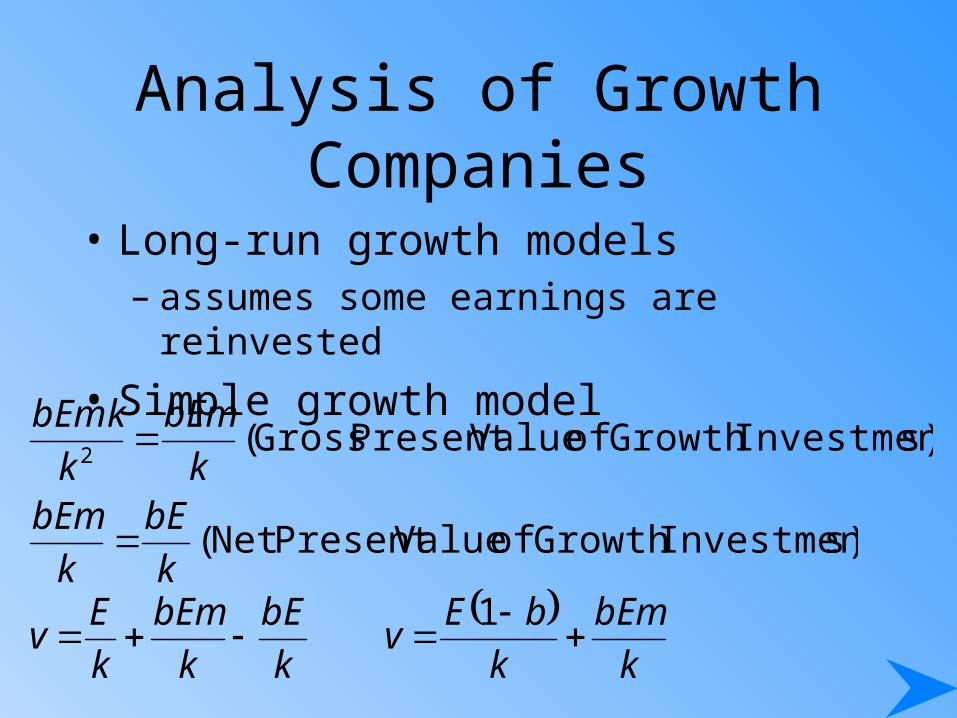
Analysis of Growth Companies
• Long-run growth models– assumes some earnings are reinvested
• Simple growth model
s)InvestmentGrowth of ValuePresent Gross(2 k
bEm
k
bEmk
s)InvestmentGrowth of ValuePresent Net (k
bE
k
bEm
k
bE
k
bEm
k
Ev
k
bEm
k
bEv
1
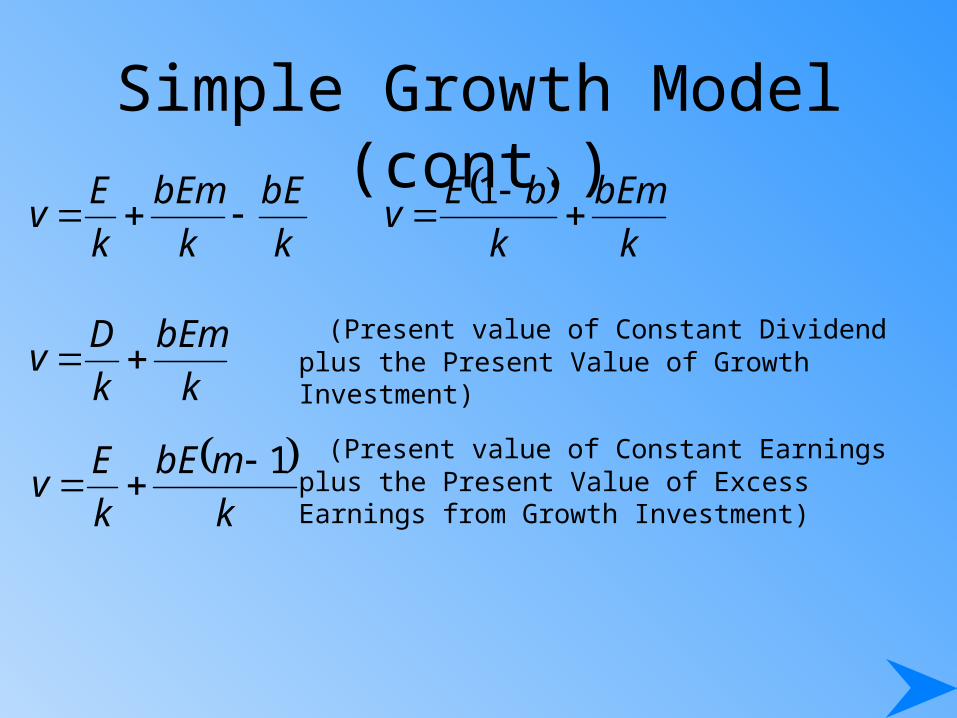
Simple Growth Model (cont.)
(Present value of Constant Dividend plus the Present Value of Growth Investment)
k
bE
k
bEm
k
Ev
k
bEm
k
bEv
1
k
bEm
k
Dv
k
mbE
k
Ev
1
(Present value of Constant Earnings plus the Present Value of Excess Earnings from Growth Investment)
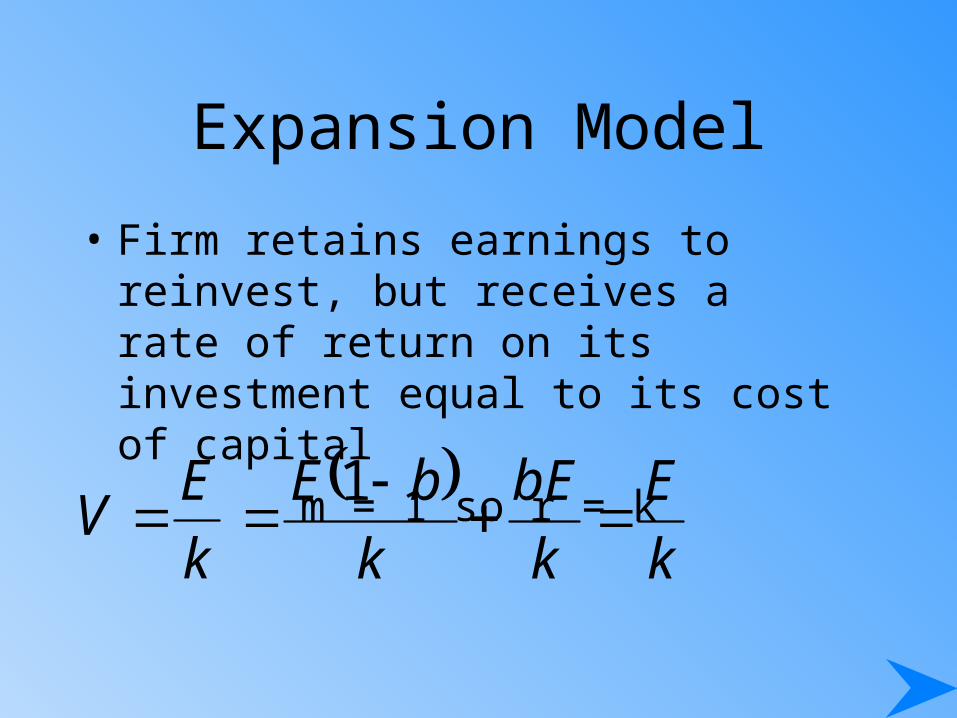
Expansion Model
• Firm retains earnings to reinvest, but receives a rate of return on its investment equal to its cost of capital
m = 1 so r = k
k
EV
k
E
k
bE
k
bE
1

Negative Growth Model
• Firm retains earnings, but reinvestment returns are below the firm’s cost of capital
• Since growth will be positive, but slower than it should be, the value will decline when the investors discount the reinvestment stream at the cost of capital
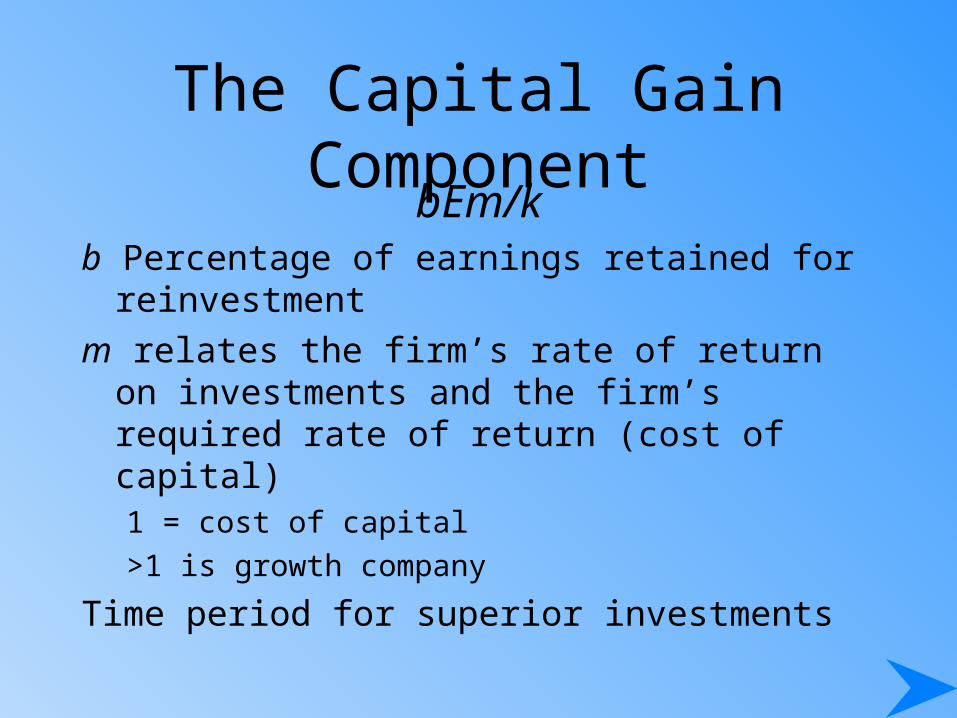
The Capital Gain ComponentbEm/k
b Percentage of earnings retained for reinvestment
m relates the firm’s rate of return on investments and the firm’s required rate of return (cost of capital)1 = cost of capital
>1 is growth company
Time period for superior investments
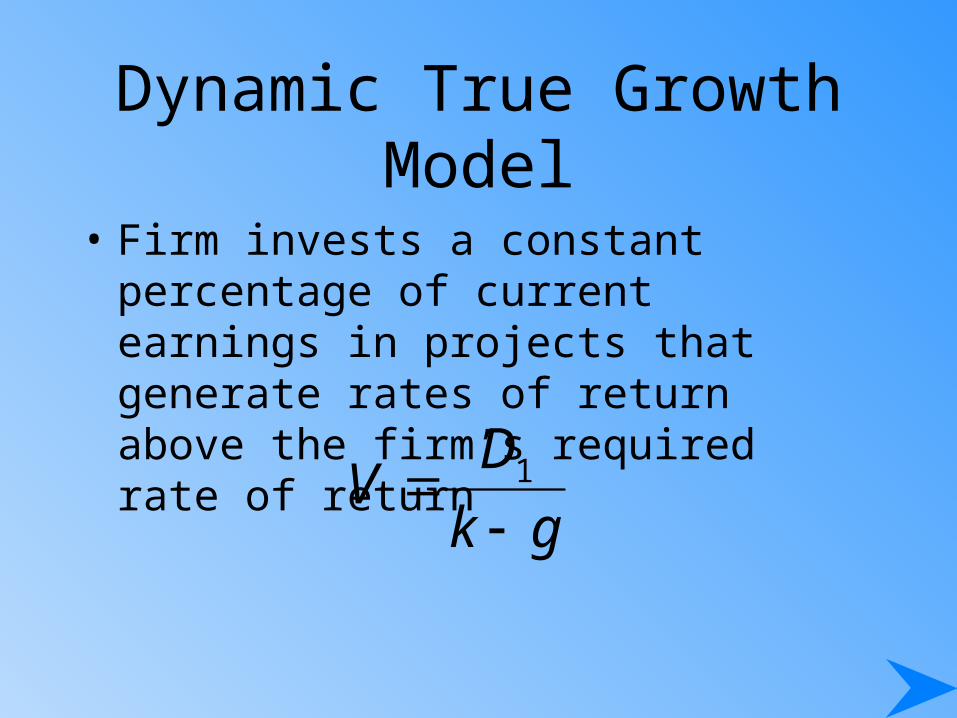
Dynamic True Growth Model
• Firm invests a constant percentage of current earnings in projects that generate rates of return above the firm’s required rate of return
gk
DV
1
Measures of Value-Added
• Economic Value-Added (EVA)– Compare net operating profit less adjusted taxes
(NOPLAT) to the firm’s total cost of capital in dollar terms, including the cost of equity
• EVA return on capitalEVA/Capital
• Alternative measure of EVA– Compare return on capital to cost of capital

Measures of Value-Added
• Market Value-Added (MVA)– Measure of external performance– How the market has evaluated the firm’s
performance in terms of market value of debt and market value of equity compared to the capital invested in the firm
• Relationships between EVA and MVA– mixed results
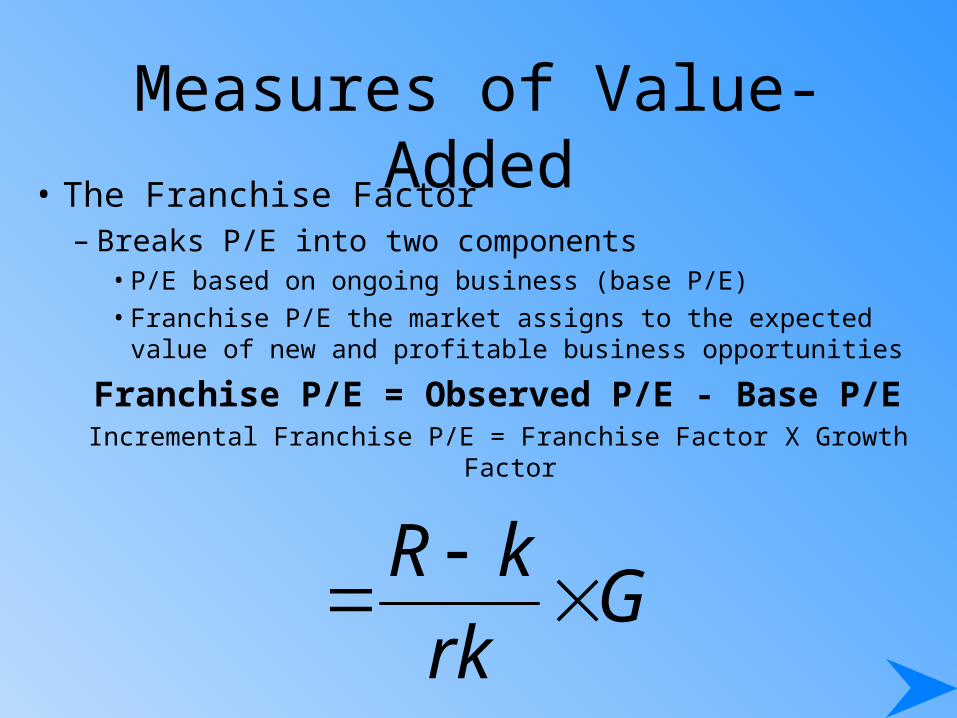
Measures of Value-Added• The Franchise Factor
– Breaks P/E into two components• P/E based on ongoing business (base P/E)
• Franchise P/E the market assigns to the expected value of new and profitable business opportunities
Franchise P/E = Observed P/E - Base P/EIncremental Franchise P/E = Franchise Factor X Growth Factor
Grk
kR
Intra-Industry Analysis• Directly compare two firms in the same industry• An alternative use of T to determine a reasonable
P/E ratio• Factors to consider
– A major difference in the risk involved– Inaccurate growth estimates– Stock with a low P/E relative to its growth rate
is undervalued– Stock with high P/E and a low growth rate is
overvalued
Site Visits and the Art of the Interview
• Focus on management’s plans, strategies, and concerns• Restrictions on nonpublic information• “What if” questions can help gauge sensitivity of
revenues, costs, and earnings• Management may indicate appropriateness of earnings
estimates• Discuss the industry’s major issues• Review the planning process• Talk to more than just the top managers

When to Sell• Holding a stock too long may lead to lower returns
than expected
• If stocks decline right after purchase, is that a further buying opportunity or an indication of incorrect analysis?
• Continuously monitor key assumptions
• Evaluate closely when market value approaches estimated intrinsic value
• Know why you bought it and watch for that to change
Efficient Markets• Opportunities are mostly among less well-known
companies
• To outperform the market you must find disparities between stock values and market prices - and you must be correct
• Concentrate on identifying what is wrong with the market consensus and what earning surprises may exist
Influences on Analysts
• Investment bankers may push for favorable evaluations
• Corporate officers may try to convince analysts
• Analyst must maintain independence and have confidence in his or her analysis

Global Company and Stock Analysis
Factors to Consider:– Availability of Data– Differential Accounting Conventions– Currency Differences (Exchange Rate
Risk)– Political (Country) Risk– Transaction Costs– Valuation Differences

The InternetInvestments Online
www.better-investing.com
www.fool.com
www.cfonews.com
www.ibes.com
www.zacks.com
www.valueline.com
www.financialweb.com
investor.msn.com
www.marketedge.com
www.nyssa.org