Embed Size (px)
Citation preview
Lecture Note#2 Basic Principles of Economics Dr. Mahmoud Arafa
http://scholar.cu.edu.eg/mahmoudarafaPage: [email protected]: -E
Topic Page
2 Basic Principles of Economics
2.1 Scope of Environmental Economics
2.2 fields of Economic study
2.3 Microeconomic Concerns
2.4 Macroeconomic Concerns
2.5 Microeconomic and Environment
2.6 Macroeconomic and Environment
2.7 Economic Policy and objectives
2.8 Demand
2.9 Supply
2.10 Market Equilibrium
2.11 Summary
2.12 Questions and Problems
2. Basic Principles of Economics:
2.1. Scope of Environmental Economics (microeconomics and
macroeconomics):
Most students taking Environmental economics for the first time are surprised by the
breadth of what they study. Some think that economics will teach them about the stock
market or what to do with their money. Others think that economics deals exclusively
with Big problems such as Pollution, inflation and unemployment. In fact, it deals with
all those subjects, but they are pieces of a much larger puzzle. Economics has deep roots
in and close ties to social philosophy. An issue of great importance to philosophers, for
example, is distributional justice. Why are some people rich and others poor? And
whatever the answer is this fair? A number of nineteenth-century social philosophers
wrestled with these questions, and out of their musings, economics as a separate
discipline was born. The easiest way to get a feel for the breadth and depth of what you
will be studying is to explore briefly the way Environmental economics is organized.
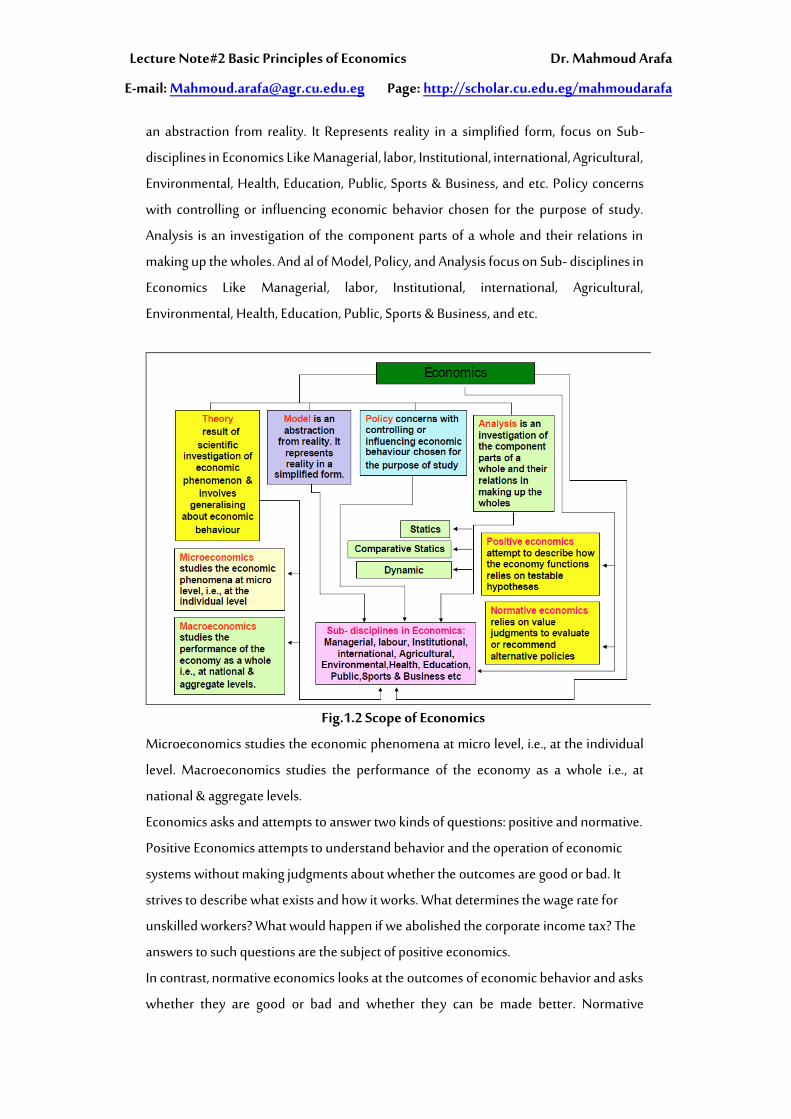
As in Fig.2.1, there are four major divisions of economics: Theory, Models, Policy, and
Analysis. Theory, which represents the results of Scientific investigation of economic
phenomenon & involves generalizing about economic behavior, is Divided into two
major divisions of economics: microeconomics and macroeconomics. Model, which is
Lecture Note#2 Basic Principles of Economics Dr. Mahmoud Arafa
http://scholar.cu.edu.eg/mahmoudarafaPage: [email protected]: -E
an abstraction from reality. It Represents reality in a simplified form, focus on Sub-
disciplines in Economics Like Managerial, labor, Institutional, international, Agricultural,
Environmental, Health, Education, Public, Sports & Business, and etc. Policy concerns
with controlling or influencing economic behavior chosen for the purpose of study.
Analysis is an investigation of the component parts of a whole and their relations in
making up the wholes. And al of Model, Policy, and Analysis focus on Sub- disciplines in
Economics Like Managerial, labor, Institutional, international, Agricultural,
Environmental, Health, Education, Public, Sports & Business, and etc.
Fig.1.2 Scope of Economics
Microeconomics studies the economic phenomena at micro level, i.e., at the individual
level. Macroeconomics studies the performance of the economy as a whole i.e., at
national & aggregate levels.
Economics asks and attempts to answer two kinds of questions: positive and normative.
Positive Economics attempts to understand behavior and the operation of economic
systems without making judgments about whether the outcomes are good or bad. It
strives to describe what exists and how it works. What determines the wage rate for
unskilled workers? What would happen if we abolished the corporate income tax? The
answers to such questions are the subject of positive economics.
In contrast, normative economics looks at the outcomes of economic behavior and asks
whether they are good or bad and whether they can be made better. Normative
Lecture Note#2 Basic Principles of Economics Dr. Mahmoud Arafa
http://scholar.cu.edu.eg/mahmoudarafaPage: [email protected]: -E
economics involves judgments and prescriptions for courses of action. Should the
government subsidize or regulate the cost of higher education? Should medical benefits
to the elderly under Medicare be available only to those with incomes below some
threshold? Should the
2.2. fields of Economic study:
Individual economists focus their research and study in many diverse areas. Many of
these specialized fields are reflected in the advanced courses offered at most colleges
and universities. Some are concerned with economic history or the history of economic
thought. Others focus on international economics or growth in less developed
countries. Still others study the economics of cities (urban economics) or the
relationship between economics and law. These fields are summarized below.
1.Behavioral economics:
Uses psychological theories relating to emotions and social context to help understand
economic decision making and policy. Much of the work in behavioral economics
focuses on the biases that individuals have that affect the decisions they make.
2.Comparative economic:
Systems examines the ways alternative economic systems function. What are the
advantages and disadvantages of different systems?
3.Econometrics:
Applies statistical techniques and data to economic problems in an effort to test
hypotheses and theories. Most schools require economics majors to take at least one
course in statistics or econometrics.
4.Economic development:
Focuses on the problems of low-income countries. What can be done to promote
development in these nations? Important concerns of development for economists
include population growth and control, provision for basic needs, and strategies for
international trade.
5.Economic history:
Traces the development of the modern economy. What economic and political events
and scientific advances caused the Industrial Revolution? What explains the
tremendous growth and progress of post—World War II Japan? What caused the Great
Depression of the 1930s?
6.Environmental economics:
Studies the potential failure of the market system to account fully for the impacts of
Lecture Note#2 Basic Principles of Economics Dr. Mahmoud Arafa
http://scholar.cu.edu.eg/mahmoudarafaPage: [email protected]: -E
production and consumption on the environment and on natural resource depletion.
Have alternative public policies and new economic institutions been effective in
correcting these potential failures?
7.Finance:
Examines the ways in which households and firms actually pay for, or finance, their
purchases. It involves the study of capital markets (including the stock and bond
markets), futures and options, capital budgeting, and asset valuation.
8.Health economics:
Analyzes the health care system and its players: government, insurers, health care
providers, and patients. It provides insight into the demand for medical care, health
insurance markets, cost controlling insurance plans (HMOs, PPOs, IPAs), government
health care programs (Medicare and Medicaid), variations in medical practice, medical
malpractice, competition versus regulation, and national health care reform.
9.The history of economic thought:
Studies the development of economic ideas and theories over time, from Adam Smith in
the eighteenth century to the works of economists such as Thomas Malthus, Karl Marx,
and John Maynard Keynes. Because economic theory is constantly developing and
changing, studying the history of ideas helps give meaning to modern theory and puts it
in perspective.
10.Industrial organization:
Looks carefully at the structure and performance of industries and firms within an
economy. How do businesses compete? Who gains and who loses?
11.International economics:
Studies trade flows among countries and international financial institutions. What are
the advantages and disadvantages for a country that allows its citizens to buy and sell
freely in world markets? Why is the dollar strong or weak?
12.Labor economics:
Deals with the factors that determine wage rates, employment, and unemployment.
How do people decide whether to work, how much to work, and at what kind of job?
How have the roles of unions and management changed in recent years?
13.Law and economics:
Analyzes the economic function of legal rules and institutions. How does the law
change the behavior of individuals and businesses? Do different liability rules make
accidents and injuries more or less likely? What are the economic costs of crime?
Lecture Note#2 Basic Principles of Economics Dr. Mahmoud Arafa
http://scholar.cu.edu.eg/mahmoudarafaPage: [email protected]: -E
14.Public economics:
Examines the role of government in the economy. What are the economic functions of
government, and what should they be? How should the government finance the
services that it provides? What kinds of government programs should confront the
problems of poverty, unemployment, and pollution? What problems does government
involvement create?
15.Urban and regional economics:
Studies the spatial arrangement of economic activity. Why do we have cities? Why are
manufacturing firms locating farther and farther from the center of urban areas?
2.3. Microeconomic Concerns:
Microeconomics deals with the functioning of individual industries and the behavior of
individual economic decision-making units: firms and households. Firms’ choices
about what to produce and how much to charge and households’ choices about what
and how much to buy help to explain why the economy produces the goods and
services it does. Microeconomic Concerns with: Consumer decisions and utility
maximization; Firm production and its profit maximization; Individual market
equilibrium; Effects of government regulation on individual markets; and Externalities
and other market side effects.
2.4. Macroeconomic Concerns;
Macroeconomics looks at the economy as a whole. Instead of trying to understand
what determines the output of a single firm or industry or what the consumption
patterns are of a single household or group of households, macroeconomics examines
the factors that determine national output, or national product. Macroeconomics
concerns with: The effects of general taxes system such as income and sales taxes on
output and prices; The causes of economic upswings and downturns (Economic cycles);
The effects of monetary and fiscal policy on economic; How interest rates are
determined; and Why some economies grow faster than others.
2.5. Microeconomic and Environment:
The economic analysis of environment can be approached from two different
perspectives, environmental economics and ecological economics. Environmental
economics divided into two types Environmental Microeconomic and Environmental
Macroeconomic. Environmental Microeconomic applies insights from traditional
economics to environmental issues. We will explore several of these insights in later
Sections of this course, such as the analysis of Supply and demand; environmental

Lecture Note#2 Basic Principles of Economics Dr. Mahmoud Arafa
http://scholar.cu.edu.eg/mahmoudarafaPage: [email protected]: -E
externalities, Effects of government regulation on individual markets, Individual market
equilibrium, Firm production and its profit maximization, and Consumer decisions and
utility maximization.
2.6. Macroeconomic and Environment:
At the time, which Environmental Macroeconomic applies insights from traditional
microeconomics to environmental issues; the Environmental Macroeconomic applies
Macro-insights such as The effects of general taxes system such as income and sales
taxes on output and prices, The causes of economic upswings and downturns, The
effects of monetary and fiscal policy on economic, and How interest rates are
determined. Environmental economists recognize that the environment has value, but
tend to focus on environmental values in human terms, specifically those that can be
measured monetarily.
2.7. Economic Policy and objectives:
Economic policy refers to the actions that governments take in the economic field. It
covers the systems for setting levels of taxation, government budgets, the money supply
and interest rates as well as the labor market, national ownership, and many other areas
of government interventions into the economy. Policy is generally directed to achieve
four main Goals and particular objectives. Goals like Efficiency, Equity, Growth, and
Stability. Efficiency In economics called allocate efficiency. An efficient economy is one
that produces what people want at the least possible. Equity is Fairness. Economic
Growth is an increase in the total output of an economy. Stability refers to the condition
in which national output is growing steadily, with low inflation and full employment of
resources.
Particular Objectives like targets for inflation, unemployment, or economic growth.
Sometimes other objectives, like military spending or nationalization are important.
These are referred to as the policy goals: the outcomes which the economic policy aims
to achieve. To achieve these goals, governments use policy tools which are under the
control of the government. These generally include the interest rate and money
supply, tax and government spending, tariffs, exchange rates, labor market regulations,
and many other aspects of government.
2.8. Demand:
Demand in Product/Output Markets:
In real life, people make many consumption decisions at the same time. To see how the
forces of demand and supply work, however, let us focus first on the amount of a single
Lecture Note#2 Basic Principles of Economics Dr. Mahmoud Arafa
http://scholar.cu.edu.eg/mahmoudarafaPage: [email protected]: -E
product that an individual decides to consume within some given period of time, such
as a month or a year. individual’s decision about what quantity of a particular output, or
product, to demand depends on a number of factors, including:
- The price of the product in question.
- The income available to the household.
- The household’s amount of accumulated wealth.
- The prices of other products available to the household.
- The household’s tastes and preferences.
- The household’s expectations about future income, wealth, and prices.
Quantity demanded:
The amount of a product that an individual would buy in a given period if it could buy
all it wanted at the current market price. Of course, the amount of a product that
individuals finally purchase depends on the amount of product actually available in the
market. The expression if it could buy all it wanted is critical to the definition of quantity
demanded because it allows for the possibility that quantity supplied and quantity
demanded are unequal.
Changes in Quantity Demanded versus Changes in Demand:
Changes in the price of a product affect the quantity demanded per period. Changes in
any other factor, such as income or preferences, affect demand. Thus, we say that an
increase in the price of Coca-Cola is likely to cause a decrease in the quantity of Coca-
Cola demanded. However, we say that an increase in income is likely to cause an
increase in the demand for most goods.
Demand Schedule:
A demand schedule shows how much of a product an individual is willing to purchase
per time period at different prices. The demand schedule in Table 1.2 thus shows that
at a price of $3.00 per gallon, Alex is willing to buy 10 gallons of gasoline. We can see
that this demand schedule reflects a lot of information about Alex including where she
lives and works and what she likes to do in her spare time.
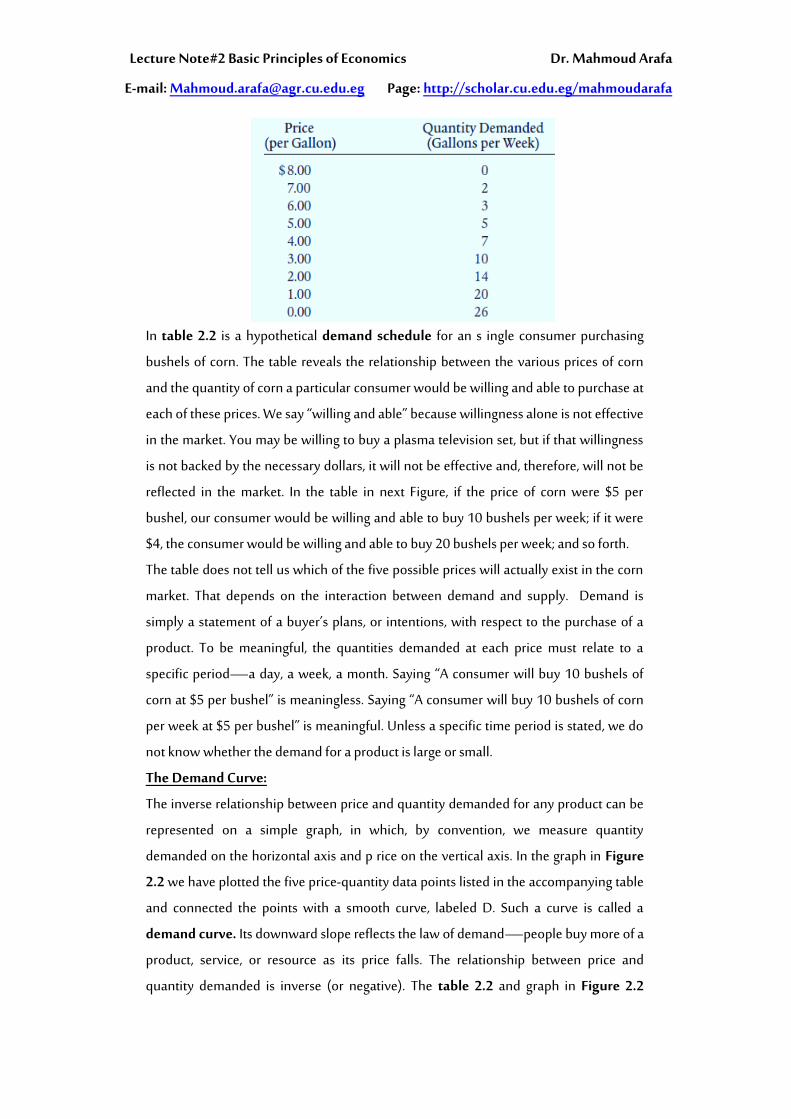
Table 1.2 A demand schedule for gasoline
Lecture Note#2 Basic Principles of Economics Dr. Mahmoud Arafa
http://scholar.cu.edu.eg/mahmoudarafaPage: [email protected]: -E
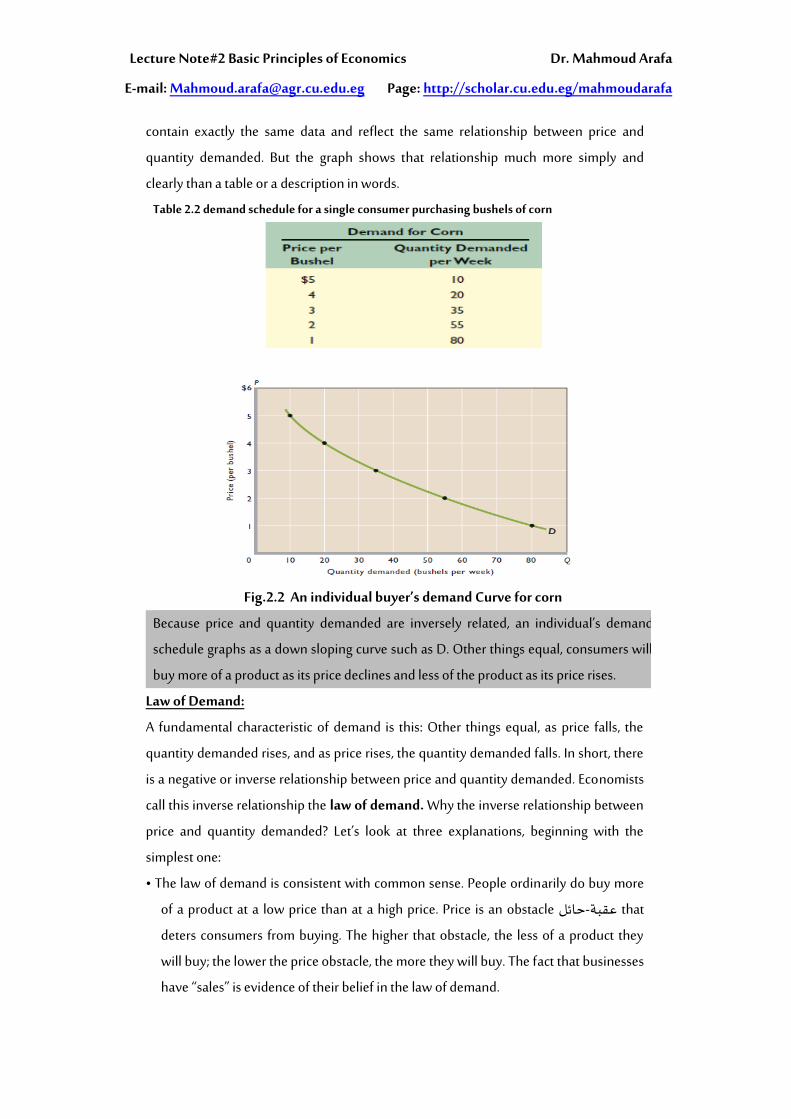
In table 2.2 is a hypothetical demand schedule for an s ingle consumer purchasing
bushels of corn. The table reveals the relationship between the various prices of corn
and the quantity of corn a particular consumer would be willing and able to purchase at
each of these prices. We say “willing and able” because willingness alone is not effective
in the market. You may be willing to buy a plasma television set, but if that willingness
is not backed by the necessary dollars, it will not be effective and, therefore, will not be
reflected in the market. In the table in next Figure, if the price of corn were $5 per
bushel, our consumer would be willing and able to buy 10 bushels per week; if it were
$4, the consumer would be willing and able to buy 20 bushels per week; and so forth.
The table does not tell us which of the five possible prices will actually exist in the corn
market. That depends on the interaction between demand and supply. Demand is
simply a statement of a buyer’s plans, or intentions, with respect to the purchase of a
product. To be meaningful, the quantities demanded at each price must relate to a
specific period—a day, a week, a month. Saying “A consumer will buy 10 bushels of
corn at $5 per bushel” is meaningless. Saying “A consumer will buy 10 bushels of corn
per week at $5 per bushel” is meaningful. Unless a specific time period is stated, we do
not know whether the demand for a product is large or small.
The Demand Curve:
The inverse relationship between price and quantity demanded for any product can be
represented on a simple graph, in which, by convention, we measure quantity
demanded on the horizontal axis and p rice on the vertical axis. In the graph in Figure
2.2 we have plotted the five price-quantity data points listed in the accompanying table
and connected the points with a smooth curve, labeled D. Such a curve is called a
demand curve. Its downward slope reflects the law of demand—people buy more of a
product, service, or resource as its price falls. The relationship between price and
quantity demanded is inverse (or negative). The table 2.2 and graph in Figure 2.2
Lecture Note#2 Basic Principles of Economics Dr. Mahmoud Arafa
http://scholar.cu.edu.eg/mahmoudarafaPage: [email protected]: -E
contain exactly the same data and reflect the same relationship between price and
quantity demanded. But the graph shows that relationship much more simply and
clearly than a table or a description in words.
Table 2.2 demand schedule for a single consumer purchasing bushels of corn
Fig.2.2 An individual buyer’s demand Curve for corn
Because price and quantity demanded are inversely related, an individual’s demand
schedule graphs as a down sloping curve such as D. Other things equal, consumers will
buy more of a product as its price declines and less of the product as its price rises.
Law of Demand:
A fundamental characteristic of demand is this: Other things equal, as price falls, the
quantity demanded rises, and as price rises, the quantity demanded falls. In short, there
is a negative or inverse relationship between price and quantity demanded. Economists
call this inverse relationship the law of demand. Why the inverse relationship between
price and quantity demanded? Let’s look at three explanations, beginning with the
simplest one:
• The law of demand is consistent with common sense. People ordinarily do buy more
of a product at a low price than at a high price. Price is an obstacle حائل-عقبة that
deters consumers from buying. The higher that obstacle, the less of a product they
will buy; the lower the price obstacle, the more they will buy. The fact that businesses
have “sales” is evidence of their belief in the law of demand.
Lecture Note#2 Basic Principles of Economics Dr. Mahmoud Arafa
http://scholar.cu.edu.eg/mahmoudarafaPage: [email protected]: -E
• In any specific time period, each buyer of a product will derive less satisfaction (or
benefit, or utility) from each successive unit of the product consumed. The second
Big Mac will yield less satisfaction to the consumer than the first and the third still
less than the second. That is, consumption is subject to diminishing marginal utility.
And because successive units of a particular product yield less and less marginal
utility, consumers will buy additional units only if the price of those units is
progressively reduced.
• We can also explain the law of demand in terms of income and substitution effects.
The income effect indicates that a lower price increases the purchasing power of a
buyer’s money income, enabling the buyer to purchase more of the product than
before. A higher price has the opposite effect. The substitution effect suggests that at
a lower price buyer has the incentive to substitute what is now a less expensive
product for similar products that are now relatively more expensive. The product
whose price has fallen is now “a better deal” relative to the other products.
Market Demand:
So far, we have concentrated on just one consumer. But competition requires that more
than one buyer be present in each market. By adding the quantities demanded by all
consumers at each of the various possible prices, we can get from individual demand to
market demand. If there are just three buyers in the market, as represented in table 3.2
in Figure 3.2, it is relatively easy to determine the total quantity demanded at each price.
Figure 3.2 shows the graphical summing procedure: At each price we sum horizontally
the quantities demanded by Joe, Jen, and Jay to obtain the total quantity demanded at
that price; we then plot the price and the total quantity demanded as one point on the
market demand curve.
Competition, of course, ordinarily entails many more than three buyers of a product. To
avoid hundreds or thousands or millions of additions, we suppose that all the buyers in
a market are willing and able to buy the same amounts at each of the possible prices.
Then we just multiply those amounts by the number of buyers to obtain the market
demand. That is how we arrived at the demand schedule and demand curve D1 in
Figure 3.2 for a market of 200 corn buyers, each with a demand as shown in table 3.2.
In constructing a demand curve such as D1 in Figure 3.2, economists assume that price
is the most important influence on the amount of any product purchased. But
economists know that other factors can and do affect purchases. These factors, called
determinants of demand, are assumed to be constant when a demand curve like D1 is

Lecture Note#2 Basic Principles of Economics Dr. Mahmoud Arafa
http://scholar.cu.edu.eg/mahmoudarafaPage: [email protected]: -E
drawn. They are the “other things equal” in the relationship between price and quantity
demanded. When any of these determinants changes, the demand curve will shift to the
right or left. For this reason, determinants of demand are sometimes referred to as
demand shifters. The basic determinants of demand are (1) consumers’ tastes
(preferences), (2) the number of buyers in the market, (3) consumers’ incomes, (4) the
prices of related goods, and (5) consumer expectations.
Table 3.2 Market demand schedule for corn, three buyers.
Figure 3.2 Market demand curve for corn, three buyers.
The market demand curve D is the horizontal summation of the individual demand curves (D
1, D2, and D3) of all the consumers in the market. At the price of $3, for example, the three
individual curves yield a total quantity demanded of 100 bushels.
Change in Demand:
A change in one or more of the determinants of demand will change the demand data
or the demand schedule and therefore the location of the demand curve there. A
change in the demand schedule or, graphically, a shift in the demand curve is called a
change in demand. If consumers desire to buy more corn at each possible price than is
reflected in column 2 in table 2.2 , that increase in demand is shown as a shift of the
demand curve to the right, say, from D1 to D2. Conversely, a decrease in demand
occurs when consumers buy less corn at each possible price than is indicated in column
2.2 The leftward shift of the demand curve from D1 to D3 in Figure 6.2 shows that
situation. Now let’s see how changes in each determinant affect demand.
Tastes:
A favorable change in consumer tastes (preferences) for a product—a change that
Lecture Note#2 Basic Principles of Economics Dr. Mahmoud Arafa
http://scholar.cu.edu.eg/mahmoudarafaPage: [email protected]: -E
makes the product more desirable—means that more of it will be demanded at each
price. Demand will increase; the demand curve as in Figure 6.2 will shift rightward. An
unfavorable change in consumer preferences will decrease demand, shifting the
demand curve to the left. New products may affect consumer tastes; for example, the
introduction of digital cameras greatly decreased the demand for film cameras.
Consumers’ concern over the health hazards of cholesterol and obesity have increased
the demand for broccoli, low-calorie beverages, and fresh fruit while decreasing the
demand for beef, veal, eggs, and whole milk. Over the past several years, the demand
for coffee drinks and table wine has greatly increased, driven by a change in tastes. So,
too, has the demand for DVDs and iPhones.
Number of Buyers:
An increase in the number of buyers in a market is likely to increase product demanded;
a decrease in the number of buyers will probably decrease demand. Increase or
decrease in demand will reflect in shift demand curve as in Figure 6.2.
Income:
How changes in income affect demand is a more complex matter. For most products, a
rise in income causes an increase in demand. Consumers typically buy more steaks,
furniture, and electronic equipment as their incomes increase. Conversely, the demand
for such products declines as their incomes fall. Products whose demand varies directly
with money income are called superior goods, or normal goods. Although most
products are normal goods, there are some exceptions. As incomes increase beyond
some point, the demand for used clothing, retread tires, and third-hand automobiles
may decrease, because the higher incomes enable consumers to buy new versions of
those products. Rising incomes may also decrease the demand for soy enhanced
hamburger. Similarly, rising incomes may cause the demand for charcoal grills to
decline as wealthier consumers switch to gas grills. Goods whose demand varies
inversely with money income are called inferior goods.
Prices of Related Goods:
A change in the price of a related good may either increase or decrease the demand for
a product, depending on whether the related good is a substitute or a complement: A
substitute good is one that can be used in place of another good; and A complementary
good is one that is used together with another good.
Substitutes:
Coffee and Tea are substitute goods or, simply, substitutes. When two products are
Lecture Note#2 Basic Principles of Economics Dr. Mahmoud Arafa
http://scholar.cu.edu.eg/mahmoudarafaPage: [email protected]: -E
substitutes, an increase in the price of one will increase the demand for the other.
Conversely, a decrease in the price of one will decrease the demand for the other. For
example, when the price of Coffee rises, consumers will buy less of it and increase their
demand for Tea. When the price of Colgate toothpaste declines, the demand for Crest
decreases. So it is with other product pairs such as Nikes and Reeboks, Budweiser and
Miller beer, or Chevrolets and Fords. They are substitutes in consumption.
Complements:
Because complements goods are used together, they are typically demanded jointly.
Examples include computers and software, cell phones and cellular service, and
snowboards and lift tickets. If the price of a complement (for example, lettuce) goes up,
the demand for the related good (salad dressing) will decline. Conversely, if the price of
a complement (for example, tuition) falls, the demand for a related good (textbooks)
will increase.
Unrelated Goods:
The vast majority of goods is not related to one another and is called independent
goods. Examples are butter and golf balls, potatoes and automobiles, and bananas and
wristwatches. A change in the price of one has little or no effect on the demand for the
other.
Consumer Expectations:
Changes in consumer expectations may shift demand. A newly formed expectation of
higher future prices may cause consumers to buy now in order to “beat” the anticipated
price rises, thus increasing current demand. That is often what happens in so-called hot
real estate markets. Buyers rush in because they think the price of new homes will
continue to escalate rapidly. Some buyers fear being “priced out of the market” and
therefore not obtaining the home they desire. Other buyers—speculators—believe
they will be able to sell the houses later at a higher price. Whichever their motivation,
these buyers increase the current demand for houses.
Similarly, a change in expectations concerning future income may prompt consumers
to change their current spending. For example, first-round NFL draft choices may
splurge on new luxury cars in anticipation of a lucrative professional football contract.
Or workers who become fearful of losing their jobs may reduce their demand for, say,
vacation travel.
In summary, an increase in demand—the decision by consumers to buy larger
quantities of a product at each possible price—may be caused by
Lecture Note#2 Basic Principles of Economics Dr. Mahmoud Arafa
http://scholar.cu.edu.eg/mahmoudarafaPage: [email protected]: -E
• A favorable change in consumer tastes.
• An increase in the number of buyers.
• Rising incomes if the product is a normal good.
• Falling incomes if the product is an inferior good.
• An increase in the price of a substitute good.
• A decrease in the price of a complementary good.
• A new consumer expectation that either prices or income will be higher in the future.
You should “reverse” these generalizations to explain a decrease in demand. Table …
provides additional illustrations of the determinants of demand.
Changes in Quantity Demanded:
A change in demand must not be confused with a change in quantity demanded. A
change in demand is a shift of the demand curve to the right (an increase in demand) or
to the left (a decrease in demand). It occurs because the consumer’s state of mind about
purchasing the product has been altered in response to a change in one or more of the
determinants of demand. Recall that “demand” is a schedule or a curve; therefore, a
“change in demand” means a change in the schedule and a shift of the curve.
In contrast, a change in quantity demanded is a movement from one point to another
point—from one price-quantity combination to another—on a fixed demand
schedule or demand curve. The cause of such a change is an increase or decrease in the
price of the product under consideration. for example, a decline in the price of corn
from $5 to $4 will increase the quantity of corn demanded from 2000 to 4000 bushels.
In Figure 6.2 the shift of the demand curve D1 to either D2 or D3 is a change in
demand. But the movement from point (a) to point (b) on curve D1 represents a change
in quantity demanded: Demand has not changed; it is the entire curve, and it remains
fixed in place.
2.9. Supply :
Supply:
Supply is a schedule or curve showing the various amounts of a product that producers
are willing and able to make available for sale at each of a series of possible prices
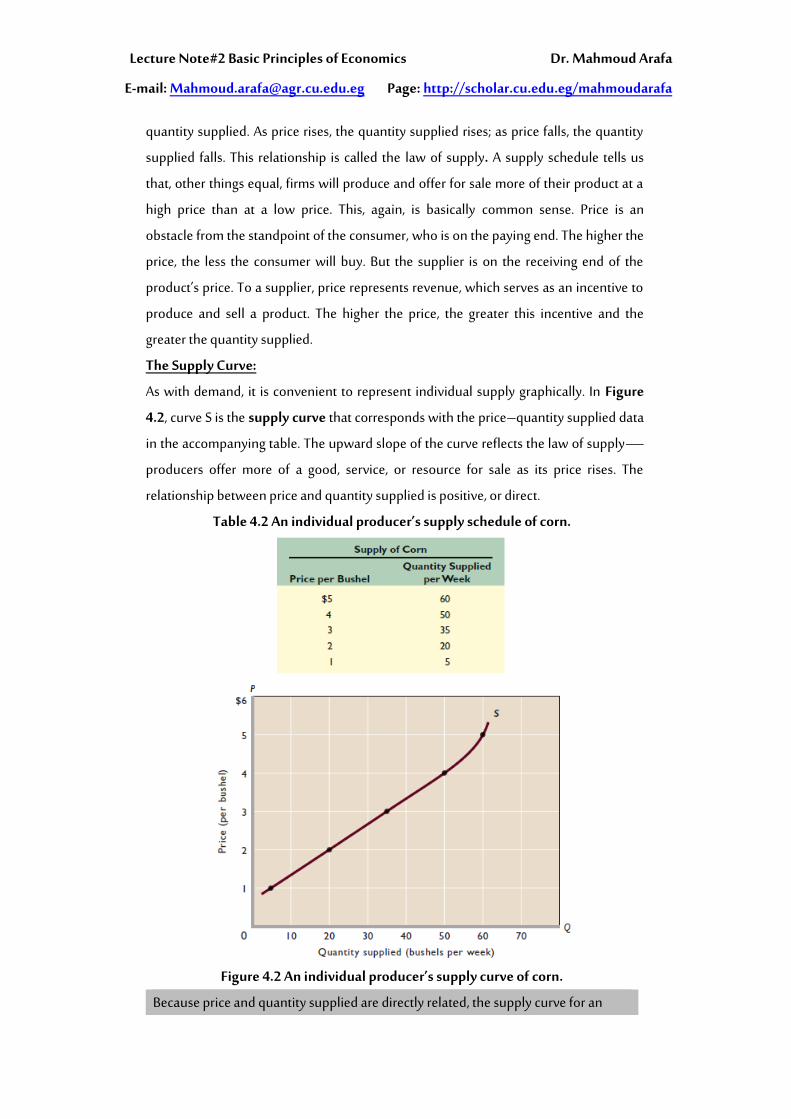
during a specific period. The table 2.5 is a hypothetical supply schedule for a single
producer of corn. It shows the quantities of corn that will be supplied at various prices,
other things equal.
Law of Supply
The table 4.2 shows a positive or direct relationship that prevails between price and
Lecture Note#2 Basic Principles of Economics Dr. Mahmoud Arafa
http://scholar.cu.edu.eg/mahmoudarafaPage: [email protected]: -E
quantity supplied. As price rises, the quantity supplied rises; as price falls, the quantity
supplied falls. This relationship is called the law of supply. A supply schedule tells us
that, other things equal, firms will produce and offer for sale more of their product at a
high price than at a low price. This, again, is basically common sense. Price is an
obstacle from the standpoint of the consumer, who is on the paying end. The higher the
price, the less the consumer will buy. But the supplier is on the receiving end of the
product’s price. To a supplier, price represents revenue, which serves as an incentive to
produce and sell a product. The higher the price, the greater this incentive and the
greater the quantity supplied.
The Supply Curve:
As with demand, it is convenient to represent individual supply graphically. In Figure
4.2, curve S is the supply curve that corresponds with the price–quantity supplied data
in the accompanying table. The upward slope of the curve reflects the law of supply—
producers offer more of a good, service, or resource for sale as its price rises. The
relationship between price and quantity supplied is positive, or direct.
Table 4.2 An individual producer’s supply schedule of corn.
Figure 4.2 An individual producer’s supply curve of corn.
Because price and quantity supplied are directly related, the supply curve for an
Lecture Note#2 Basic Principles of Economics Dr. Mahmoud Arafa
http://scholar.cu.edu.eg/mahmoudarafaPage: [email protected]: -E
individual producer graphs as an up sloping curve. Other things equal, producers
will offer more of a product for sale as its price rises and less of the product for sale
as its price falls.
Market Supply:
Market supply is derived from individual supply in exactly the same way that market
demand is derived from individual demand. We sum the quantities supplied by each
producer at each price. That is, we obtain the market supply curve by “horizontally
adding” the supply curves of the individual producers.
Determinants of Supply
In constructing a supply curve, we assume that price is the most significant influence on
the quantity supplied of any product. But other factors (the “other things equal”) can
and do affect supply. The supply curve is drawn on the assumption that these other
things are fixed and do not change. If one of them does change, a change in supply will
occur, meaning that the entire supply curve will shift.
The basic determinants of supply are (1) resource prices, (2) technology, (3) taxes and
subsidies, (4) prices of other goods, (5) producer expectations, and (6) the number of
sellers in the market. A change in any one or more of these determinants of supply, or
supply shifters, will move the supply curve for a product either right or left. A shift to the
right, as from S1 to S2 in Figure 2.4, signifies an increase in supply: Producers supply
larger quantities of the product at each possible price. A shift to the left, as from S1 to
S3, indicates a decrease in supply: Producers offer less output at each price.
Changes in Supply
Let’s consider how changes in each of the determinants affect supply. The key idea is
that costs are a major factor underlying supply curves; anything that affects costs (other
than changes in output itself) usually shifts the supply curve.
Resource Prices
The prices of the resources used in the production process help determine the costs of
production incurred by firms. Higher resource prices raise production costs and,
assuming a particular product price, squeeze profits. That reduction in profits reduces
the incentive for firms to supply output at each product price. For example, an increase
in the prices of sand, crushed rock, and Portland cement will increase the cost of
producing concrete and reduce its supply. In contrast, lower resource prices reduce
production costs and increase profits. So when resource prices fall, firms supply greater
output at each product price. For example, a decrease in the price of flat-panel glass will
Lecture Note#2 Basic Principles of Economics Dr. Mahmoud Arafa
http://scholar.cu.edu.eg/mahmoudarafaPage: [email protected]: -E
increase the supply of big-screen television sets.
Technology
Improvements in technology (techniques of production) enable firms to produce units
of output with fewer resources. Because resources are costly, using fewer of them
lowers production costs and increases supply. Example: Technological advances in
producing flat panel computer monitors have greatly reduced their cost. Thus,
manufacturers will now offer more such monitors than previously at the various prices;
the supply of flat panel monitors has increased.
Taxes and Subsidies
Businesses treat most taxes as costs. An increase in sales or property taxes will increase
production costs and reduce supply. In contrast, subsidies are “taxes in reverse.” If the
government subsidizes the production of a good, it in effect lowers the producers’ costs
and increases supply.
Prices of Other Goods
Firms that produce a particular product, say, soccer balls, can sometimes use their plant
and equipment to produce alternative goods, say, basketballs and volleyballs. The
higher prices of these “other goods” may entice soccer ball producers to switch
production to those other goods in order to increase profits. This substitution in
production results in a decline in the supply of soccer balls. Alternatively, when the
prices of basketballs and volleyballs decline relative to the price of soccer balls,
producers of those goods may decide to produce more soccer balls instead, increasing
their supply.
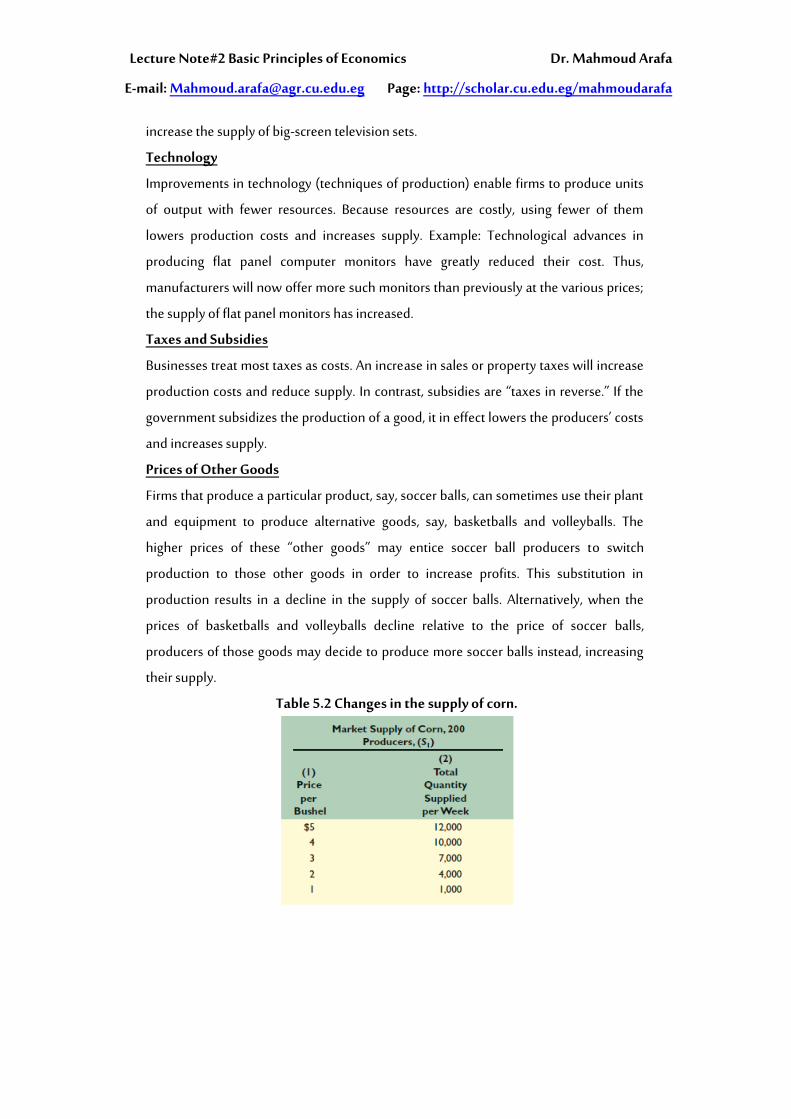
Table 5.2 Changes in the supply of corn.
Lecture Note#2 Basic Principles of Economics Dr. Mahmoud Arafa
http://scholar.cu.edu.eg/mahmoudarafaPage: [email protected]: -E
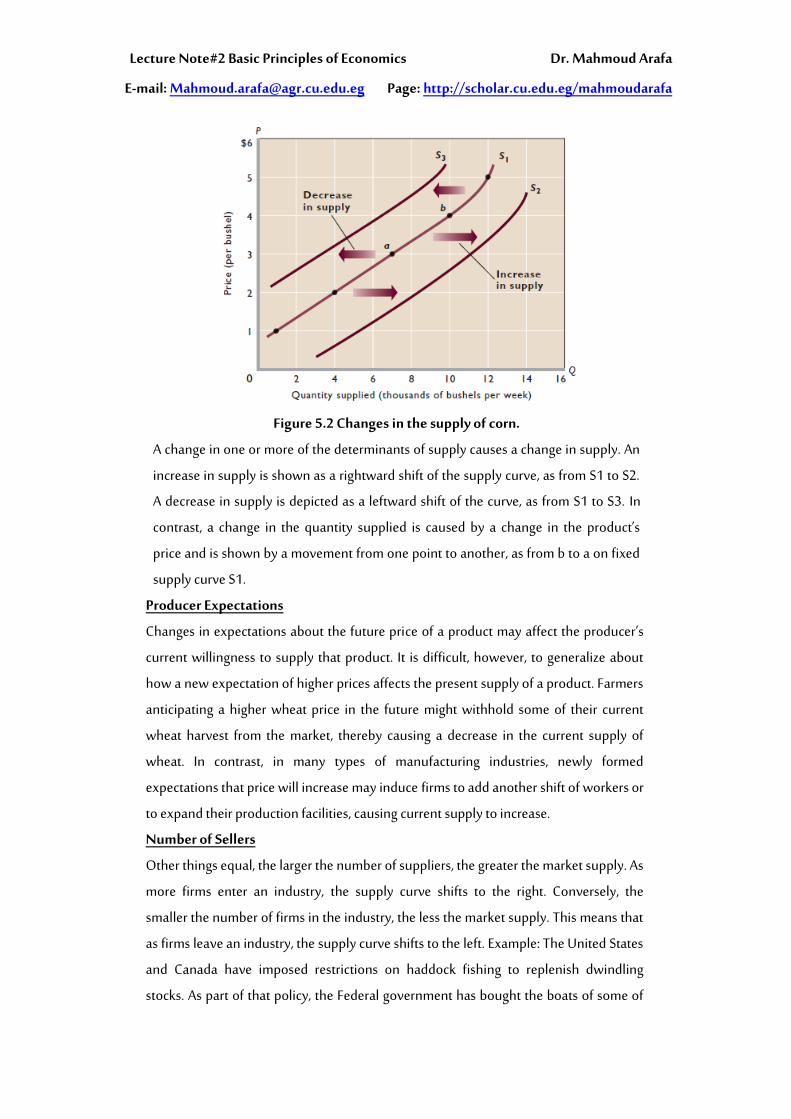
Figure 5.2 Changes in the supply of corn.
A change in one or more of the determinants of supply causes a change in supply. An
increase in supply is shown as a rightward shift of the supply curve, as from S1 to S2.
A decrease in supply is depicted as a leftward shift of the curve, as from S1 to S3. In
contrast, a change in the quantity supplied is caused by a change in the product’s
price and is shown by a movement from one point to another, as from b to a on fixed
supply curve S1.
Producer Expectations
Changes in expectations about the future price of a product may affect the producer’s
current willingness to supply that product. It is difficult, however, to generalize about
how a new expectation of higher prices affects the present supply of a product. Farmers
anticipating a higher wheat price in the future might withhold some of their current
wheat harvest from the market, thereby causing a decrease in the current supply of
wheat. In contrast, in many types of manufacturing industries, newly formed
expectations that price will increase may induce firms to add another shift of workers or
to expand their production facilities, causing current supply to increase.
Number of Sellers
Other things equal, the larger the number of suppliers, the greater the market supply. As
more firms enter an industry, the supply curve shifts to the right. Conversely, the
smaller the number of firms in the industry, the less the market supply. This means that
as firms leave an industry, the supply curve shifts to the left. Example: The United States
and Canada have imposed restrictions on haddock fishing to replenish dwindling
stocks. As part of that policy, the Federal government has bought the boats of some of
Lecture Note#2 Basic Principles of Economics Dr. Mahmoud Arafa
http://scholar.cu.edu.eg/mahmoudarafaPage: [email protected]: -E
the haddock fishers as a way of putting them out of business and decreasing the catch.
The result has been a decline in the market supply of haddock. Table … is a checklist of
the determinants of supply, along with further illustrations.
Changes in Quantity Supplied
The distinction between a change in supply and a change in quantity supplied parallels
the distinction between a change in demand and a change in quantity demanded.
Because supply is a schedule or curve, a change in supply means a change in the
schedule and a shift of the curve. An increase in supply shifts the curve to the right; a
decrease in supply shifts it to the left. The cause of a change in supply is a change in one
or more of the determinants of supply. In contrast, a change in quantity supplied is a
movement from one point to another on a fixed supply curve. The cause of such a
movement is a change in the price of the specific product being considered.
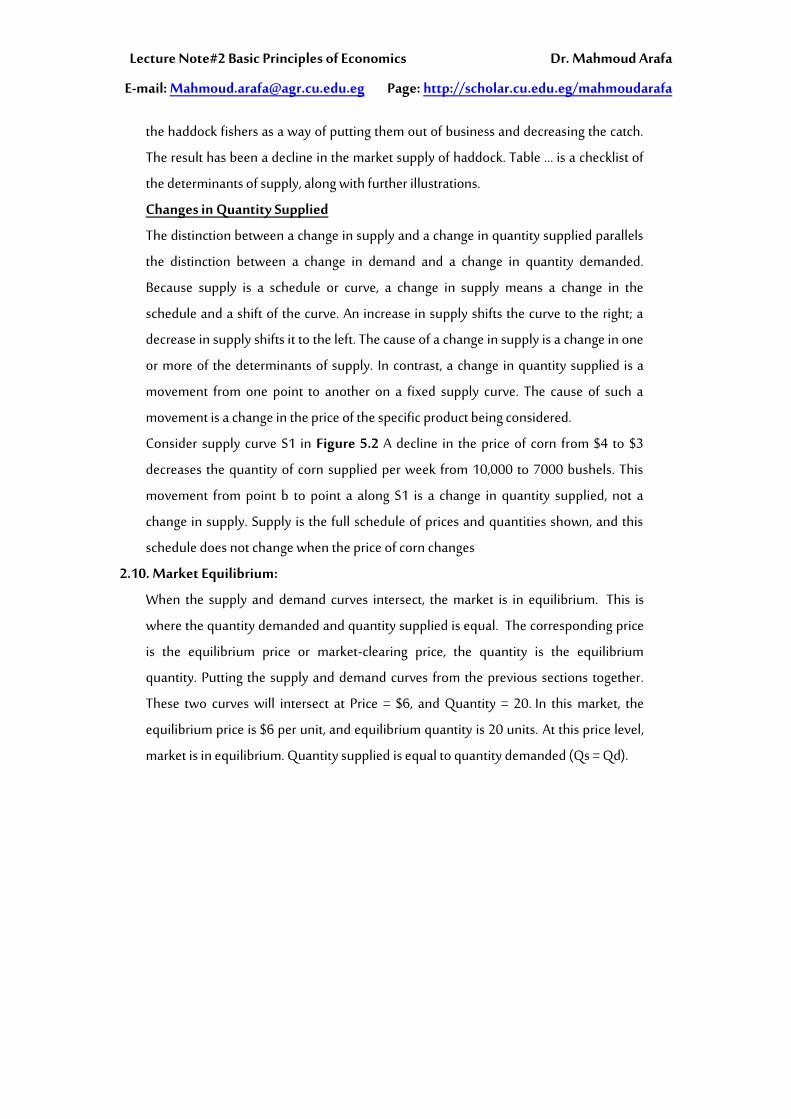
Consider supply curve S1 in Figure 5.2 A decline in the price of corn from $4 to $3
decreases the quantity of corn supplied per week from 10,000 to 7000 bushels. This
movement from point b to point a along S1 is a change in quantity supplied, not a
change in supply. Supply is the full schedule of prices and quantities shown, and this
schedule does not change when the price of corn changes
2.10. Market Equilibrium:
When the supply and demand curves intersect, the market is in equilibrium. This is
where the quantity demanded and quantity supplied is equal. The corresponding price
is the equilibrium price or market-clearing price, the quantity is the equilibrium
quantity. Putting the supply and demand curves from the previous sections together.
These two curves will intersect at Price = $6, and Quantity = 20. In this market, the
equilibrium price is $6 per unit, and equilibrium quantity is 20 units. At this price level,
market is in equilibrium. Quantity supplied is equal to quantity demanded (Qs = Qd).

Lecture Note#2 Basic Principles of Economics Dr. Mahmoud Arafa
http://scholar.cu.edu.eg/mahmoudarafaPage: [email protected]: -E
Changes in Supply, Demand, and Equilibrium
We know that demand might change because of fluctuations in consumer tastes or
incomes, changes in consumer expectations, or variations in the prices of related goods.
Supply might change in response to changes in resource prices, technology, or taxes.
What effects will such changes in supply and demand have on equilibrium price and
quantity?
The increase in demand from D1 to D2 in (a) increases both equilibrium price and
equilibrium quantity. The decrease in demand from D3 to D4 in (b) decreases both
equilibrium price and equilibrium quantity. The increase in supply from S1 to S2 in (c)
decreases equilibrium price and increases equilibrium quantity. The decline in supply
from S3 to S4 in (d) increases equilibrium price and decreases equilibrium quantity. The
boxes in the top right corners summarize the respective changes and outcomes. The
upward arrows in the boxes signify increases in equilibrium price (P) and equilibrium
quantity (Q); the downward arrows signify decreases in these items.
Figure 6.2 Changes in demand and supply and the effects on price and
quantity.

Lecture Note#2 Basic Principles of Economics Dr. Mahmoud Arafa
http://scholar.cu.edu.eg/mahmoudarafaPage: [email protected]: -E
Table 6.2 summarizes these four cases. To understand them fully, you should draw
supply and demand diagrams for each case to confirm the effects listed in this table.
Special cases arise when a decrease in demand and a decrease in supply, or an increase
in demand and an increase in supply, exactly cancel out. In both cases, the net effect on
equilibrium price will be zero; price will not change.
Table 6.2 Effects of Changes in Both Supply and Demand
Change in
Supply
Change in
Demand
Effect on
Equilibrium
Price
Effect on
Equilibrium
Quantity
1 Increase Decrease Decrease Indeterminate
2 Decrease Increase Increase Indeterminate
3 Increase Increase Indeterminate Increase
4 Decrease Decrease Indeterminate Decrease
2.11. Summary:
2.12. Questions and Problems:


![img0cf.b8cdn.com...Principles & Practices of Management Organisational Behaviour & Organisational Culture Principles of Economics Basic Accounting Executive Skills TQM & ISO NOTE 1]](https://img.pdfslide.us/doc/110x75/61489f962918e2056c22cee1/img0cfb8cdncom-principles-practices-of-management-organisational-behaviour.jpg)