Embed Size (px)
Citation preview

8/2/2019 Lecture Chapter 7 Web
http://slidepdf.com/reader/full/lecture-chapter-7-web 1/63
Chapter 7
The Human Population and
the Environmenthttp://www.breathingearth.net/

8/2/2019 Lecture Chapter 7 Web
http://slidepdf.com/reader/full/lecture-chapter-7-web 2/63
• Every second 4 or 5 children are born while only2 people die. There is a net gain of 2.3 personsper second.
• Current world population was 6.8 billion in 2009and growing at 1.4% per year, 7 bill today!
• Global population will double in 61 years ifconditions remain unchanged.
• Ecologists are concerned that overpopulationwill cause environmental degradation that willthreaten the ecological life-support systems onwhich we depend.
Population Growth

8/2/2019 Lecture Chapter 7 Web
http://slidepdf.com/reader/full/lecture-chapter-7-web 3/63
Botkin & KellerEnvironmental Science 5/e
© 2005 John Wiley and Sons Publishers

8/2/2019 Lecture Chapter 7 Web
http://slidepdf.com/reader/full/lecture-chapter-7-web 4/63
Birth
Death Emigration
Immigration/
Population: A group of individuals of the same speciesliving in the same area of interbreeding andsharing genetic information.
Species:All individuals thatare capable ofinterbreeding.
Made up ofpopulations
dynamic

8/2/2019 Lecture Chapter 7 Web
http://slidepdf.com/reader/full/lecture-chapter-7-web 5/63
Population Growth• Economists often disagree with ecologists, arguing
that economic and technological growth will enableus to solve these problems.
• Social justice advocates argue that the root cause
of the problem is inequitable distribution of theEarth’s resources.

8/2/2019 Lecture Chapter 7 Web
http://slidepdf.com/reader/full/lecture-chapter-7-web 6/63
Population Growth is RecentEvent
• Until the invention of agriculture 10,000 years ago,the human population was a few million people.
• Populations were held in check by diseases,
famine and war.• Early societies regulated their population through
cultural taboos, abstinence and infanticide.
• Human population began to increase rapidly after1600 due to agricultural developments, better
sources of power and better hygiene.

8/2/2019 Lecture Chapter 7 Web
http://slidepdf.com/reader/full/lecture-chapter-7-web 7/63
A Brief History of Human Population
Growth1. Hunters and gatherers
• The world’s population was probably less than a few million
2. Early, pre-industrial agriculture• Allowed a much greater density of people
• The first major increase in human population
3. Machine age• Industrial revolution led to rapid increase in human population
4. The Modern era• Rate of population increase has slowed in wealthy nations but
continues to increase rapidly in poorer, less developed
nations.
8/2/2019 Lecture Chapter 7 Web
http://slidepdf.com/reader/full/lecture-chapter-7-web 8/63

8/2/2019 Lecture Chapter 7 Web
http://slidepdf.com/reader/full/lecture-chapter-7-web 9/63
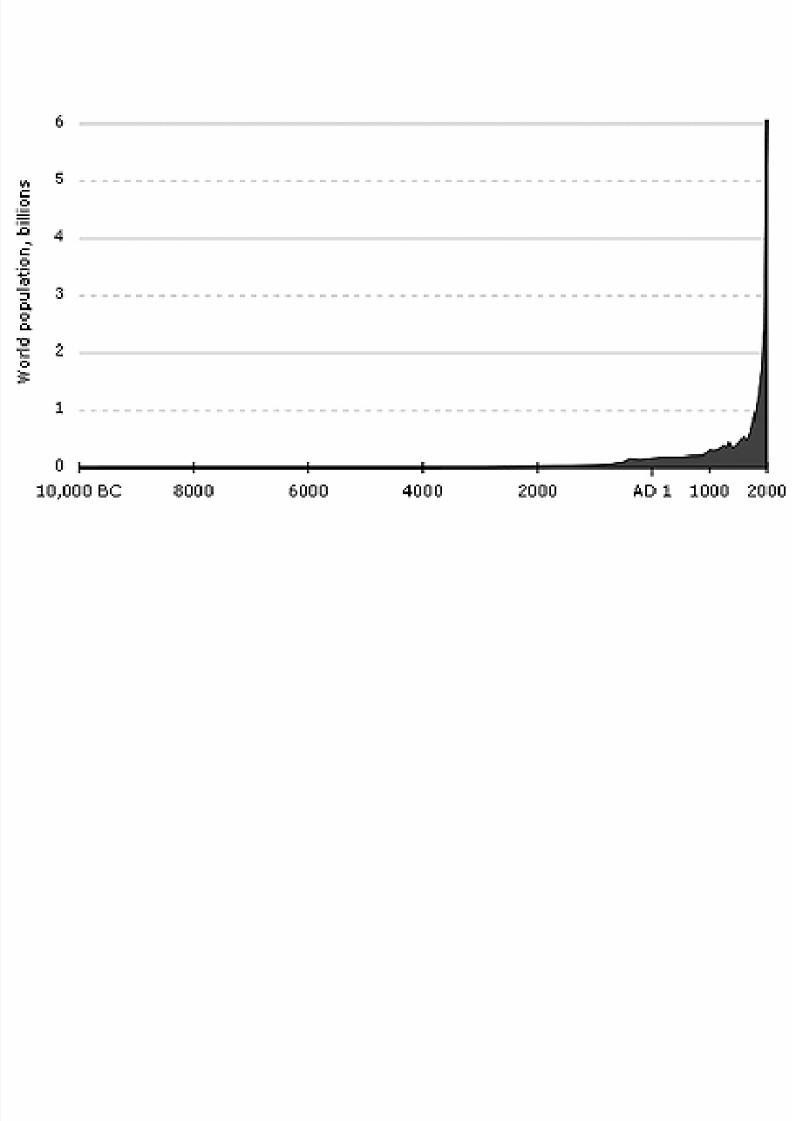
Exponential Growth
• It took thousands of years to reach 1 billion people (in1804).
• It took 150 years to double that to 3 billion (in 1960).
• The most recent billion took only 12 years.• Another way to look at it, is that the Earth’s population
tripled in the twentieth century.
• Will we overshoot the carrying capacity?

8/2/2019 Lecture Chapter 7 Web
http://slidepdf.com/reader/full/lecture-chapter-7-web 10/63
Figure 07_03

8/2/2019 Lecture Chapter 7 Web
http://slidepdf.com/reader/full/lecture-chapter-7-web 11/63

8/2/2019 Lecture Chapter 7 Web
http://slidepdf.com/reader/full/lecture-chapter-7-web 12/63
Slum in Lagos, Nigeria
One room will sleep anaverage of six to 10people. More than 80%rent their rooms fromslum landlords.
Communal latrines areshared by about 15households. Waste waterand excreta goes straightinto the water. So doeskitchen waste, polythenebags. The water stinks.Very occasionally there ispower.

8/2/2019 Lecture Chapter 7 Web
http://slidepdf.com/reader/full/lecture-chapter-7-web 13/63
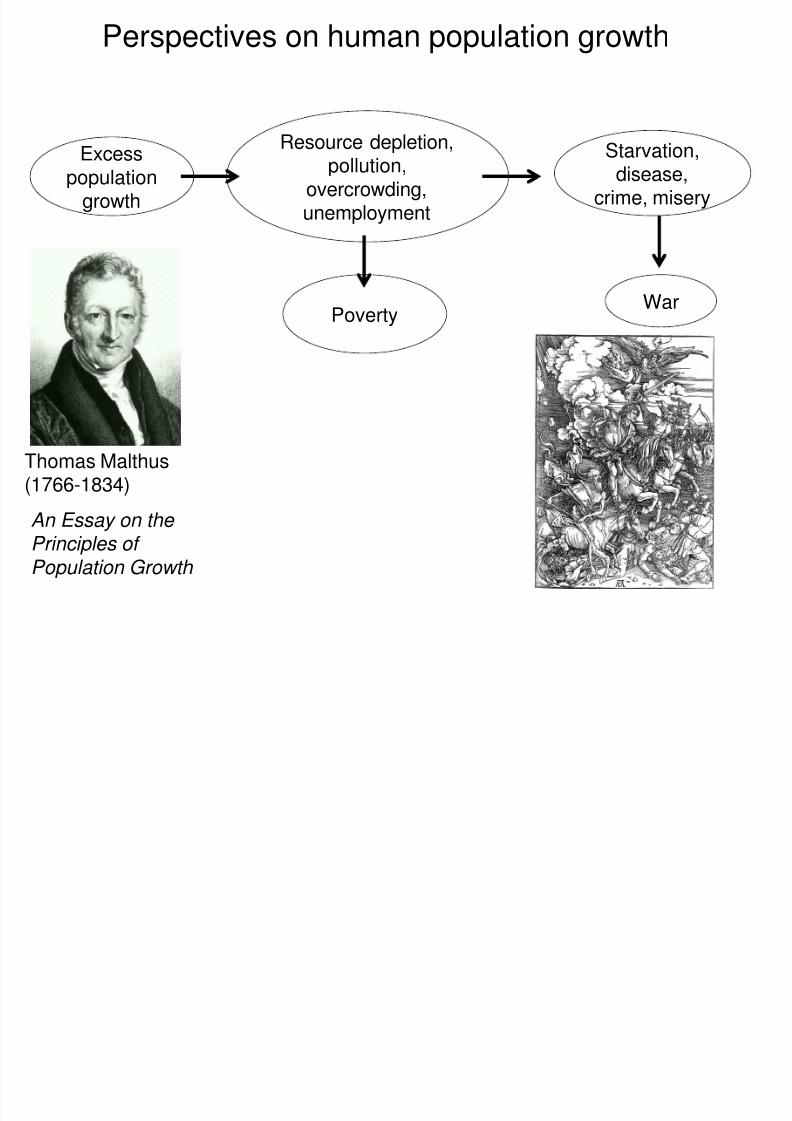
Perspectives on Growth
• Thomas Malthus (1798) wrote An Essay on the Principle of Population in which he showed thathuman populations increase exponentially.
• Population growth is checked by famine, disease,
and cultural factors (e.g. late marriage).• Debate about whether human population growth
causes environmental degradation (Malthus) or
whether human population growth results from poverty and resource depletion (Karl Marx).
• These two viewpoints are still debated today andother opinions are presented also Simon.

8/2/2019 Lecture Chapter 7 Web
http://slidepdf.com/reader/full/lecture-chapter-7-web 14/63
Can More People be Beneficial?• More people mean larger markets, more workers,
and increased efficiency due to mass production.
• Greater numbers also provide more intelligence
and enterprise to overcome problems.
– Economist Julian Simon believes that human
ingenuity will be able to solve the problemsassociated with population growth.
8/2/2019 Lecture Chapter 7 Web
http://slidepdf.com/reader/full/lecture-chapter-7-web 15/63
Perspectives on human population growth
Thomas Malthus(1766-1834)
An Essay on the
Principles of Population Growth
Excesspopulation
growth
Poverty
Resource depletion,pollution,
overcrowding,unemployment
War
Starvation,disease,
crime, misery

8/2/2019 Lecture Chapter 7 Web
http://slidepdf.com/reader/full/lecture-chapter-7-web 16/63
Karl Marx(1818-1883)The Communist Manifesto
Perspectives on human population growth
Excesspopulation
growth
Poverty
Resource depletion,pollution,
overcrowding,unemployment
War
Starvation,disease,
crime, misery
ExploitationOppression

8/2/2019 Lecture Chapter 7 Web
http://slidepdf.com/reader/full/lecture-chapter-7-web 17/63
Perspectives on human population growth
Julian Simon(1932-1998)The Ultimate Resource
Excesspopulation
growth
Larger workforce,more technological
advances.
Improvedconditions,
cleanerenvironment,
cheaperresources.
Largermarkets

8/2/2019 Lecture Chapter 7 Web
http://slidepdf.com/reader/full/lecture-chapter-7-web 18/63
Limiting Factors
1. Short-term factors
• Those that affect a population during the year inwhich they become limiting
2. Intermediate-term factors• Those whose effects are apparent after one year
but before ten years
3. Long-term factors
• Those whose effects are not apparent for ten years
Some factors fit into more than one category

8/2/2019 Lecture Chapter 7 Web
http://slidepdf.com/reader/full/lecture-chapter-7-web 19/63
Technology Can IncreaseCarrying Capacity
• Technology can boost carrying capacity as wemake progress in agriculture, engineering,commerce and medicine. These achievements
make it possible to support many more peopleper unit area.
• However, much of our growth has been basedupon cheap, abundant fossil fuels. Will risingfuel prices constrain food production anddistribution?
8/2/2019 Lecture Chapter 7 Web
http://slidepdf.com/reader/full/lecture-chapter-7-web 20/63
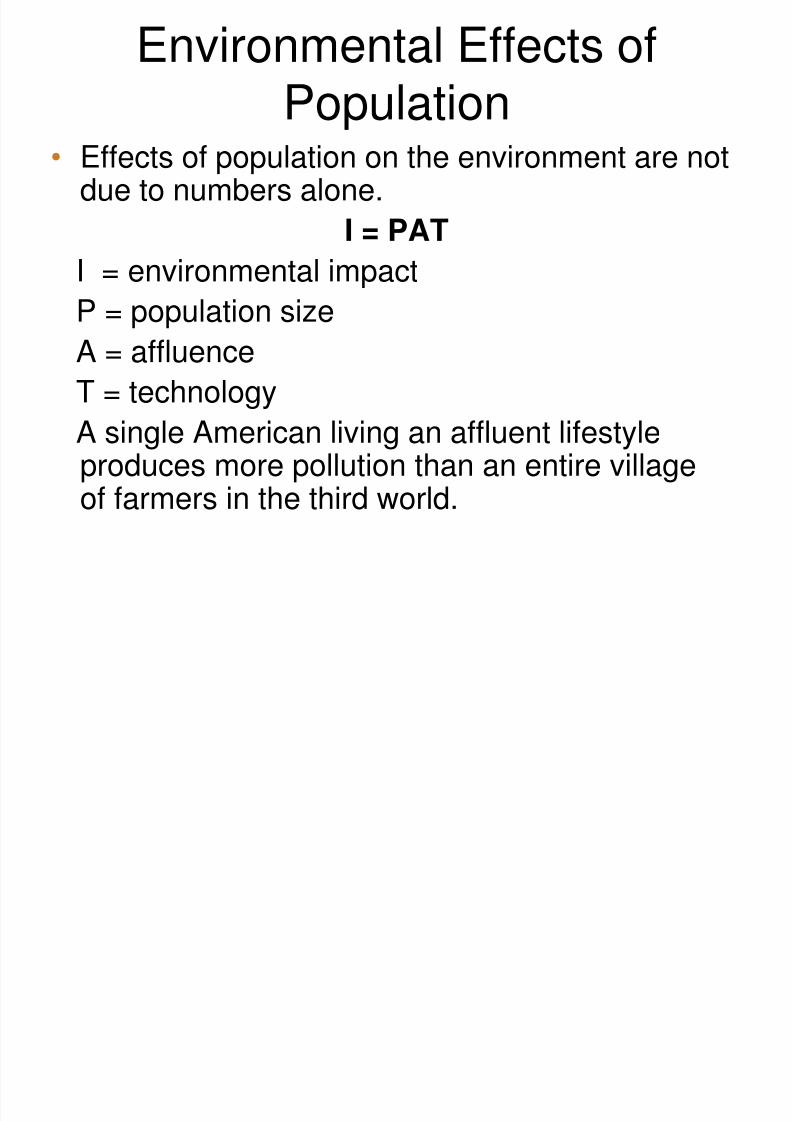
Environmental Effects ofPopulation
• Effects of population on the environment are notdue to numbers alone.
I = PAT
I = environmental impactP = population size
A = affluence
T = technology
A single American living an affluent lifestyleproduces more pollution than an entire villageof farmers in the third world.

8/2/2019 Lecture Chapter 7 Web
http://slidepdf.com/reader/full/lecture-chapter-7-web 21/63
Population and Technology
• The total impact of the human populationon the environment is:
– the average impact of an individual multiplied by
the total number of individuals
T = P x I
T- total impact
P-population size- number of people
I- average environmental impact per person

8/2/2019 Lecture Chapter 7 Web
http://slidepdf.com/reader/full/lecture-chapter-7-web 22/63
Environmental impact is more than just numbers
T = total impact on the environmentP = population sizeI = environmental impact per person
T = P x I
Families in India and the United States display their possessions

8/2/2019 Lecture Chapter 7 Web
http://slidepdf.com/reader/full/lecture-chapter-7-web 23/63
Figure 07_06

8/2/2019 Lecture Chapter 7 Web
http://slidepdf.com/reader/full/lecture-chapter-7-web 24/63
Table 07_02

8/2/2019 Lecture Chapter 7 Web
http://slidepdf.com/reader/full/lecture-chapter-7-web 25/63
Fertility and Birth Rates
• Crude Birth Rate - Number of births in a year perthousand. (Not adjusted for population characteristicssuch as number of women of childbearing age.)
• Total Fertility Rate - number of children born to an
average woman in a population during her life
• Zero Population Growth - Occurs when births plusimmigration in a population equal deaths plusemigration.
• ZPG Is a rate of 2.1 children per couple

8/2/2019 Lecture Chapter 7 Web
http://slidepdf.com/reader/full/lecture-chapter-7-web 26/63
Decline in Fertility Rates Worldwide
• Fertility rates have declined everywhere except Africa.
• Greatest fertility reduction has been in SoutheastAsia.
• China’s one child policy has decreased the fertility
rate from 6 in 1990 to 1.6 in 2009.
– Abortion and forced sterilization
– Infanticide, particularly of girls – May cause social problems
– May result in the gender balance being altered
8/2/2019 Lecture Chapter 7 Web
http://slidepdf.com/reader/full/lecture-chapter-7-web 27/63
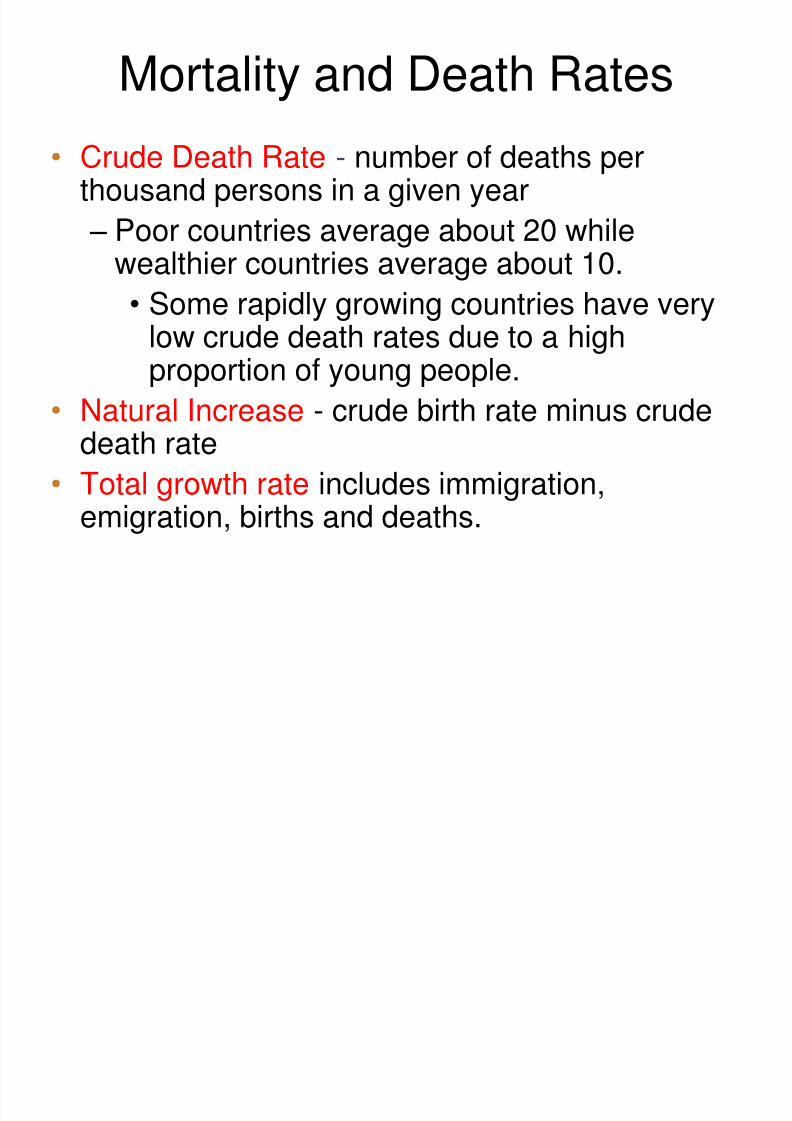
Mortality and Death Rates
• Crude Death Rate - number of deaths perthousand persons in a given year
– Poor countries average about 20 while
wealthier countries average about 10.• Some rapidly growing countries have verylow crude death rates due to a highproportion of young people.
• Natural Increase - crude birth rate minus crudedeath rate
• Total growth rate includes immigration,emigration, births and deaths.

8/2/2019 Lecture Chapter 7 Web
http://slidepdf.com/reader/full/lecture-chapter-7-web 28/63
Life Span and Life Expectancy
• Life Expectancy - average age a newborn can expect to attain in any given society
– Declining mortality is the primary cause of
most population growth in last 300 years. – Worldwide, the average has risen from 30 to65 over the past century.
• Greatest progress has been in developing
countries – Longer life expectancy is not due to medicine
only, but rather improved nutrition, sanitation,and education.

8/2/2019 Lecture Chapter 7 Web
http://slidepdf.com/reader/full/lecture-chapter-7-web 29/63
Graph of Life Expectancy At Birth
poor countries in Africa, like Swaziland and Botswana have theworld’s shortest life spans averaging only about 33 years.

8/2/2019 Lecture Chapter 7 Web
http://slidepdf.com/reader/full/lecture-chapter-7-web 30/63
Living Longer has Implications
– Both rapidly and slowly growing countries canhave a problem with dependency ratio.
• The number of non-working compared toworking individuals in a population.
• In the U.S., fewer working age people willhave to support many more retired people,and this is a problem for the Social Securitysystem.
• Similar problems are developing in othercountries around the world causing countriesto rethink their population policies.

8/2/2019 Lecture Chapter 7 Web
http://slidepdf.com/reader/full/lecture-chapter-7-web 31/63

8/2/2019 Lecture Chapter 7 Web
http://slidepdf.com/reader/full/lecture-chapter-7-web 32/63
Age Structure
• Population age structure:
– The proportion of the population in each ageclass
– Affects current and future birth rates, deathrates and growth rates
– Has an impact on the environment
– Has complications for current and futuresocial and economic status.

8/2/2019 Lecture Chapter 7 Web
http://slidepdf.com/reader/full/lecture-chapter-7-web 33/63
Age structure
Mexico
Pre-reproductive
Reproductive
Post-reproductive
x-axis can also represent % population
•Relatively highdeath rate
•High birth rate

8/2/2019 Lecture Chapter 7 Web
http://slidepdf.com/reader/full/lecture-chapter-7-web 34/63
Mexico Mexico
How would you calculate total population size from these age-structure diagrams?(Hint: it would be very tedious)
Did Mexico’s population increase or decrease between 1980 and 2005?
Did overall death rates increase or decrease between 1980 and 2005?
Age structure
Age structure diagram for a country that has just gotten out of ~10 years of a high-

8/2/2019 Lecture Chapter 7 Web
http://slidepdf.com/reader/full/lecture-chapter-7-web 35/63
Population sizeHigh Low High
Male Female80+
75-80
70-75
65-70
60-65
55-6050-55
45-40
40-4535-40
30-35
25-30
20-25
15-20
10-15
5-10
0-5
Population sizeHigh Low High
Male Female80+
75-80
70-75
65-70
60-65
55-6050-55
45-40
40-4535-40
30-35
25-30
20-25
15-20
10-15
5-10
0-5
Current + 10 years
g g y j g y gcasualty war. Assume that both men & women fight in the armed services. Prior to thearmed conflict, this country had good health care, low mortality rates, and high birthrates. Draw the age structure for the country 10 years in the future, assume that the warends.
Low birth ratesbecauseindividuals in thereproductive ageclass are also
soldiers
High death rate ofindividuals in thereproductive ageclass(casualties of war)
Gradualdecliningpopulation sizein the elderly
population
Birth rates still lowbecause reproductiveclass is still small
Large cohortmoving through

8/2/2019 Lecture Chapter 7 Web
http://slidepdf.com/reader/full/lecture-chapter-7-web 36/63
Forecasting Population Change
• Formula to represent population change:
P 2 = P 1 + (B – D ) + (I – E )
• P2-population size today or tomorrow• (If today, think 20 years before today etc; or you can predict change
that will happen in 10 years from today)
• P1-population size at a previous or future point
• B-birth rate
• D-death rate
• I-immigration
• E-emigration
G=GR=(b-d)/(P2-P1)
8/2/2019 Lecture Chapter 7 Web
http://slidepdf.com/reader/full/lecture-chapter-7-web 37/63

8/2/2019 Lecture Chapter 7 Web
http://slidepdf.com/reader/full/lecture-chapter-7-web 38/63
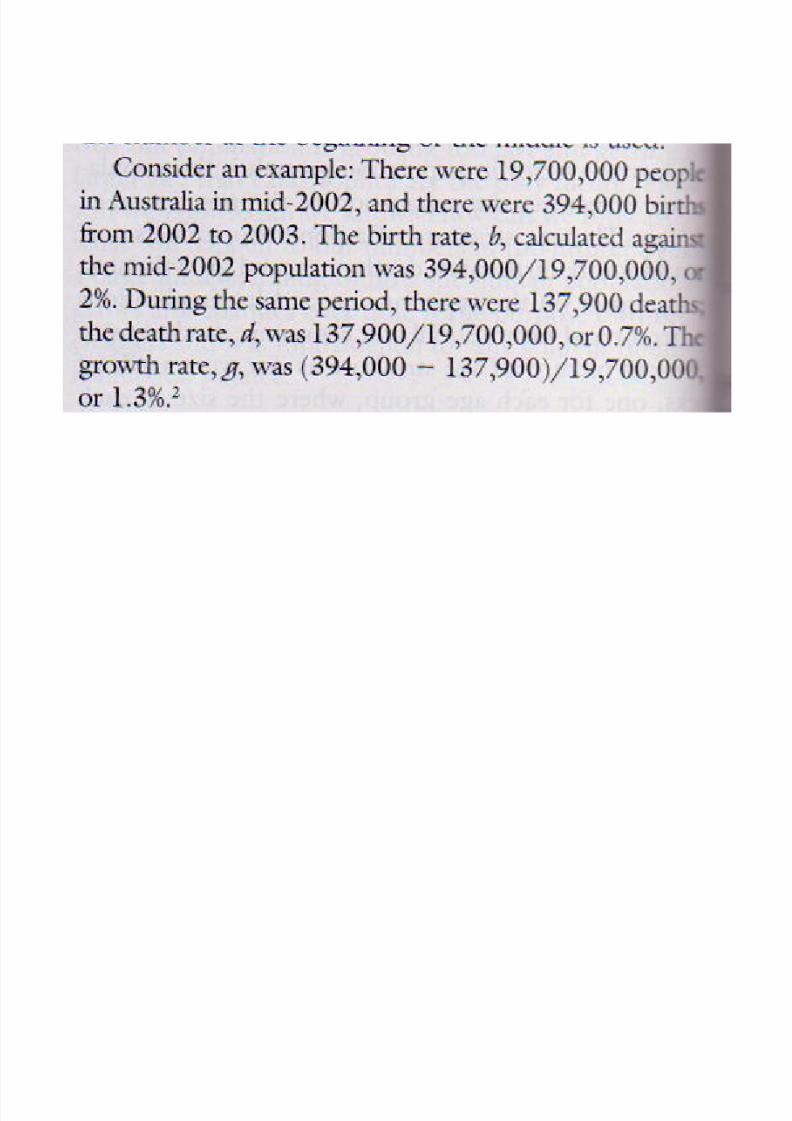
Population growth calculation
P 2 = P 1 + (B – D ) + (I – E ) orP 2 = P 1 + (B – D ) + 0 or
((births –deaths)/population number)*100 to give us
percentageAustralia• (394,000-137,900)/19,700,000)*100=0.013*100=13%Bulgaria
• (73,978-113,438)/7,700,000)*100=• =(-0.005120)*100=-0.51%

8/2/2019 Lecture Chapter 7 Web
http://slidepdf.com/reader/full/lecture-chapter-7-web 39/63
The Demographic Transition
• Demographic transition: – Three-stage pattern of change in birth rates and
death rates.
– Occurred during the process of industrial and
economic development of Western nations. – Leads to a decline in population growth.
Stage I: Decline in death rate
Stage II: High growth rate
Stage III: Birth rate drops toward the death rate,leading to low or zero growth rate.
D hi T i i

8/2/2019 Lecture Chapter 7 Web
http://slidepdf.com/reader/full/lecture-chapter-7-web 40/63
Demographic TransitionContinued
• In a mature industrial economy, birth rates beginto fall as people see that most of their childrensurvive. (Stage III)
– Populations continue to grow due topopulation momentum.
• Developed Countries - Transition is completeand both death and birth rates are low andpopulation is in equilibrium. (Stage IV)
Demographic Transition

8/2/2019 Lecture Chapter 7 Web
http://slidepdf.com/reader/full/lecture-chapter-7-web 41/63
Demographic Transition

8/2/2019 Lecture Chapter 7 Web
http://slidepdf.com/reader/full/lecture-chapter-7-web 42/63
Demographic Transition
• Pattern of falling death rates and birth rates dueto improved living conditions accompanyingeconomic development.
– Pre-Modern Society - Poor conditions keepdeath rates high; birth rates arecorrespondingly high. (Stage I)
– Economic Development brings better
standard of living thus death rates fall. Birthrates stay constant or even rise. (Stage II)
D hi T iti

8/2/2019 Lecture Chapter 7 Web
http://slidepdf.com/reader/full/lecture-chapter-7-web 43/63
Demographic TransitionHappening Now?
• Four conditions necessary for demographictransition:
– improved standard of living
– confidence that children will survive – improved status of women
– birth control
• Some demographers think that a demographictransition is taking place now in developingnations.

8/2/2019 Lecture Chapter 7 Web
http://slidepdf.com/reader/full/lecture-chapter-7-web 44/63
Emigration and Immigration
• Emigration and immigration play a large role inhuman population dynamics.
– Developed regions expect 2 million
immigrants a year for next 50 years. – Immigration is a controversial issue. “Guest
workers” often perform dangerous or
disagreeable work, while being paid low
wages with few rights.
– Locals complain immigrants take away jobsand overload social services.

8/2/2019 Lecture Chapter 7 Web
http://slidepdf.com/reader/full/lecture-chapter-7-web 45/63
Ideal Family Size• Social, cultural and economic factors affect
family size.
• Pronatalist Pressures
– Factors that increase the desire for children
• Source of pleasure, pride, comfort
• Source of support for elderly parents
• Current source of family income and labor
• Social status• Replace members in society as they die

8/2/2019 Lecture Chapter 7 Web
http://slidepdf.com/reader/full/lecture-chapter-7-web 46/63
Pronatalist Pressure Continued – Society’s need to replace its members may be
codified into cultural or religious values.
• Families with few children are pitied.
• Controlling fertility may be taboo.
• In some cultures, boys are valued morethan girls because they carry on the familyname and often are expected to financiallysupport parents in old age.
• Couples may have more children than theyreally want in order to have a boy.
• Having a large family in some cultures is asource of male pride.

8/2/2019 Lecture Chapter 7 Web
http://slidepdf.com/reader/full/lecture-chapter-7-web 47/63
Birth Reduction Pressures
• Higher education and personal freedom forwomen often result in decisions to limitchildbearing.
– When women have more opportunities toearn a salary, they are less likely to havemany children.
– Education and socioeconomic status are
usually inversely related to fertility in wealthiercountries.

8/2/2019 Lecture Chapter 7 Web
http://slidepdf.com/reader/full/lecture-chapter-7-web 48/63
A Century of US Birth Rates
8/2/2019 Lecture Chapter 7 Web
http://slidepdf.com/reader/full/lecture-chapter-7-web 49/63
Could We Have a Birth Dearth?
• Most European countries, as well as Asia,Japan, Singapore and Taiwan, are experiencingnegative growth rates.
– There are concerns in all these countriesabout a lack of young people to be soldiers,workers, and taxpayers.
• One reason that birth rates may have dropped in
developed countries is that toxins and endocrinedisrupters that are pollutants interfere withsperm production. Sperm numbers and qualityhave fallen by half in the last 50 years.

8/2/2019 Lecture Chapter 7 Web
http://slidepdf.com/reader/full/lecture-chapter-7-web 50/63
Social Justice
• Still other demographers believe that in order forthe demographic transition model to work,resources must be distributed more equitably.
– They believe that the world has enoughnatural resources, but inequitable social andeconomic systems cause maldistribution.
– Many rich countries, when they were colonialpowers, extracted the wealth from countriesthat were their colonies. Some of the world’spoorest countries had rich resources andadequate food supplies before they wereimpoverished by colonialism.
8/2/2019 Lecture Chapter 7 Web
http://slidepdf.com/reader/full/lecture-chapter-7-web 51/63
Other Rights
• We should consider the rights of other species.
– Perhaps, rather than asking what is themaximum number of people that Earth can
hold, we should instead ask what is theoptimum number of people at which we canprovide a fair and decent life for all humanswhile causing the minimum impact on other
species.

8/2/2019 Lecture Chapter 7 Web
http://slidepdf.com/reader/full/lecture-chapter-7-web 52/63
Future of Human Populations
• Most demographers believe the world populationwill stabilize sometime during the next century.
– Projections of maximum population size
• Low - 7 billion by 2050, then fall to 6 billionby 2150
• Medium - 8.9 billion by 2050 then stabilize
• High - continue to grow to 25 billion by
2150• High unmet need for family planning. Women in
poorer nations often desire family planning but
do not have access to it.

8/2/2019 Lecture Chapter 7 Web
http://slidepdf.com/reader/full/lecture-chapter-7-web 53/63
© 2008 John Wiley and Sons Publishers
Which curve representsexponential growth?
Logistic growth?
What is ‘K’ (carrying capacity) in
the future that represents a logisticgrowth model?
Give an example of something thatcould happen to reduce K for thehuman population:
Increase K:
H C W A hi

8/2/2019 Lecture Chapter 7 Web
http://slidepdf.com/reader/full/lecture-chapter-7-web 54/63
How Can We AchieveZero Population Growth?
• Delay the age of first childbearing by women
• Birth control
– Biological and Social
• Breast-feeding, which can delay resumption of ovulation• Abstinence
• Induction of sterility with natural agents
• Contraceptive devices
– National Programs to Reduce Birth Rates• Formal family planning programs to
– problems arising from rapid population growth
– benefits to individuals of reduced population growth.

8/2/2019 Lecture Chapter 7 Web
http://slidepdf.com/reader/full/lecture-chapter-7-web 55/63
Family Planning• Current Methods
– Avoidance of sex during fertile periods
– Mechanical barriers preventing contact betweensperm and egg
– Surgical prevention of sperm or egg release – Chemical prevention of sperm or egg maturation,
release, or implantation
– Physical barriers to implantation – Abortion
Family Planning

8/2/2019 Lecture Chapter 7 Web
http://slidepdf.com/reader/full/lecture-chapter-7-web 56/63
Family Planning
• Family Planning - allows couples to determinethe number and spacing of their children
• Birth Control - any method used to reduce births – Traditional Methods
• Long breast-feeding (suppresses
ovulation), taboos against intercourse whilebreast-feeding, celibacy, folk medicines,abortion, infanticide
F t th t C li t F il

8/2/2019 Lecture Chapter 7 Web
http://slidepdf.com/reader/full/lecture-chapter-7-web 57/63
Factors that Complicate Family
Planning
• Some religions forbid birth control or encourage couplesto have as many children as possible.
• Often, societal changes must first take place beforefamily planning programs will be successful.
– Improved education and economic status for women
– Improved status for children
– Increased sense of social responsibility
– Financial and political stability – Effective and acceptable birth control methods
Birth Control Methods

8/2/2019 Lecture Chapter 7 Web
http://slidepdf.com/reader/full/lecture-chapter-7-web 58/63
Birth Control Methods

8/2/2019 Lecture Chapter 7 Web
http://slidepdf.com/reader/full/lecture-chapter-7-web 59/63
Women’s Rights and Fertility
• Education and job opportunities for womenreduce fertility rates.
• When child mortality is high, parents tend to
have high numbers of children to ensure that atleast some survive. Improving child survivalwould reduce the number of births.
• Land reform, political rights, job opportunities for
women, and improved health for womentranslate into better survival for children andtherefore lower fertility.
The Human Population the Quality of

8/2/2019 Lecture Chapter 7 Web
http://slidepdf.com/reader/full/lecture-chapter-7-web 60/63
The Human Population, the Quality ofLife, and the Human Carrying Capacity
• Human carrying capacity
– The number of people that can live on Earth at thesame time?
– To determine:
1. Extrapolate from past growth
2. The “Packing Problem” approach
– Considers how many people might be packed onto Earth,not taking into sufficient account the need for lands and
oceans to provide food, water, energy, constructionmaterials, and scenic beauty and the need to maintainbiological diversity
Human Death Rates and

8/2/2019 Lecture Chapter 7 Web
http://slidepdf.com/reader/full/lecture-chapter-7-web 61/63
Human Death Rates andthe Rise of Industrial Societies
Acute or epidemic disease
Appears rapidly in the population,
Affects a comparatively large percentage of it,
Declines then almost disappears, only to reappearlater
Chronic disease
Is always present in a population
Typically occurs in a relatively small but relativelyconstant presentation of the population
Examples include heart disease, cancer, and stroke

8/2/2019 Lecture Chapter 7 Web
http://slidepdf.com/reader/full/lecture-chapter-7-web 62/63
© 2005 John Wiley and Sons Publishers
Longevity and its Effect on

8/2/2019 Lecture Chapter 7 Web
http://slidepdf.com/reader/full/lecture-chapter-7-web 63/63
Longevity and its Effect on
Population Growth
• Maximum lifetime:
– The genetically determined maximumpossible age to which an individual of a
species can live• Life expectancy:
– The average number of years an individual
can expect to live given the individual’spresent age