Embed Size (px)
Citation preview

1
Estimating AbundanceReading: Chapter 10
– Survey design– Visual censuses– Acoustic methods– Trawl surveys– Depletion estimates– Mark-recapture estimates– Egg Production Methods– Fishery-dependent CPUE
Estimating AbundanceWhy do we need to estimate abundance?
To estimate:1. Stock size2. Recruitment3. Mortality4. Spatial distribution
Estimating AbundanceSurvey design
– A central problem is obtaining an abundance index that is proportional to stock size
– Well-designed survey should provide estimates of:• average fish abundance or density and • Spatial distribution (survey boundaries?)
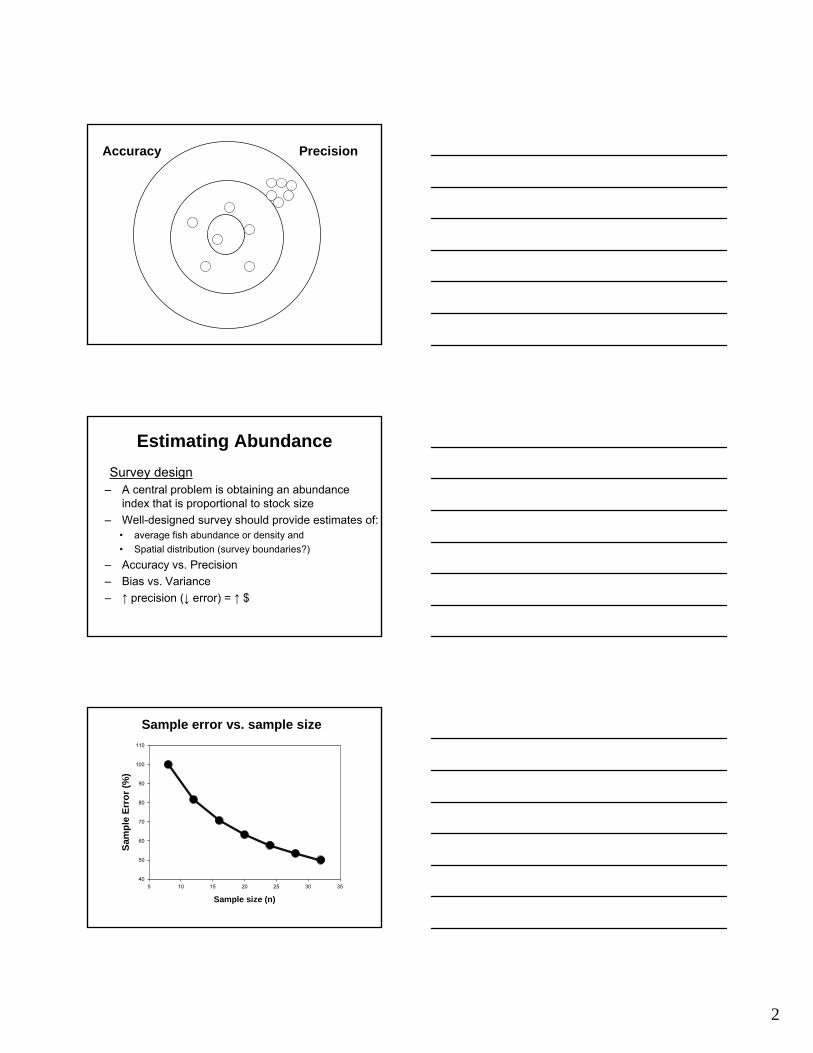
– Accuracy vs. Precision
2
Accuracy Precision
Estimating AbundanceSurvey design
– A central problem is obtaining an abundance index that is proportional to stock size
– Well-designed survey should provide estimates of:• average fish abundance or density and • Spatial distribution (survey boundaries?)
– Accuracy vs. Precision– Bias vs. Variance– ↑ precision (↓ error) = ↑ $
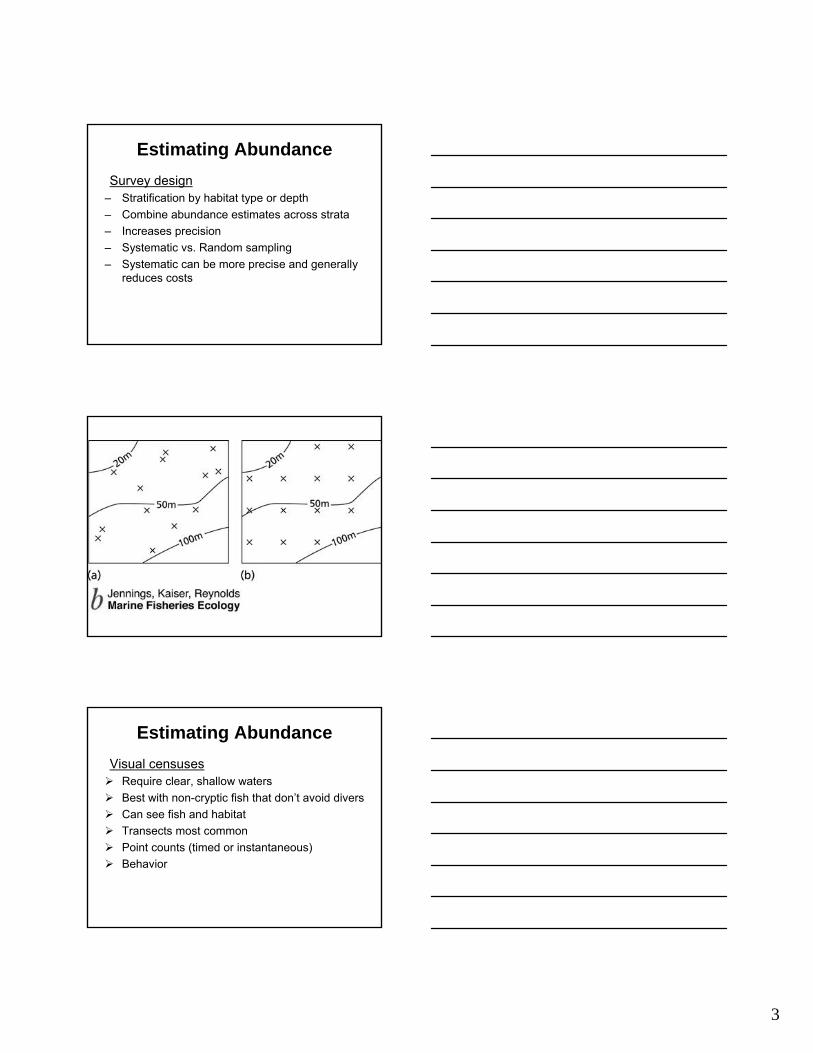
Sample size (n)5 10 15 20 25 30 35
Sam
ple
Erro
r (%
)
40
50
60
70
80
90
100
110
Sample error vs. sample size
3
Estimating AbundanceSurvey design
– Stratification by habitat type or depth– Combine abundance estimates across strata– Increases precision– Systematic vs. Random sampling– Systematic can be more precise and generally
reduces costs
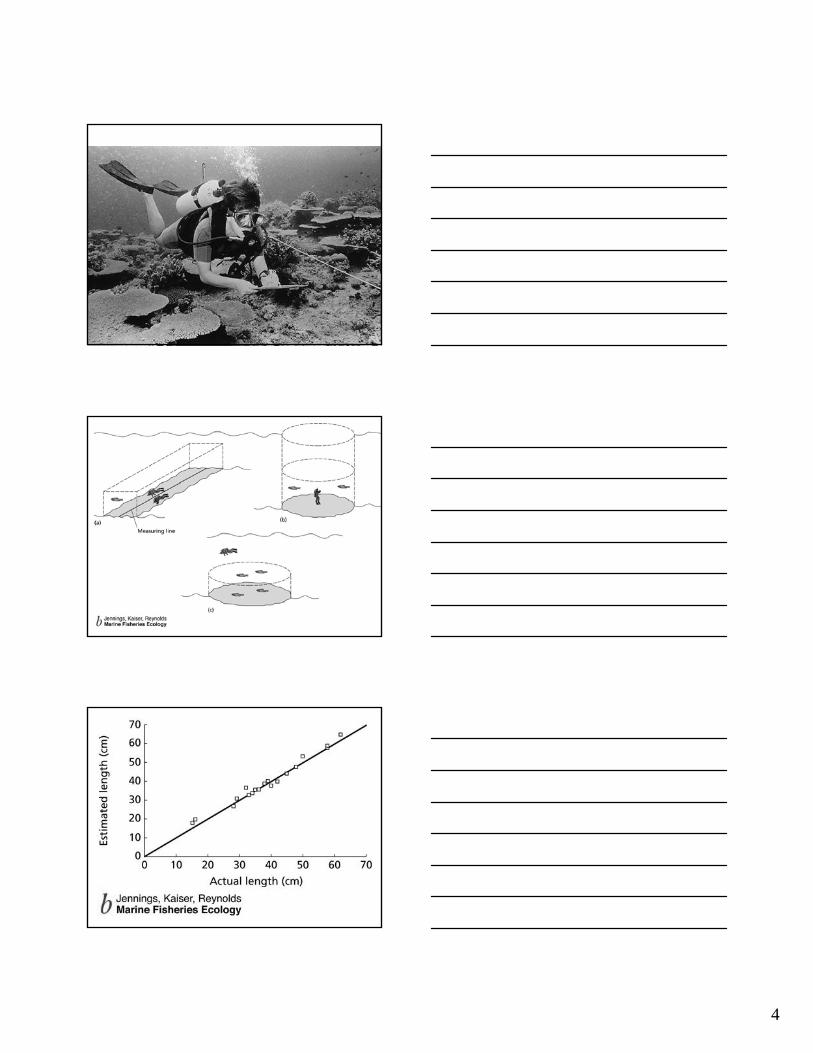
Estimating AbundanceVisual censuses
Require clear, shallow watersBest with non-cryptic fish that don’t avoid diversCan see fish and habitatTransects most commonPoint counts (timed or instantaneous)Behavior
4
5
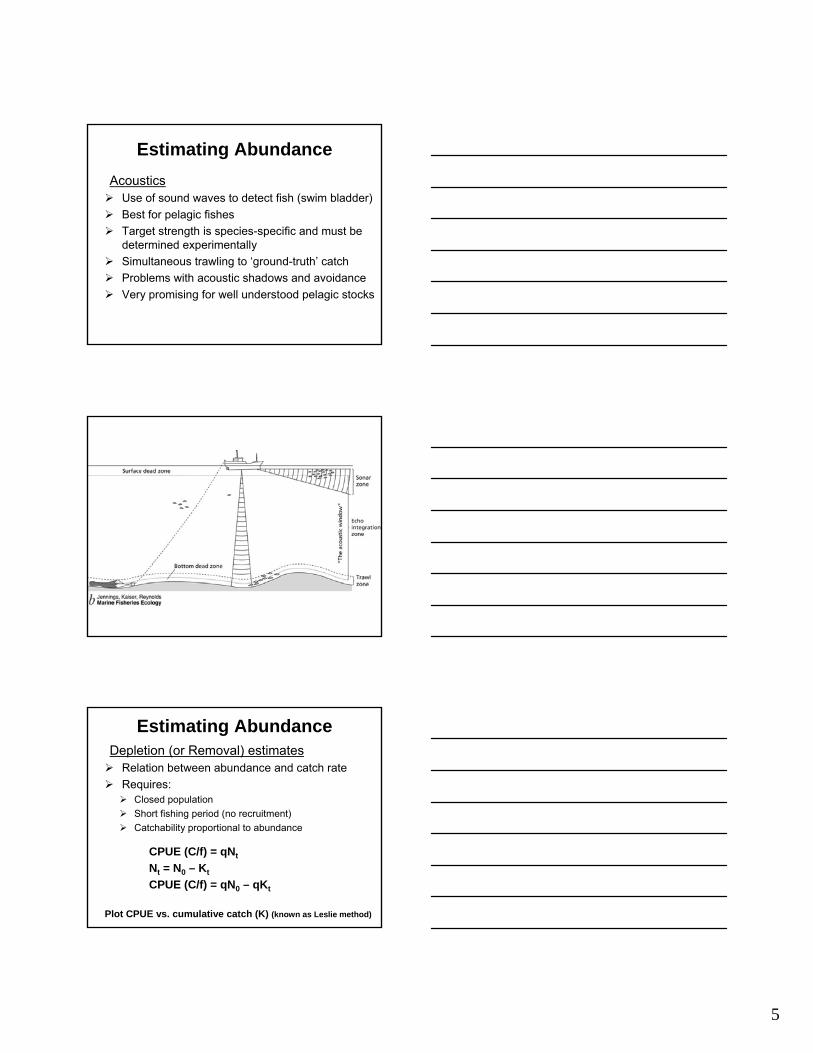
Estimating AbundanceAcoustics
Use of sound waves to detect fish (swim bladder)Best for pelagic fishesTarget strength is species-specific and must be determined experimentallySimultaneous trawling to ‘ground-truth’ catchProblems with acoustic shadows and avoidanceVery promising for well understood pelagic stocks
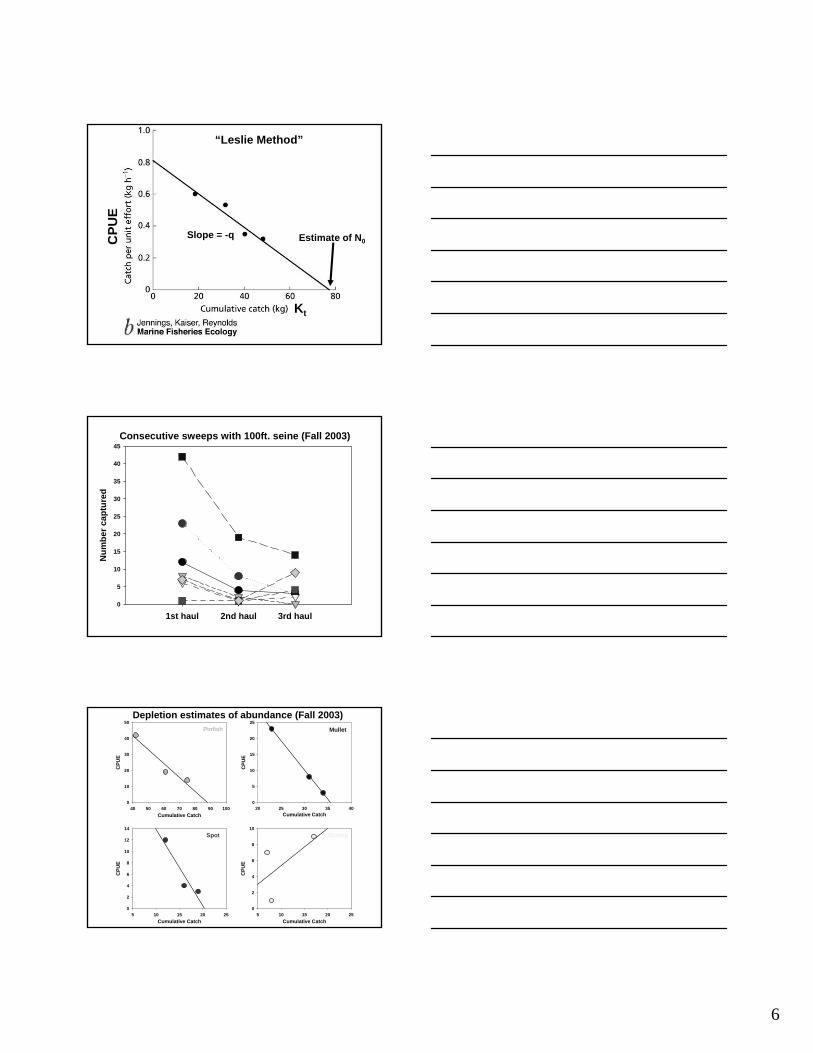
Estimating AbundanceDepletion (or Removal) estimates
Relation between abundance and catch rateRequires:
Closed populationShort fishing period (no recruitment)Catchability proportional to abundance
CPUE (C/f) = qNt
Nt = N0 – Kt
CPUE (C/f) = qN0 – qKt
Plot CPUE vs. cumulative catch (K) (known as Leslie method)
6
Kt
CPU
E
“Leslie Method”
Estimate of N0Slope = -q
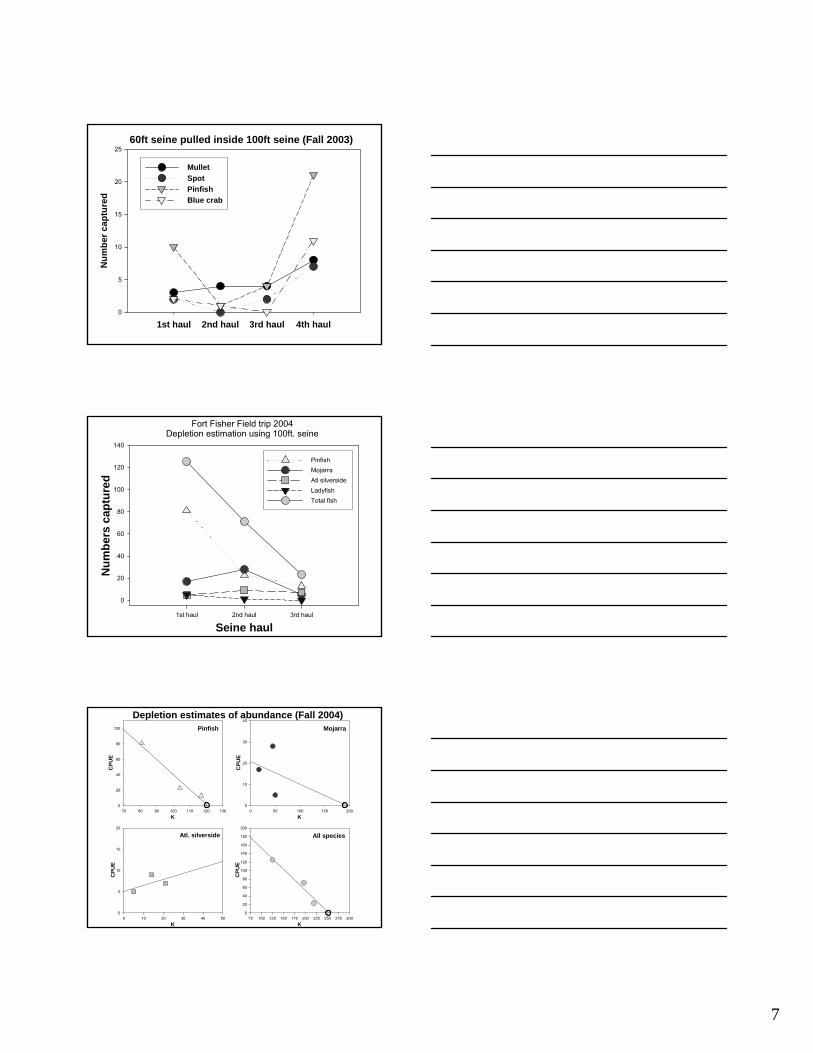
Consecutive sweeps with 100ft. seine (Fall 2003)
1st haul 2nd haul 3rd haul
Num
ber c
aptu
red
0
5
10
15
20
25
30
35
40
45
Pinfish
Cumulative Catch40 50 60 70 80 90 100
CPU
E
0
10
20
30
40
50
Mullet
Cumulative Catch20 25 30 35 40
CPU
E
0
5
10
15
20
25
Spot
Cumulative Catch5 10 15 20 25
CPU
E
0
2
4
6
8
10
12
14Shrimp
Cumulative Catch5 10 15 20 25
CPU
E
0
2
4
6
8
10
Depletion estimates of abundance (Fall 2003)
7
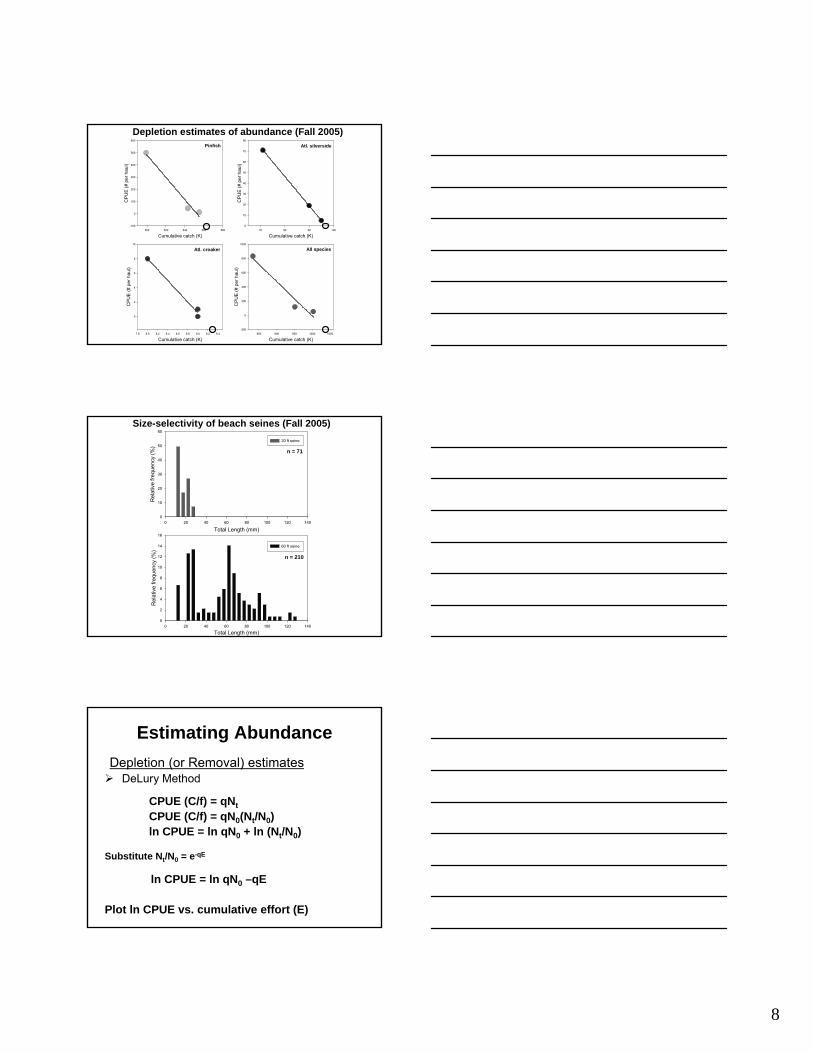
60ft seine pulled inside 100ft seine (Fall 2003)
1st haul 2nd haul 3rd haul 4th haul
Num
ber c
aptu
red
0
5
10
15
20
25
MulletSpotPinfishBlue crab
Fort Fisher Field trip 2004Depletion estimation using 100ft. seine
Seine haul1st haul 2nd haul 3rd haul
Num
bers
cap
ture
d
0
20
40
60
80
100
120
140
Pinfish Mojarra Atl silverside Ladyfish Total fish
Pinfish
K70 80 90 100 110 120 130
CPU
E
0
20
40
60
80
100
All species
K75 100 125 150 175 200 225 250 275 300
CPU
E
0
20
40
60
80
100
120
140
160
180
200
Mojarra
K0 50 100 150 200
CPU
E
0
10
20
30
40
Atl. silverside
K0 10 20 30 40 50
CPU
E
0
5
10
15
20
Depletion estimates of abundance (Fall 2004)
8
Pinfish
Cumulative catch (K)500 520 540 560 580
CP
UE
(# p
er h
aul)
-100
0
100
200
300
400
500
600
Atl. silverside
Cumulative catch (K)70 80 90 100
CP
UE
(# p
er h
aul)
0
10
20
30
40
50
60
70
80
Atl. croaker
Cumulative catch (K)7.8 8.0 8.2 8.4 8.6 8.8 9.0 9.2 9.4
CP
UE
(# p
er h
aul)
0
2
4
6
8
10
All species
Cumulative catch (K)850 900 950 1000 1050
CP
UE
(# p
er h
aul)
-200
0
200
400
600
800
1000
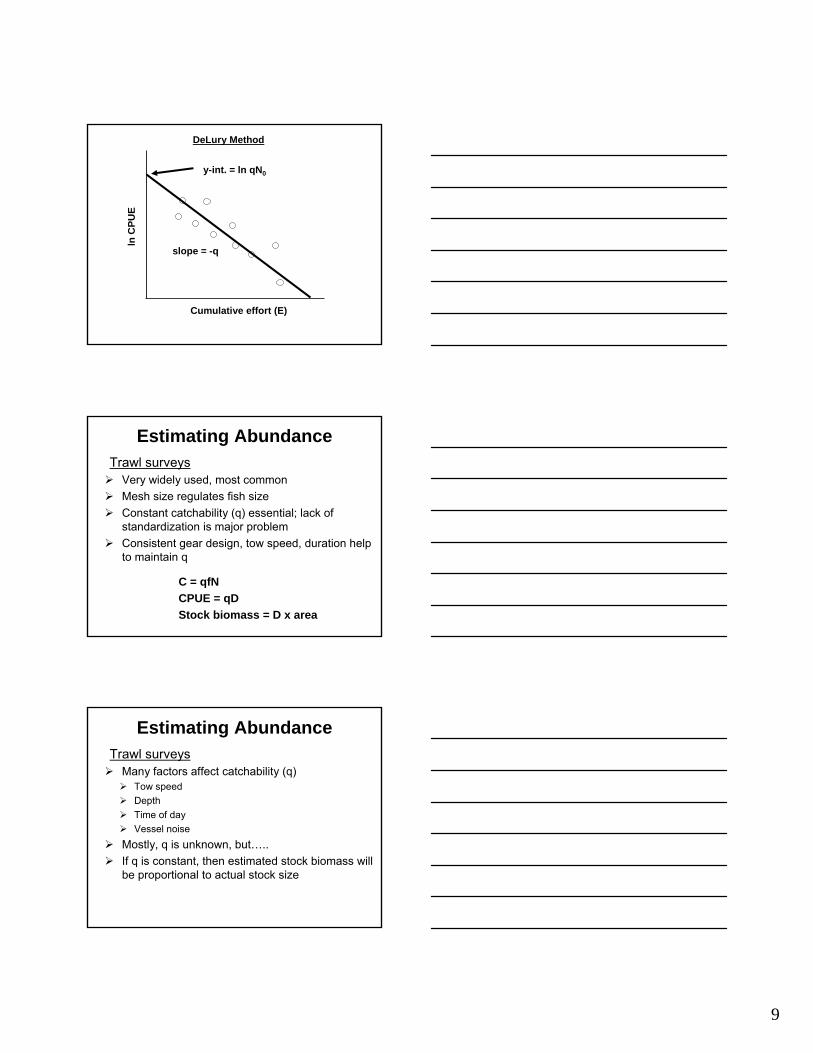
Depletion estimates of abundance (Fall 2005)
Total Length (mm)0 20 40 60 80 100 120 140
Rel
ativ
e fre
quen
cy (%
)
0
10
20
30
40
50
60
20 ft seine
Total Length (mm)0 20 40 60 80 100 120 140
Rel
ativ
e fre
quen
cy (%
)
0
2
4
6
8
10
12
14
16
60 ft seine
n = 71
n = 210
Size-selectivity of beach seines (Fall 2005)
Estimating AbundanceDepletion (or Removal) estimates
DeLury Method
CPUE (C/f) = qNtCPUE (C/f) = qN0(Nt/N0)ln CPUE = ln qN0 + ln (Nt/N0)
Substitute Nt/N0 = e-qE
ln CPUE = ln qN0 –qE
Plot ln CPUE vs. cumulative effort (E)
9
Cumulative effort (E)
lnC
PUE
DeLury Method
slope = -q
y-int. = ln qN0
Estimating AbundanceTrawl surveys
Very widely used, most commonMesh size regulates fish sizeConstant catchability (q) essential; lack of standardization is major problemConsistent gear design, tow speed, duration help to maintain q
C = qfNCPUE = qDStock biomass = D x area
Estimating AbundanceTrawl surveys
Many factors affect catchability (q)Tow speedDepthTime of dayVessel noise
Mostly, q is unknown, but…..If q is constant, then estimated stock biomass will be proportional to actual stock size
10
Estimating AbundanceMark-recapture methods
Successful in terrestrial and freshwater systemsCan also provide growth and movement dataAssume:
Tagged fish mix randomly with untagged fishCatchability equalNo tag loss or mortality due to taggingRelatively closed population
T/N = R/Cso, N = TC/R
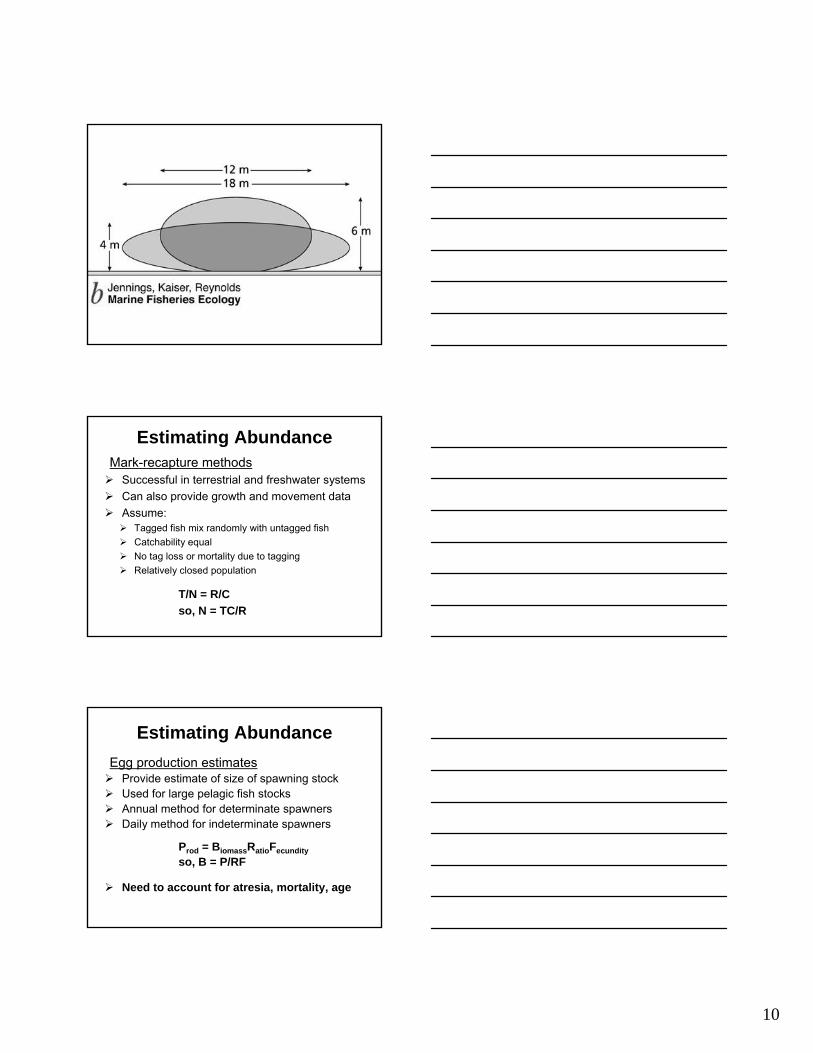
Estimating AbundanceEgg production estimates
Provide estimate of size of spawning stockUsed for large pelagic fish stocksAnnual method for determinate spawnersDaily method for indeterminate spawners
Prod = BiomassRatioFecundityso, B = P/RF
Need to account for atresia, mortality, age
11
Surveys
Annual method
Daily method
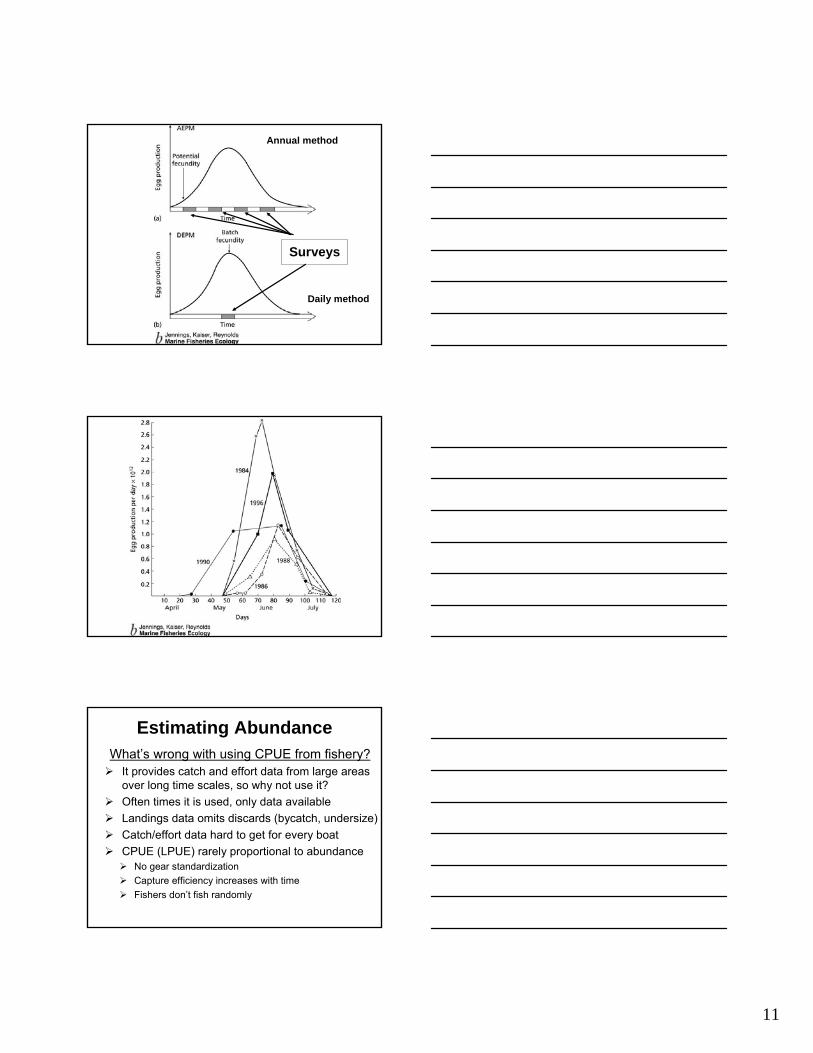
Estimating AbundanceWhat’s wrong with using CPUE from fishery?
It provides catch and effort data from large areas over long time scales, so why not use it?Often times it is used, only data availableLandings data omits discards (bycatch, undersize)Catch/effort data hard to get for every boatCPUE (LPUE) rarely proportional to abundance
No gear standardizationCapture efficiency increases with timeFishers don’t fish randomly
12
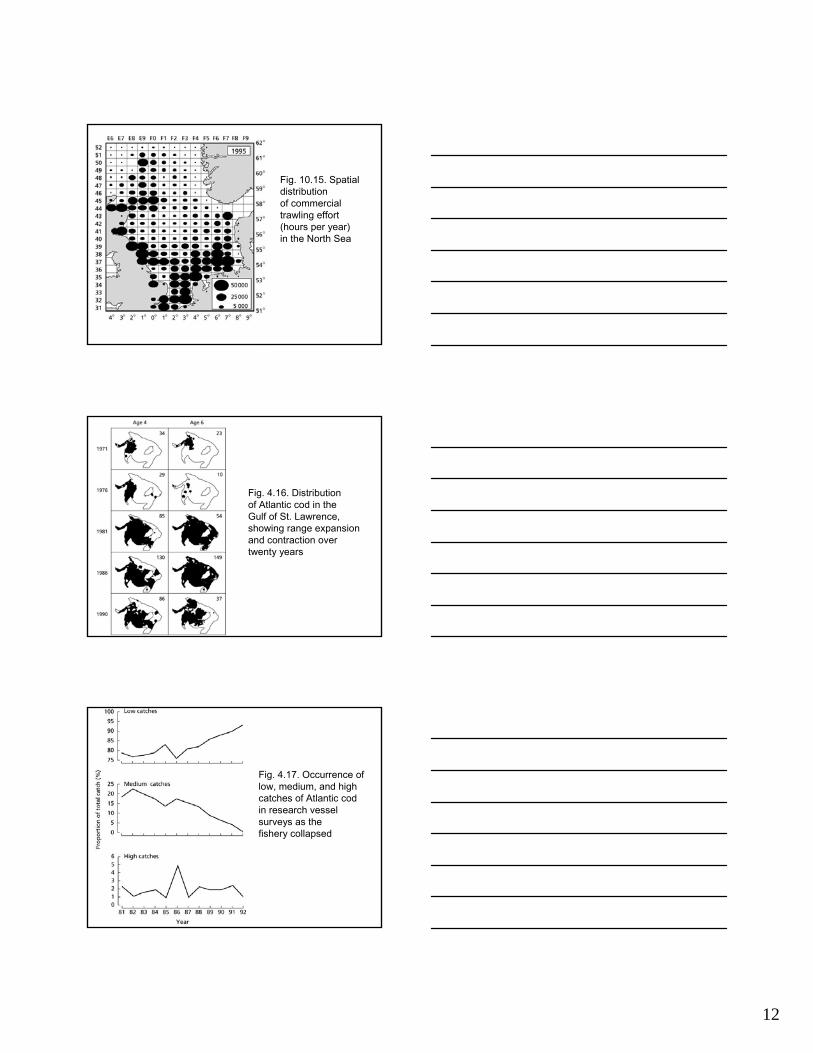
Fig. 10.15. Spatial distributionof commercial trawling effort (hours per year) in the North Sea
Fig. 4.16. Distributionof Atlantic cod in theGulf of St. Lawrence, showing range expansionand contraction over twenty years
Fig. 4.17. Occurrence oflow, medium, and high catches of Atlantic cod in research vesselsurveys as thefishery collapsed
13
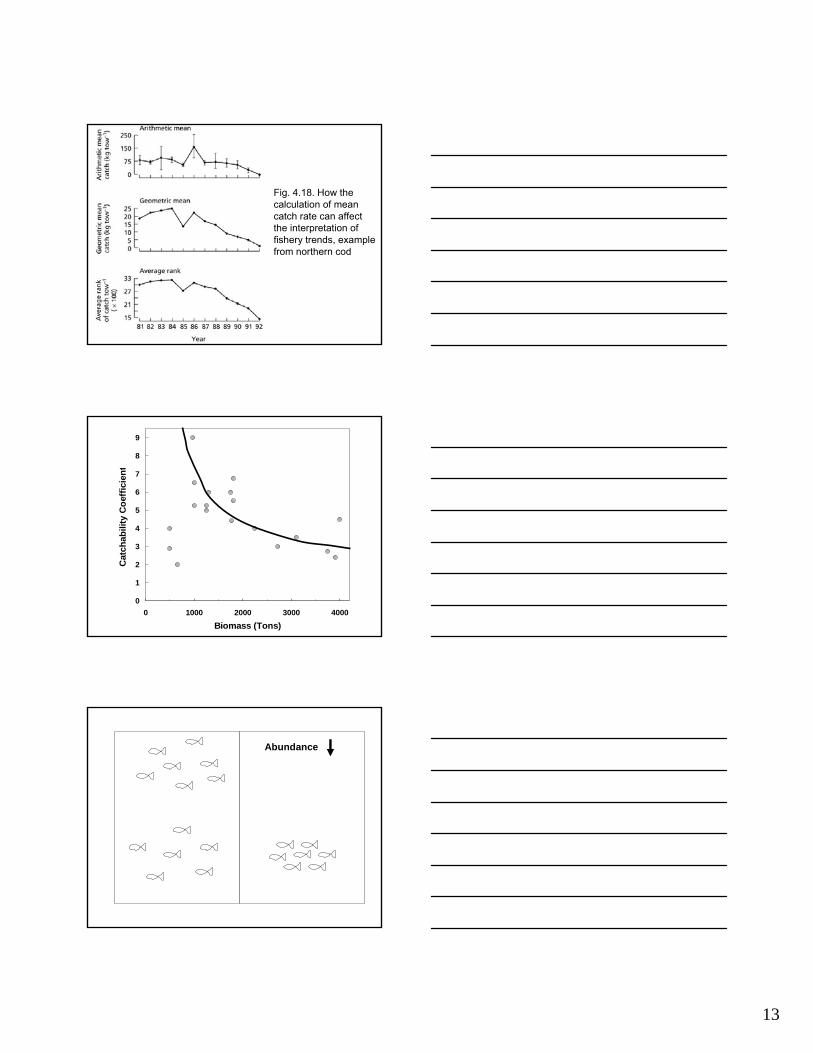
Fig. 4.18. How the calculation of meancatch rate can affectthe interpretation offishery trends, examplefrom northern cod
0
1
2
3
4
5
6
7
8
9
0 1000 2000 3000 4000
Biomass (Tons)
Cat
chab
ility
Coe
ffici
ent
Abundance
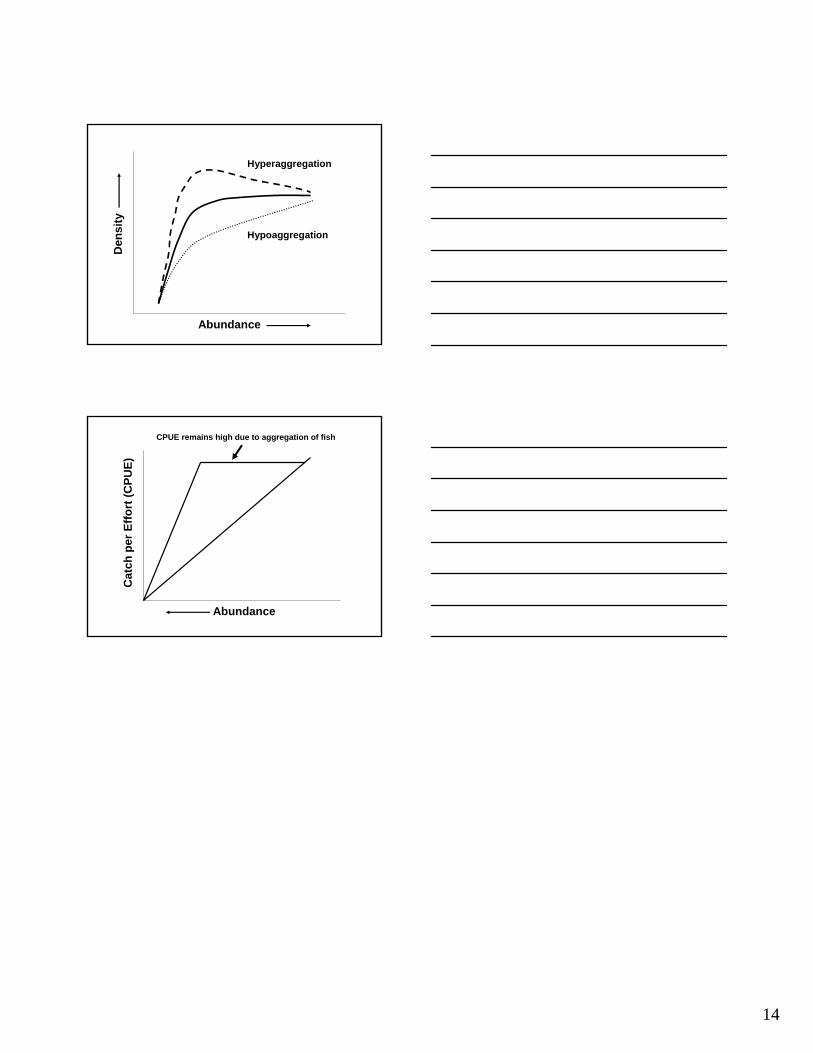
14
Hypoaggregation
Hyperaggregation
Abundance
Den
sity
Abundance
Cat
ch p
er E
ffort
(CPU
E)
CPUE remains high due to aggregation of fish