Embed Size (px)
Citation preview

Lecture 7: Reporting inequalities II
Health inequality monitoring: with a special focus on low- and
middle-income countries
Health inequality monitoring: with a special focus on low- and
middle-income countries
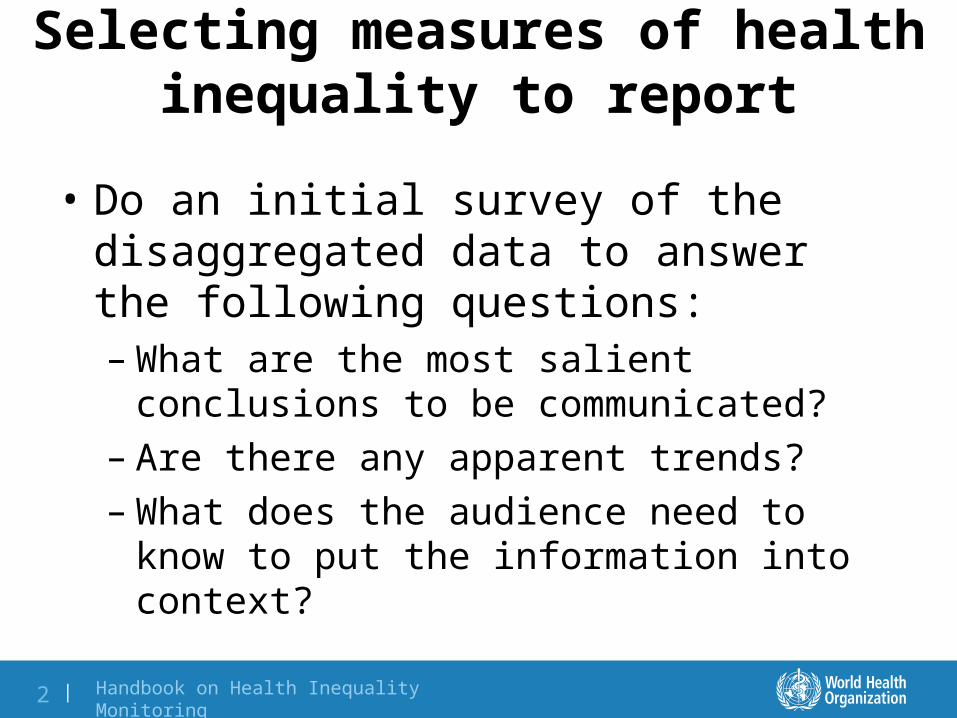
Selecting measures of health inequality to report
• Do an initial survey of the disaggregated data to answer the following questions:– What are the most salient conclusions to be
communicated? – Are there any apparent trends?– What does the audience need to know to put the
information into context?
Handbook on Health Inequality Monitoring 2 |
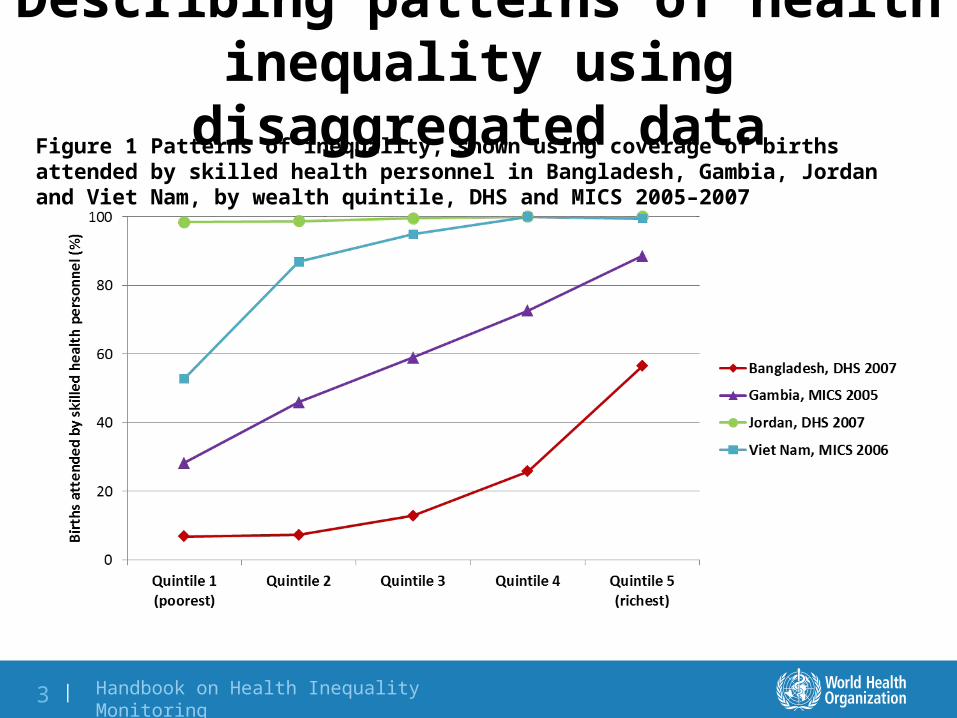
Describing patterns of health inequality using disaggregated data
Figure 1 Patterns of inequality, shown using coverage of births attended by skilled health personnel in Bangladesh, Gambia, Jordan and Viet Nam, by wealth quintile, DHS and MICS 2005–2007
Handbook on Health Inequality Monitoring 3 |

Types of interventions to address different shapes of inequality
• Mass deprivation– Whole-population approach: resources are invested
in all (or most) subgroups• Marginal exclusion– Targeted approach: resources are targeted to the
most disadvantaged subgroup(s)• Queuing pattern– Combination of whole-population and targeted
approaches• Complete coverage– No further interventions needed; ongoing monitoring
may be warranted
EXTRA
INFO
RMATIO
N
Handbook on Health Inequality Monitoring 4 |

Reporting simple or complex measures
• Inequality can usually be effectively shown using only difference and ratio measures – Represent absolute and relative inequality– Straightforward and easy to understand
• However, it is important to consider which measures will best represent the conclusions that are evident from the data– Do difference and ratio tell the whole story?
Handbook on Health Inequality Monitoring 5 |

Applied example: reporting simple or complex measures
Figure 2 Coverage of selected maternal health service indicators in the Philippines, by wealth quintile, DHS 2008
Handbook on Health Inequality Monitoring 6 |
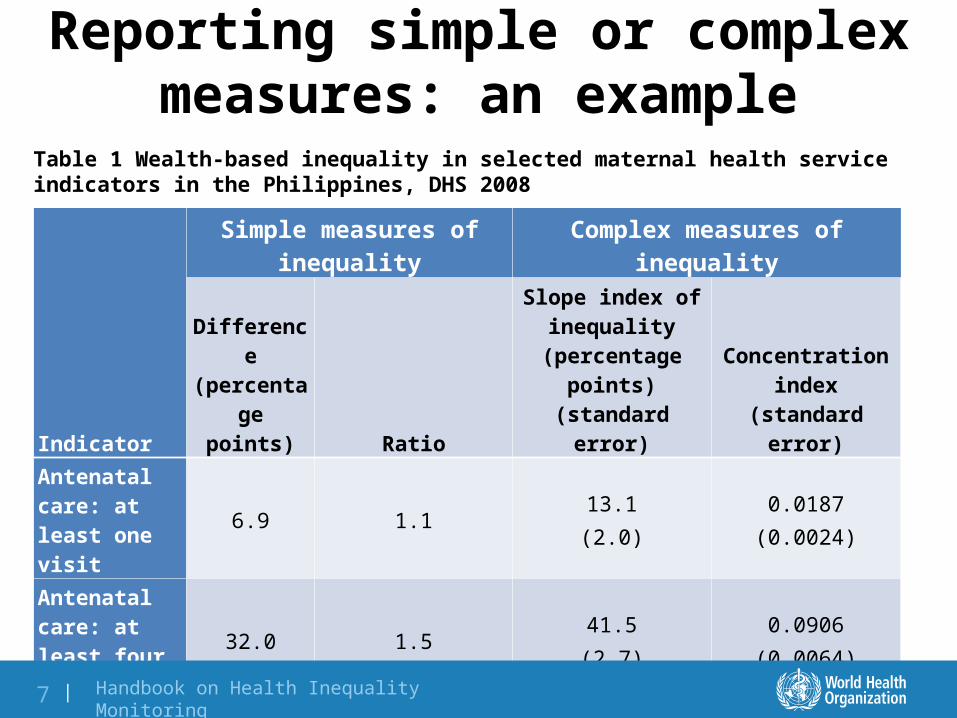
Reporting simple or complex measures: an example
Indicator
Simple measures of inequality Complex measures of inequality
Difference (percentage
points) Ratio
Slope index of inequality
(percentage points) (standard error)
Concentration index (standard error)
Antenatal care: at least one visit
6.9 1.113.1
(2.0)
0.0187
(0.0024)
Antenatal care: at least four visits
32.0 1.541.5
(2.7)
0.0906
(0.0064)
Births attended by skilled health personnel
68.7 3.779.2
(1.8)
0.2283
(0.0084)
Table 1 Wealth-based inequality in selected maternal health service indicators in the Philippines, DHS 2008
Handbook on Health Inequality Monitoring 7 |

Reporting absolute and relative inequality• Absolute and relative inequality should be reported
together as complementary measures of inequality• Relative measures are unit-less– Useful when making comparisons between indicators with
different units• Absolute measures retain the same unit as the health
indicator– For example, under-five mortality rates in Colombia:
• Absolute difference between males and females is 4.6 deaths per 1000 live births
• Rates in males is 19.3 deaths per 1000 live births• Rates in females in 23.8 deaths per 1000 live births• The rate is about 25% higher for males than females!
Handbook on Health Inequality Monitoring 8 |

Reporting absolute and relative inequality: an example
IndicatorSurvey
yearQuintile 1 (poorest) Quintile 2 Quintile 3 Quintile 4
Quintile 5 (richest) Difference Ratio
Antenatal care: at least one visit (%)
1998 77.0 87.4 92.4 95.0 98.0 21.0 1.3
2008 92.5 93.2 96.1 97.7 99.1 6.6 1.1
Family planning needs satisfied (%)
1998 25.2 30.6 35.6 47.2 57.3 32.1 2.3
2008 28.2 32.2 35.6 45.4 56.5 28.4 2.0
Infant mortality rate (deaths per 1000 live births)
1998 71.3 63.1 80.7 54.4 21.3 50.0 3.3
2008 59.7 45.0 70.5 44.3 46.3 13.5 1.3
Stunting among children under five (%)
1998 39.7 34.7 33.1 20.5 16.3 23.4 2.4
2008 33.4 34.2 28.0 20.9 14.3 19.2 2.3
Table 2 Wealth-based inequality in selected reproductive, maternal and child health indicators in Ghana, DHS 1998 and 2008
Handbook on Health Inequality Monitoring 9 |

Selecting reference groups according to health indicator types
Indicator
Quintile 1 (poorest)
(%)Quintile 2
(%)Quintile 3
(%)Quintile 4
(%)
Quintile 5 (richest)
(%)
Difference (percentage
points) Ratio
Stunting among children under five
59.9 54.4 48.8 40.8 25.6
Scenario 1: reference group is quintile 1 (poorest) –34.3 0.4Scenario 2: reference group is quintile 5 (richest) 34.3 2.3
Full immunization coverage among 1-year-olds
24.4 33.3 47.1 55.5 71.0
Scenario 1: reference group is quintile 1 (poorest) 46.6 2.9Scenario 2: reference group is quintile 5 (richest) –46.6 0.3
Table 3 Wealth-based inequality in selected health indicators in India, DHS 2005
TIP
Handbook on Health Inequality Monitoring 10 |

Reporting inequality and national average
• In general, national average should be reported along with disaggregated data and measures of inequality to present a comprehensive view of the status of the health indicator
• When presenting inequality measures for multiple countries, national levels of health indicators should also be presented– For example, there may be low inequality explained by all
population subgroups having equally high mortality• Cross-country comparisons of within-country inequality in the
absence of the national average would give an incomplete representation of the country situation
Handbook on Health Inequality Monitoring 11 |

Applied example: reporting inequality and national average
Figure 3 Wealth-based inequality in stunting among children under five in 70 countries, DHS and MICS 2005–2011
Handbook on Health Inequality Monitoring 12 |

Applied example: reporting inequality and national average
Figure 4 Wealth-based inequality and national average in stunting among children under five in 70 countries, DHS and MICS 2005–2011
Handbook on Health Inequality Monitoring 13 |

Special considerations: low sample size
• Household surveys may not be designed to have sufficient subgroup sample sizes– As the sample size decreases the estimate becomes
more uncertain and the ability to compare becomes more restricted
• High levels of uncertainty in point estimates (broad confidence intervals) pose a challenge– Difference and ratio measures for subgroups become
less reliable• When sample size is too low to generate
meaningful estimates, the audience should be notified in a systematic way
Handbook on Health Inequality Monitoring 14 |
Reporting statistical significance
• Reporting the confidence interval or standard error values of point estimates can help the audience to better understand whether health indicators are statistically different between subgroups
• Some caution required:– Estimates that are derived from large samples may show
statistically significant differences, but in the realm of public health this difference may not be meaningful
• Ensure that point estimates do not lead to false conclusions and misinformed policy:– Consider whether confidence intervals of the point
estimates are narrow enough for meaningful conclusions; if not, point estimates should not be reported
TIP
Handbook on Health Inequality Monitoring 15 |

Special considerations: reporting multiple dimensions of inequality simultaneously
• Although health data disaggregation is presented by a single dimension of inequality at a time, it will occasionally make sense to report multiple dimensions simultaneously– For example, reporting socioeconomic (education-
based) differences in men and women:• First, divide the population based on sex• Then, within each subgroup, divide by level of education• Calculate and report education-based inequalities in men
and women separately
Handbook on Health Inequality Monitoring 16 |

Applied example: reporting multiple dimensions of inequality simultaneouslyFigure 6 Under-five mortality rate in Nigeria, by place of residence and wealth, DHS 2008
Source: Adapted from World Health Organization Centre for Health Development: country profiles on urban health, Nigeria. http://www.who.int/kobe_centre/measuring/urban_health_observatory/uhprofiles/en/index1.html.
Handbook on Health Inequality Monitoring 17 |

Reporting time trend: the four quadrant view
• Four quadrant view presents time trends in overall averages along with time trends in inequality– Can be applied to multiple health indicators or
multiple countries– Can present absolute or relative inequality, or in
some cases, both
Handbook on Health Inequality Monitoring 18 |

Reporting time trend: the four quadrant view
• Time trends in overall averages are divided into those with improving versus worsening overall averages
• Time trends in inequality are divided into those with increasing versus decreasing inequality
• Health indicators/countries can be divided into four groups:
1. improving overall average and decreasing inequality (best outcome scenario)
2. improving overall average and increasing inequality3. worsening overall average and decreasing
inequality4. worsening overall average and increasing
inequality (worst outcome scenario)
Handbook on Health Inequality Monitoring 19 |

The four quadrant view: multiple health indicators within a single country
Decreasing relative wealth-based inequality
Increasing relative wealth-based inequality or status quo
Improving national average
Best situation
•DTP3 immunization
•Births attended by skilled health personnel
•Contraception prevalence: modern methods
•Infant mortality rate
•Under-five mortality rate
•Prevalence of underweight among women
Worsening national average or status quo
Prevalence of overweight among women Worst situation
•Stunting among children under five
Table 4 Four-quadrant view of the time trend in various health indicators in Cameroon, wealth-based inequality versus national average, DHS 1998–2004
Source: Adapted from Asbu E et al. Health inequities in the African Region of the World Health Organization. Brazzaville, Regional Office for Africa, World Health Organization, 2010.
Handbook on Health Inequality Monitoring 20 |

The four quadrant view: a single indicator reported by multiple countries
Figure 7 Four-quadrant view of benchmarking time trends in infant mortality rate in 20 African countries over a five-year period, wealth-based inequality versus national average
Source: Adapted from Asbu E et al. Health inequities in the African Region of the World Health Organization. Brazzaville, Regional Office for Africa, World Health Organization, 2010.
Handbook on Health Inequality Monitoring 21 |
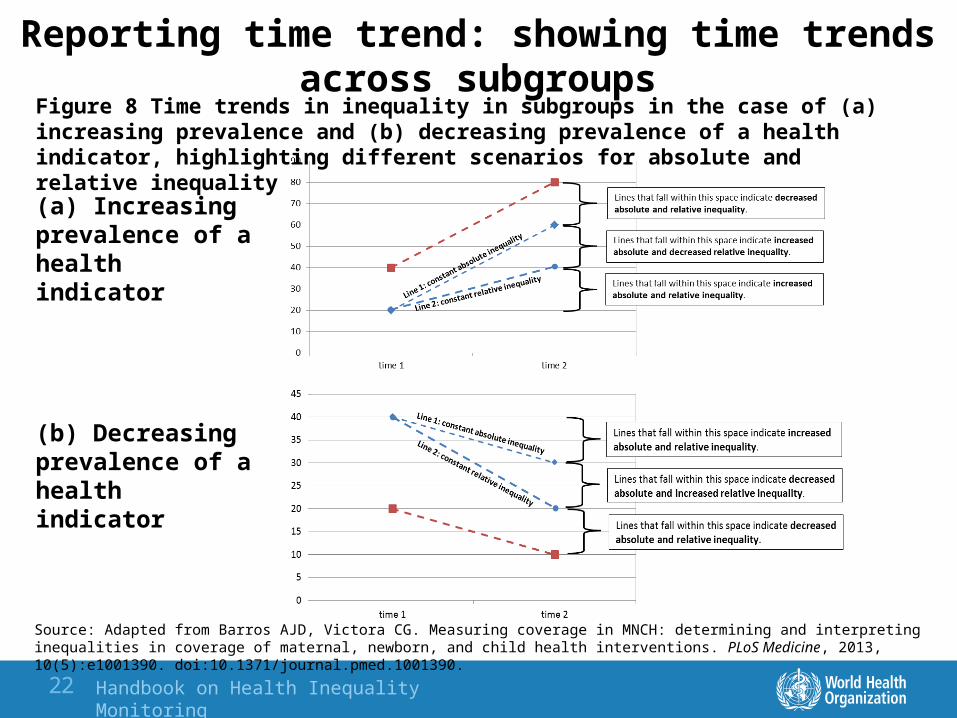
Reporting time trend: showing time trends across subgroupsFigure 8 Time trends in inequality in subgroups in the case of (a) increasing prevalence and (b) decreasing prevalence of a health indicator, highlighting different scenarios for absolute and relative inequality
(a) Increasing prevalence of a health indicator
(b) Decreasing prevalence of a health indicator
Handbook on Health Inequality Monitoring 22 |
Source: Adapted from Barros AJD, Victora CG. Measuring coverage in MNCH: determining and interpreting inequalities in coverage of maternal, newborn, and child health interventions. PLoS Medicine, 2013, 10(5):e1001390. doi:10.1371/journal.pmed.1001390.

Showing time trends across subgroups: applied examples
Figure 9 Time trends in births attended by skilled health personnel in (a) Cambodia, (b) Nepal and (c) Cameroon, by wealth quintile, DHS and MICS 1996–2010
Handbook on Health Inequality Monitoring 23 |

Defining priority areas
• The purpose of priority setting is to help policy-makers interpret the results of inequality monitoring
• A simple and intuitive interpretation of the complicated inequality monitoring process can help policy-makes and the public
• A panel of stakeholders with data or statistics background and an ability to interpret health statistics should review health inequality reports and decide which areas are priorities for action, taking into account:– Inequality analyses (latest status, time trend, and benchmarking)– National averages– Planned national targets and health care agendas
• The process of defining priority areas seeks consensus among stakeholders
Handbook on Health Inequality Monitoring 24 |

Defining priority areas• First, assign a score on a scale of 1 to 3 in each
of the three reported aspects of inequality (latest status, time trend and benchmarking):
• 1 indicates that no action is needed• 2 indicates that action is needed • 3 indicates that urgent action is needed
– This should be done for each health indicator by each equity stratifier.
– National averages for each health indicator may also be scored alongside.
Handbook on Health Inequality Monitoring 25 |

Defining priority areas
• Next, find the mean of scores across all equity stratifiers and for each indicator.
• This mean score is considered alongside the national average to show where priorities lie:– Can identify high-priority health indicators by
latest status, time trend and benchmarking– Can identify high-priority equity stratifiers
Handbook on Health Inequality Monitoring 26 |

Health inequality monitoring: with a special focus on low- and middle-income countries
Full text available online:
http://apps.who.int/iris/bitstream/10665/85345/1/9789241548632_eng.pdf