Embed Size (px)
Citation preview

Lecture 7Fourier Series
Texture
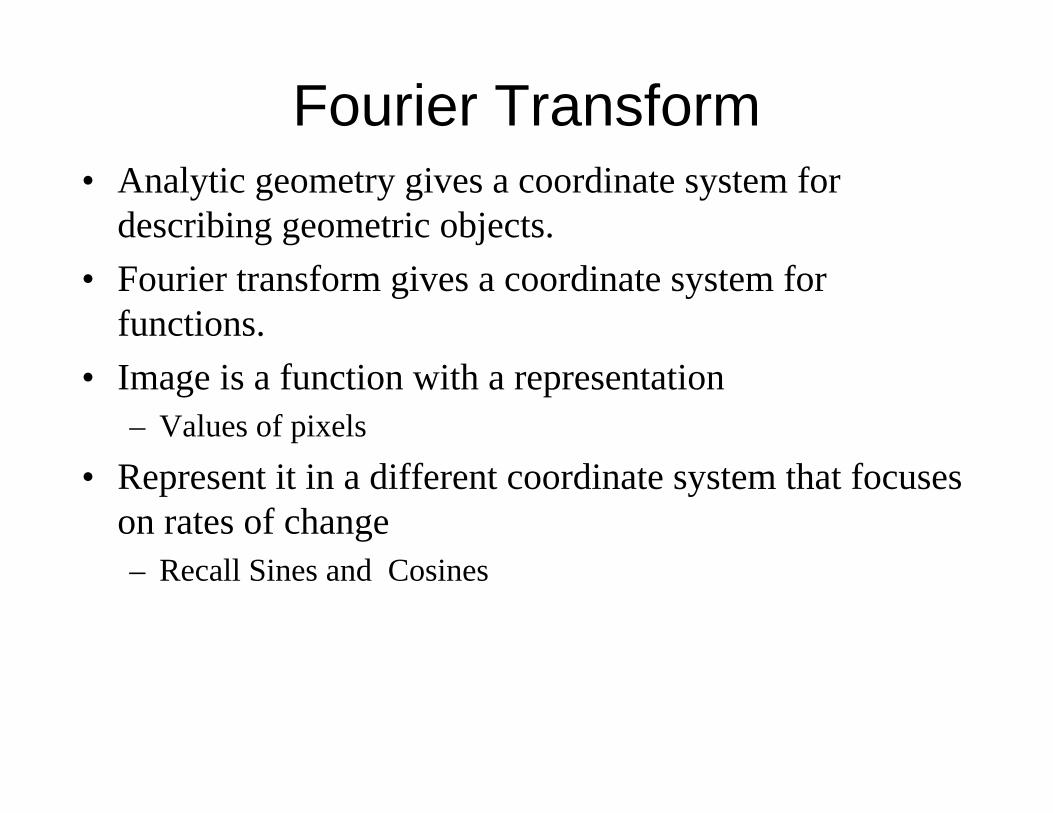
Fourier Transform• Analytic geometry gives a coordinate system for
describing geometric objects.• Fourier transform gives a coordinate system for
functions.• Image is a function with a representation
– Values of pixels
• Represent it in a different coordinate system that focuses on rates of change– Recall Sines and Cosines
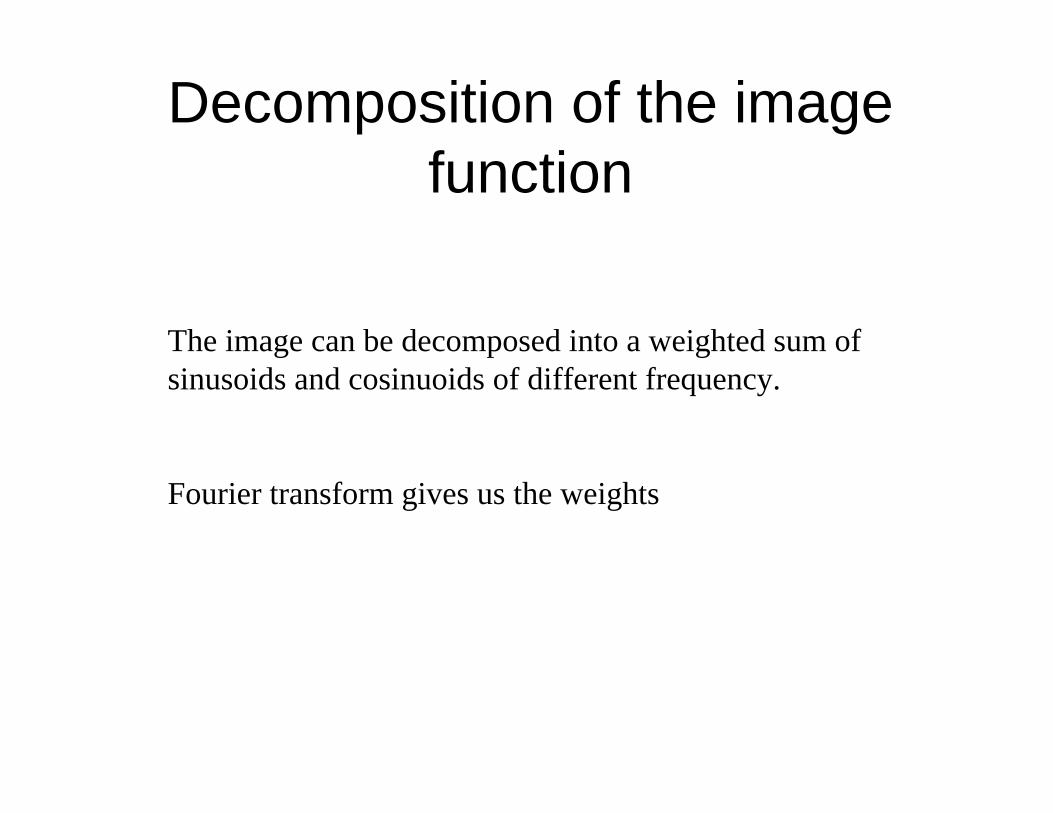
Decomposition of the image function
The image can be decomposed into a weighted sum ofsinusoids and cosinuoids of different frequency.
Fourier transform gives us the weights

Orthonormal Basis• ||(1,0)||=||(0,1)||=1• (1,0).(0,1)=0• Similarly we use normal basis elements eg:
• While, eg: ∫=π
θθθθθ 2
0
2cos)cos()cos()cos( d
∫ =π
θθθ2
00sincos d

2D Example


Fourier transform
(F)i(F)
)sin(),()cos(),(
),(),( )(
ℑ+ℜ
=+++
==
∫ ∫∫ ∫
∫ ∫∞
∞−
∞
∞−
∞
∞−
∞
∞−
∞
∞−
∞
∞−
+−
dxdyvyuxyxfidxdyvyuxyxf
dxdyeyxfvuF vyuxi
often described by magnitude ( )and phase ( )
) (1
0
1
0
Nnl
MmkiM
k
N
lklmn efF
+−−
=
−
=∑∑=
π
In the discrete case with values fkl of f(x,y) at points (kw,lh) fork= 1..M-1, l= 0..N-1
)()( 22 FF ℑ+ℜ
))()(arctan(
FF
ℜℑ

m=0 n=0

Examples• Transform of box
filter is sinc.• Transform of
Gaussian is Gaussian.
(Trucco and Verri)
Implications• Smoothing means removing high frequencies. This is
one definition of scale.• Need smoothing before subsampling to avoid aliasing.• Since Gaussian’s transform is a Gaussian, multiplying by
a Gaussian, causes a multiplication in the frequency domain– High frequencies are then suppressed
• Derivative filters have high frequency components– Multiplying with Gaussian damps these
The Laplacian Pyramid• Building a Laplacian pyramid:
– Create a Gaussian pyramid– Take the difference between one Gaussian
pyramid level and the next (before subsampling)
• Properties– Also known as the difference-of-Gaussian
function, which is a close approximation to the Laplacian
– It is a band pass filter - each level represents a different band of spatial frequencies
• Reconstructing the original image:– Reconstruct the Gaussian pyramid starting at
top layer
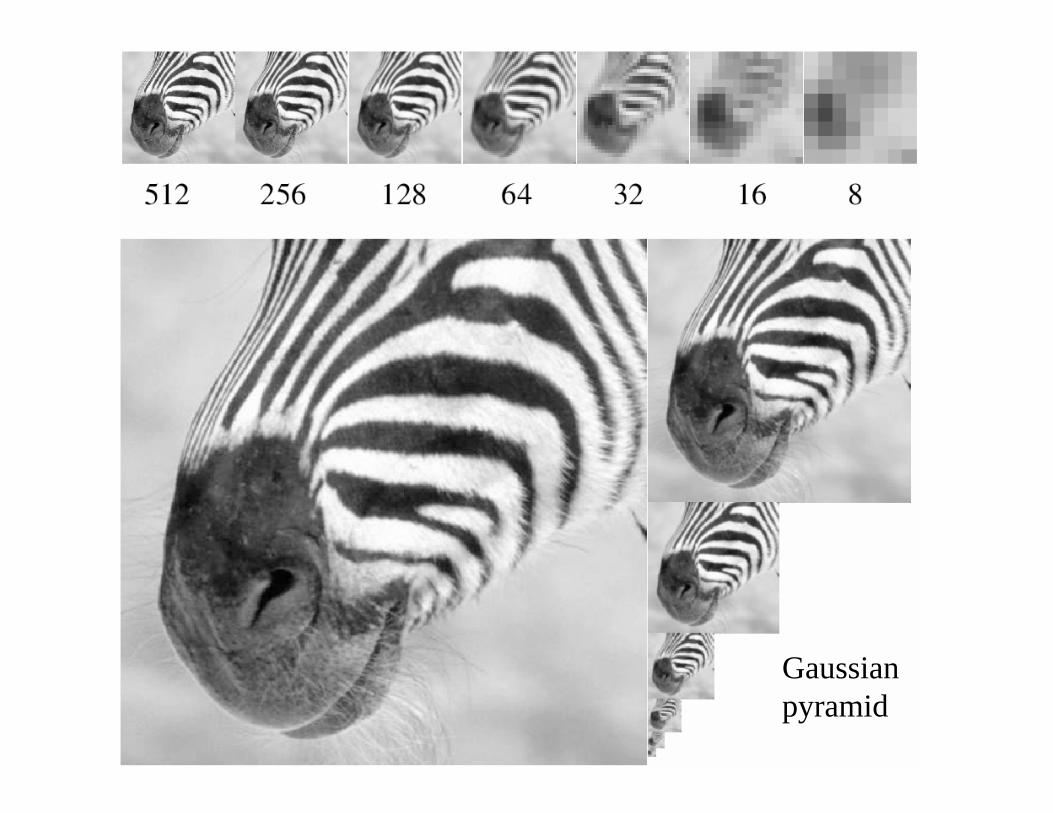
Gaussianpyramid
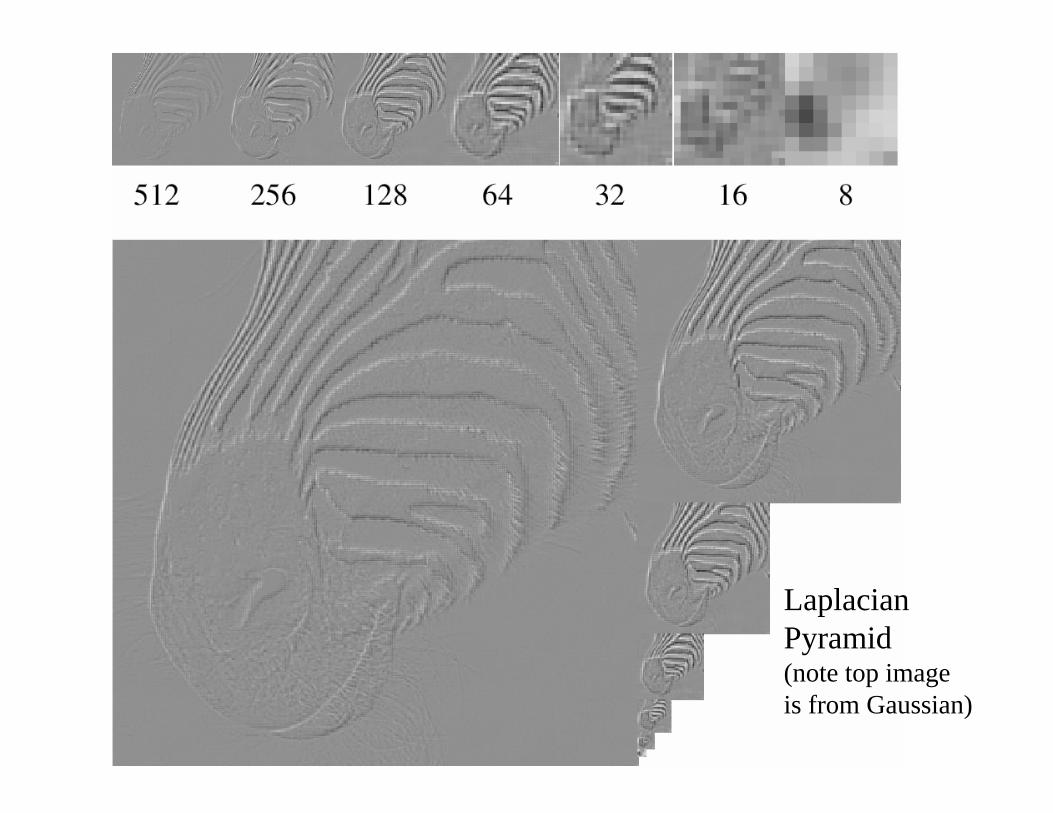
LaplacianPyramid(note top imageis from Gaussian)

Phase and Magnitude• Fourier transform of a real
function is complex– difficult to plot, visualize– instead, we can think of the
phase and magnitude of the transform
• Phase is the phase of the complex transform
• Magnitude is the magnitude of the complex transform
• Curious fact– all natural images have about the
same magnitude transform– hence, phase seems to matter,
but magnitude largely doesn’t
• Demonstration– Take two pictures, swap the
phase transforms, compute the inverse - what does the result look like?

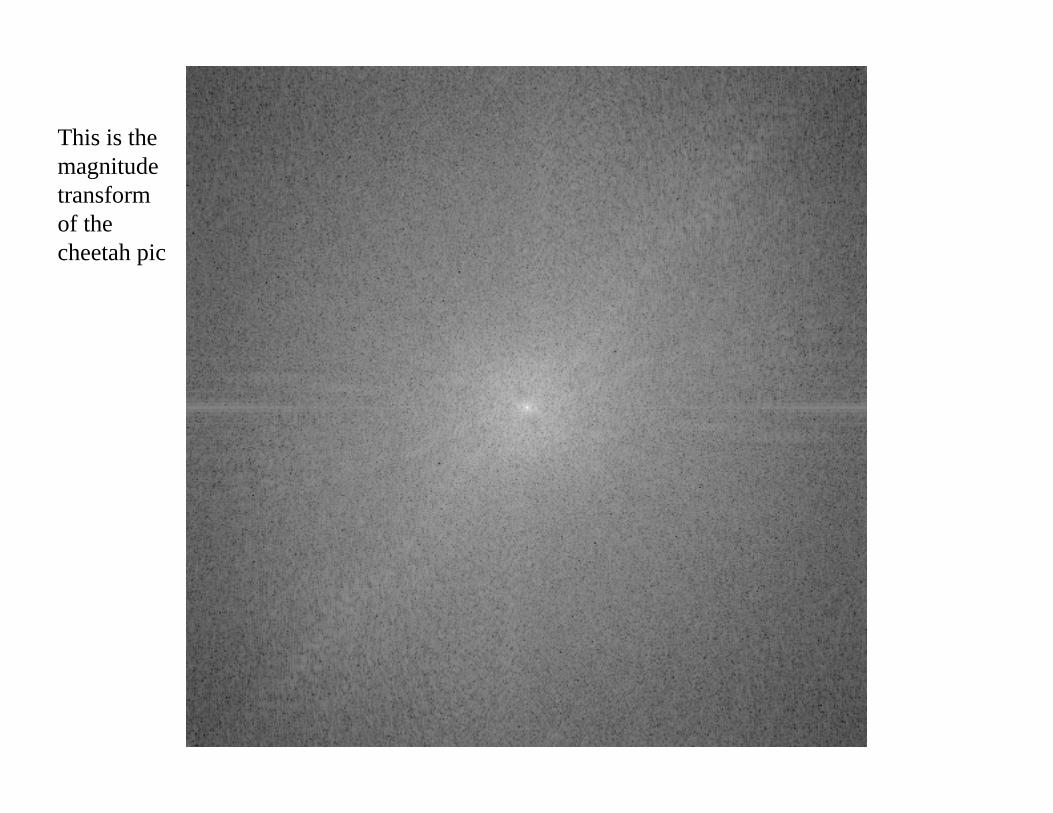
This is the magnitude transform of the cheetah pic
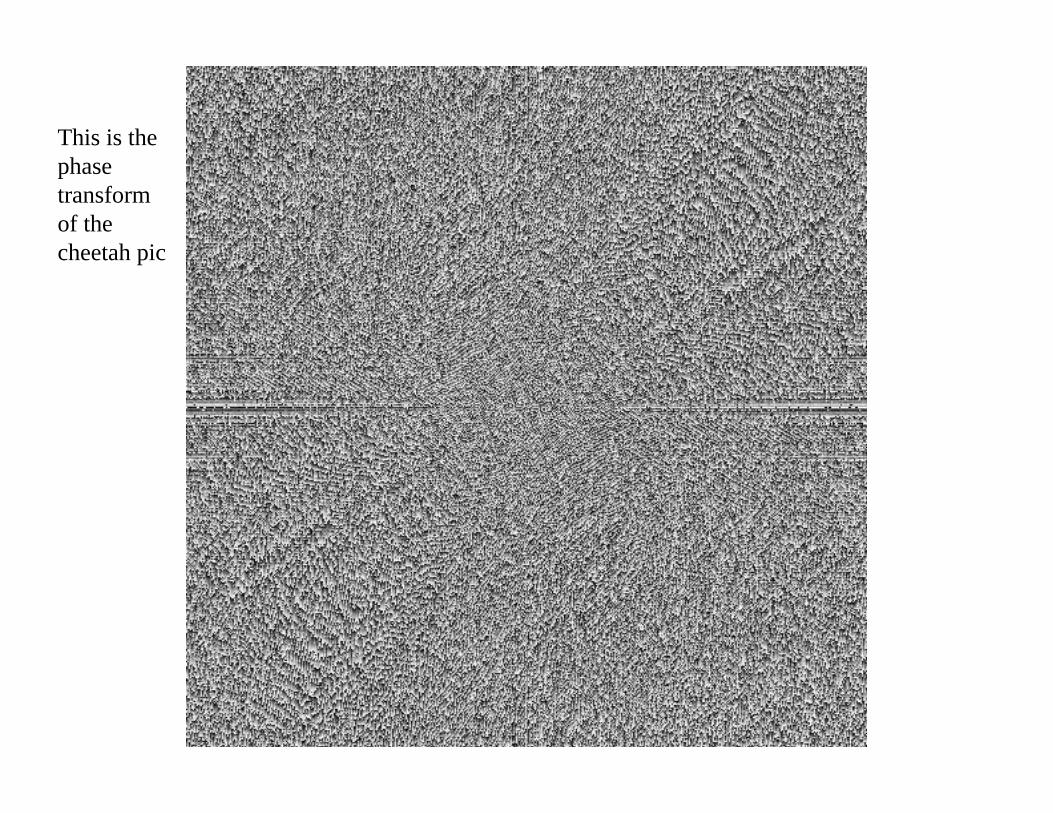
This is the phase transform of the cheetah pic

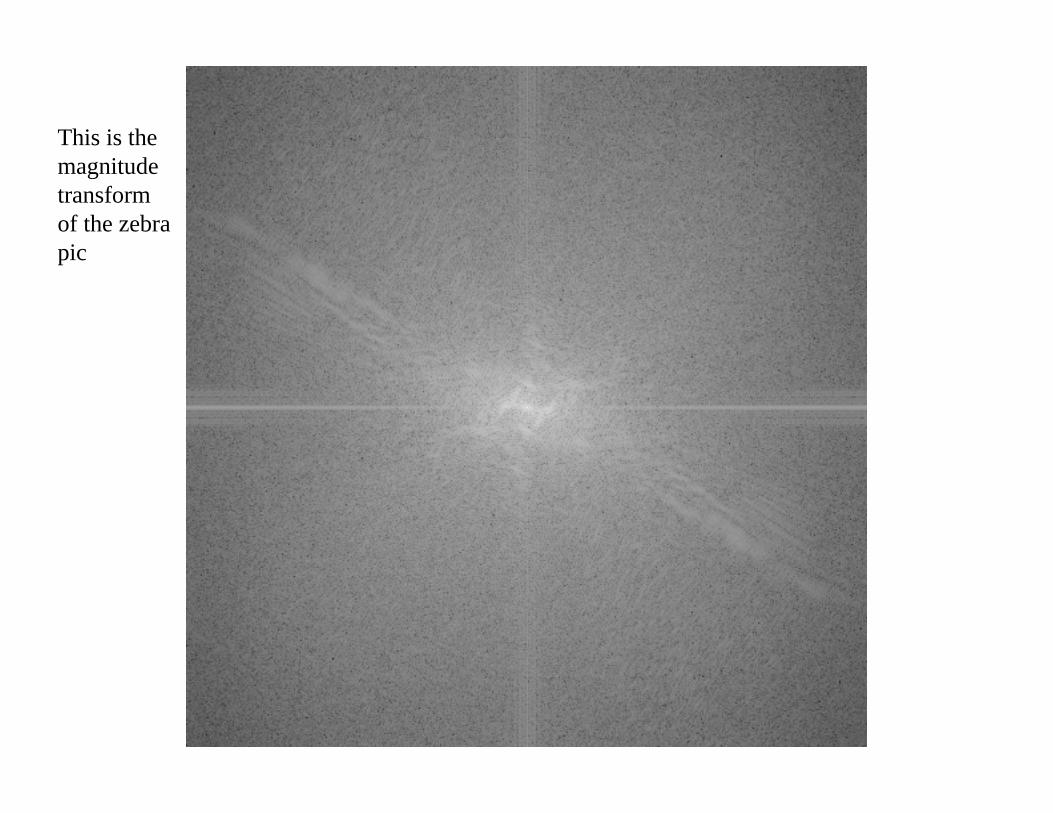
This is the magnitude transform of the zebra pic
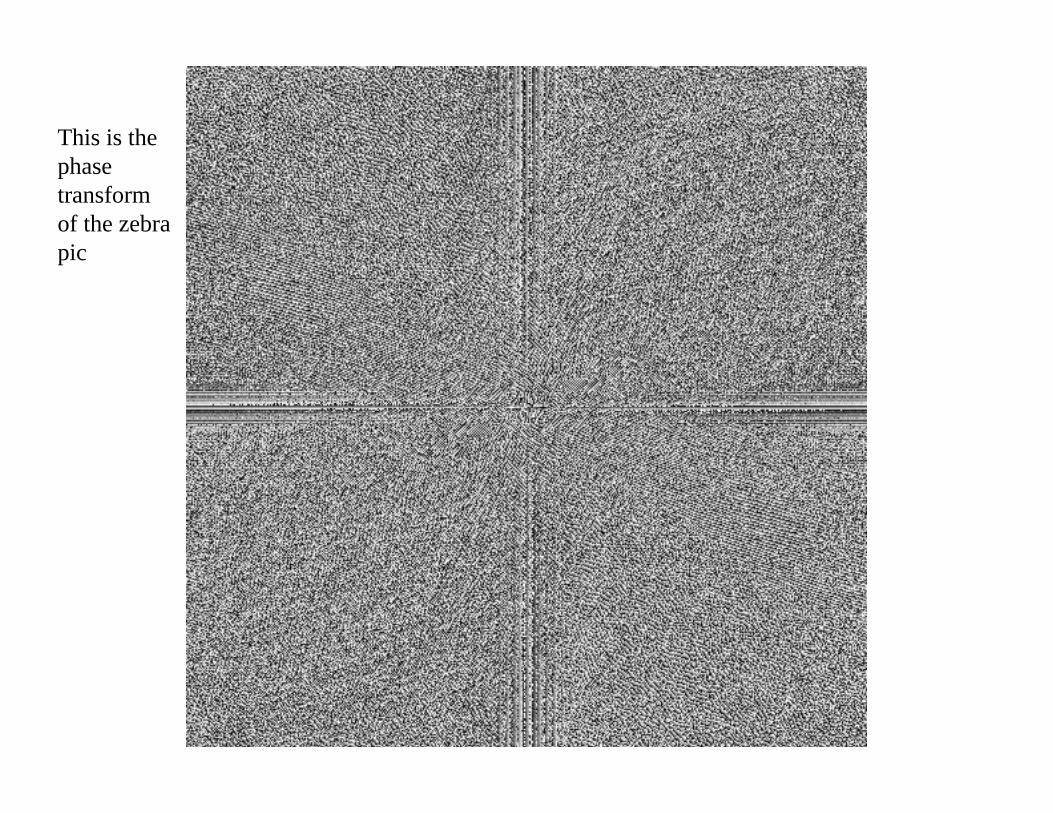
This is the phase transform of the zebra pic
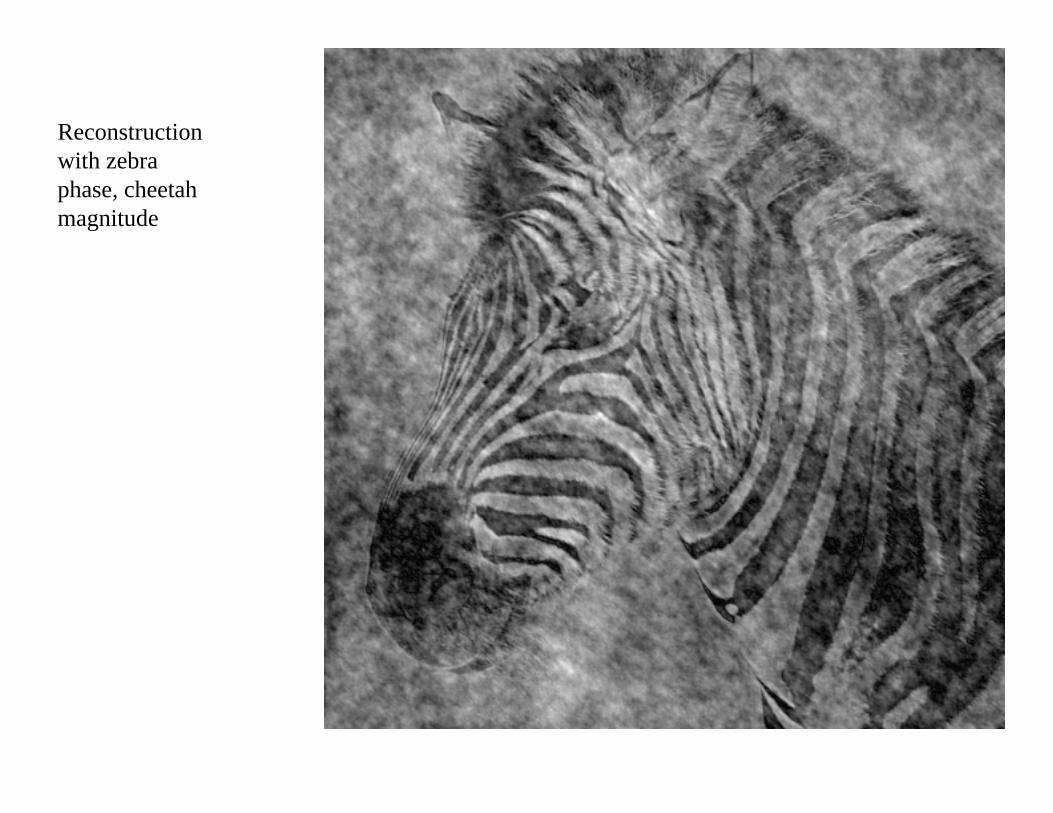
Reconstruction with zebra phase, cheetah magnitude

Reconstruction with cheetah phase, zebra magnitude

Textures• Goal of computer vision: infer things about the world by
looking at one or more images• Geometry provides clues• Image features provide clues
– Edges– Corners– Filter Responses
• What next?– Texture– What is texture?

Texture• Edge detectors find differences in overall intensity.• Average intensity is only simplest difference.

Two parts have different texture

What is texture?• Something that repeats with variation.• Must separate what repeats and what stays the same.• Model as repeated trials of a random process
– The probability distribution stays the same.– But each trial is different.

Issues: 1) Discrimination/Analysis

2) Synthesis

Many more issues3. Texture boundary detection.4. Shape from texture.We’ll focus on 1, mention 2.

Gradient in the spacing of the barrels (Gibson 1957)
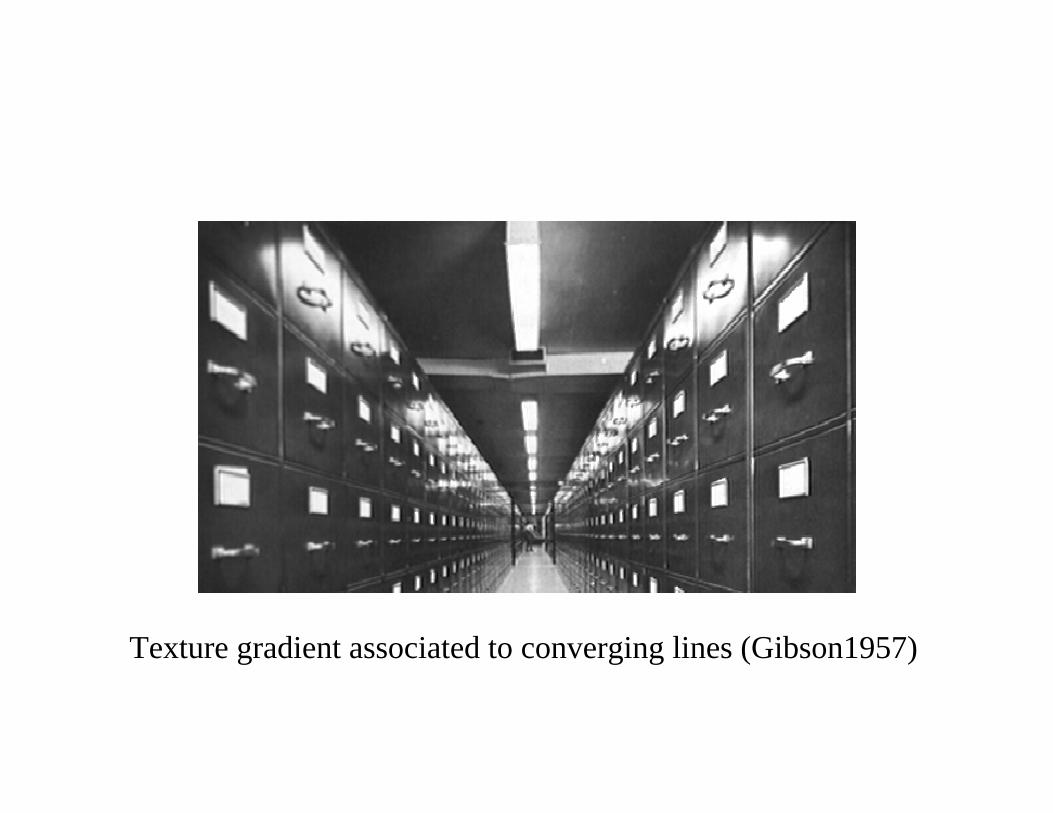
Texture gradient associated to converging lines (Gibson1957)

Simplest Texture• Each pixel independent, identically distributed (iid).• Examples:
– Region of constant intensity.– Gaussian noise pattern.– Speckled pattern
Matlab
Texture Discrimination is then Statistics
• Two sets of samples.• Do they come from the same random process?
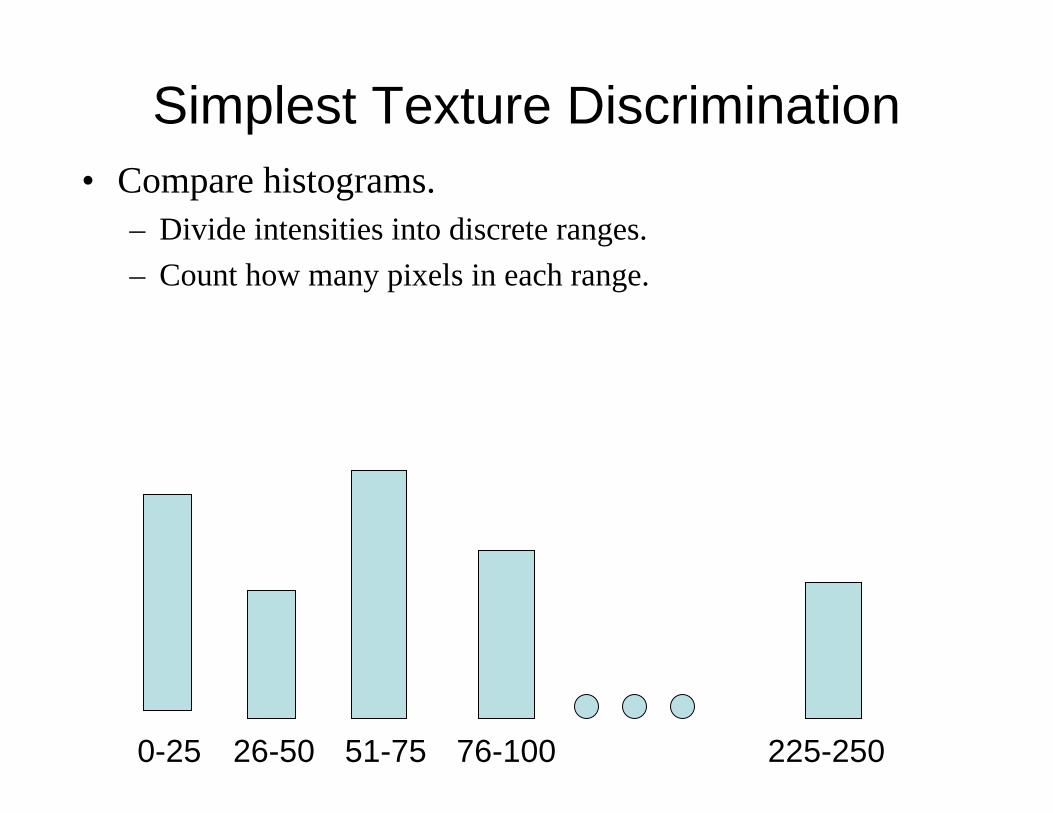
Simplest Texture Discrimination• Compare histograms.
– Divide intensities into discrete ranges.– Count how many pixels in each range.
0-25 26-50 225-25051-75 76-100

How/why to compare• Simplest comparison is SSD, many others.• Can view probabilistically.
– Histogram is a set of samples from a probability distribution.– With many samples it approximates distribution.– Test probability samples drawn from same distribution. Ie., is difference
greater than expected when two samples come from same distribution?
Matlab

i
j
k
Chi-square
0.1
0.8
}}
∑= +
−=
K
m ji
jiji mhmh
mhmhhh
1
22
)()()]()([
21),(χ
Chi square distance between textonhistograms
(Malik)
More Complex Discrimination• Histogram comparison is very limiting
– Every pixel is independent.– Everything happens at a tiny scale.
Matlab• Use output of filters of different scales.
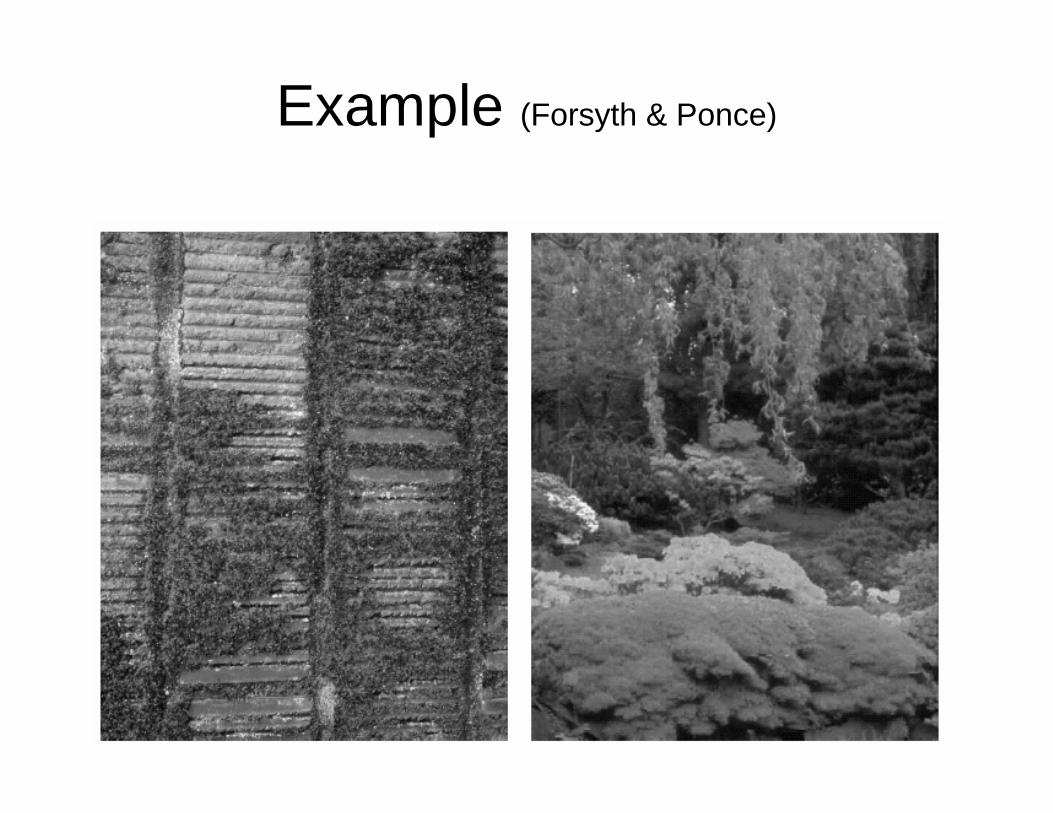
Example (Forsyth & Ponce)


What are Right Filters?• Multi-scale is good, since we don’t know right scale a priori.• Easiest to compare with naïve Bayes:Filter image one: (F1, F2, …)Filter image two: (G1, G2, …)S means image one and two have same texture.Approximate: P(F1,G1,F2,G2, …| S)By P(F1,G1|S)*P(F2,G2|S)*…

What are Right Filters?• The more independent the better.
– In an image, output of one filter should be independent of others.
– Because our comparison assumes independence.– Wavelets seem to be best.
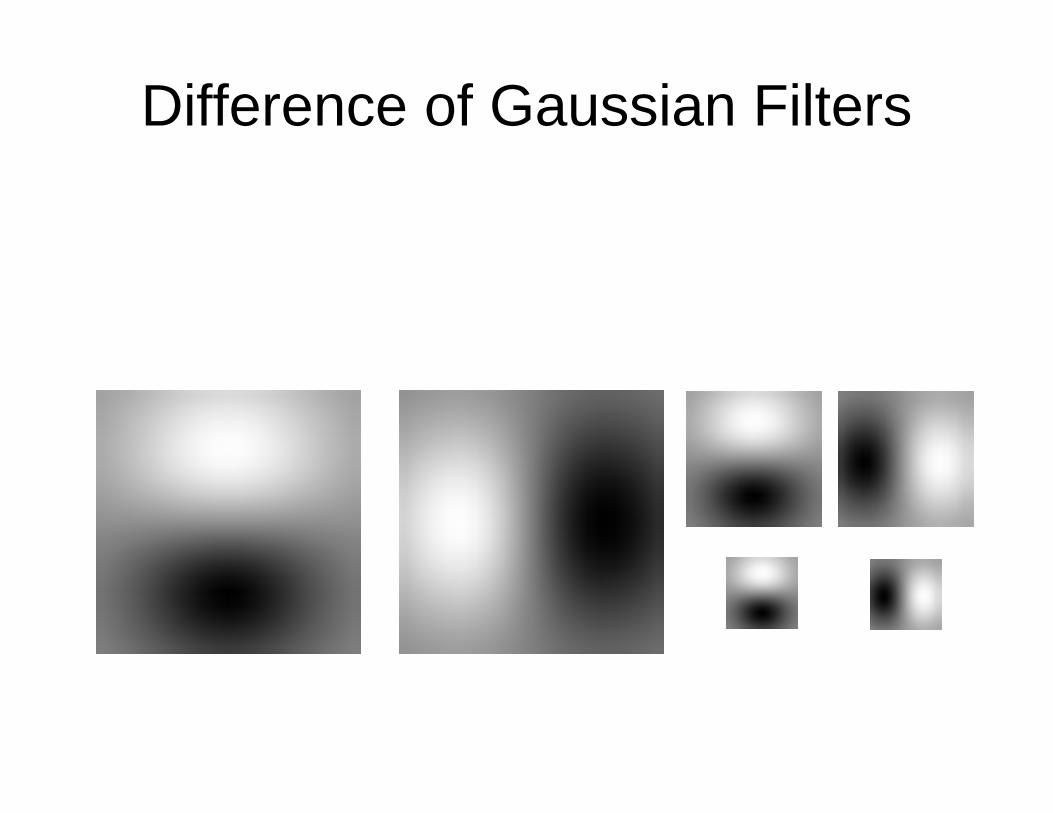
Difference of Gaussian Filters

Spots and Oriented Bars(Malik and Perona)


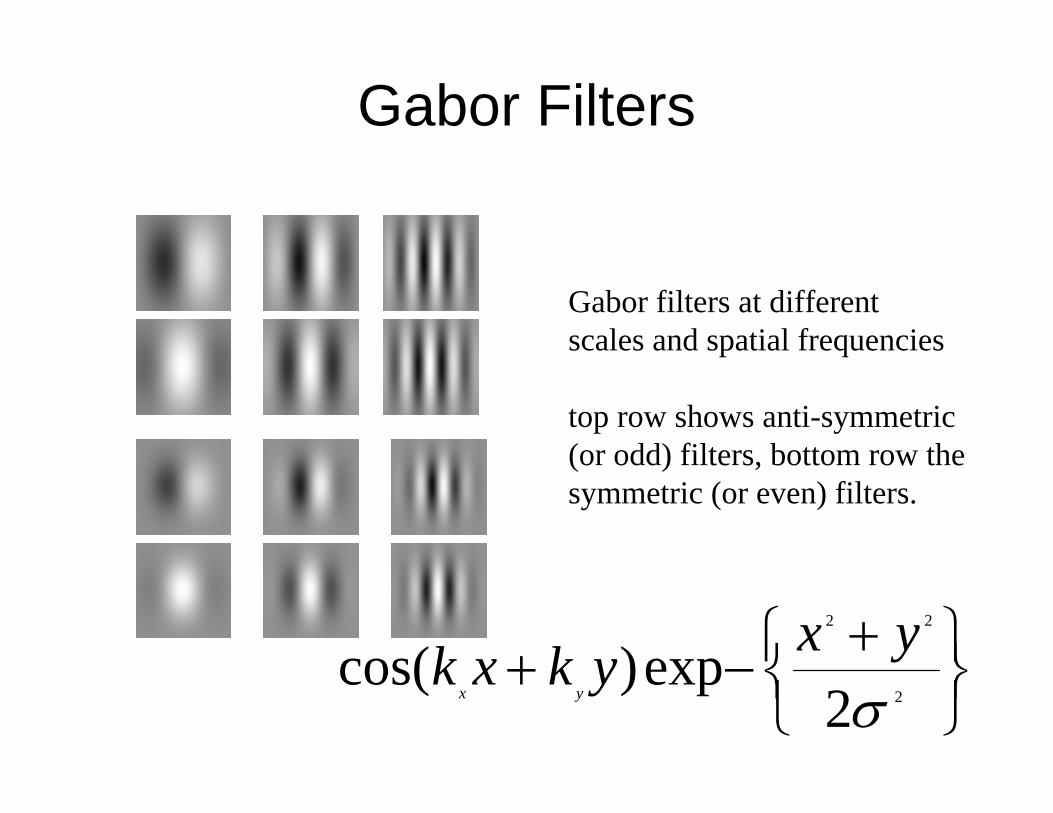
⎭⎬⎫
⎩⎨⎧ +
−+2
22
2exp)cos(
σyxykxk
yx
Gabor Filters
Gabor filters at differentscales and spatial frequencies
top row shows anti-symmetric (or odd) filters, bottom row thesymmetric (or even) filters.
Gabor filters are examples of Wavelets
• We know two bases for images:– Pixels are localized in space.– Fourier are localized in frequency.
• Wavelets are a little of both.• Good for measuring frequency locally.

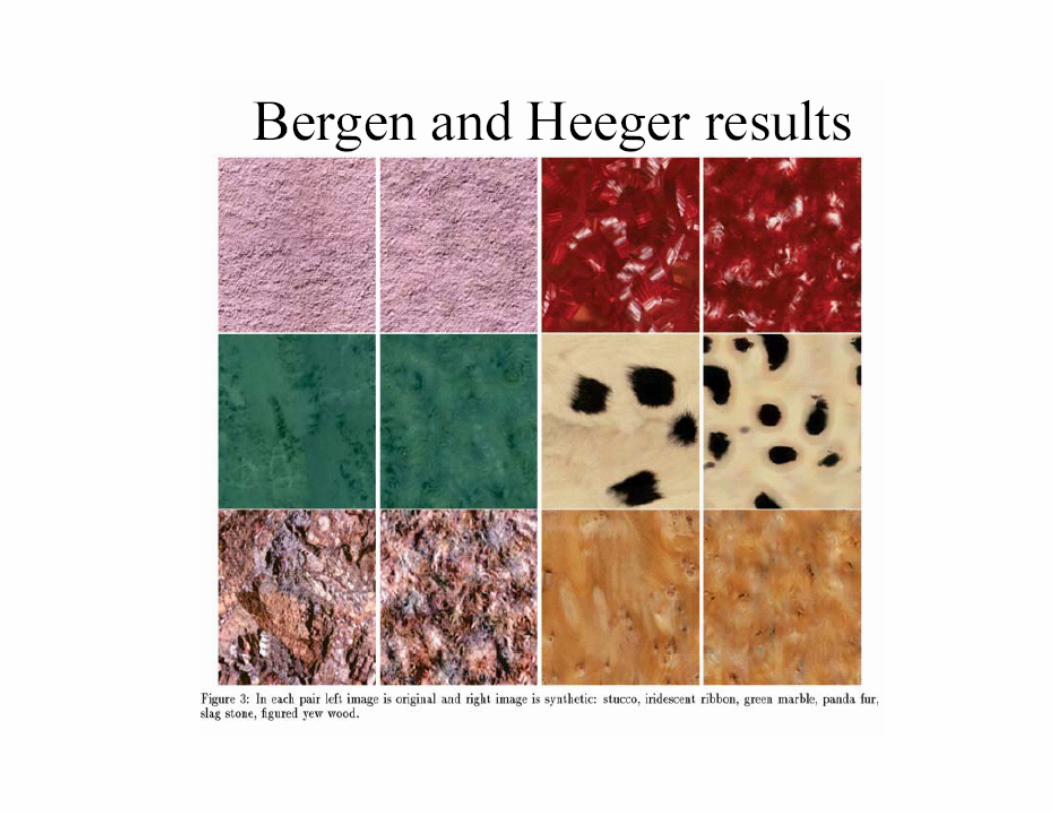
Synthesis with this Representation (Bergen and Heeger)


Markov Model• Captures local dependencies.
– Each pixel depends on neighborhood.
• Example, 1D first order modelP(p1, p2, …pn) = P(p1)*P(p2|p1)*P(p3|p2,p1)*…= P(p1)*P(p2|p1)*P(p3|p2)*P(p4|p3)*…
Example 1st Order Markov Model• Each pixel is like neighbor to left + noise with some
probability.Matlab• These capture a much wider range of phenomena.

There are dependencies in Filter Outputs
• Edge– Filter responds at one scale, often does at other scales.– Filter responds at one orientation, often doesn’t at orthogonal orientation.
• Synthesis using wavelets and Markov model for dependencies:– DeBonet and Viola– Portilla and Simoncelli


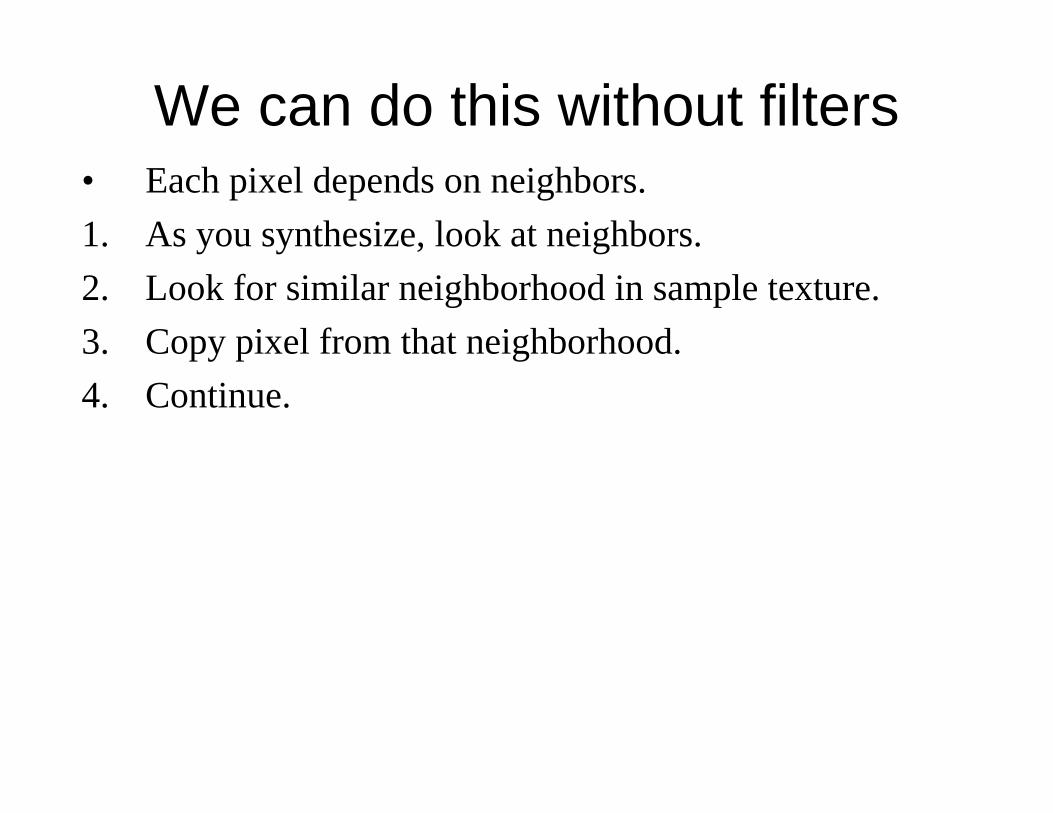
We can do this without filters• Each pixel depends on neighbors.1. As you synthesize, look at neighbors.2. Look for similar neighborhood in sample texture.3. Copy pixel from that neighborhood.4. Continue.


This is like copying, but not just repetition
Photo
Pattern Repeated
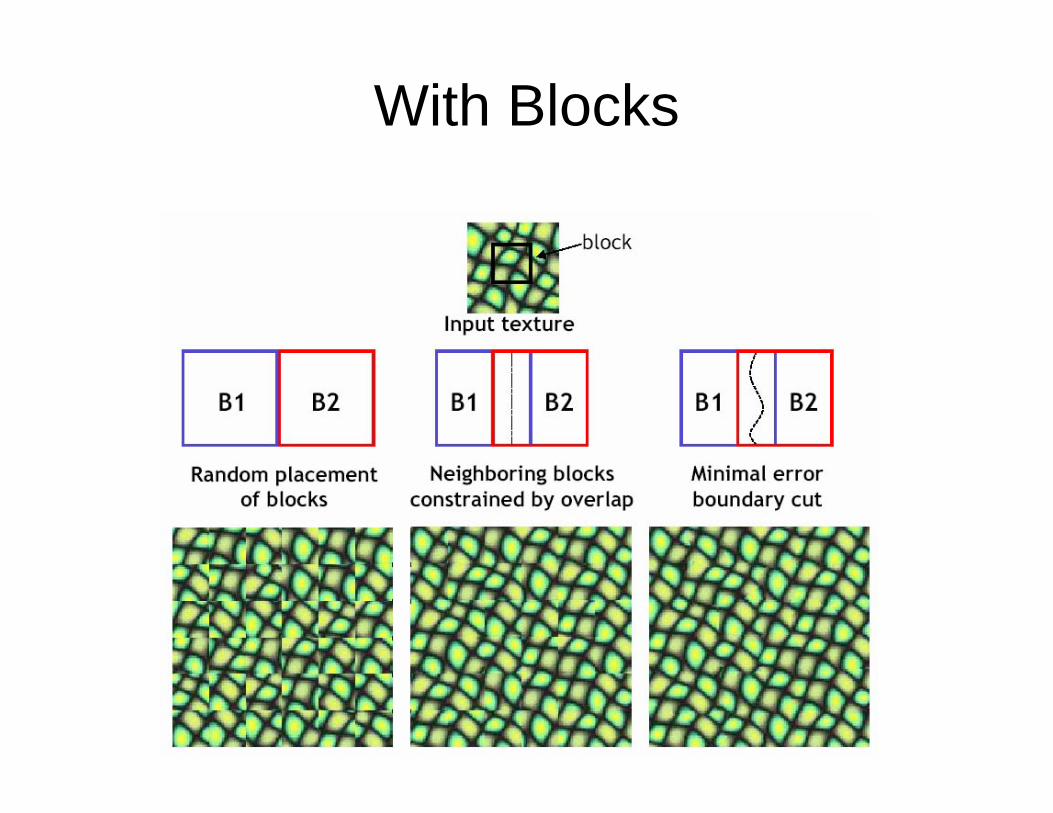
With Blocks


![large kriging tricky, usually - UMIACSramani/pubs/Memarsadeghi_Raykar_Dur... · 2008. 8. 22. · Ageneralizedversionofthe ordinary kriging, called cokriging [3, 5], canbe usedfor](https://img.pdfslide.us/doc/110x75/60e3d9dead8f016ddf1bf137/large-kriging-tricky-usually-ramanipubsmemarsadeghiraykardur-2008-8.jpg)