Embed Size (px)
Citation preview
Lecture 7 (9/27/2006)Lecture 7 (9/27/2006)
Crystal ChemistryCrystal Chemistry
Part 6: Part 6: Phase DiagramsPhase Diagrams
Gibbs Free EnergyGibbs Free Energy
G G – the energy of a system in excess of its – the energy of a system in excess of its internal energy. (This is the energy necessary for internal energy. (This is the energy necessary for a reaction to proceed) a reaction to proceed)
G = E + PV - TSG = E + PV - TSdG = VdP – SdTdG = VdP – SdT
at constant Tat constant T ( (δδG/G/δδP)P)TT = V = Vat constant Pat constant P ( (δδG/G/δδT)T)PP = -S = -S
Stable phases strive to have the lowest GStable phases strive to have the lowest GTherefore, the phase with the highest density at a Therefore, the phase with the highest density at a
given pressure and the highest entropy at a given given pressure and the highest entropy at a given temperaturetemperature will be preferredwill be preferred
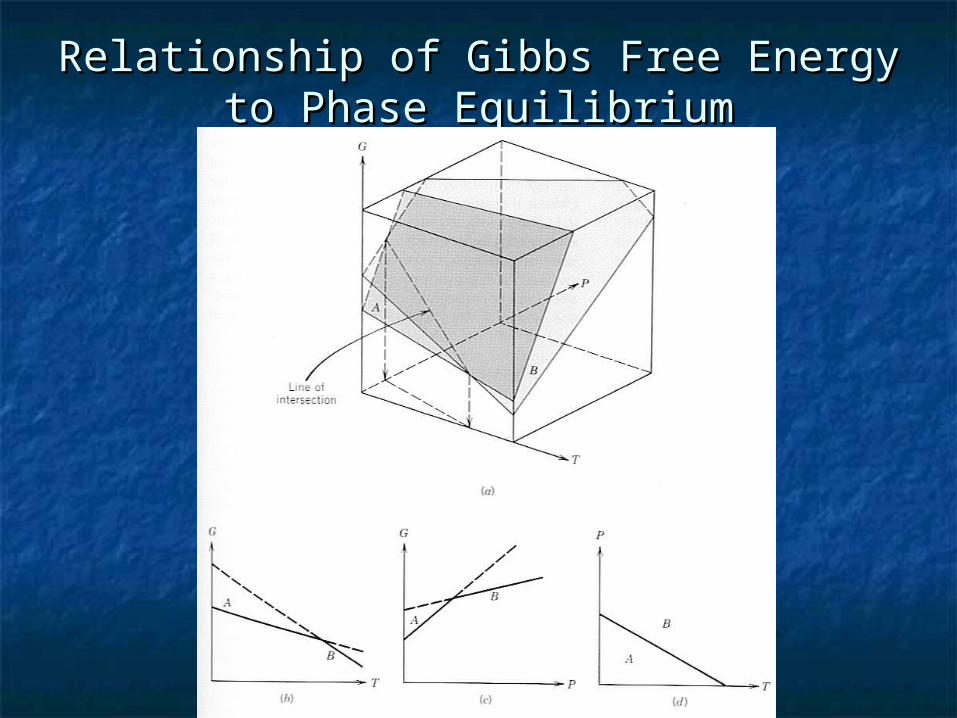
Relationship of Gibbs Free Energy to Relationship of Gibbs Free Energy to Phase EquilibriumPhase Equilibrium
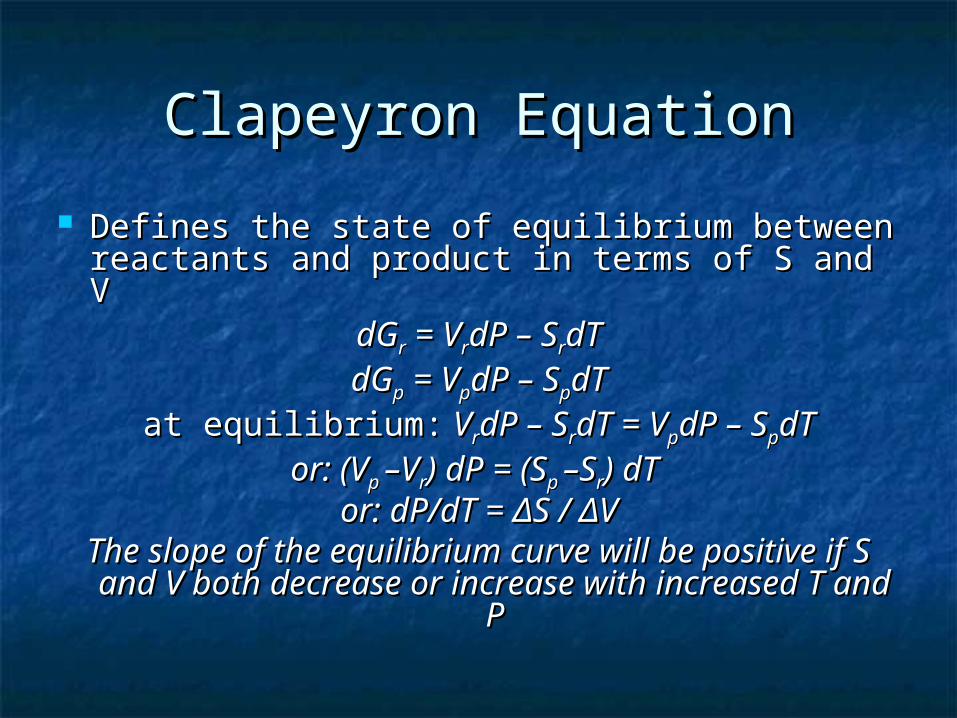
Clapeyron EquationClapeyron Equation
Defines the state of equilibrium between Defines the state of equilibrium between reactants and product in terms of S and Vreactants and product in terms of S and V
dGdGrr = V = VrrdP – SdP – SrrdTdTdGdGpp = V = VppdP – SdP – SppdTdT
at equilibrium:at equilibrium: V VrrdP – SdP – SrrdT = VdT = VppdP – SdP – SppdTdTor: (Vor: (Vp p –V–Vrr) dP = (S) dP = (Sp p –S–Srr) dT ) dT
or: dP/dT = or: dP/dT = ΔΔS / S / ΔΔVVThe slope of the equilibrium curve will be The slope of the equilibrium curve will be
positive if S and V both decrease or positive if S and V both decrease or increase with increased T and Pincrease with increased T and P
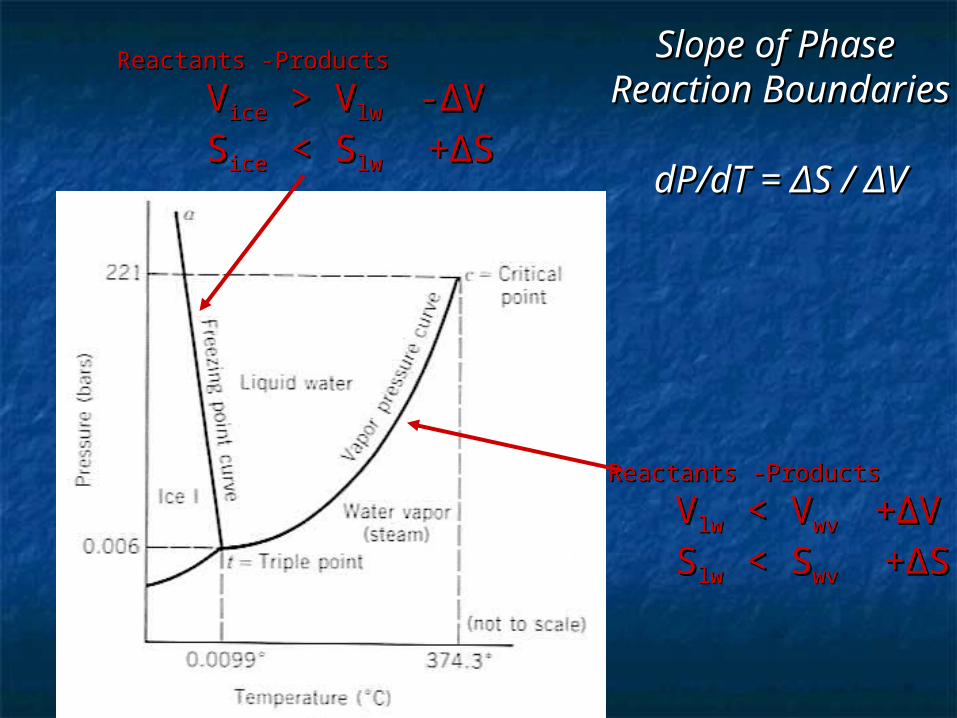
Reactants -ProductsReactants -Products
VVlwlw < V < Vwv wv + +ΔΔVV SSlwlw < S < Swvwv + +ΔΔSS
Reactants -ProductsReactants -Products
VViceice > V > Vlw lw - -ΔΔVV SSiceice < S < Slwlw + +ΔΔSS
Slope of Phase Slope of Phase Reaction BoundariesReaction Boundaries
dP/dT = dP/dT = ΔΔS / S / ΔΔVV
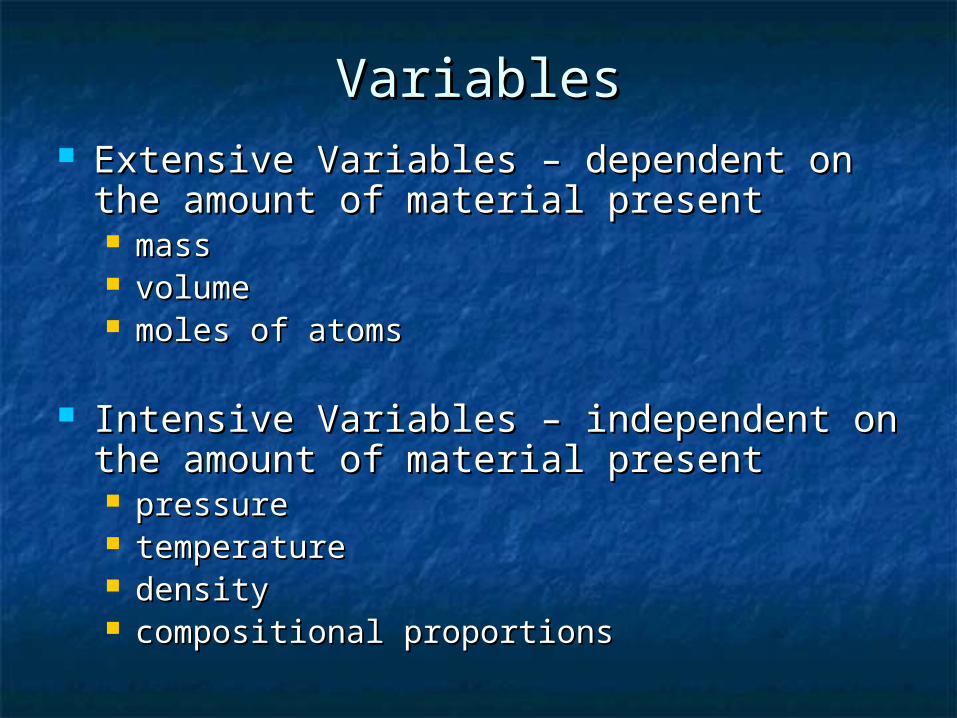
VariablesVariables Extensive Variables – dependent on the Extensive Variables – dependent on the
amount of material presentamount of material present massmass volume volume moles of atomsmoles of atoms
Intensive Variables – independent on the Intensive Variables – independent on the amount of material presentamount of material present pressurepressure temperaturetemperature density density compositional proportionscompositional proportions
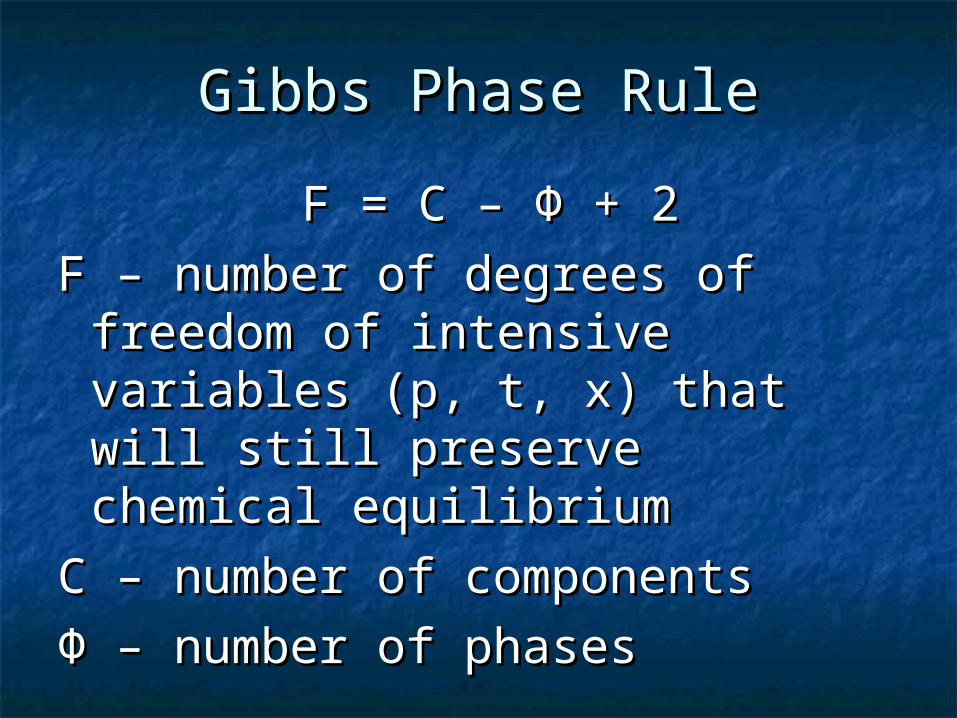
Gibbs Phase RuleGibbs Phase Rule
F = C – F = C – ΦΦ + 2 + 2
F – number of degrees of F – number of degrees of freedom of intensive variables freedom of intensive variables (p, t, x) that will still preserve (p, t, x) that will still preserve chemical equilibriumchemical equilibrium
C – number of componentsC – number of components
ΦΦ – number of phases – number of phases
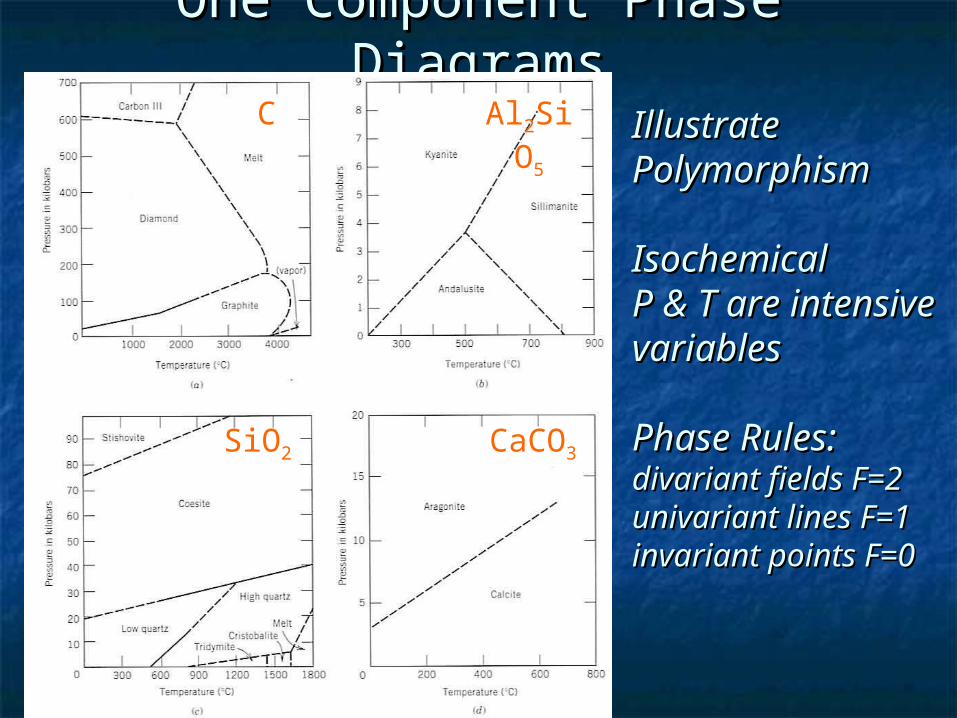
One Component Phase One Component Phase DiagramsDiagrams
Illustrate Illustrate PolymorphismPolymorphism
IsochemicalIsochemicalP & T are P & T are intensive intensive variablesvariables
Phase Rules:Phase Rules:divariant fields F=2divariant fields F=2univariant lines univariant lines F=1F=1invariant points invariant points F=0F=0
Al2SiO
5
SiO2 CaCO3
C
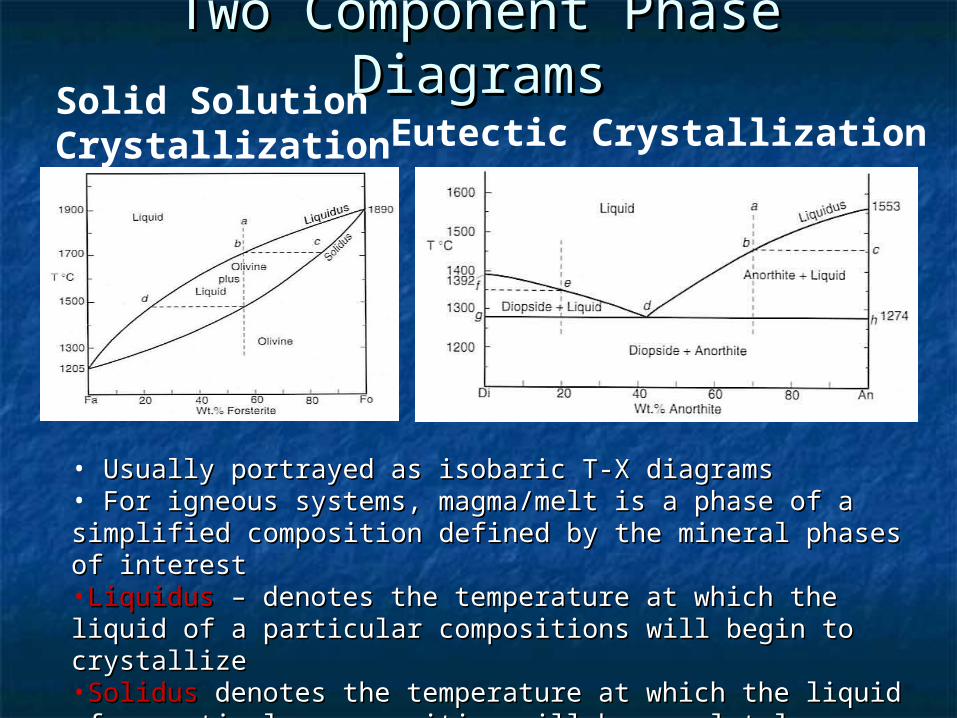
Two Component Phase Two Component Phase DiagramsDiagramsSolid Solution
Crystallization
• Usually portrayed as isobaric T-X diagramsUsually portrayed as isobaric T-X diagrams• For igneous systems, magma/melt is a phase of a simplified For igneous systems, magma/melt is a phase of a simplified composition defined by the mineral phases of interestcomposition defined by the mineral phases of interest•Liquidus Liquidus – denotes the temperature at which the liquid of a – denotes the temperature at which the liquid of a particular compositions will begin to crystallizeparticular compositions will begin to crystallize•SolidusSolidus denotes the temperature at which the liquid of a denotes the temperature at which the liquid of a particular composition will be completely crystallizedparticular composition will be completely crystallized
Eutectic Crystallization
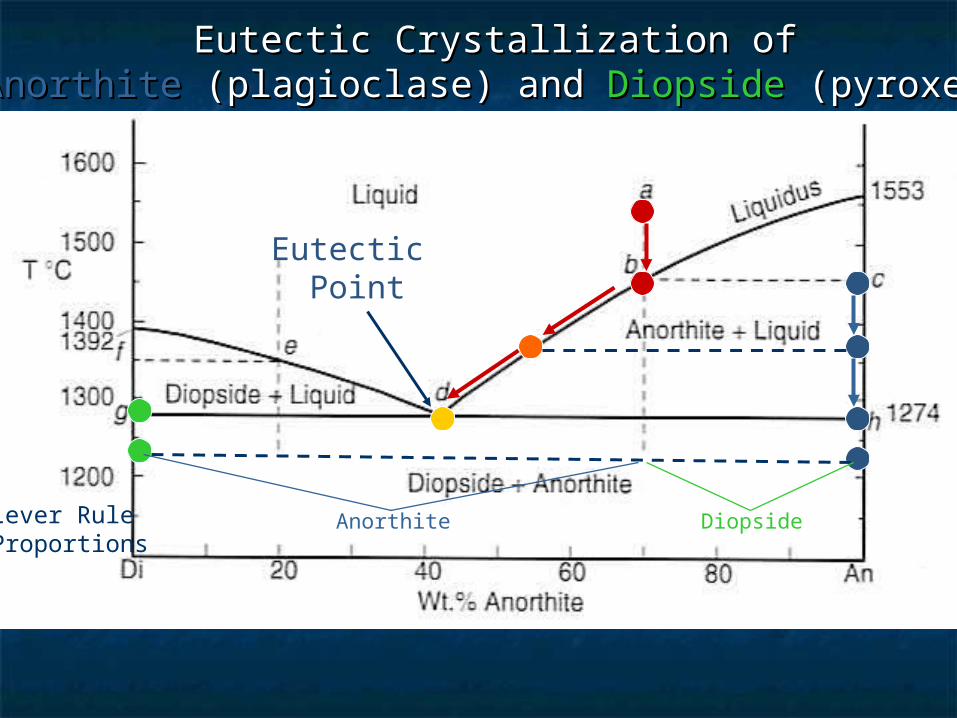
DiopsideAnorthite
Eutectic Crystallization of Eutectic Crystallization of AnorthiteAnorthite (plagioclase) and (plagioclase) and DiopsideDiopside (pyroxene) (pyroxene)
Lever Rule Proportions
Eutectic Point
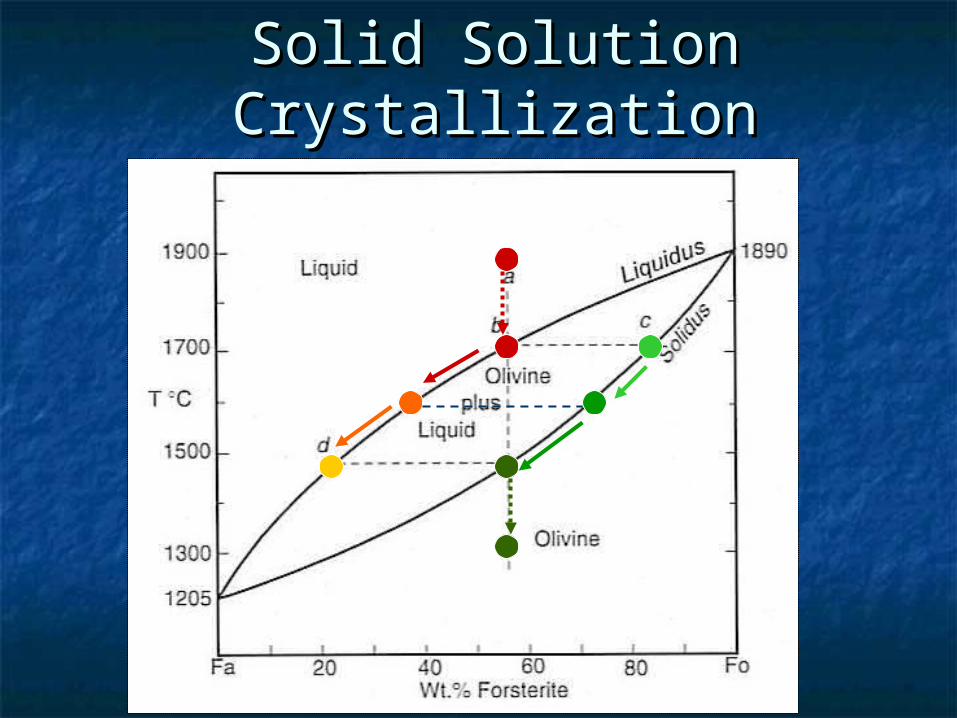
Solid Solution CrystallizationSolid Solution Crystallization
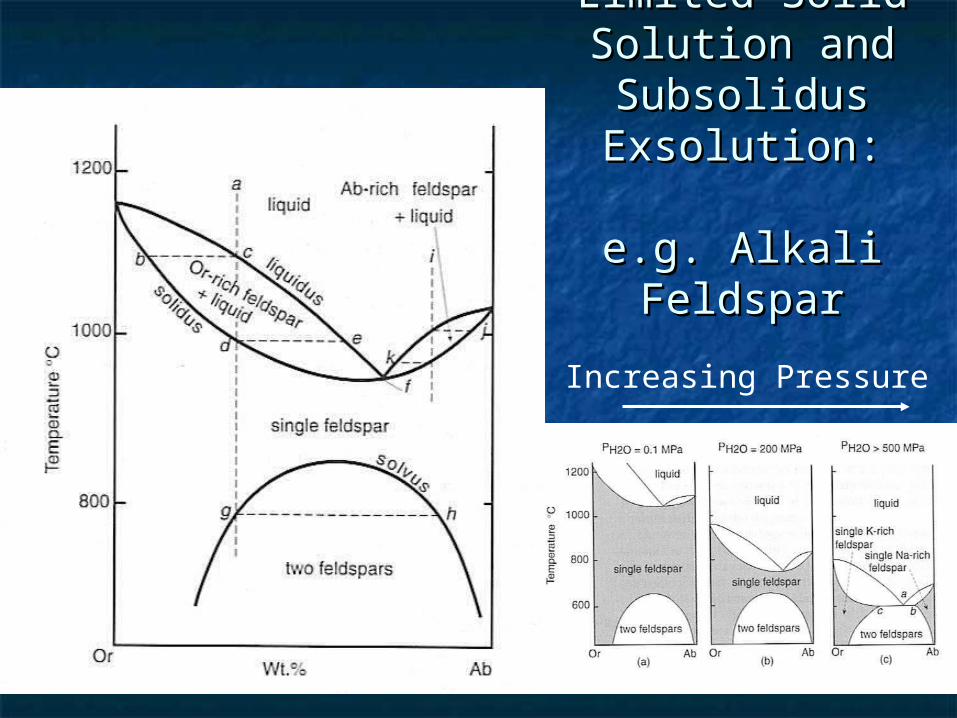
Limited Solid Limited Solid Solution and Solution and Subsolidus Subsolidus Exsolution:Exsolution:
e.g. Alkali Feldspare.g. Alkali Feldspar
Increasing Pressure
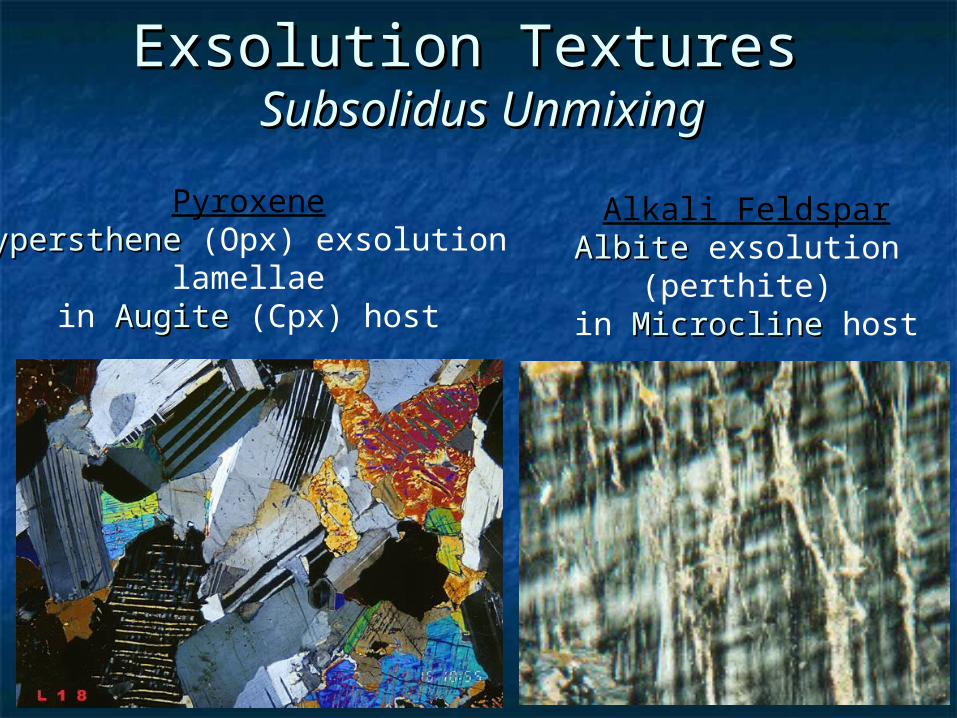
Exsolution Textures Exsolution Textures Subsolidus UnmixingSubsolidus Unmixing
Alkali FeldsparAlbiteAlbite exsolution
(perthite) in MicroclineMicrocline host
PyroxeneHyperstheneHypersthene (Opx) exsolution
lamellaein AugiteAugite (Cpx) host
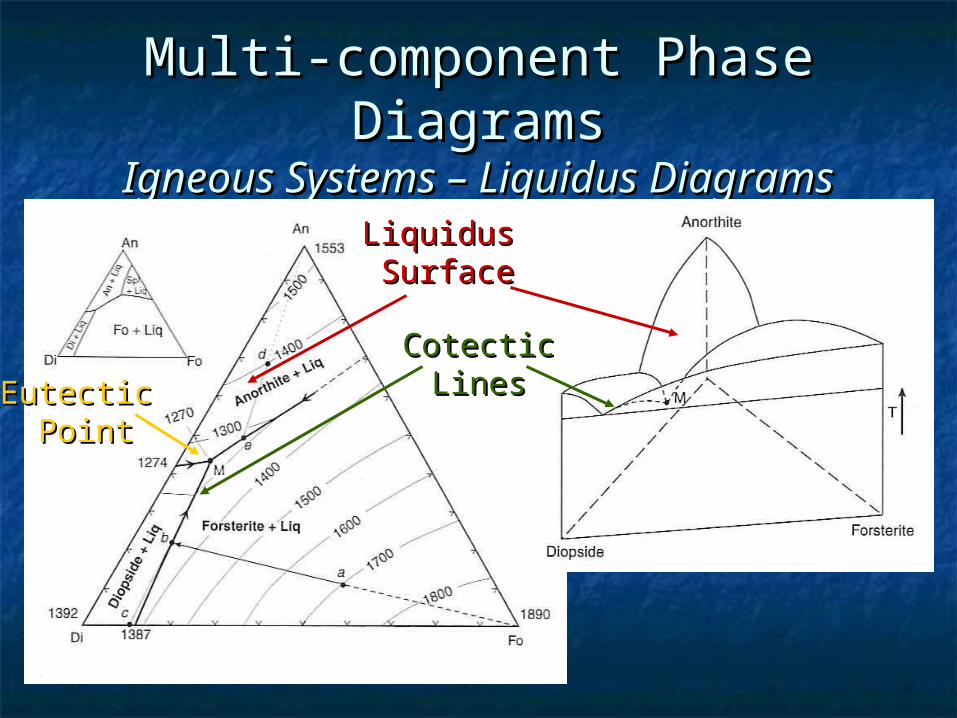
Multi-component Phase Multi-component Phase DiagramsDiagrams
Igneous Systems – Liquidus DiagramsIgneous Systems – Liquidus DiagramsLiquidus Liquidus SurfaceSurface
CotecticCotecticLinesLinesEutectic Eutectic
PointPoint
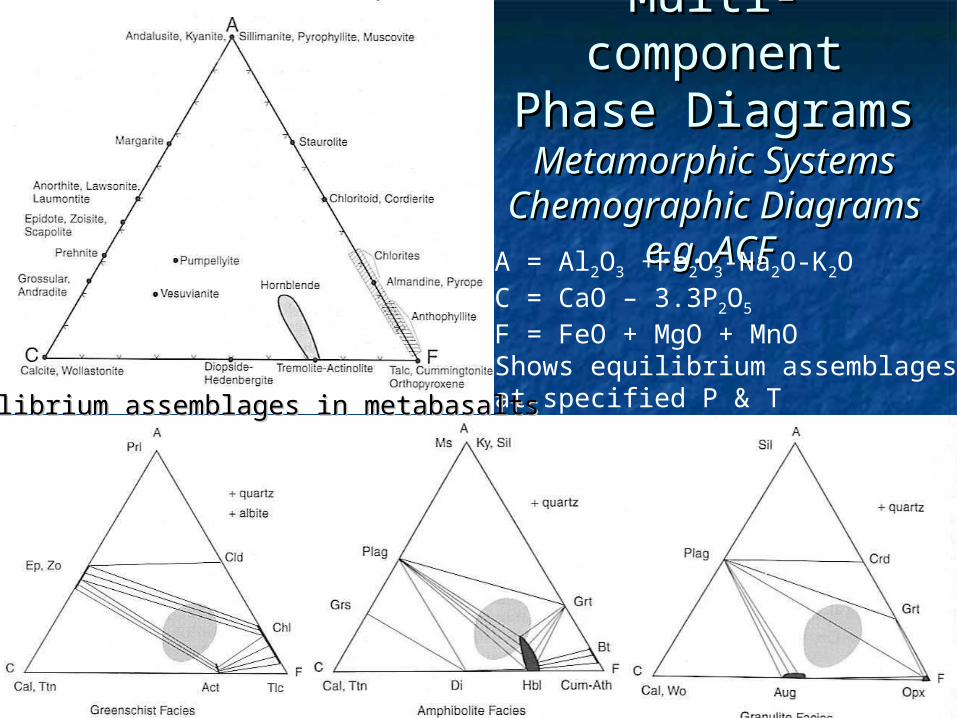
Multi-component Multi-component Phase DiagramsPhase Diagrams
Metamorphic Systems Metamorphic Systems Chemographic Chemographic
DiagramsDiagramse.g. ACF e.g. ACF A = Al2O3 +Fe2O3-Na2O-K2O
C = CaO – 3.3P2O5
F = FeO + MgO + MnOShows equilibrium assemblages at specified P & TEquilibrium assemblages in metabasaltsEquilibrium assemblages in metabasalts
Next LectureNext Lecture
50-minute Test on Crystal Chemistry 50-minute Test on Crystal Chemistry
Lectures 1-7 (see Powerpoints on Website)Lectures 1-7 (see Powerpoints on Website)
Klein Chapters 1 (p. 1-16), 3 (p. 38-103) Klein Chapters 1 (p. 1-16), 3 (p. 38-103) and 4 (p. 107-131)and 4 (p. 107-131)
See CD module 1 for help with ionic See CD module 1 for help with ionic coordinationcoordination
Q & A in Lab on tomorrow (Tuesday)Q & A in Lab on tomorrow (Tuesday)