Embed Size (px)
DESCRIPTION
Lecture 6: Entreprenuership. Part 1: Some Data Sources For Entrepreneurship. Data for Today’s Class. Distribution of Firms by Size and Age (aggregates) Statistics of U.S. Businesses (SUSB) http://www.sba.gov/advo/research/data.html - PowerPoint PPT Presentation
Citation preview

Lecture 6: Entreprenuership

Part 1:Some Data Sources For Entrepreneurship

Data for Today’s Class
• Distribution of Firms by Size and Age (aggregates)
Statistics of U.S. Businesses (SUSB) http://www.sba.gov/advo/research/data.html
Measures number of employees, number of firms, births, deaths, and growth (all in total and by firm size) by detailed industries.
Allows one to compute the distribution of firm size over time by industry.
Large literature trying to explain the size distribution of firms.

Data for Today’s Class
• Micro Data on Small Firms
Survey of Small Business Finances (SSBF)
http://www.federalreserve.gov/ssbf/
Conducted by Board of Governors
1987, 1993, 1998, and 2003 (repeated cross sections)
Measures detailed descriptive and financial data on firms with less than 500 employees (non-agricultural)

Data for Today’s Class
• Micro Data on Small Firms
Kauffman Firm Survey (KFS)
http://www.kauffman.org/research-and-policy/kauffman-firm-survey.aspx
Conducted by Kauffman Foundation
2004 – 2007 (Longitudinal Survey)
Measures detailed descriptive and financial data on small businesses
Starts with new businesses in 2004.
Follows survivors through 2007.

Data for Today’s Class
• Micro Data on Small Firms
PSID (longitudinal)/CPS (some longitudinal/mostly repeated cross sections)
Collects data on the self employed.
Collects data on business owners.
Most micro data empirical work on “entrepreneurs” use household level data where entrepreneur is equated with the self employed or with small business owners.
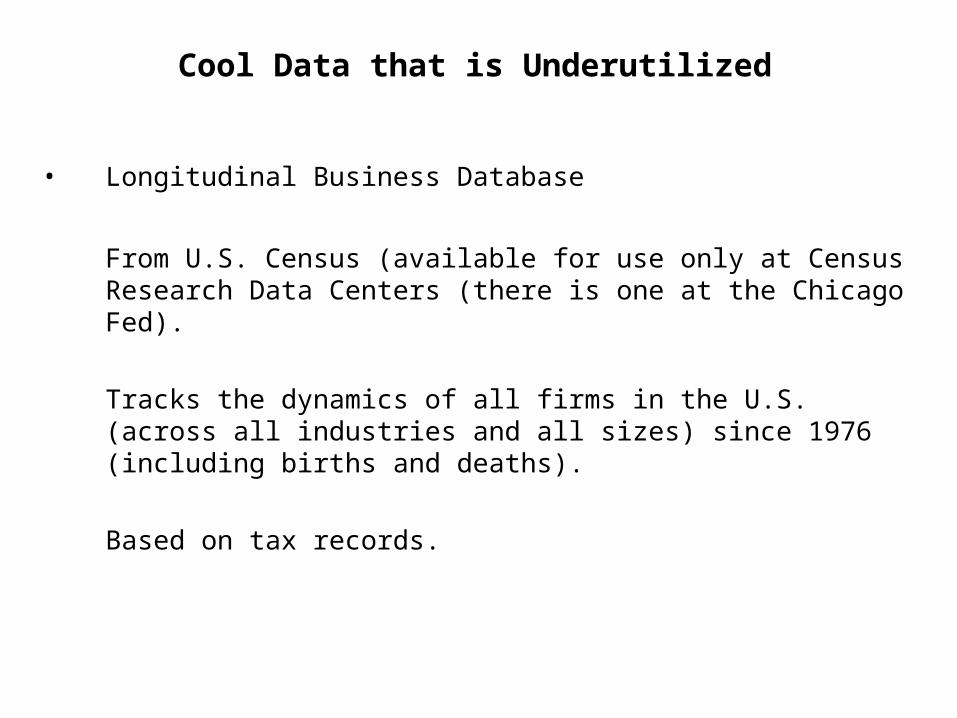
Cool Data that is Underutilized
• Longitudinal Business Database
From U.S. Census (available for use only at Census Research Data Centers (there is one at the Chicago Fed).
Tracks the dynamics of all firms in the U.S. (across all industries and all sizes) since 1976 (including births and deaths).
Based on tax records.

Part 2:Standard Model: Liquidity Constraints and
Small Business Formation

Why Do People Start Businesses?
• Small Business Skills (Innovators) (Schumpter (1934), Evans and Jovanovic (1989))
• Risk Preferences (Kihlstorm and Laffont (1979), Jovanovic (1979))
• “Jack of All Trades” (have better management skills) (Lazear (2005))
Two major questions in the literature:
Why can’t innovation take place in the existing firms?
Can the new firms get financing?

Evans and Jovanovic (1989)
Choice:
Become a worker: Earn wage: (wζ)
Become an “entrepreneur”: Earn income: ( )
where: θ is entrepreneurial ability (know when making choice)k is capital necessary to start a businessζ is returns to scale on capital:
Note: Assume innovations to w and y are uncorrelated.Assume that ability (θ) is uncorrelated with market wage.Assume risk neutrality.
y k
(0,1)
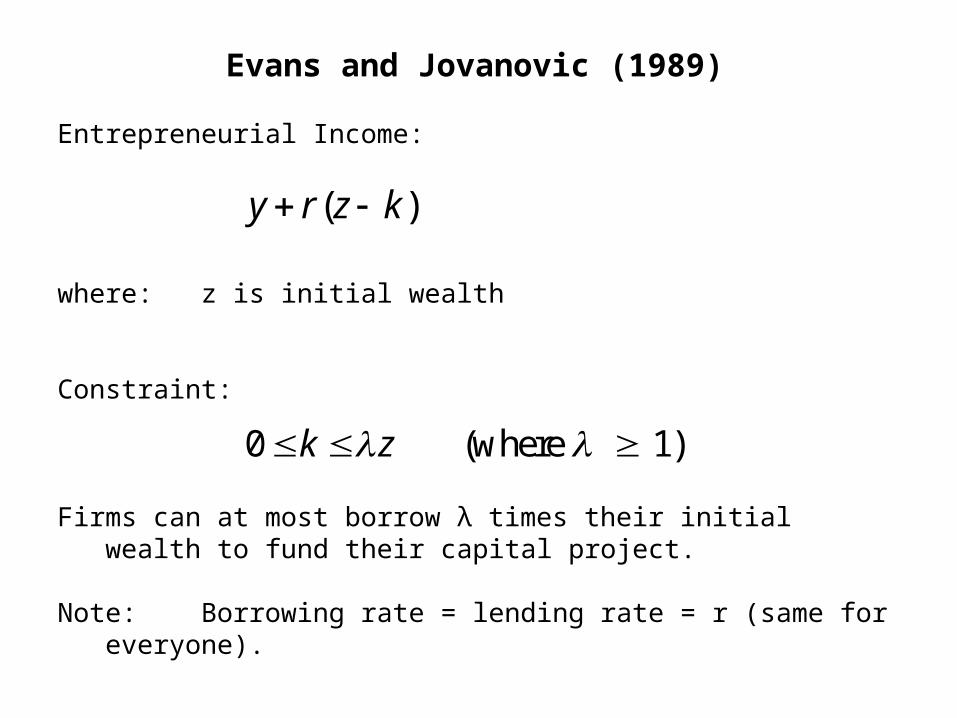
Evans and Jovanovic (1989)
Entrepreneurial Income:
where: z is initial wealth
Constraint:
Firms can at most borrow λ times their initial wealth to fund their capital project.
Note: Borrowing rate = lending rate = r (same for everyone).
( )y r z k
0 (where 1)k z
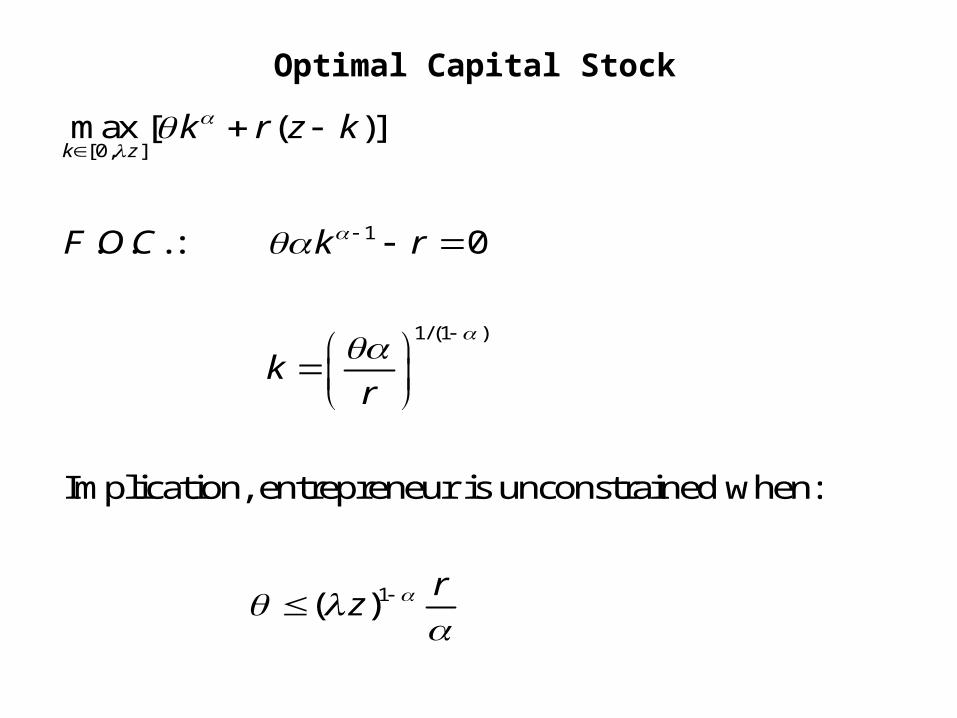
Optimal Capital Stock
[0, ]
1
1/(1 )
1
max [ ( )]
. . . : 0
Implication, entrepreneur is unconstrained when:
( )
k zk r z k
F O C k r
kr
rz
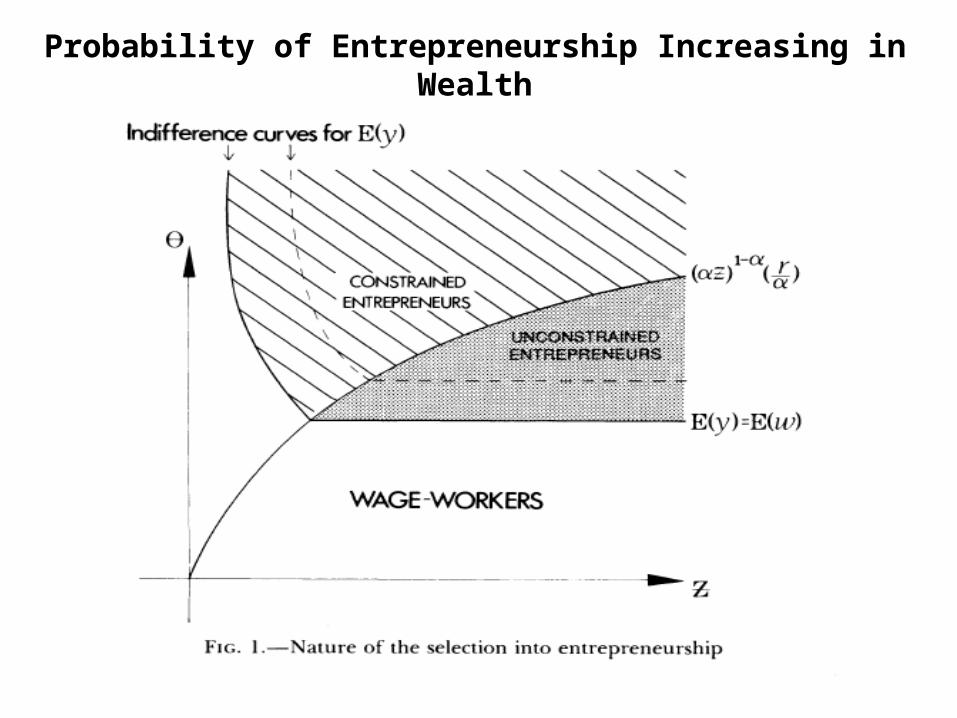
Probability of Entrepreneurship Increasing in Wealth
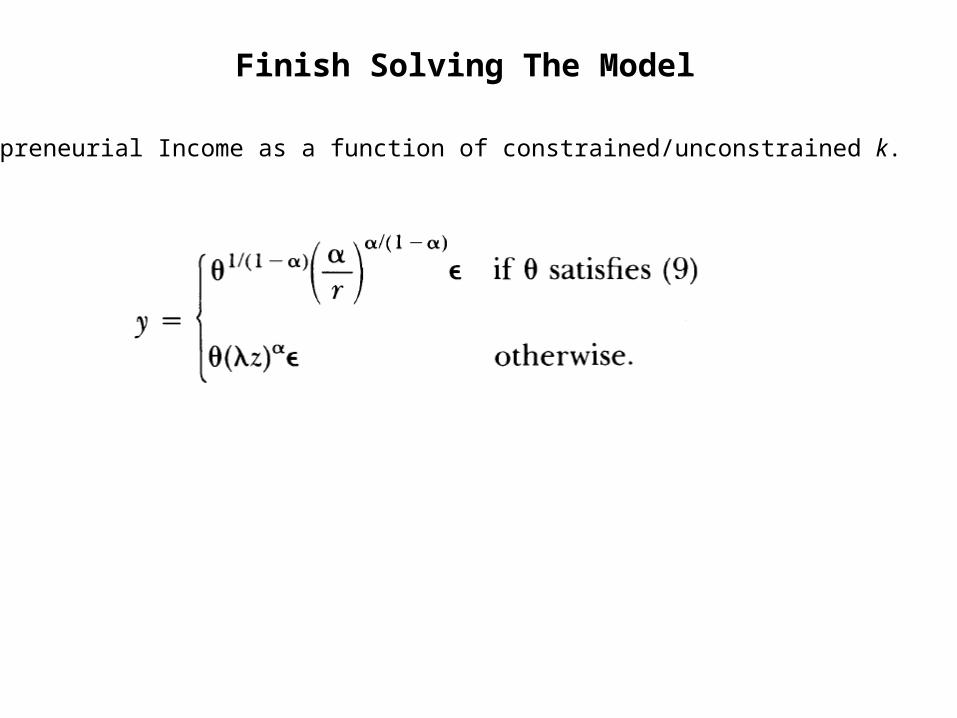
Finish Solving The Model
Entrepreneurial Income as a function of constrained/unconstrained k.
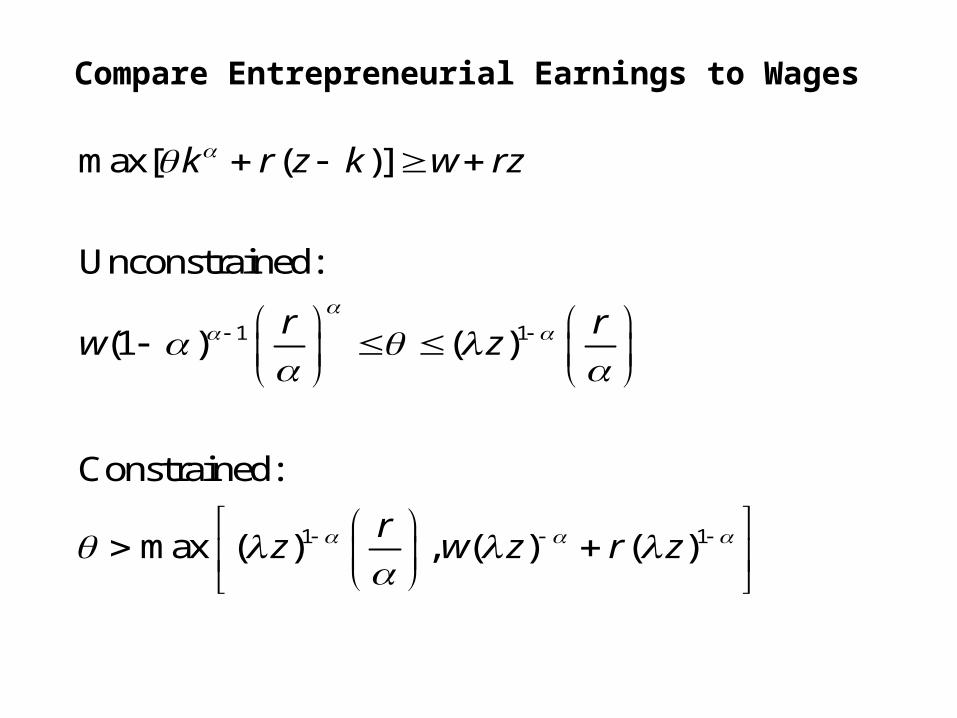
Compare Entrepreneurial Earnings to Wages
1 1
1 1
max[ ( )]
Unconstrained:
(1 ) ( )
Constrained:
max ( ) , ( ) ( )
k r z k w rz
r rw z
rz w z r z

Evans and Jovanovic Conclusions
• Richer households are less bound by liquidity constraints and as a resultare more likely to enter entrepreneurship.
• Should see a positive relationship between initial wealth and entry intosmall business ownership.

Part 3:Testing for the Importance of Liquidity
Constraints
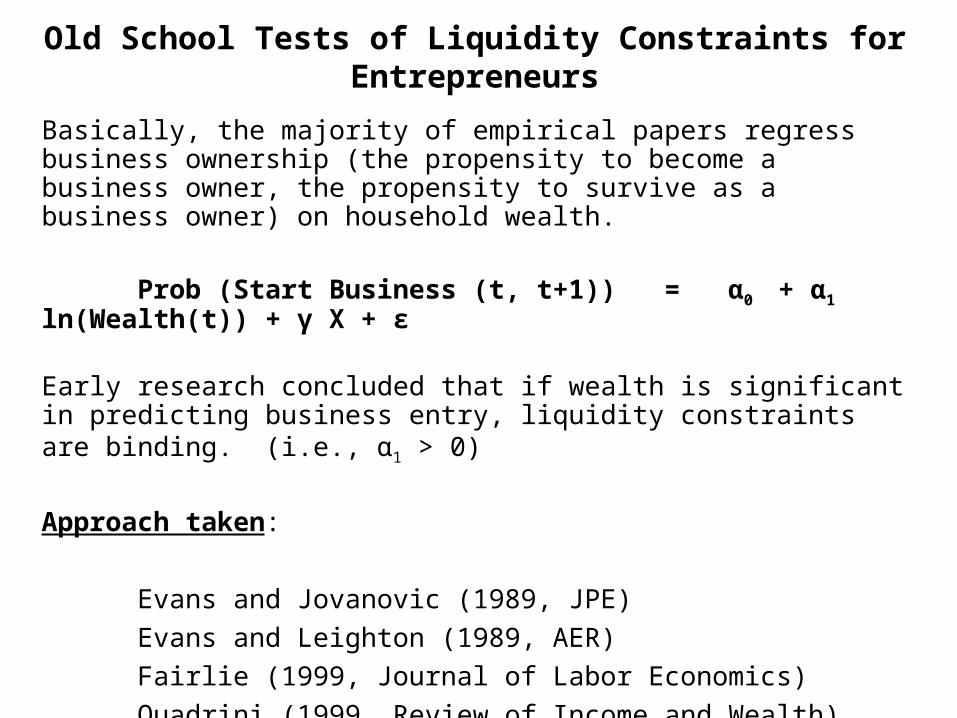
Old School Tests of Liquidity Constraints for Entrepreneurs
Basically, the majority of empirical papers regress business ownership (the propensity to become a business owner, the propensity to survive as a business owner) on household wealth.
Prob (Start Business (t, t+1)) = α0 + α1 ln(Wealth(t)) + γ X + ε
Early research concluded that if wealth is significant in predicting business entry, liquidity constraints are binding. (i.e., α1 > 0)
Approach taken:
Evans and Jovanovic (1989, JPE)
Evans and Leighton (1989, AER)
Fairlie (1999, Journal of Labor Economics)
Quadrini (1999, Review of Income and Wealth)
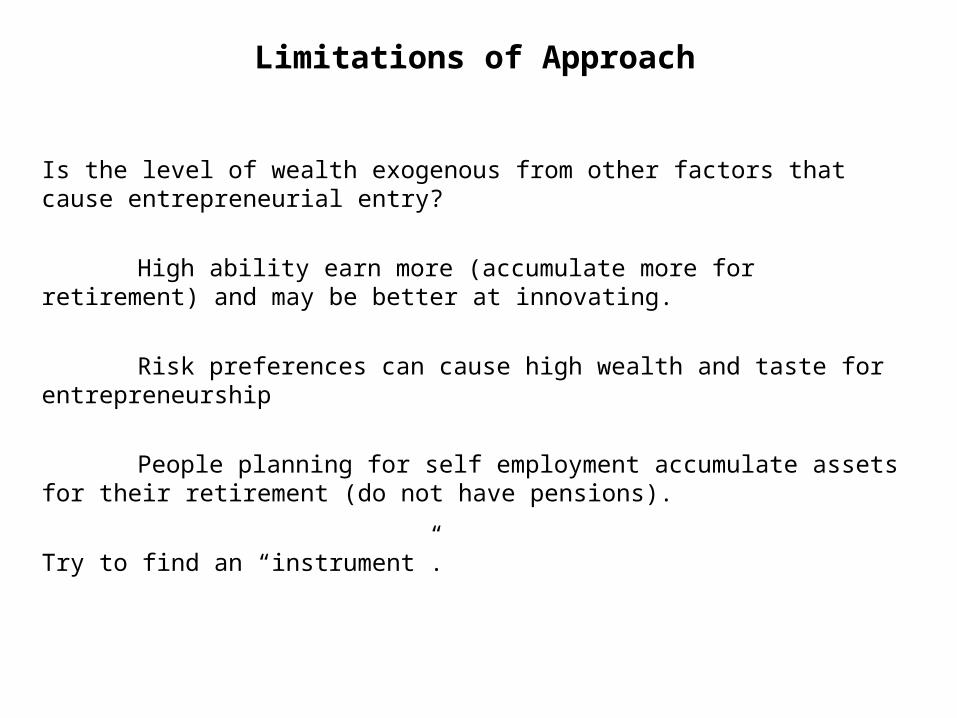
Limitations of Approach
Is the level of wealth exogenous from other factors that cause entrepreneurial entry?
High ability earn more (accumulate more for retirement) and may be better at innovating.
Risk preferences can cause high wealth and taste for entrepreneurship
People planning for self employment accumulate assets for their retirement (do not have pensions).
Try to find an “instrument”.
20
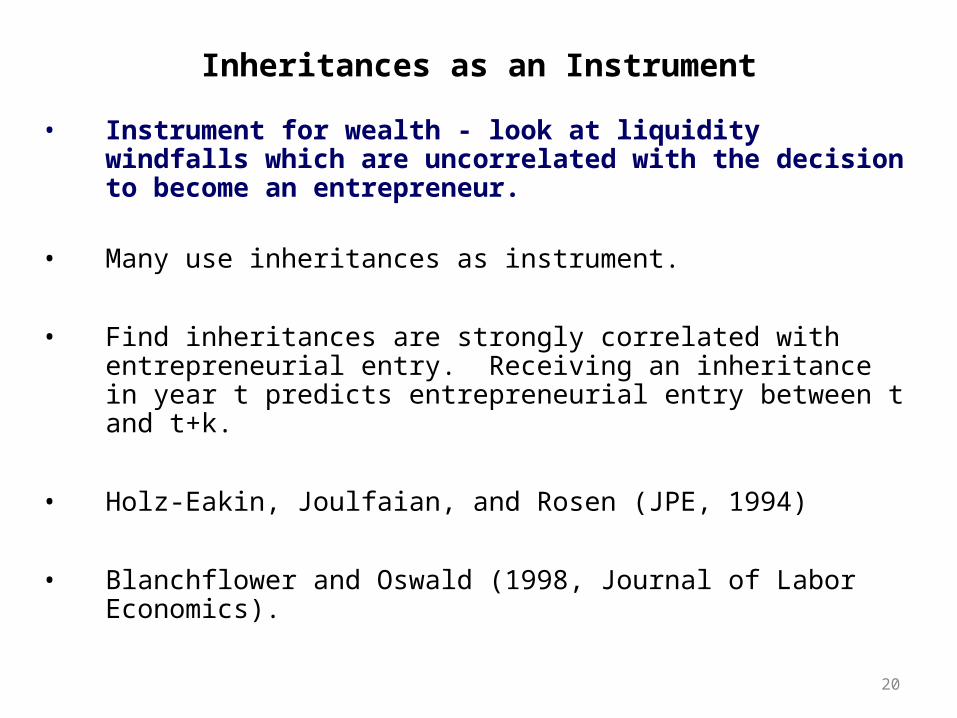
Inheritances as an Instrument
• Instrument for wealth - look at liquidity windfalls which are uncorrelated with the decision to become an entrepreneur.
• Many use inheritances as instrument.
• Find inheritances are strongly correlated with entrepreneurial entry. Receiving an inheritance in year t predicts entrepreneurial entry between t and t+k.
• Holz-Eakin, Joulfaian, and Rosen (JPE, 1994)
• Blanchflower and Oswald (1998, Journal of Labor Economics).
21
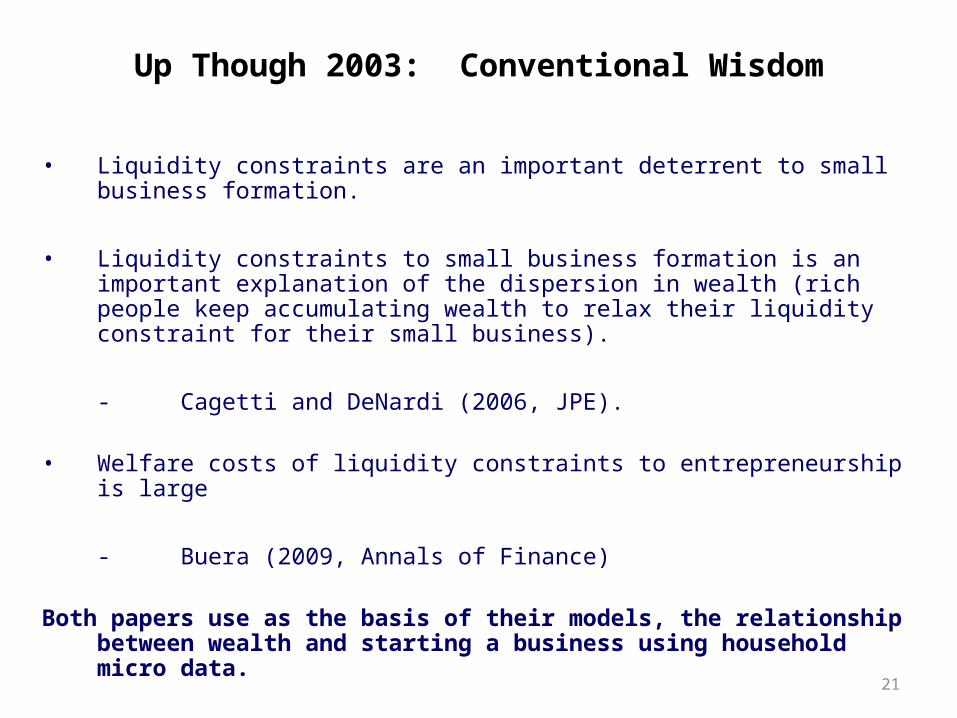
Up Though 2003: Conventional Wisdom
• Liquidity constraints are an important deterrent to small business formation.
• Liquidity constraints to small business formation is an important explanation of the dispersion in wealth (rich people keep accumulating wealth to relax their liquidity constraint for their small business).
- Cagetti and DeNardi (2006, JPE).
• Welfare costs of liquidity constraints to entrepreneurship is large
- Buera (2009, Annals of Finance)
Both papers use as the basis of their models, the relationship between wealth and starting a business using household micro data.

22
A Re-Evaluation of The Facts
Liquidity Constraints, Household Wealth and Entrepreneurship?
Erik HurstUniversity of Chicago and NBER
Annamaria LusardiDartmouth College and NBER
23
Goal
• Are people interpreting the data correctly?
This paper
• I think that the relationship between wealth and small business start-up using micro data (or firm level data) is not what people think.
Paper with Ben (coming later)
• In the micro data, do small business match our conceptual models of “entrepreneurs”?
• If not, what can explain the propensity to become small business owners in the data?
24
Some Facts About Small Business Owners
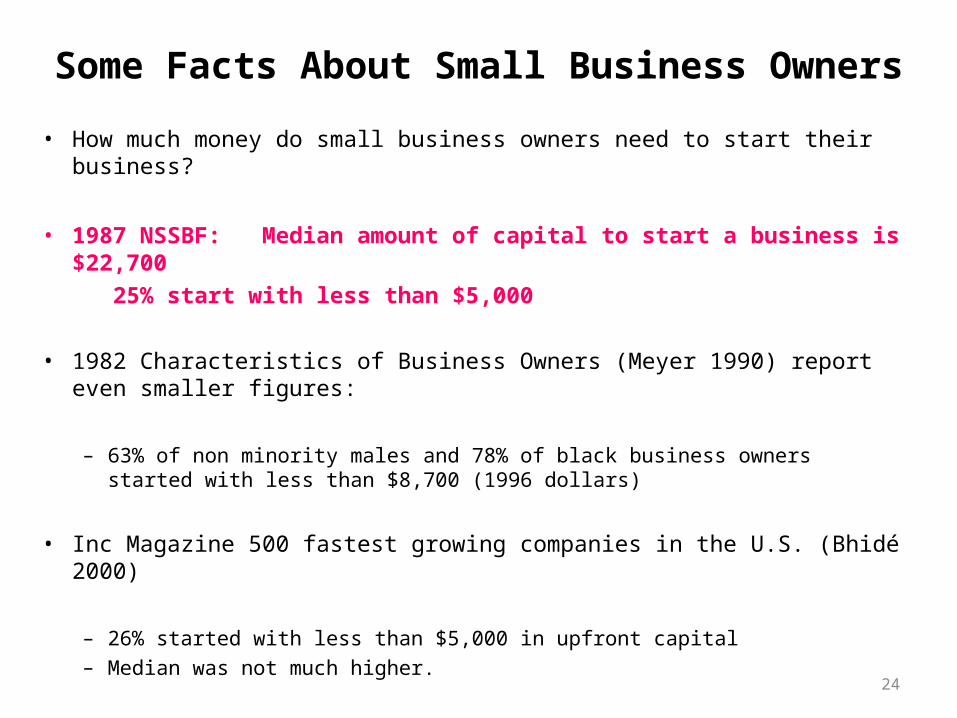
• How much money do small business owners need to start their business?
• 1987 NSSBF: Median amount of capital to start a business is $22,700 25% start with less than $5,000
• 1982 Characteristics of Business Owners (Meyer 1990) report even smaller figures:
– 63% of non minority males and 78% of black business owners started with less than $8,700 (1996 dollars)
• Inc Magazine 500 fastest growing companies in the U.S. (Bhidé 2000)
– 26% started with less than $5,000 in upfront capital– Median was not much higher.
25
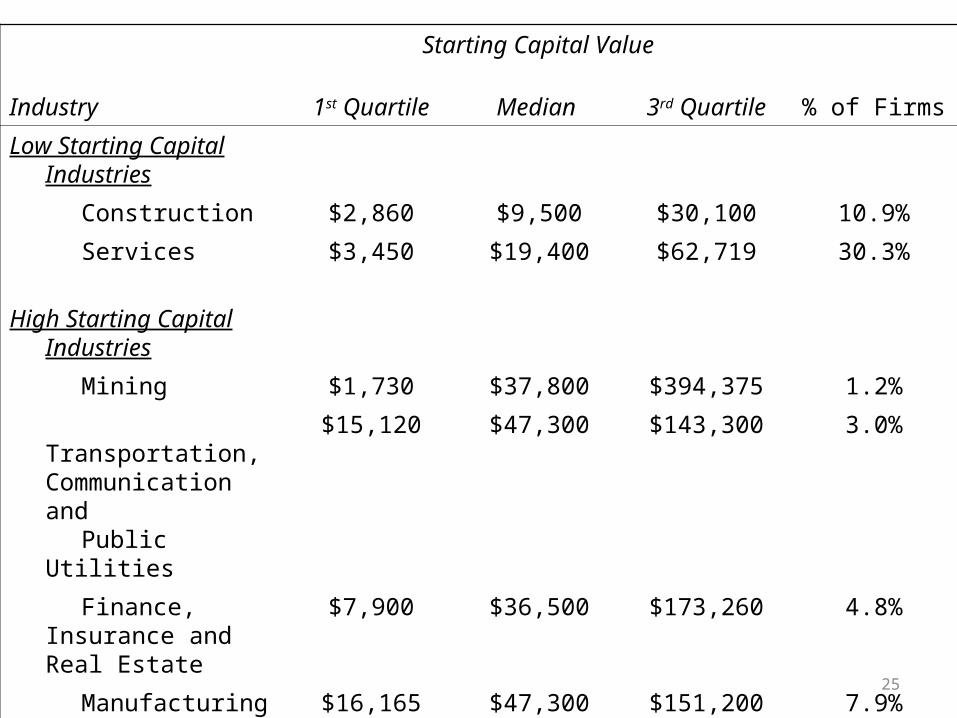
Starting Capital Value
Industry 1st Quartile Median 3rd Quartile % of Firms
Low Starting Capital Industries
Construction $2,860 $9,500 $30,100 10.9%
Services $3,450 $19,400 $62,719 30.3%
High Starting Capital Industries
Mining $1,730 $37,800 $394,375 1.2%
Transportation, Communication and
Public Utilities
$15,120 $47,300 $143,300 3.0%
Finance, Insurance and Real Estate
$7,900 $36,500 $173,260 4.8%
Manufacturing $16,165 $47,300 $151,200 7.9%
Wholesale Trade $11,010 $41,400 $145,860 8.5%
Retail Trade $21,880 $55,200 $118,150 33.3%

26
What We Do in this Paper
• Formally Test The Importance of Liquidity Constraints and Business Ownership
– Examine the relationship between own wealth and business entry– Examine the relationship between parental wealth and business entry– Look at the wealth/business entry relationship by types of business
– Instruments for wealth changes
• Inheritances• Capital gains on housing.
– Look at survival probabilities
27
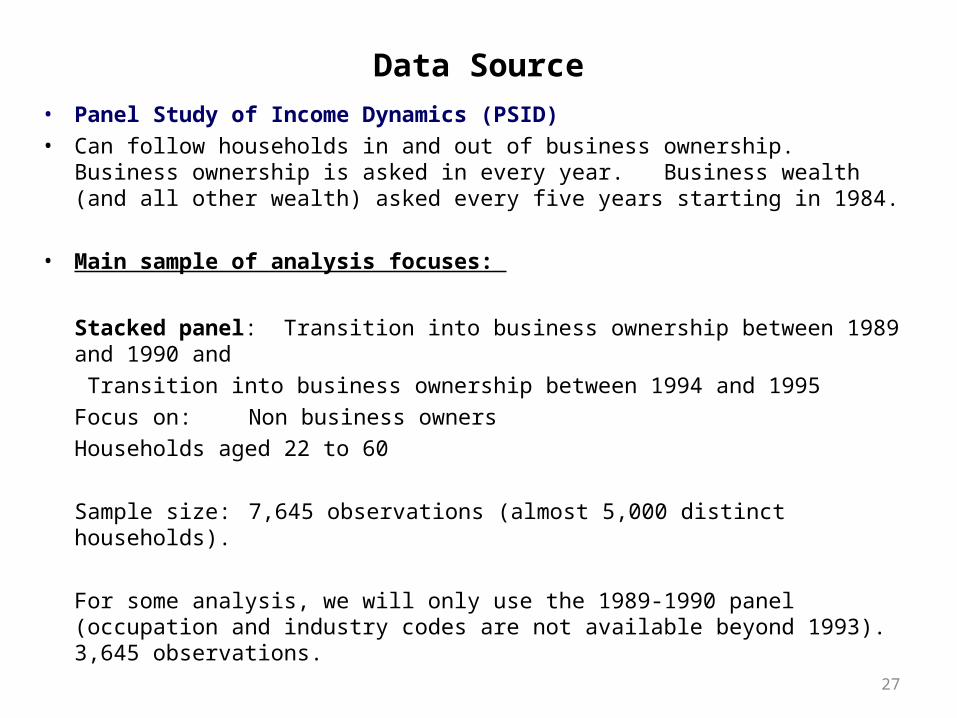
Data Source• Panel Study of Income Dynamics (PSID)• Can follow households in and out of business ownership. Business ownership is
asked in every year. Business wealth (and all other wealth) asked every five years starting in 1984.
• Main sample of analysis focuses:
Stacked panel: Transition into business ownership between 1989 and 1990 and Transition into business ownership between 1994 and 1995
Focus on: Non business ownersHouseholds aged 22 to 60
Sample size: 7,645 observations (almost 5,000 distinct households).
For some analysis, we will only use the 1989-1990 panel (occupation and industry codes are not available beyond 1993). 3,645 observations.
28
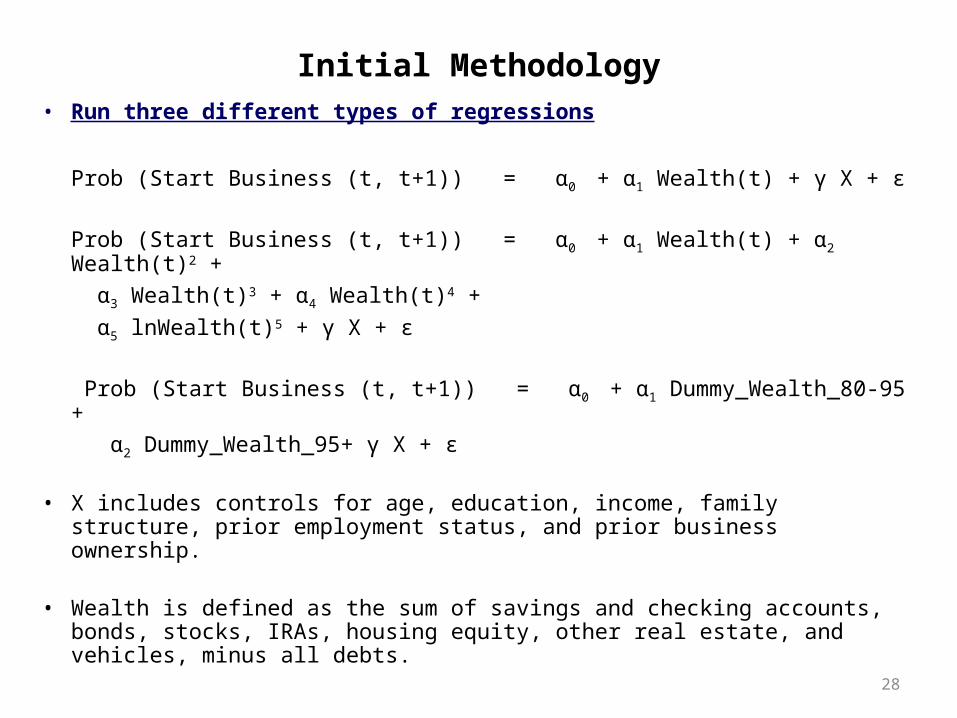
Initial Methodology• Run three different types of regressions
Prob (Start Business (t, t+1)) = α0 + α1 Wealth(t) + γ X + ε
Prob (Start Business (t, t+1)) = α0 + α1 Wealth(t) + α2 Wealth(t)2 + α3 Wealth(t)3 + α4 Wealth(t)4 + α5 lnWealth(t)5 + γ X + ε
Prob (Start Business (t, t+1)) = α0 + α1 Dummy_Wealth_80-95 + α2 Dummy_Wealth_95+ γ X + ε
• X includes controls for age, education, income, family structure, prior employment status, and prior business ownership.
• Wealth is defined as the sum of savings and checking accounts, bonds, stocks, IRAs, housing equity, other real estate, and vehicles, minus all debts.
29
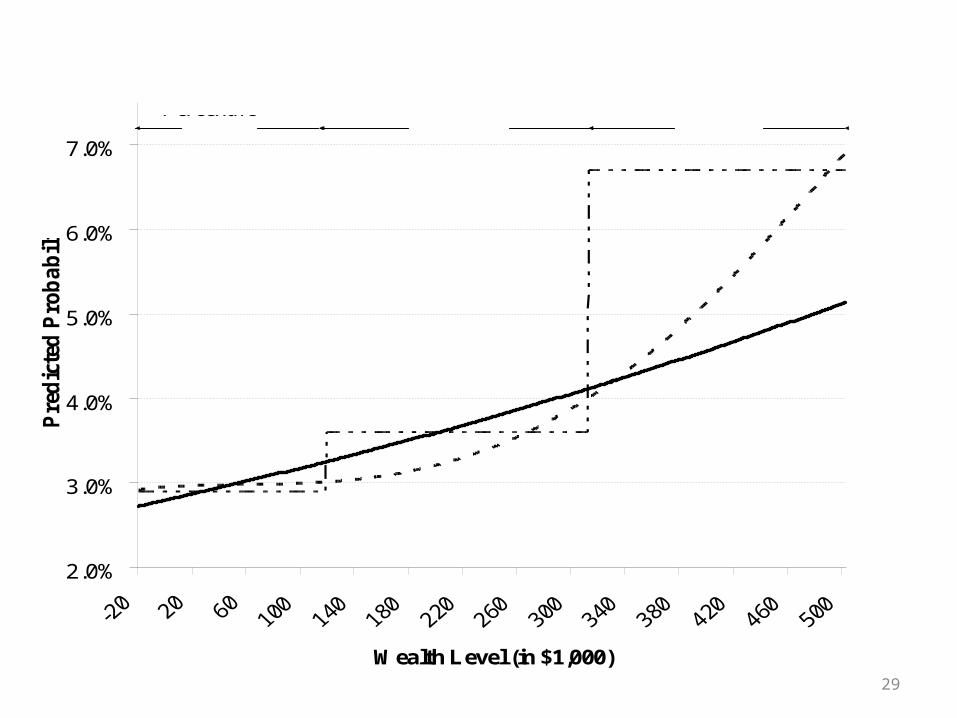
2.0%
3.0%
4.0%
5.0%
6.0%
7.0%
Wealth Level (in $1,000)
Pre
dic
ted
Pro
ba
bil
ity
0-80th Percentile 80th - 95th Percentile 95th-98th Percentile
30
31
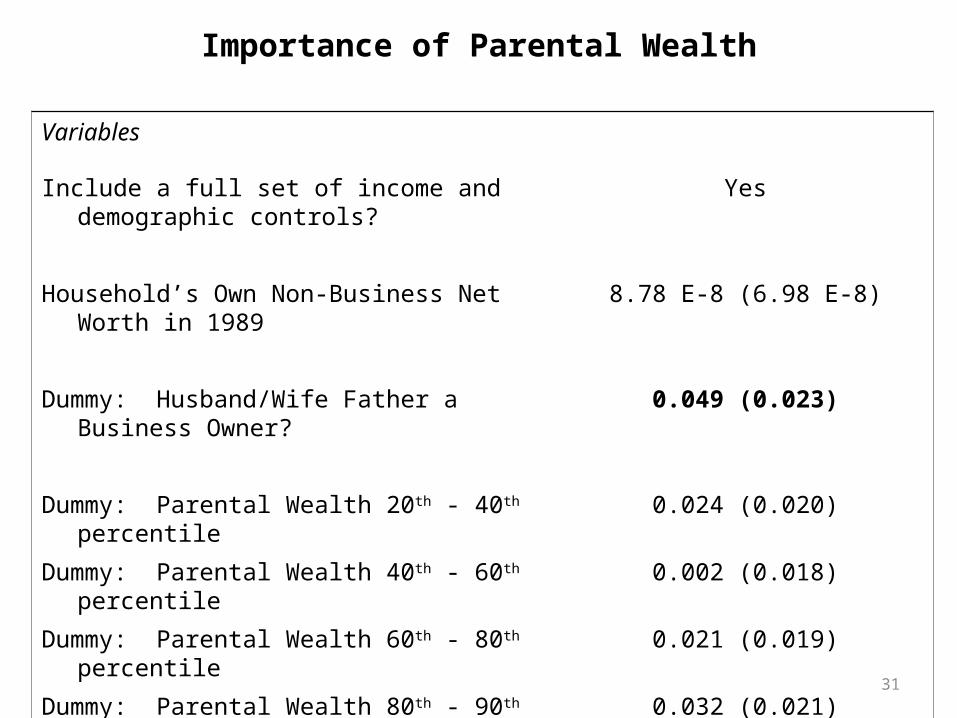
Importance of Parental Wealth
Variables
Include a full set of income and demographic controls?
Yes
Household’s Own Non-Business Net Worth in 1989 8.78 E-8 (6.98 E-8)
Dummy: Husband/Wife Father a Business Owner? 0.049 (0.023)
Dummy: Parental Wealth 20th - 40th percentile 0.024 (0.020)
Dummy: Parental Wealth 40th - 60th percentile 0.002 (0.018)
Dummy: Parental Wealth 60th - 80th percentile 0.021 (0.019)
Dummy: Parental Wealth 80th - 90th percentile 0.032 (0.021)
Dummy: Parental Wealth 90th - 97th percentile 0.025 (0.024)
Dummy: Parental Wealth > 97th percentile 0.072 (0.039)
32
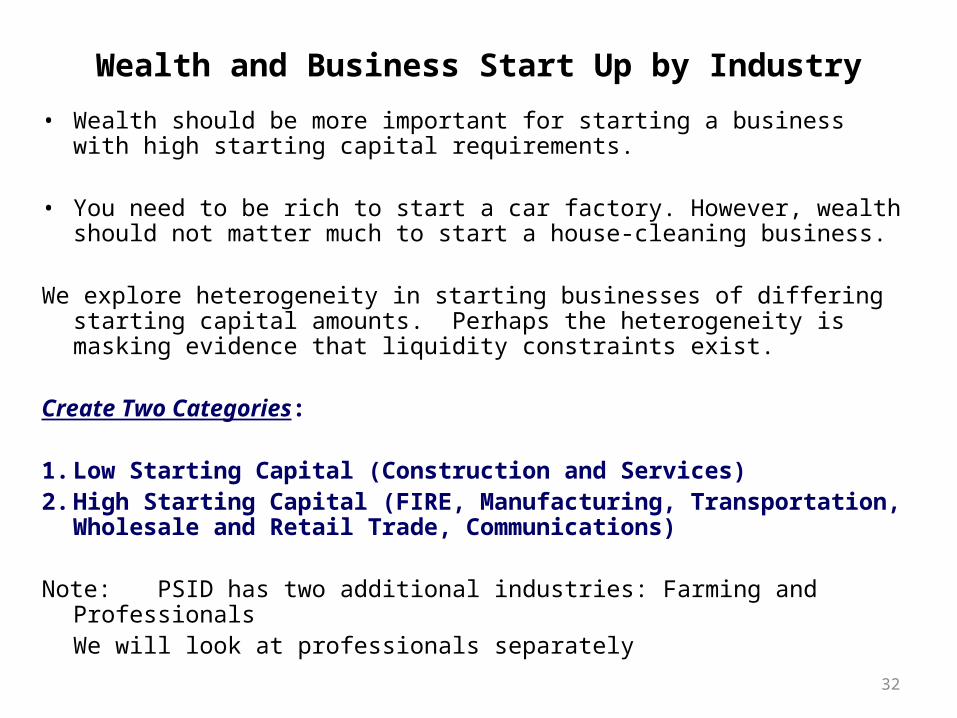
Wealth and Business Start Up by Industry
• Wealth should be more important for starting a business with high starting capital requirements.
• You need to be rich to start a car factory. However, wealth should not matter much to start a house-cleaning business.
We explore heterogeneity in starting businesses of differing starting capital amounts. Perhaps the heterogeneity is masking evidence that liquidity constraints exist.
Create Two Categories:
1. Low Starting Capital (Construction and Services)2. High Starting Capital (FIRE, Manufacturing, Transportation, Wholesale and
Retail Trade, Communications)
Note: PSID has two additional industries: Farming and ProfessionalsWe will look at professionals separately
33
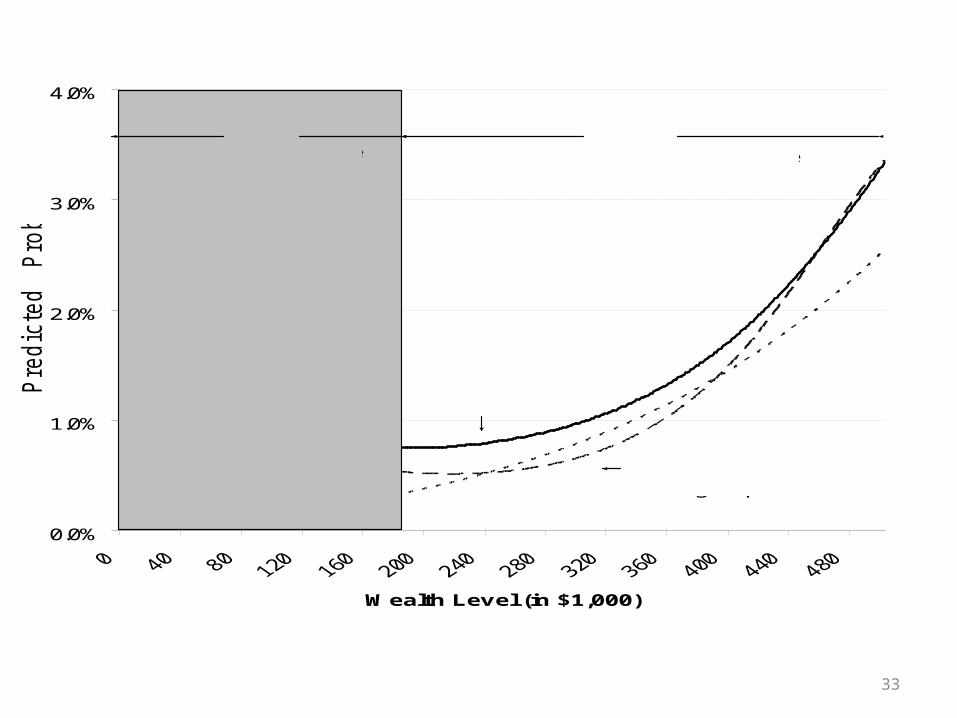
0.0%
1.0%
2.0%
3.0%
4.0%
Wealth Level (in $1,000)
Pre
dic
ted
P
rob
ab
ilit
y
High Starting Capital Industries
Low Starting Capital IndustriesProfessional Industries
0-90th Percentile 90th - 98th Percentile
34
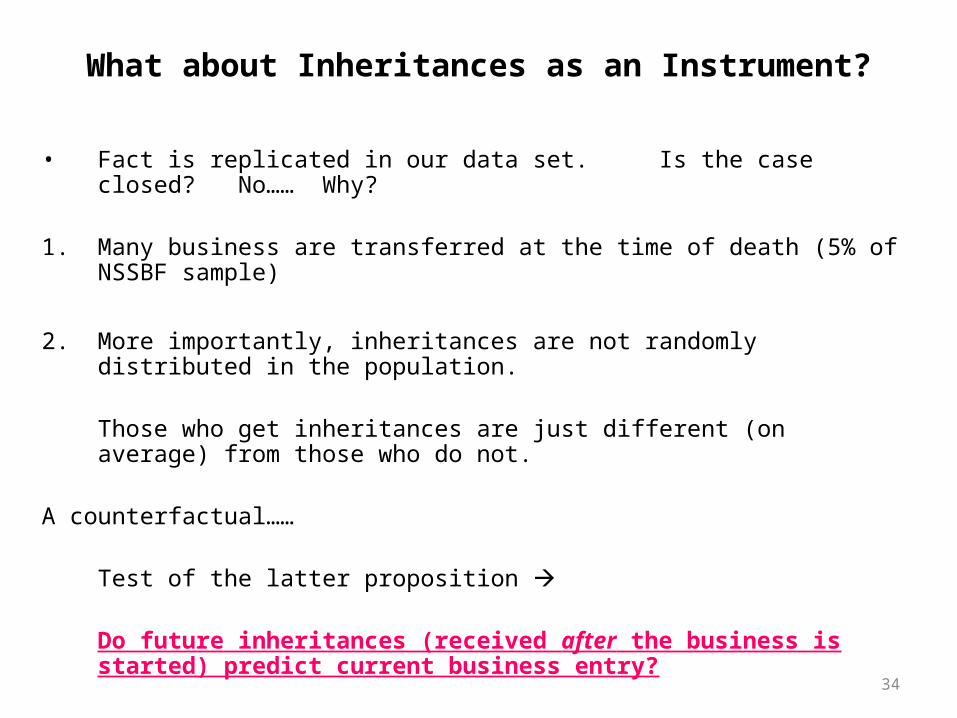
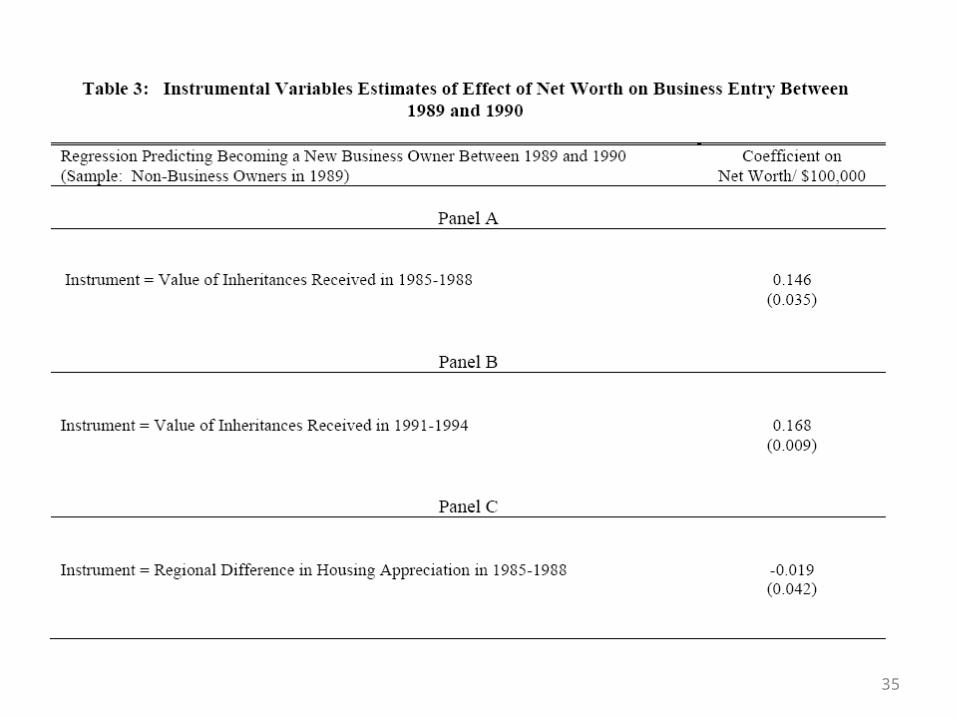
What about Inheritances as an Instrument?
• Fact is replicated in our data set. Is the case closed? No…… Why?
1. Many business are transferred at the time of death (5% of NSSBF sample)
2. More importantly, inheritances are not randomly distributed in the population.
Those who get inheritances are just different (on average) from those who do not.
A counterfactual……
Test of the latter proposition
Do future inheritances (received after the business is started) predict current business entry?
35
36
A New InstrumentWe use an alternative measure of liquidity: Regional variation in housing prices.
Much evidence that households do borrow against home equity to sustain consumption or finance investment projects.
– Brady, Canner and Maki (2000) – 20% of those who removed equity during the late 1990s when refinancing used it to fund business investment.
– Hurst and Stafford (2002) – find household who lost their jobs in the early 1990s used home equity to prop up consumption.
We predict that households who receive increases in home equity – all else equal – should have access to more liquidity.
Are they more likely to start a business? We find NO effect of housing capital gains on business entry!
37
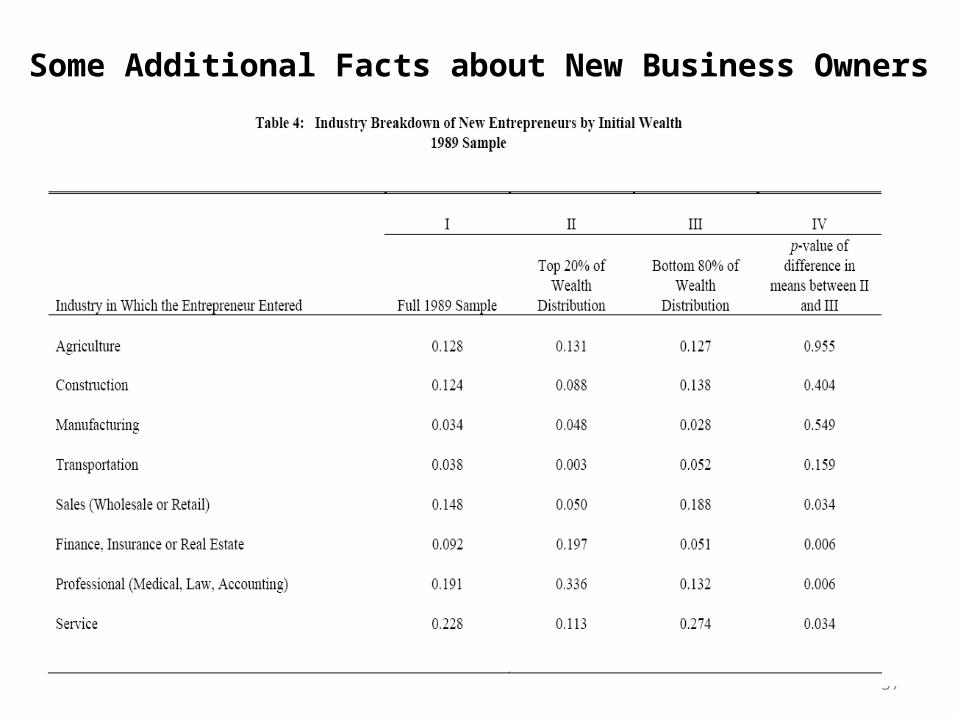
Some Additional Facts about New Business Owners
38
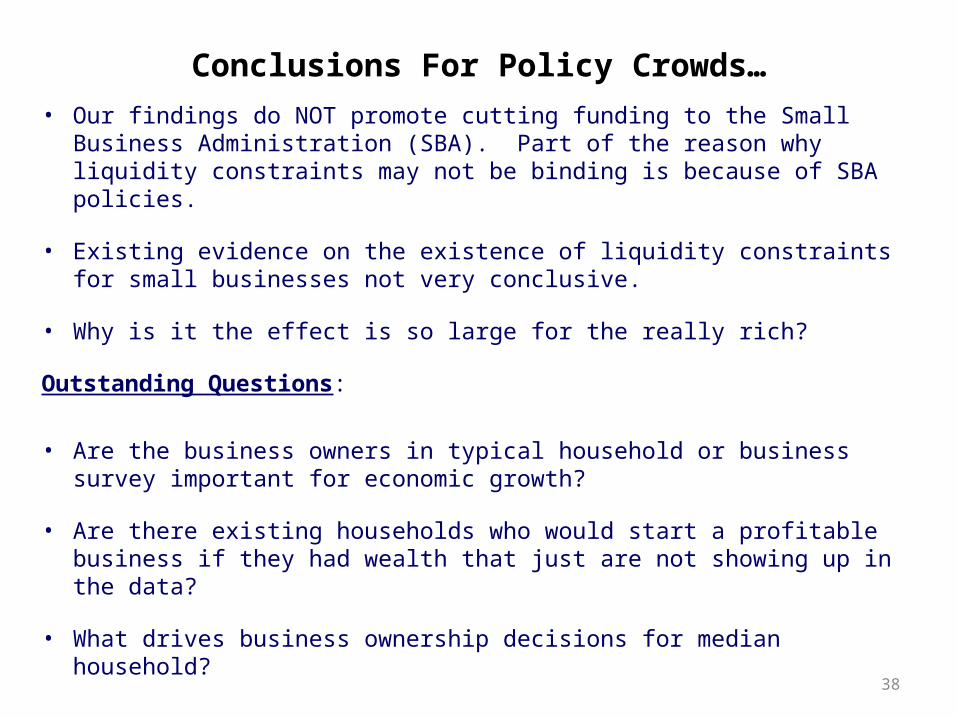
Conclusions For Policy Crowds…
• Our findings do NOT promote cutting funding to the Small Business Administration (SBA). Part of the reason why liquidity constraints may not be binding is because of SBA policies.
• Existing evidence on the existence of liquidity constraints for small businesses not very conclusive.
• Why is it the effect is so large for the really rich?
Outstanding Questions:
• Are the business owners in typical household or business survey important for economic growth?
• Are there existing households who would start a profitable business if they had wealth that just are not showing up in the data?
• What drives business ownership decisions for median household?

Part 5:The Non-Pecuniary Benefits of “Entrepreneurship”
40
Some Interesting Facts…
• Does the data on small business owners match the concept of entrepreneurship in our model?
41
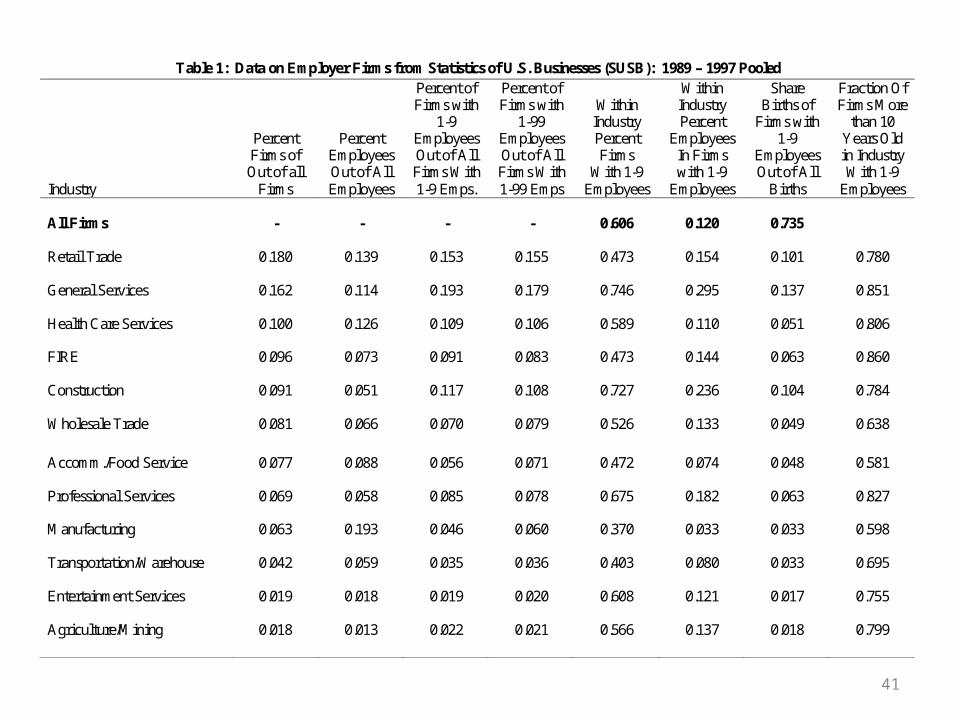
Table 1: Data on Employer Firms from Statistics of U.S. Businesses (SUSB): 1989 – 1997 Pooled Industry
Percent Firms of Out of all
Firms
Percent Employees Out of All Employees
Percent of Firms with
1-9 Employees Out of All Firms With 1-9 Emps.
Percent of Firms with
1-99 Employees Out of All Firms With 1-99 Emps
Within
Industry Percent Firms
With 1-9 Employees
Within Industry Percent
Employees In Firms with 1-9
Employees
Share Births of
Firms with 1-9
Employees Out of All
Births
Fraction Of Firms More
than 10 Years Old in Industry With 1-9
Employees All Firms - - - - 0.606 0.120 0.735
Retail Trade 0.180 0.139 0.153 0.155 0.473 0.154 0.101 0.780
General Services 0.162 0.114 0.193 0.179 0.746 0.295 0.137 0.851
Health Care Services 0.100 0.126 0.109 0.106 0.589 0.110 0.051 0.806
FIRE 0.096 0.073 0.091 0.083 0.473 0.144 0.063 0.860
Construction 0.091 0.051 0.117 0.108 0.727 0.236 0.104 0.784
Wholesale Trade 0.081 0.066 0.070 0.079 0.526 0.133 0.049 0.638
Accomm./Food Service 0.077 0.088 0.056 0.071 0.472 0.074 0.048 0.581
Professional Services 0.069 0.058 0.085 0.078 0.675 0.182 0.063 0.827
Manufacturing 0.063 0.193 0.046 0.060 0.370 0.033 0.033 0.598
Transportation/Warehouse 0.042 0.059 0.035 0.036 0.403 0.080 0.033 0.695
Entertainment Services 0.019 0.018 0.019 0.020 0.608 0.121 0.017 0.755
Agriculture/Mining 0.018 0.013 0.022 0.021 0.566 0.137 0.018 0.799
42
7
8
9
10
12
13
14
15
16
1720
21
2223 2425
26
27
2829
30
31
323334
3536
3738
39
41 42
444546 47
48
49
50
51
52
53
54 55
56
57
58
59
60
61
62
6364
65
67
70
72
7375
7678
79
80
81
82 8384
8687
89
7
8
9
10
12
13
14
15
16
1720
21
2223 2425
26
27
2829
30
31
323334
3536
3738
39
41 42
444546 47
48
49
50
51
52
53
54 55
56
57
58
59
60
61
62
6364
65
67
70
72
7375
7678
79
80
81
82 8384
8687
89
7
8
9
10
12
13
14
15
16
1720
21
2223 2425
26
27
2829
30
31
323334
3536
3738
39
41 42
444546 47
48
49
50
51
52
53
54 55
56
57
58
59
60
61
62
6364
65
67
70
72
7375
7678
79
80
81
82 8384
8687
89
7
8
9
10
12
13
14
15
16
1720
21
2223 2425
26
27
2829
30
31
323334
3536
3738
39
41 42
444546 47
48
49
50
51
52
53
54 55
56
57
58
59
60
61
62
6364
65
67
70
72
7375
7678
79
80
81
82 8384
8687
89
7
8
9
10
12
13
14
15
16
1720
21
2223 2425
26
27
2829
30
31
323334
3536
3738
39
41 42
444546 47
48
49
50
51
52
53
54 55
56
57
58
59
60
61
62
6364
65
67
70
72
7375
7678
79
80
81
82 8384
8687
89
7
8
9
10
12
13
14
15
16
1720
21
2223 2425
26
27
2829
30
31
323334
3536
3738
39
41 42
444546 47
48
49
50
51
52
53
54 55
56
57
58
59
60
61
62
6364
65
67
70
72
7375
7678
79
80
81
82 8384
8687
89
7
8
9
10
12
13
14
15
16
1720
21
2223 2425
26
27
2829
30
31
323334
3536
3738
39
41 42
444546 47
48
49
50
51
52
53
54 55
56
57
58
59
60
61
62
6364
65
67
70
72
7375
7678
79
80
81
82 8384
8687
89
7
8
9
10
12
13
14
15
16
1720
21
2223 2425
26
27
2829
30
31
323334
3536
3738
39
41 42
444546 47
48
49
50
51
52
53
54 55
56
57
58
59
60
61
62
6364
65
67
70
72
7375
7678
79
80
81
82 8384
8687
89
7
8
9
10
12
13
14
15
16
1720
21
2223 2425
26
27
2829
30
31
323334
3536
3738
39
41 42
444546 47
48
49
50
51
52
53
54 55
56
57
58
59
60
61
62
6364
65
67
70
72
7375
7678
79
80
81
82 8384
8687
89
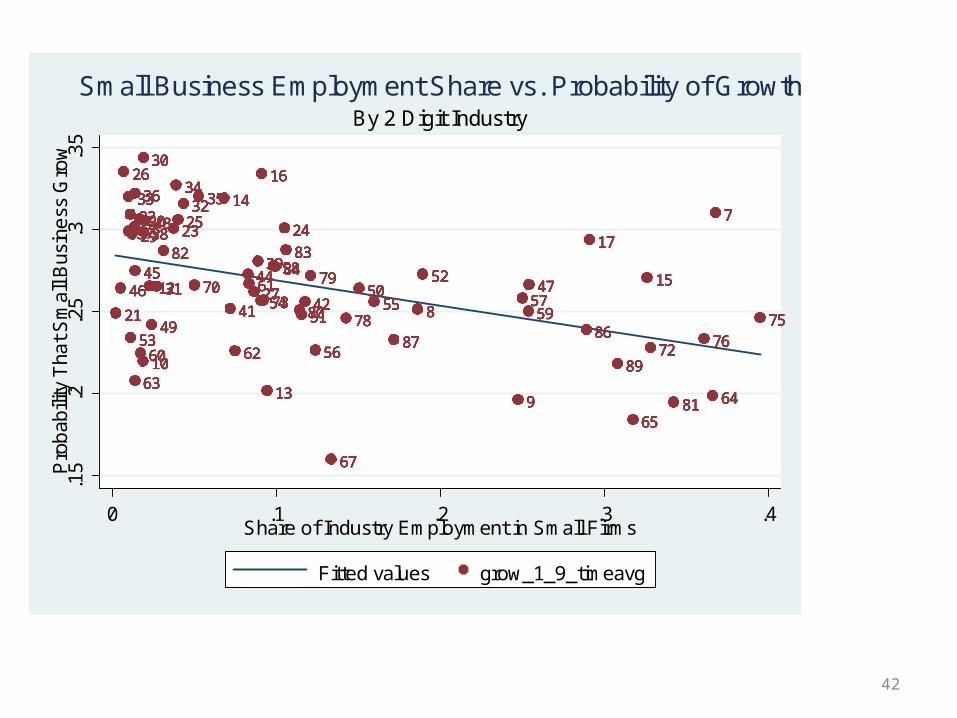
.15
.2.2
5.3
.35
Pro
bab
ility
Tha
t Sm
all B
usin
ess
Gro
w
0 .1 .2 .3 .4Share of Industry Employment in Small Firms
Fitted values grow_1_9_timeavg
By 2 Digit IndustrySmall Business Employment Share vs. Probability of Growth
43
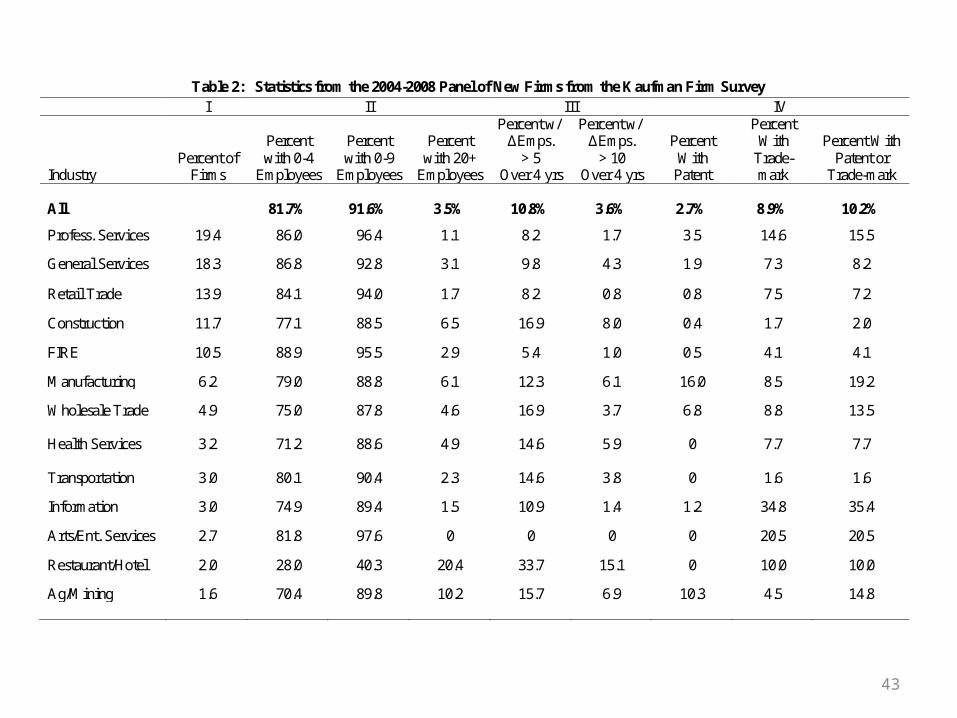
Table 2: Statistics from the 2004-2008 Panel of New Firms from the Kaufman Firm Survey I II III IV Industry
Percent of Firms
Percent with 0-4
Employees
Percent with 0-9
Employees
Percent
with 20+ Employees
Percent w/ ΔEmps.
> 5 Over 4 yrs
Percent w/ ΔEmps.
> 10 Over 4 yrs
Percent
With Patent
Percent With
Trade- mark
Percent With
Patent or Trade-mark
All 81.7% 91.6% 3.5% 10.8% 3.6% 2.7% 8.9% 10.2%
Profess. Services 19.4 86.0 96.4 1.1 8.2 1.7 3.5 14.6 15.5
General Services 18.3 86.8 92.8 3.1 9.8 4.3 1.9 7.3 8.2
Retail Trade 13.9 84.1 94.0 1.7 8.2 0.8 0.8 7.5 7.2
Construction 11.7 77.1 88.5 6.5 16.9 8.0 0.4 1.7 2.0
FIRE 10.5 88.9 95.5 2.9 5.4 1.0 0.5 4.1 4.1
Manufacturing 6.2 79.0 88.8 6.1 12.3 6.1 16.0 8.5 19.2
Wholesale Trade 4.9 75.0 87.8 4.6 16.9 3.7 6.8 8.8 13.5 Health Services 3.2 71.2 88.6 4.9 14.6 5.9 0 7.7 7.7 Transportation 3.0 80.1 90.4 2.3 14.6 3.8 0 1.6 1.6
Information 3.0 74.9 89.4 1.5 10.9 1.4 1.2 34.8 35.4
Arts/Ent. Services 2.7 81.8 97.6 0 0 0 0 20.5 20.5
Restaurant/Hotel 2.0 28.0 40.3 20.4 33.7 15.1 0 10.0 10.0
Ag/Mining 1.6 70.4 89.8 10.2 15.7 6.9 10.3 4.5 14.8
44
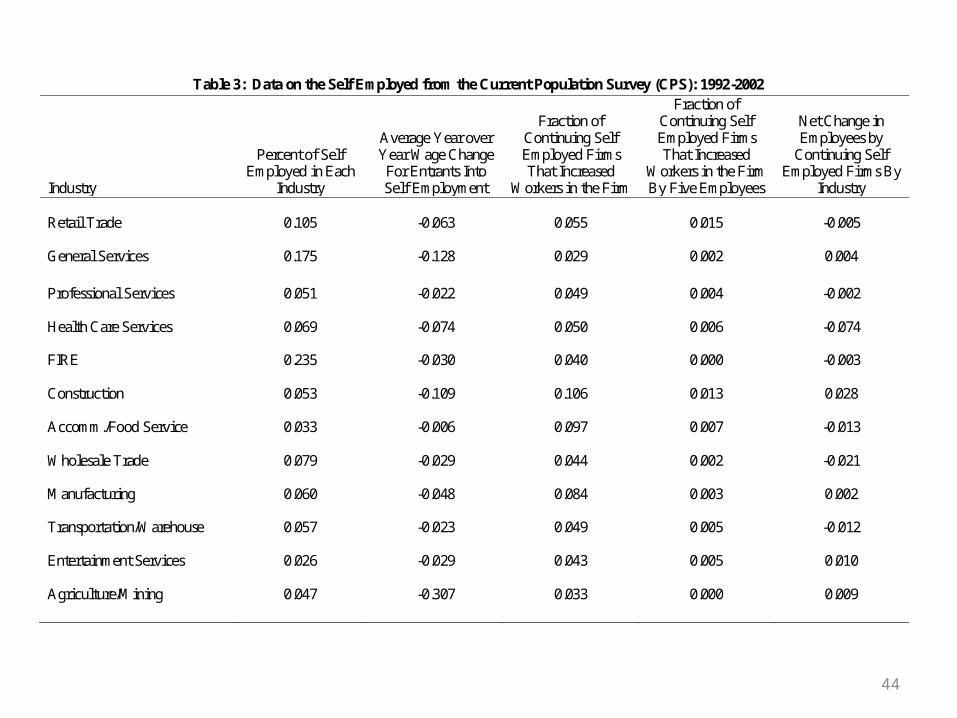
Table 3: Data on the Self Employed from the Current Population Survey (CPS): 1992-2002 Industry
Percent of Self
Employed in Each Industry
Average Year over Year Wage Change
For Entrants Into Self Employment
Fraction of
Continuing Self Employed Firms That Increased
Workers in the Firm
Fraction of Continuing Self Employed Firms That Increased
Workers in the Firm By Five Employees
Net Change in Employees by
Continuing Self Employed Firms By
Industry Retail Trade 0.105 -0.063 0.055 0.015 -0.005
General Services 0.175 -0.128 0.029 0.002 0.004
Professional Services 0.051 -0.022 0.049 0.004 -0.002
Health Care Services 0.069 -0.074 0.050 0.006 -0.074
FIRE 0.235 -0.030 0.040 0.000 -0.003
Construction 0.053 -0.109 0.106 0.013 0.028
Accomm./Food Service 0.033 -0.006 0.097 0.007 -0.013
Wholesale Trade 0.079 -0.029 0.044 0.002 -0.021
Manufacturing 0.060 -0.048 0.084 0.003 0.002
Transportation/Warehouse 0.057 -0.023 0.049 0.005 -0.012
Entertainment Services 0.026 -0.029 0.043 0.005 0.010
Agriculture/Mining 0.047 -0.307 0.033 0.000 0.009
45
Two Additional Results of
• Moskowitz and Vissing Jorgensen (AER 2002)
“Private Equity Puzzle”….Measured risk adjusted return to public equity is much higher than the measured risk adjusted return to private equity.
• Hamilton (JPE 2000)
Wages of individuals fall sharply (~30% at median) when household transition into small business ownership from wage workers.
Potential explanation: There are non-pecuniary benefits to small business formation.
Consistent with micro data that most small firms never grow, never innovation and are concentrated in a few industries.