Embed Size (px)
Citation preview

7/30/2019 Lecture 5.1 Visual Modelling Languages - Flowcharts
http://slidepdf.com/reader/full/lecture-51-visual-modelling-languages-flowcharts 1/20
Visual Modelling Languages
FlowchartsM05EKM Business Simulation
Dr Ammar Al-Bazi
Lecture 5.1
7/30/2019 Lecture 5.1 Visual Modelling Languages - Flowcharts
http://slidepdf.com/reader/full/lecture-51-visual-modelling-languages-flowcharts 2/20
Lecture Outlines
• Introduction
• Flowchart Definition
• Importance of Flowcharts
• Why We Use Flowcharts
• Flowchart Field of
Applications
• Types of Flowcharts
• Flowcharts Building
Blocks
• Creating Flowcharts
• Flowchart ControlStructures
• Visual Example
• Case Studies
• Comments
7/30/2019 Lecture 5.1 Visual Modelling Languages - Flowcharts
http://slidepdf.com/reader/full/lecture-51-visual-modelling-languages-flowcharts 3/20
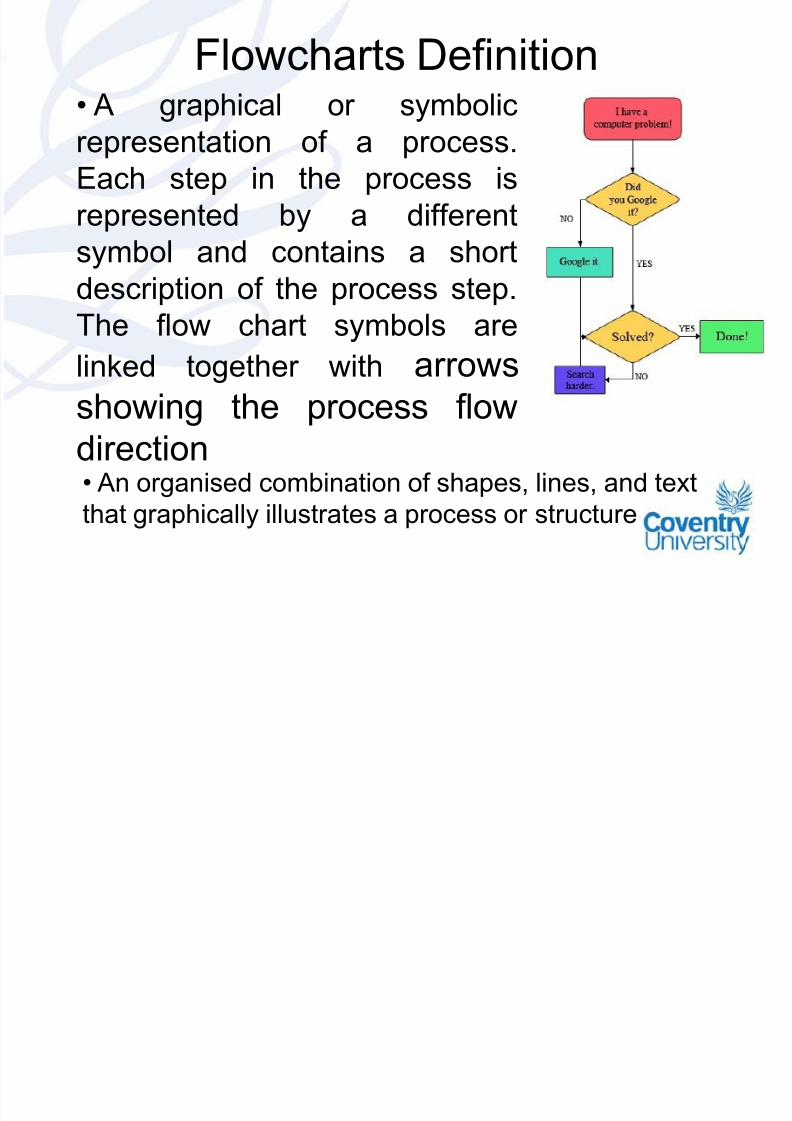
Flowcharts Definition• A graphical or symbolic
representation of a process.Each step in the process is
represented by a different
symbol and contains a short
description of the process step.
The flow chart symbols are
linked together with arrows
showing the process flowdirection• An organised combination of shapes, lines, and text
that graphically illustrates a process or structure

7/30/2019 Lecture 5.1 Visual Modelling Languages - Flowcharts
http://slidepdf.com/reader/full/lecture-51-visual-modelling-languages-flowcharts 4/20
Importance of Flowcharts
• Building a step-by-step picture of the process
for analysis, discussion, or communication
purposes.
• Defining, standardising, or finding areas for
improvement in a process.• Flowcharts are recognised as on of the most
important ways to effectively communicate ideas
between people who may differ in knowledge,
education, and position• Without flowcharts, you can spend a ton of
energy explaining how the process is to be done!

7/30/2019 Lecture 5.1 Visual Modelling Languages - Flowcharts
http://slidepdf.com/reader/full/lecture-51-visual-modelling-languages-flowcharts 5/20
Why We Use Flowcharts
• Create visual maps of a process• Help with planning a project
• Quality improvement tool
• Identify processes that needimprovement
• Identify unnecessary/ problem steps
in a process• Good communication tool

7/30/2019 Lecture 5.1 Visual Modelling Languages - Flowcharts
http://slidepdf.com/reader/full/lecture-51-visual-modelling-languages-flowcharts 6/20
Flowchart Field of Applications
• Production – Manufacturing
– Used to identify critical
path
• Accounting – Help visualize money
flow
• Services – Restaurants
– Real estate
• Education – Curriculum
flowcharts
–
Student flow throughprocess
• Hospitals – Patient flow
– Medical processes

7/30/2019 Lecture 5.1 Visual Modelling Languages - Flowcharts
http://slidepdf.com/reader/full/lecture-51-visual-modelling-languages-flowcharts 7/20
Types of Flowcharts
That there are four general types of flowcharts:
• Document flowcharts, showing controls over a
document-flow through a system.
• Data flowcharts, showing controls over a data flows
in a system.
• System flowcharts showing controls at a physical or resource level.
• Program flowchart, showing the controls in a
program within a system.
Notice that every type of flowchart focuses on some kind of control, rather than onthe particular flow itself.
In addition, many diagram techniques exist that are similar to flowcharts but carry a
different name, such as UML Activity
Diagrams.

7/30/2019 Lecture 5.1 Visual Modelling Languages - Flowcharts
http://slidepdf.com/reader/full/lecture-51-visual-modelling-languages-flowcharts 8/20
Flowchart Building Blocks

7/30/2019 Lecture 5.1 Visual Modelling Languages - Flowcharts
http://slidepdf.com/reader/full/lecture-51-visual-modelling-languages-flowcharts 9/20
Flowchart Building Blocks (Cont)

7/30/2019 Lecture 5.1 Visual Modelling Languages - Flowcharts
http://slidepdf.com/reader/full/lecture-51-visual-modelling-languages-flowcharts 10/20
Flowchart Building Blocks (Cont)

7/30/2019 Lecture 5.1 Visual Modelling Languages - Flowcharts
http://slidepdf.com/reader/full/lecture-51-visual-modelling-languages-flowcharts 11/20
Flowchart Building Blocks (Cont)

7/30/2019 Lecture 5.1 Visual Modelling Languages - Flowcharts
http://slidepdf.com/reader/full/lecture-51-visual-modelling-languages-flowcharts 12/20
Flowchart Building Blocks (Cont)
7/30/2019 Lecture 5.1 Visual Modelling Languages - Flowcharts
http://slidepdf.com/reader/full/lecture-51-visual-modelling-languages-flowcharts 13/20
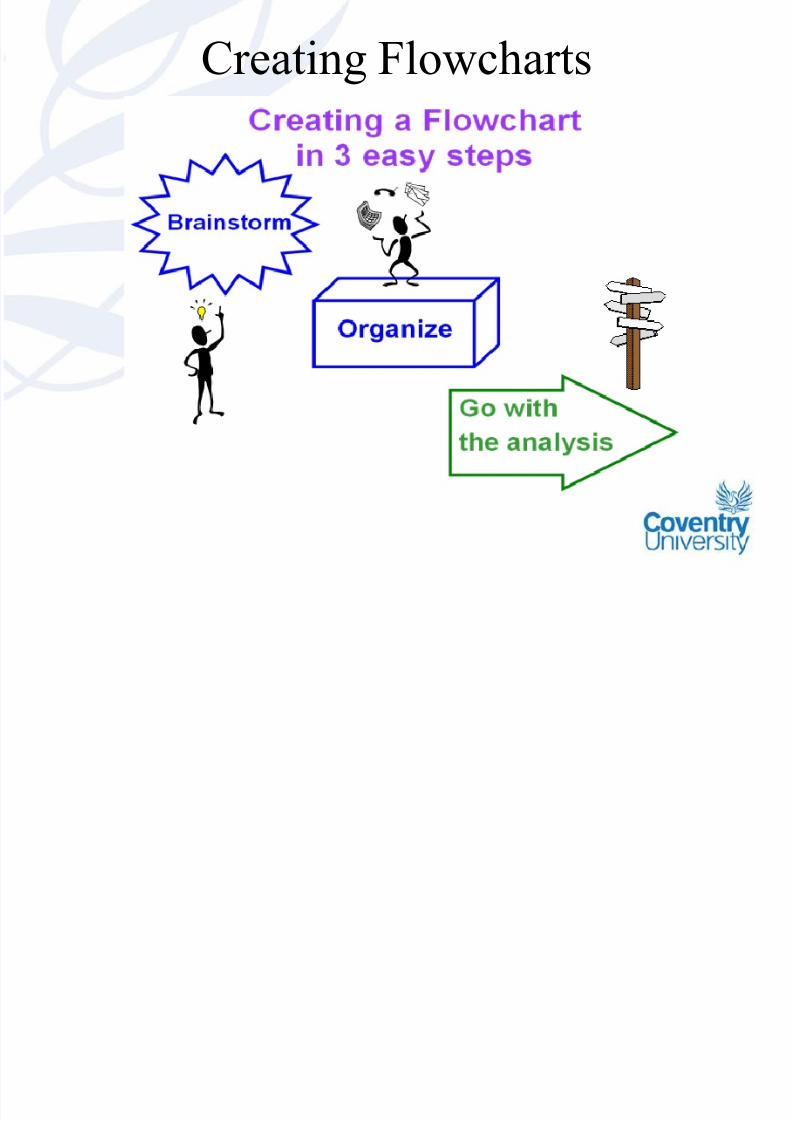
Creating Flowcharts

7/30/2019 Lecture 5.1 Visual Modelling Languages - Flowcharts
http://slidepdf.com/reader/full/lecture-51-visual-modelling-languages-flowcharts 14/20
Common Rules for Flowcharts
• Indicate and label all elements of the project
• Sequence of events is clear
• No gaps or dead ends
• Must be logical to the user
• Use correct symbols

7/30/2019 Lecture 5.1 Visual Modelling Languages - Flowcharts
http://slidepdf.com/reader/full/lecture-51-visual-modelling-languages-flowcharts 15/20
Flowchart Control Structure
The Three Basic Control Structure are:
1. Sequence 2. Selection (a)

7/30/2019 Lecture 5.1 Visual Modelling Languages - Flowcharts
http://slidepdf.com/reader/full/lecture-51-visual-modelling-languages-flowcharts 16/20
Flowchart Control Structure (Cont)
The Three Basic Control Structure are:
3. Selection (b) 4. Repetition

7/30/2019 Lecture 5.1 Visual Modelling Languages - Flowcharts
http://slidepdf.com/reader/full/lecture-51-visual-modelling-languages-flowcharts 17/20
Flowchart Software
•Some tools offer special support for flowchart drawing such as Microsoft
Visio.
•
Many software packages exist that cancreate flowcharts automatically, either
directly from source code, or from a
flowchart description language. On-line
Web-based versions of such programs
are available
7/30/2019 Lecture 5.1 Visual Modelling Languages - Flowcharts
http://slidepdf.com/reader/full/lecture-51-visual-modelling-languages-flowcharts 18/20
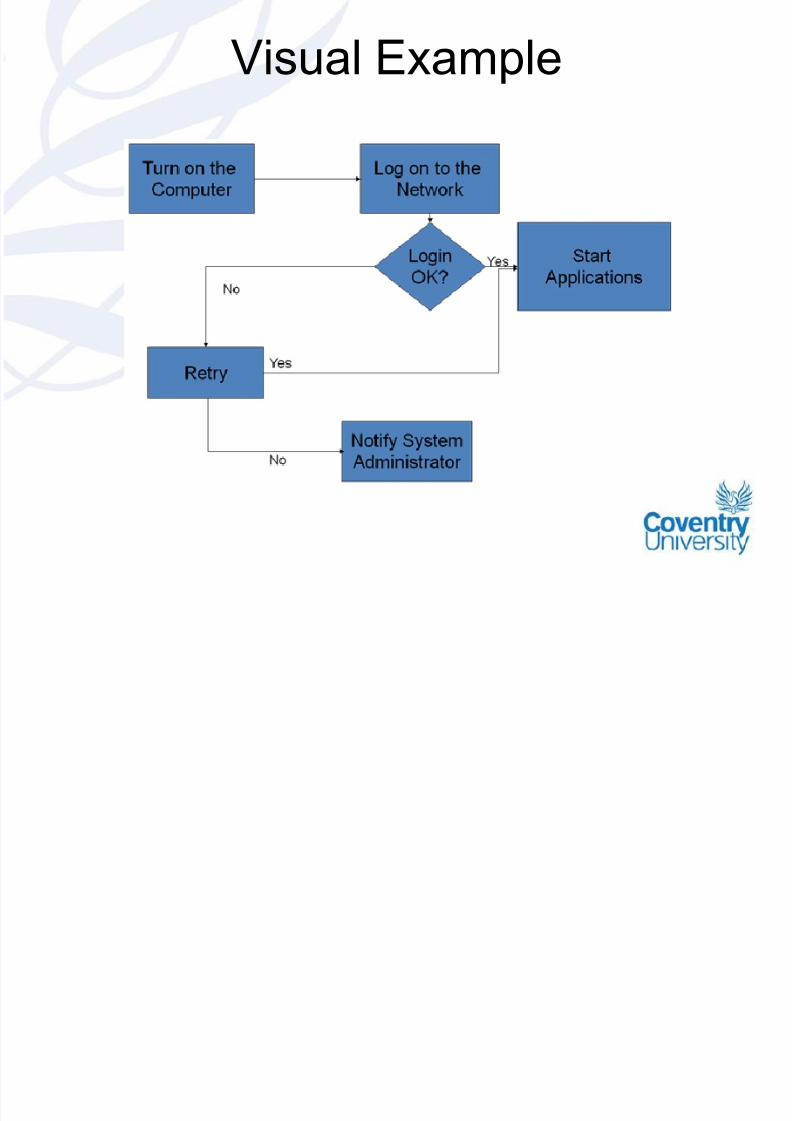
Visual Example

7/30/2019 Lecture 5.1 Visual Modelling Languages - Flowcharts
http://slidepdf.com/reader/full/lecture-51-visual-modelling-languages-flowcharts 19/20
Real Life Case StudyMore details can be found in: http://itc.scix.net/data/works/att/w78-2008-7-05.pdf
Al-Bazi A. and Dawood N. (2008). “Enterprise Simulation of the Precast Concrete Manufacturing Industry” . CIB W78 2008 International
Conference on Information Technology in Construction. Santiago, Chile.

7/30/2019 Lecture 5.1 Visual Modelling Languages - Flowcharts
http://slidepdf.com/reader/full/lecture-51-visual-modelling-languages-flowcharts 20/20
Comments
• Valuable and unique quality
improvement tool
• Simple and effective way of visualising
and understanding a process
• Entire organisation has an effect on the
flowchart
• Everyone involved can take part in
improving the process