Embed Size (px)
Citation preview
Lecture 5
Secondary Equity Markets – III
NYSE and NASDAQ
Overview
• Examples:– NYSE
– NASDAQ.
• Tick size and its effects.
• Payment for order flow.
NYSE and Nasdaq
• Understand the evolution of these two major equity markets.
• Evaluate the importance of institutional features, which sometimes are seem quite negligible at first glance.
• Understand the effect of regulatory environment on market performance.
NYSE
• The first exchange in the US; became the leading world stock exchange.
• Type of market: trading floor / electronic order delivery; call auction in the morning; continuous double auction (LOB) + specialist and floor traders during the day.
• Membership close to 1,500; over 400 specialists.
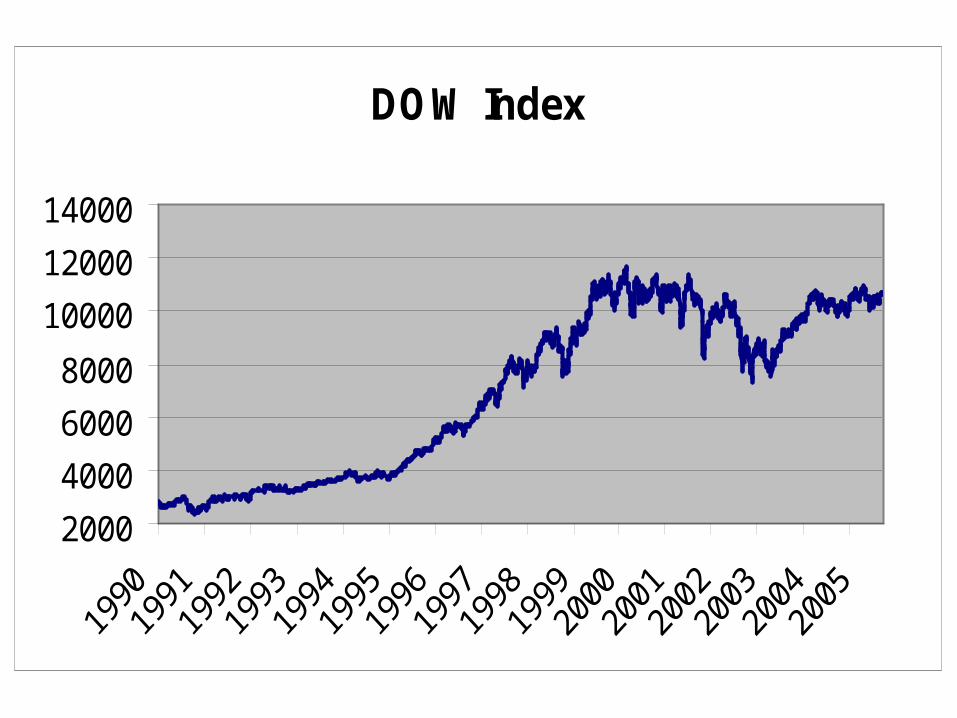
DOW Index
2000
4000
6000
8000
10000
12000
14000

NYSE Recent History
Year Share vol Turnov Trades $ Volume Aver. Price Seat Price
(000') % (000') Mln
1968 3,298 24% 9,704 $145 $44.00 $515,000
1978 7,205 27% 10,050 $200 $27.70 $105,000
1988 40,850 55% 17,739 $1,356 $33.20 $820,000
1998 169,745 76% 135,840 $7317,9 $43.10 $2,000,000
2004 367,099 99% 933,111 $11,618 $31.65 $1,150,000
Specialists
• Their mandate is “…to maintain a fair and orderly market.” “Lean against the wind.”
• Why should they do this, rather than making money? Because this is conducive to making money in the long run. They act mostly as facilitators, brokers, and dealers.
• Can step before the limit order, if improve the price, but has the last priority if does not.
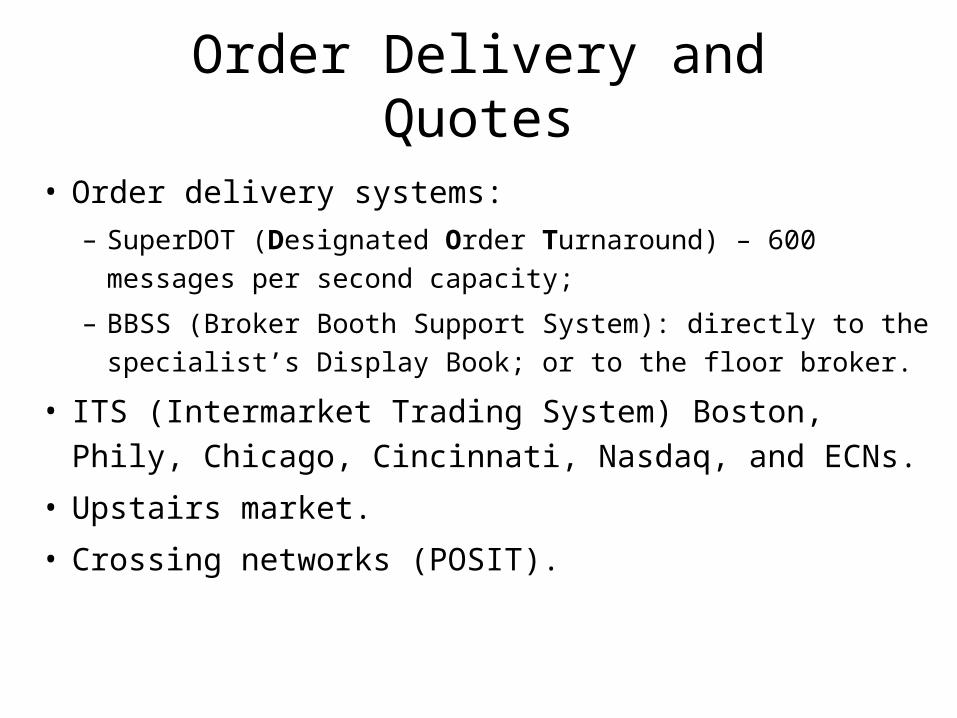
Order Delivery and Quotes
• Order delivery systems:
– SuperDOT (Designated Order Turnaround) – 600 messages per
second capacity;
– BBSS (Broker Booth Support System): directly to the
specialist’s Display Book; or to the floor broker.
• ITS (Intermarket Trading System) Boston, Phily, Chicago,
Cincinnati, Nasdaq, and ECNs.
• Upstairs market.
• Crossing networks (POSIT).
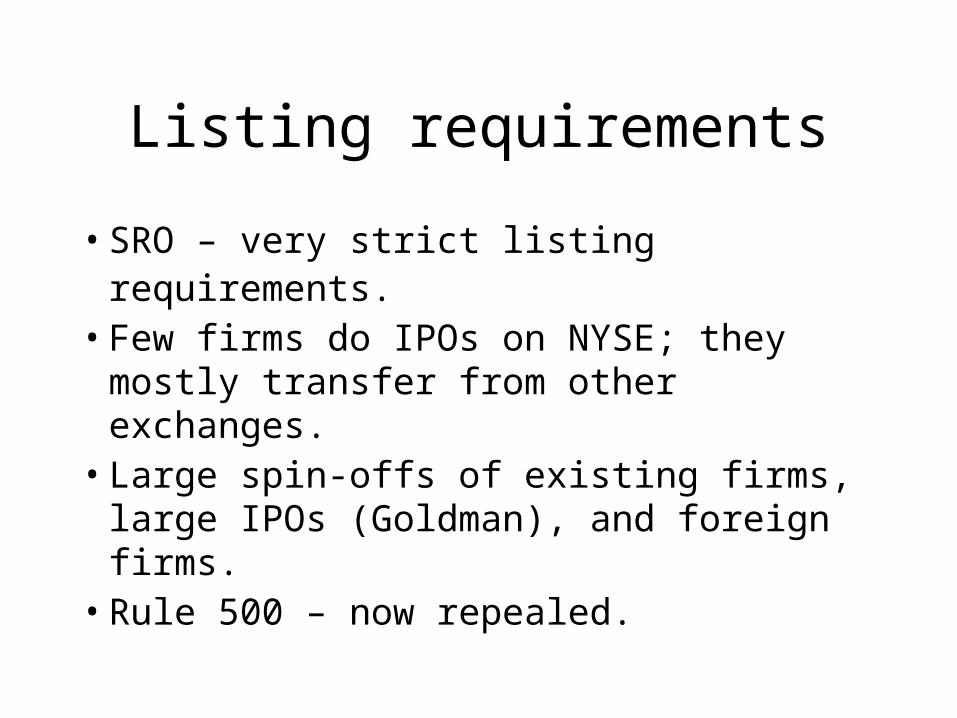
Listing requirements
• SRO – very strict listing requirements.• Few firms do IPOs on NYSE; they
mostly transfer from other exchanges. • Large spin-offs of existing firms, large
IPOs (Goldman), and foreign firms. • Rule 500 – now repealed.
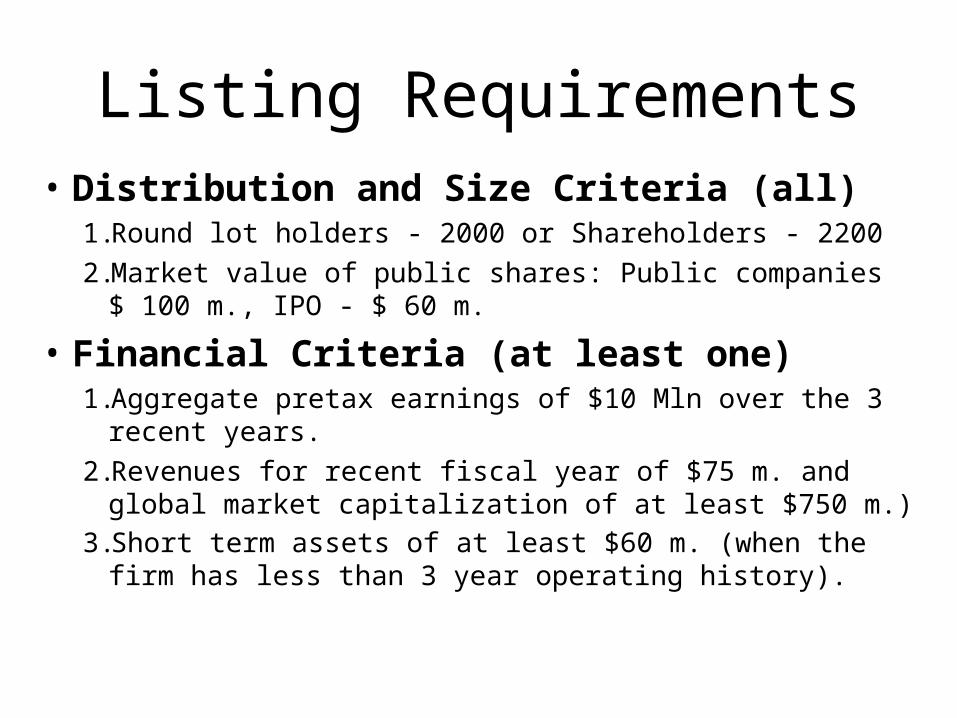
Listing Requirements• Distribution and Size Criteria (all)
1. Round lot holders - 2000 or Shareholders - 2200
2. Market value of public shares: Public companies $ 100 m., IPO - $ 60 m.
• Financial Criteria (at least one)1. Aggregate pretax earnings of $10 Mln over the 3 recent years.
2. Revenues for recent fiscal year of $75 m. and global market capitalization of at least $750 m.)
3. Short term assets of at least $60 m. (when the firm has less than 3 year operating history).
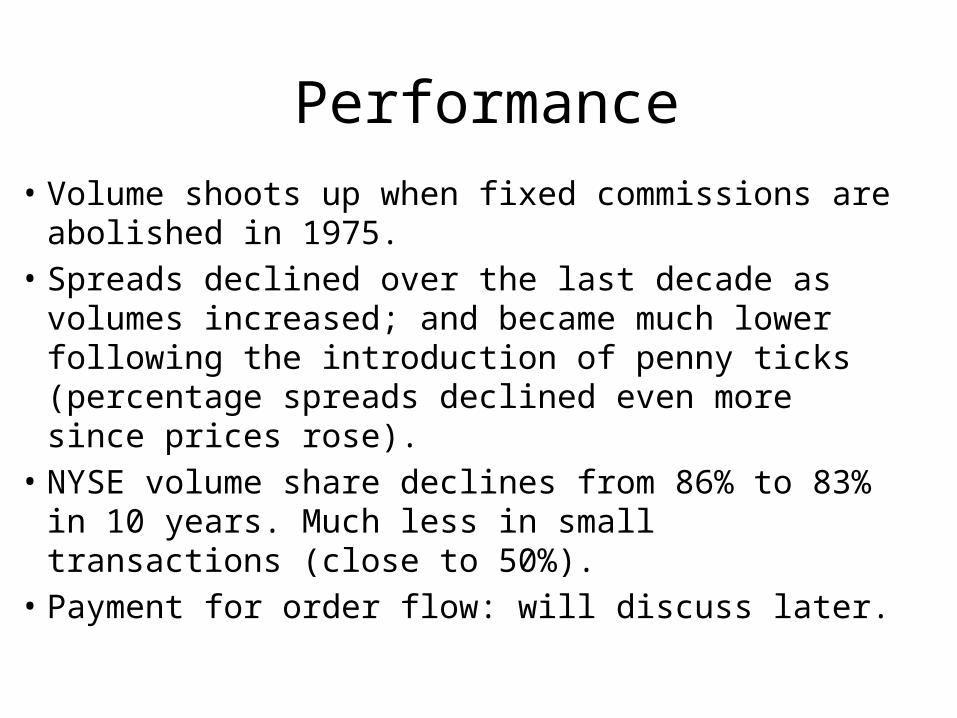
Performance
• Volume shoots up when fixed commissions are abolished in 1975.
• Spreads declined over the last decade as volumes increased; and became much lower following the introduction of penny ticks (percentage spreads declined even more since prices rose).
• NYSE volume share declines from 86% to 83% in 10 years. Much less in small transactions (close to 50%).
• Payment for order flow: will discuss later.
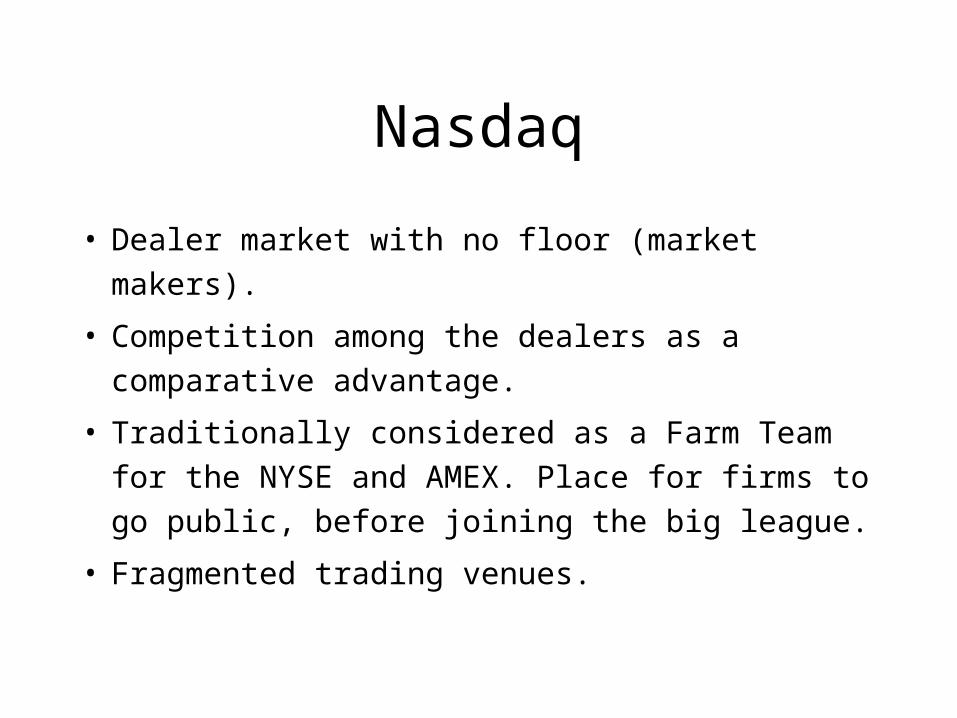
Nasdaq
• Dealer market with no floor (market makers).
• Competition among the dealers as a comparative
advantage.
• Traditionally considered as a Farm Team for the
NYSE and AMEX. Place for firms to go public,
before joining the big league.
• Fragmented trading venues.
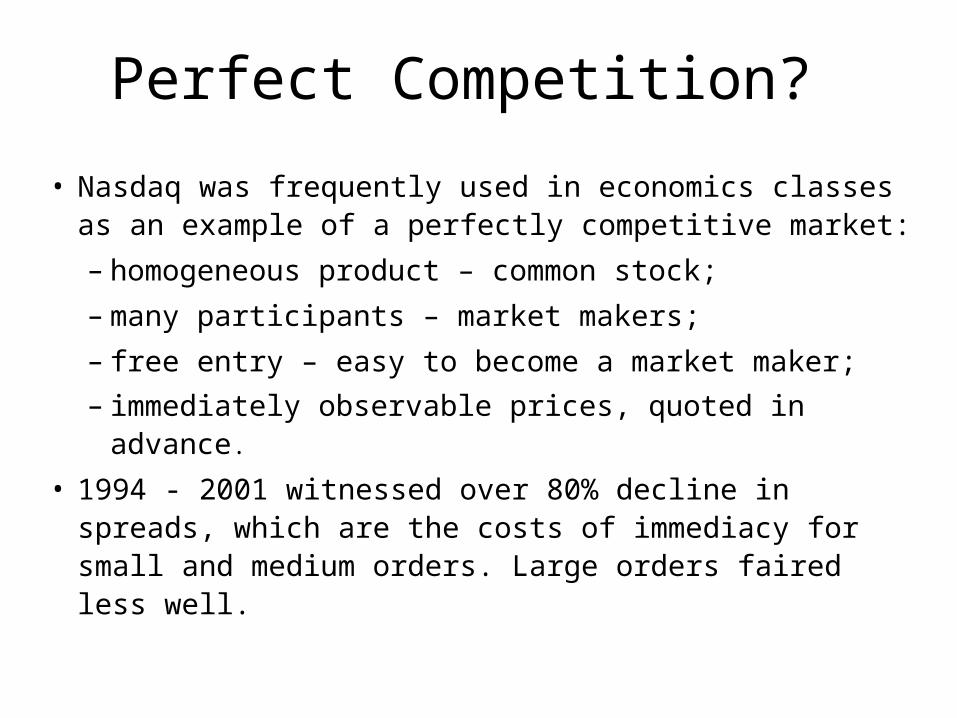
Perfect Competition?
• Nasdaq was frequently used in economics classes as an example of a perfectly competitive market:
– homogeneous product – common stock;
– many participants – market makers;
– free entry – easy to become a market maker;
– immediately observable prices, quoted in advance.
• 1994 - 2001 witnessed over 80% decline in spreads, which are the costs of immediacy for small and medium orders. Large orders faired less well.
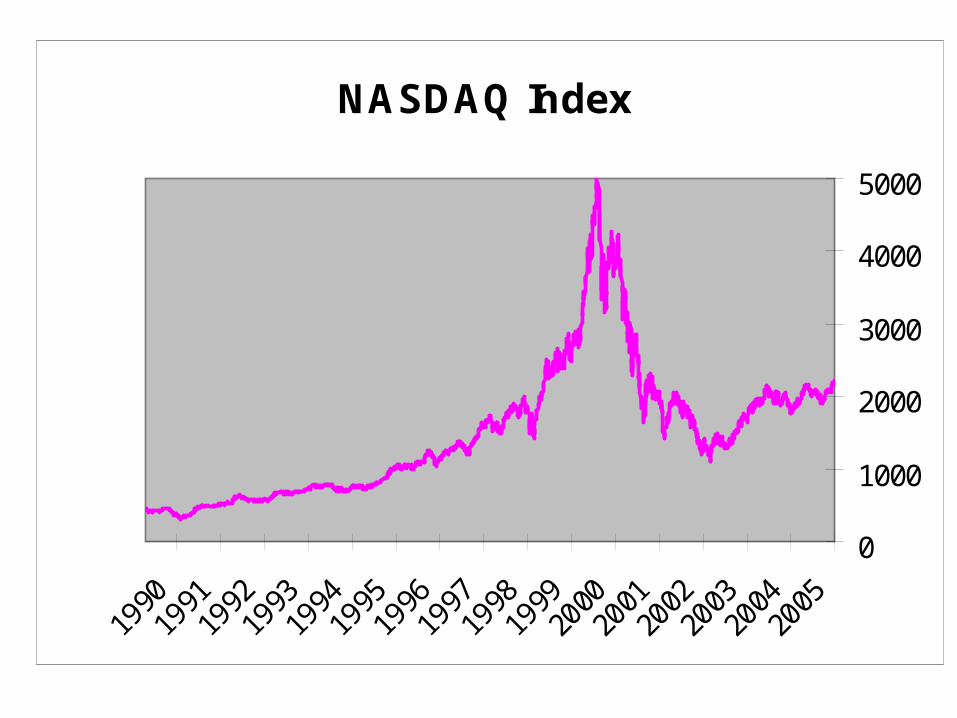
NASDAQ Index
0
1000
2000
3000
4000
5000
2005
2004
2003
2002
2001
2000
1999
1998
1997
1996
1995
1994
1993
1992
1991
1990
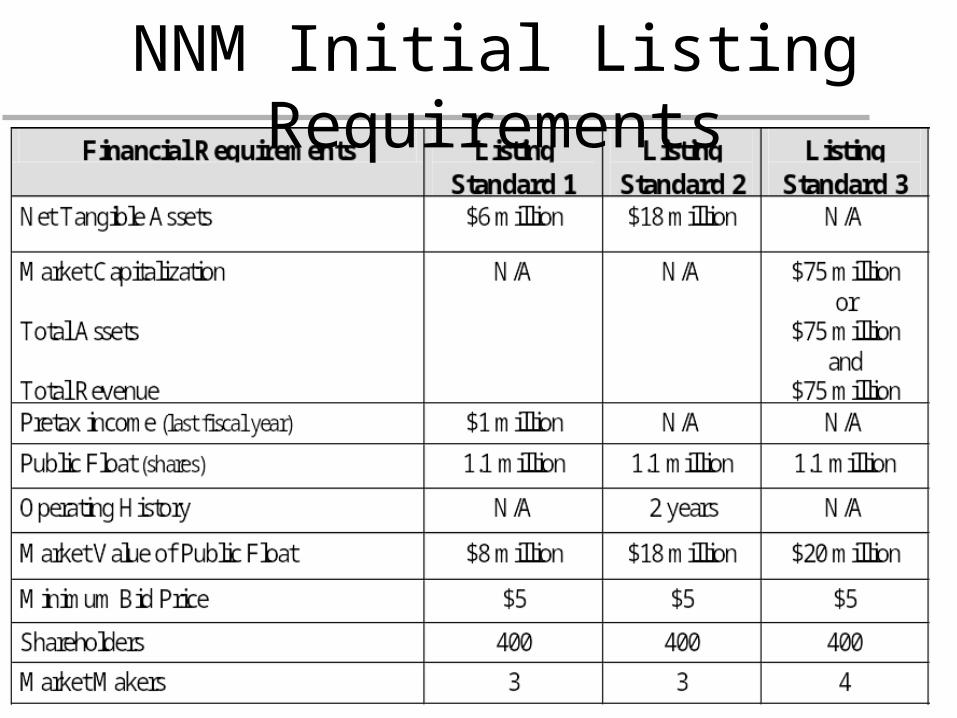
NNM Initial Listing Requirements
Financial Requirements Listing Standard 1 & 2
Listing Standard 3
Registration under Section 12 (g) of the Securities Exchange Act of 1934
Yes Yes
Net Tangible Assets $4 million N/A
Market Capitalization Total Assets Total Revenue
N/A $50 million or
$50 million and
$50 million Public Float (shares) 750,000 1.1 million
Market Value of Public Float $5 million $15 million
Minimum Bid Price $1 $5
Shareholders 400 400
Market Makers 2 4
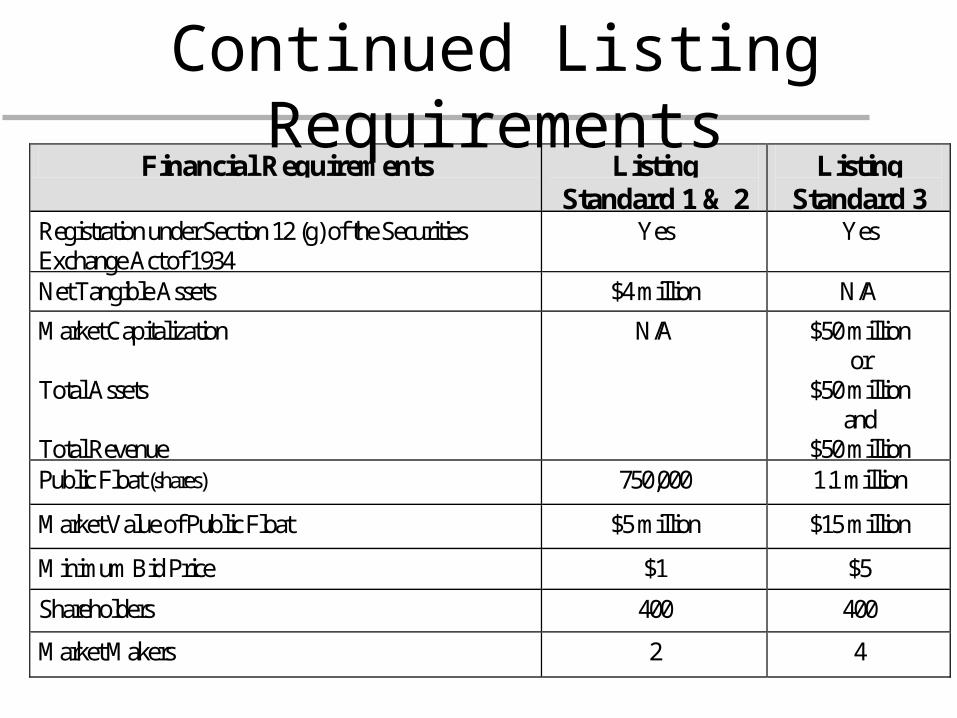
Continued Listing Requirements
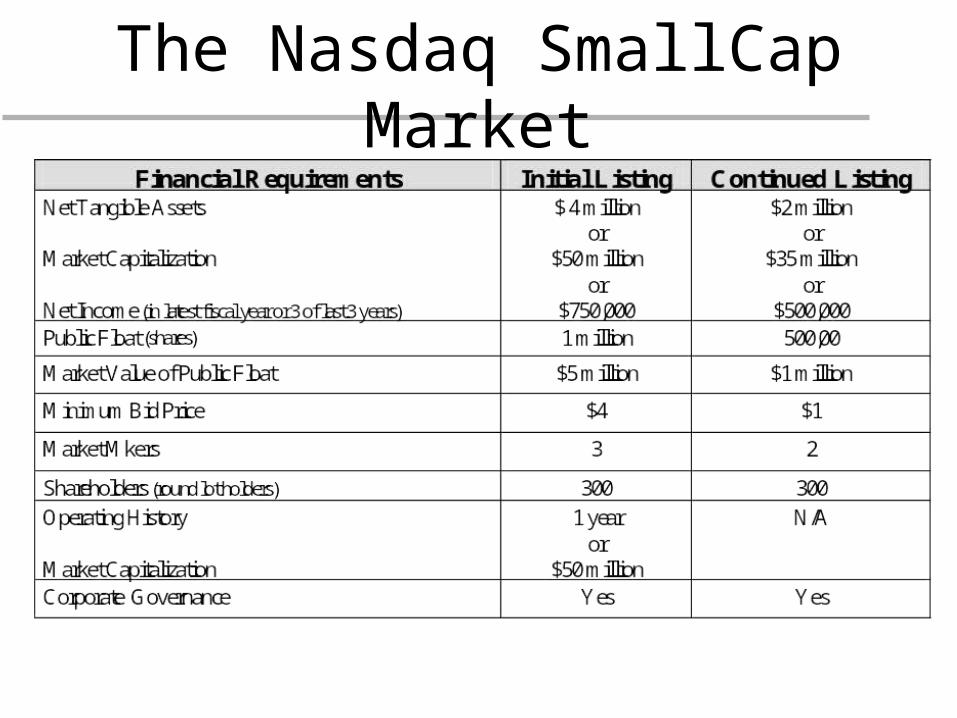
The Nasdaq SmallCap Market
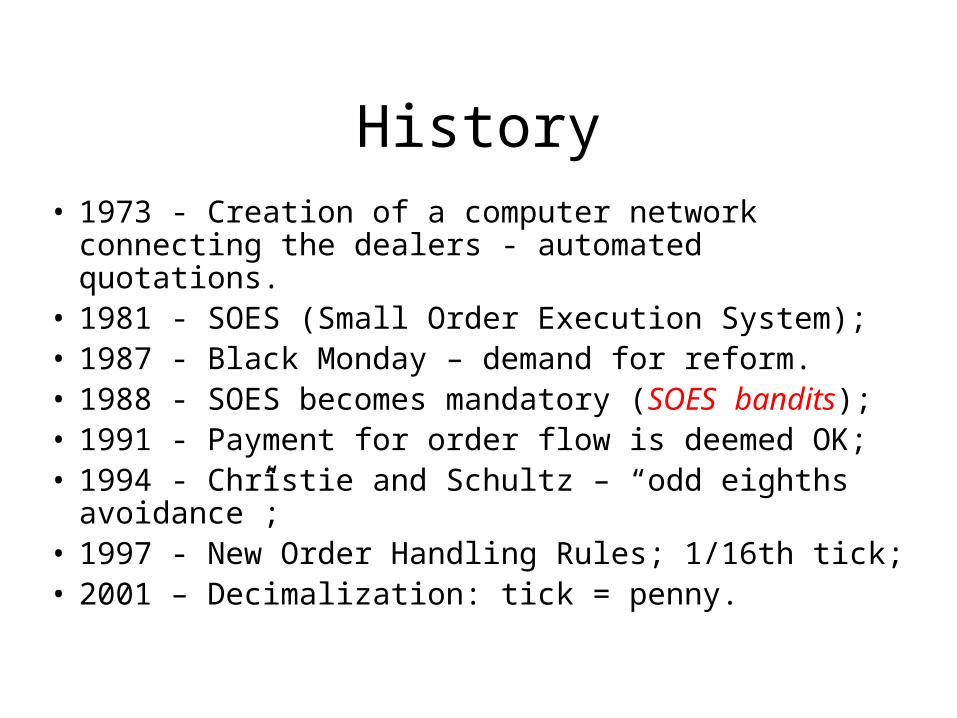
History• 1973 - Creation of a computer network connecting the
dealers - automated quotations.• 1981 - SOES (Small Order Execution System);• 1987 - Black Monday – demand for reform.• 1988 - SOES becomes mandatory (SOES bandits);• 1991 - Payment for order flow is deemed OK;• 1994 - Christie and Schultz – “odd eighths avoidance”;• 1997 - New Order Handling Rules; 1/16th tick;• 2001 – Decimalization: tick = penny.
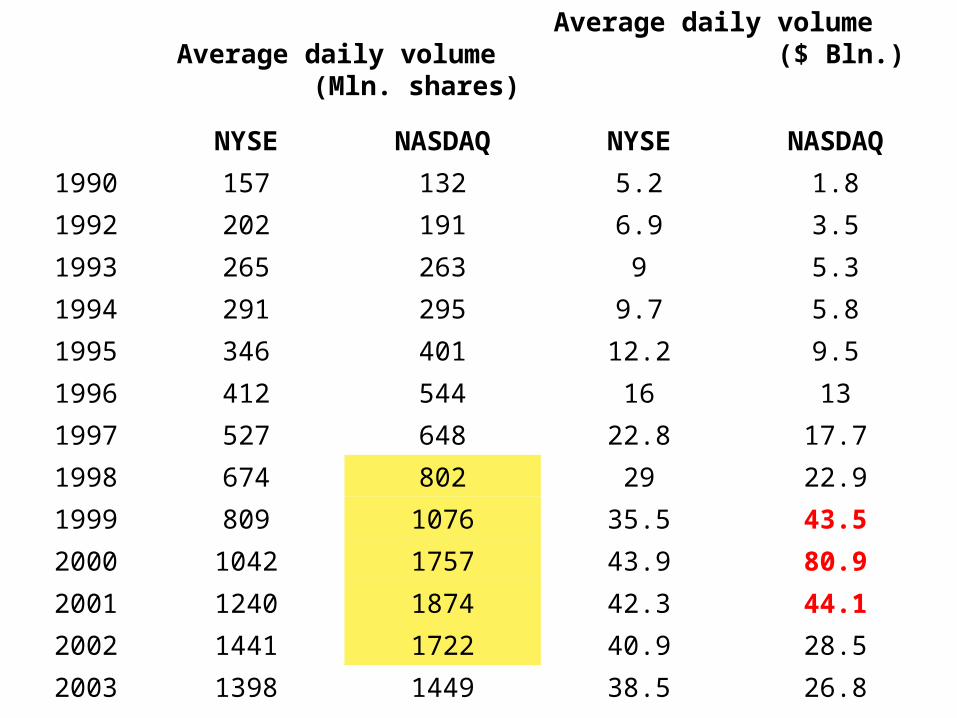
Average daily volume (Mln. shares)
Average daily volume ($ Bln.)
NYSE NASDAQ NYSE NASDAQ
1990 157 132 5.2 1.8
1992 202 191 6.9 3.5
1993 265 263 9 5.3
1994 291 295 9.7 5.8
1995 346 401 12.2 9.5
1996 412 544 16 13
1997 527 648 22.8 17.7
1998 674 802 29 22.9
1999 809 1076 35.5 43.5
2000 1042 1757 43.9 80.9
2001 1240 1874 42.3 44.1
2002 1441 1722 40.9 28.5
2003 1398 1449 38.5 26.8
2004 1457 1259 46.1 27.2
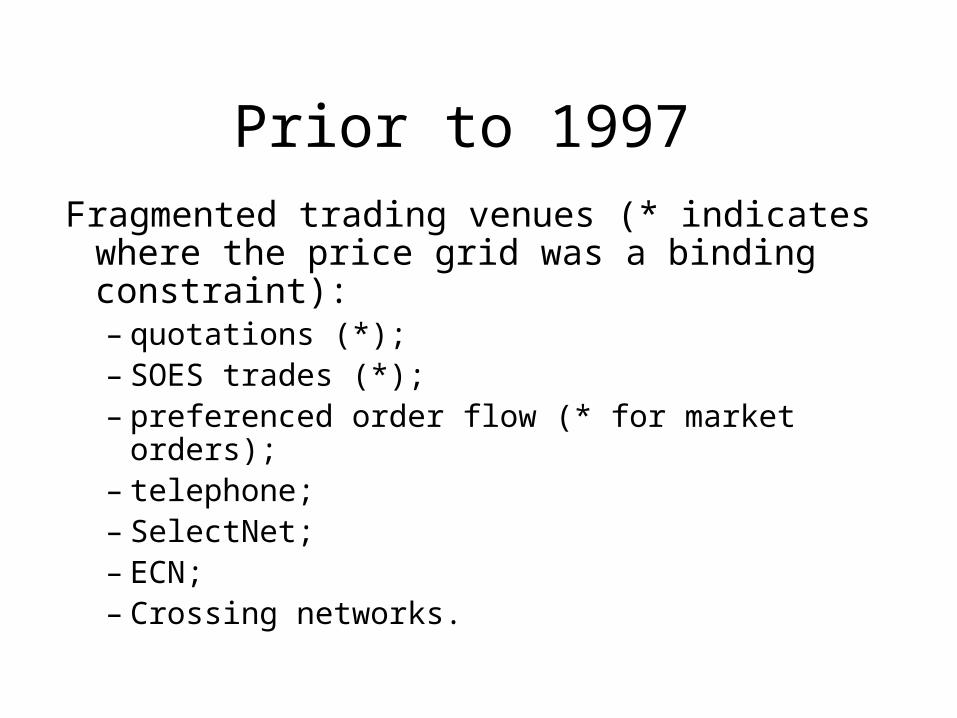
Prior to 1997
Fragmented trading venues (* indicates where the price grid was a binding constraint):– quotations (*);– SOES trades (*);– preferenced order flow (* for market orders);– telephone;– SelectNet;– ECN;– Crossing networks.
Digressions
• Tick size and its effects.
• “Odd eighths avoidance” – not a trivial matter.
• Payment for order flow and its effects on the
markets.
Tick Size
• Minimal price increment imposed by the
exchange. History.
• Constraint on prices.
• Could be beneficial to investors, but in
many cases is detrimental.
• Monopoly versus competition.
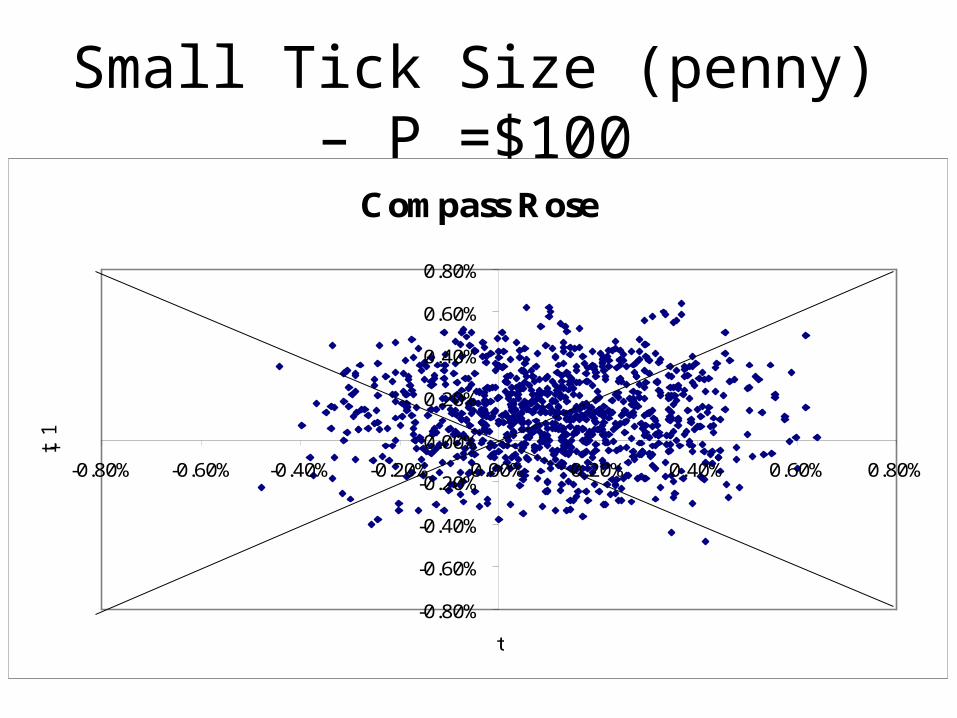
Small Tick Size (penny) – P =$100
Compass Rose
-0.80%
-0.60%
-0.40%
-0.20%
0.00%
0.20%
0.40%
0.60%
0.80%
-0.80% -0.60% -0.40% -0.20% 0.00% 0.20% 0.40% 0.60% 0.80%
t
t +1
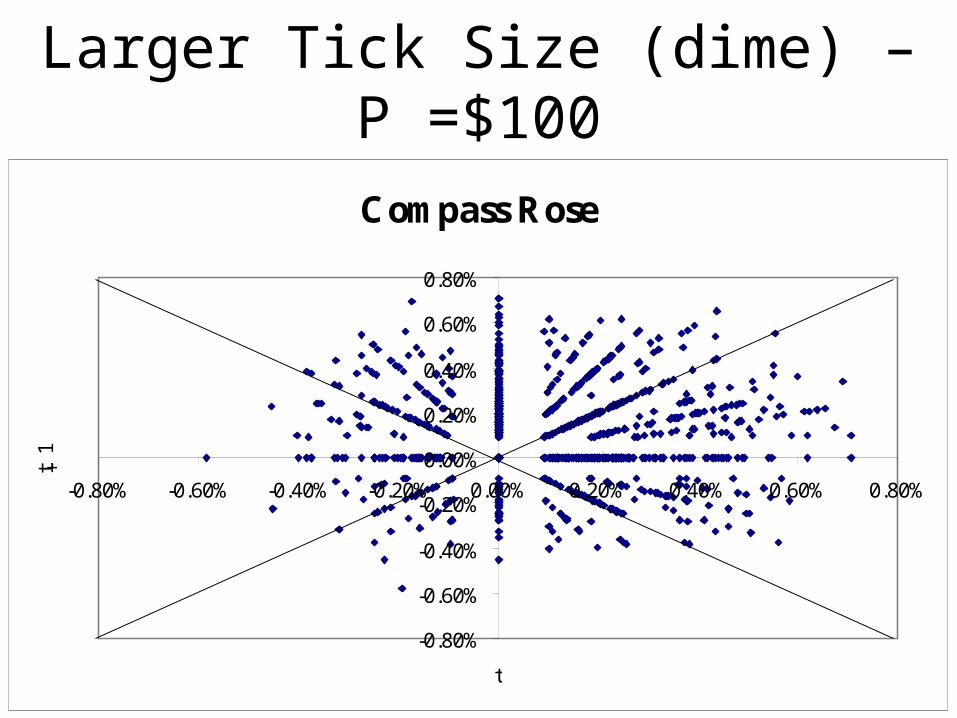
Larger Tick Size (dime) – P =$100
Compass Rose
-0.80%
-0.60%
-0.40%
-0.20%
0.00%
0.20%
0.40%
0.60%
0.80%
-0.80% -0.60% -0.40% -0.20% 0.00% 0.20% 0.40% 0.60% 0.80%
t
t +1
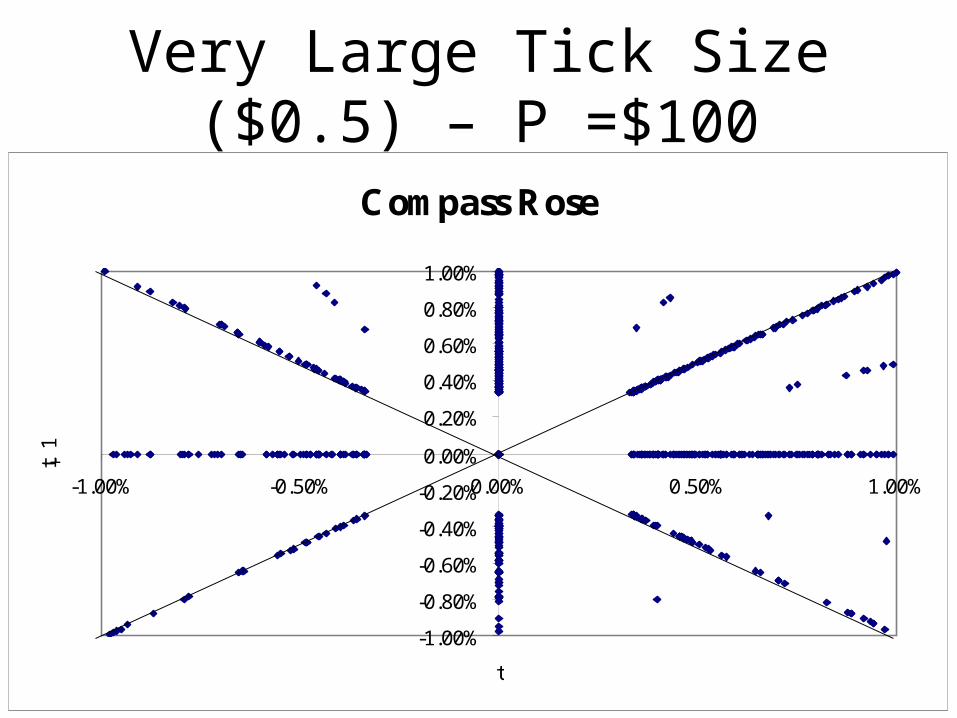
Very Large Tick Size ($0.5) – P =$100
Compass Rose
-1.00%
-0.80%
-0.60%
-0.40%
-0.20%
0.00%
0.20%
0.40%
0.60%
0.80%
1.00%
-1.00% -0.50% 0.00% 0.50% 1.00%
t
t +1
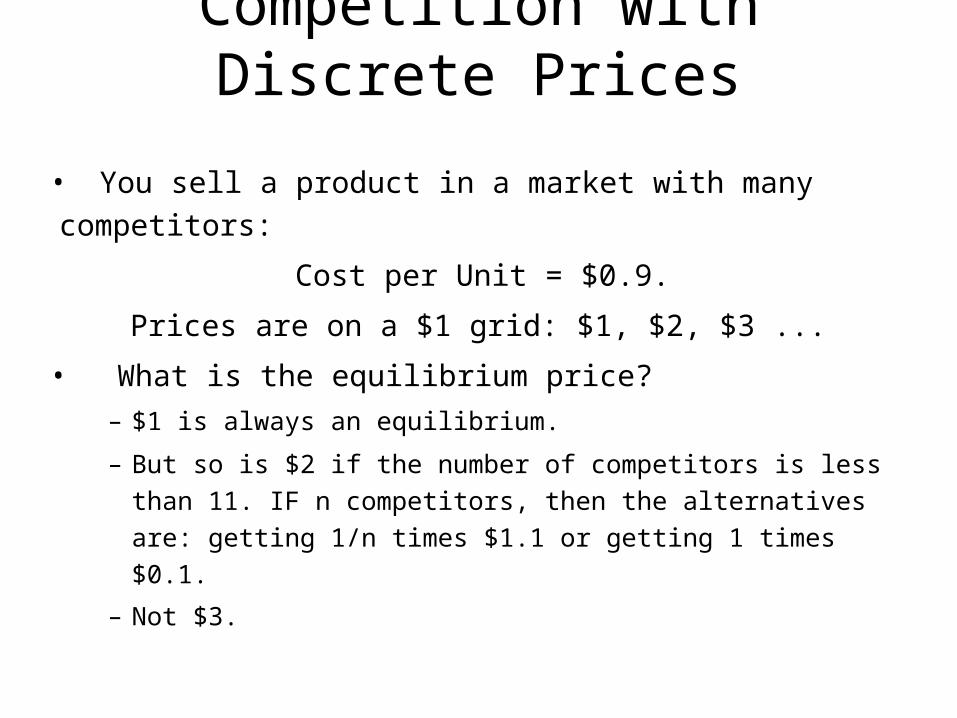
Competition with Discrete Prices
• You sell a product in a market with many competitors:
Cost per Unit = $0.9.
Prices are on a $1 grid: $1, $2, $3 ...
• What is the equilibrium price?
– $1 is always an equilibrium.
– But so is $2 if the number of competitors is less than 11. IF
n competitors, then the alternatives are: getting 1/n times
$1.1 or getting 1 times $0.1.
– Not $3.
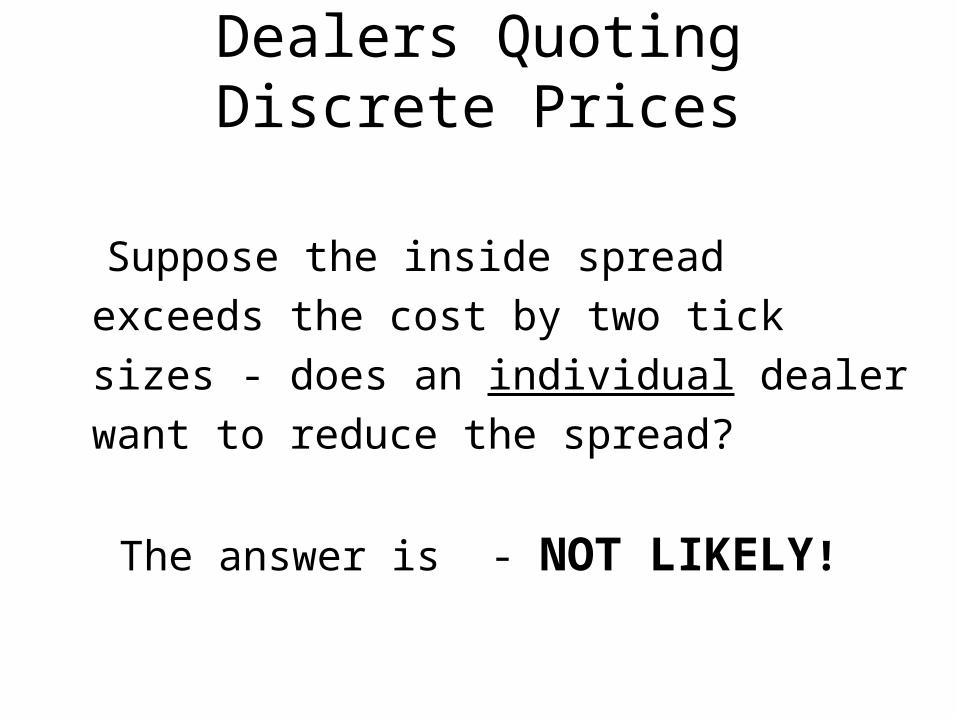
Dealers Quoting Discrete Prices
Suppose the inside spread exceeds the
cost by two tick sizes - does an individual
dealer want to reduce the spread?
The answer is - NOT LIKELY!
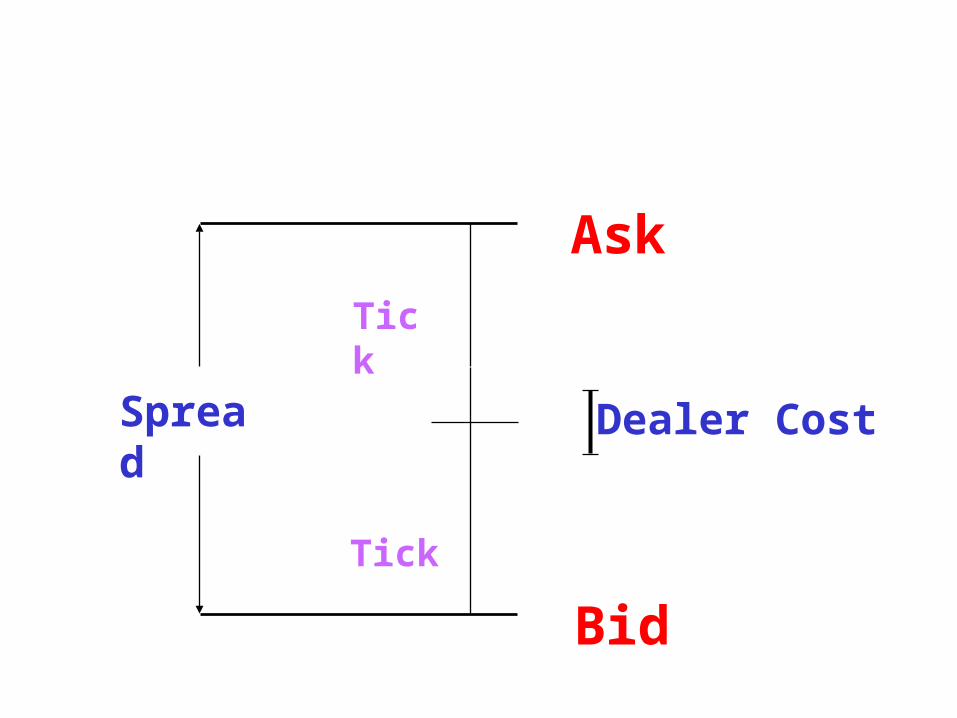
Ask
Bid
Dealer Cost
Tick
Tick
Spread
Possible Strategies
• Reduce the Ask price and get a large short position.
• Increase the Bid price and get a large long position.
• To unwind these positions – need to improve the prices on the other side as well. This makes it too costly.
Implications
• At least TWO competitive equilibria exist for any number of dealers.
• Price greater than cost does not necessarily mean collusion.
• Collusion in certain spread range cannot be ruled out by appealing to “competitive forces”.
• Relevance for NASDAQ.
Odd Eighths Avoidance, or…
• …Preference for Spreads Two Ticks Above Cost.
• Coordination by convention.
• Once established no communication or
enforcement required.
• Easy to break and hard to re-establish.
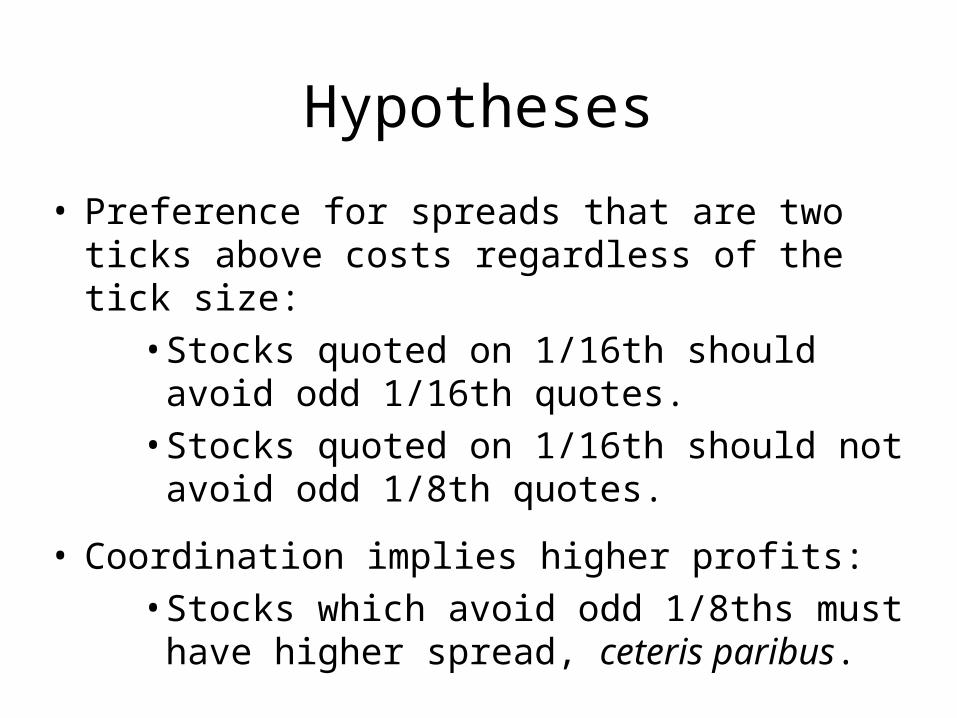
Hypotheses
• Preference for spreads that are two ticks above costs regardless of the tick size:
• Stocks quoted on 1/16th should avoid odd 1/16th quotes.
• Stocks quoted on 1/16th should not avoid odd 1/8th quotes.
• Coordination implies higher profits:• Stocks which avoid odd 1/8ths must have higher
spread, ceteris paribus.
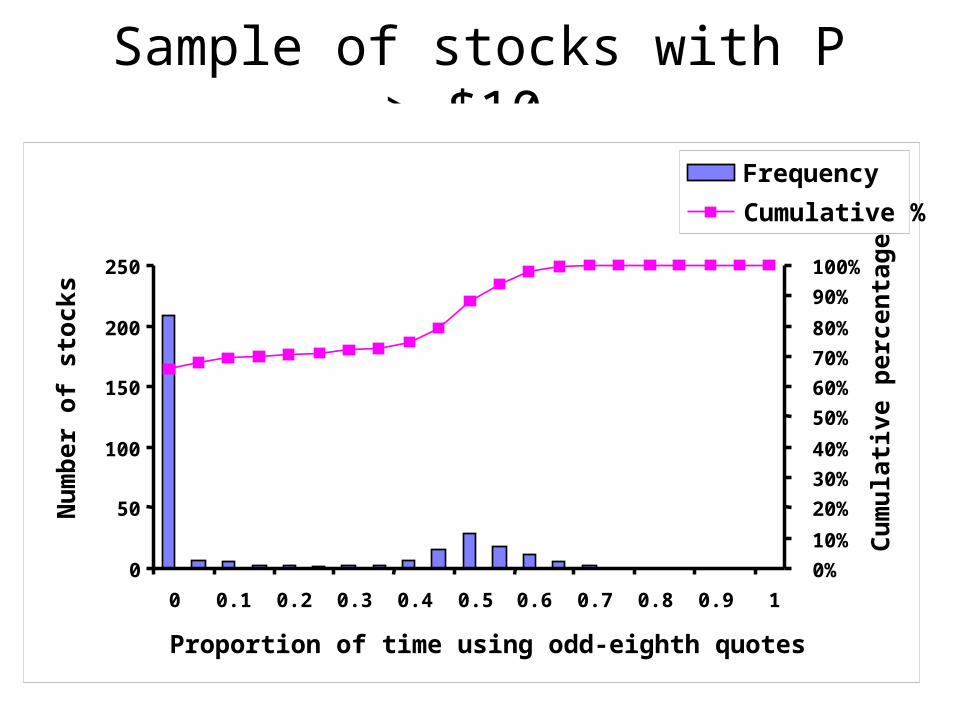
Sample of stocks with P > $10.
0
50
100
150
200
250
0 0.1 0.2 0.3 0.4 0.5 0.6 0.7 0.8 0.9 1
Proportion of time using odd-eighth quotes
Nu
mb
er o
f st
ock
s
0%
10%
20%
30%
40%
50%
60%
70%
80%
90%
100%
Cu
mu
lati
ve p
erce
nta
ge
Frequency
Cumulative %
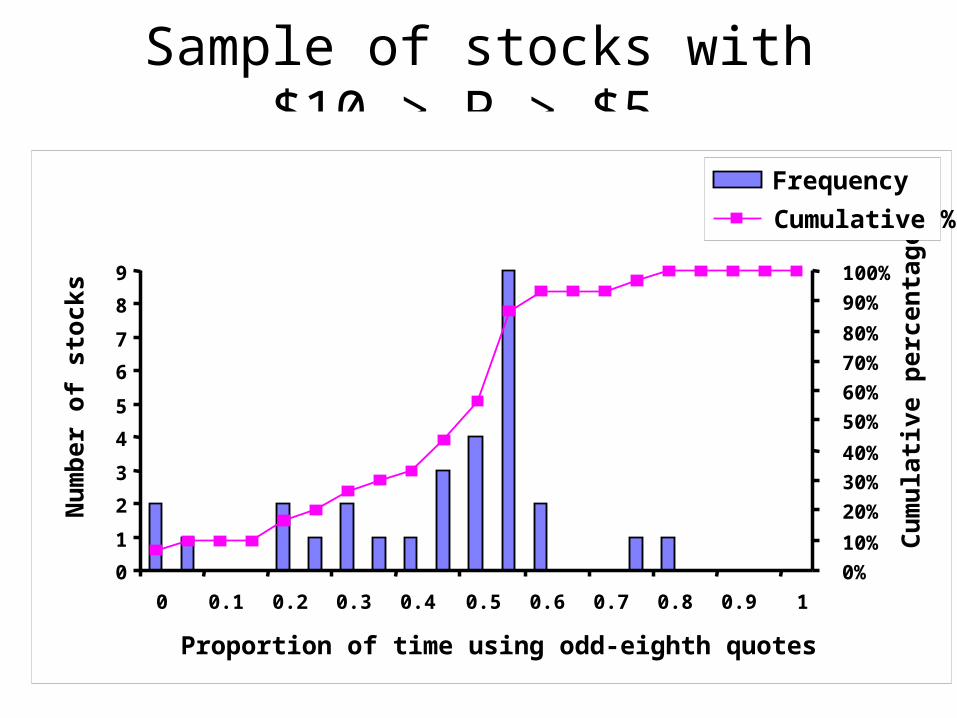
Sample of stocks with $10 > P > $5.
0
1
2
3
4
5
6
7
8
9
0 0.1 0.2 0.3 0.4 0.5 0.6 0.7 0.8 0.9 1
Proportion of time using odd-eighth quotes
Nu
mb
er o
f st
ock
s
0%
10%
20%
30%
40%
50%
60%
70%
80%
90%
100%
Cu
mu
lati
ve p
erce
nta
ge
Frequency
Cumulative %
Payment for order flow
• Market makers contract directly with brokers for
their entire order flow – NYSE and NASDAQ.
• Match NBBO.
• Pay brokers rebates (fees).
• Internalization – brokers vertically integrate into
market making - NASDAQ.
• Cream skimming, or profit sharing.
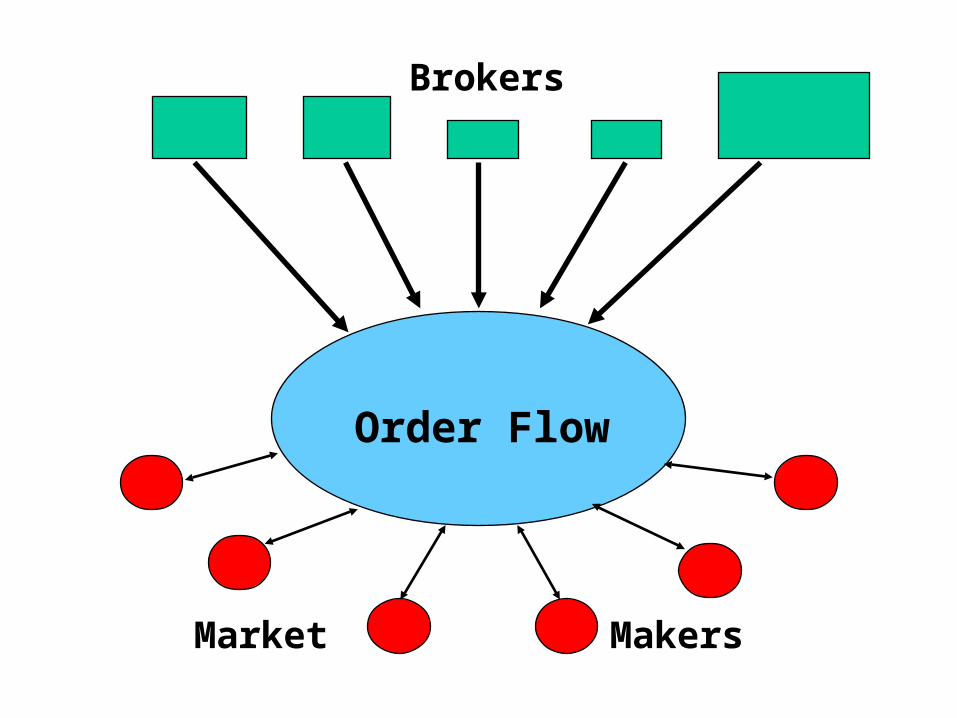
Brokers
Market Makers
Order Flow
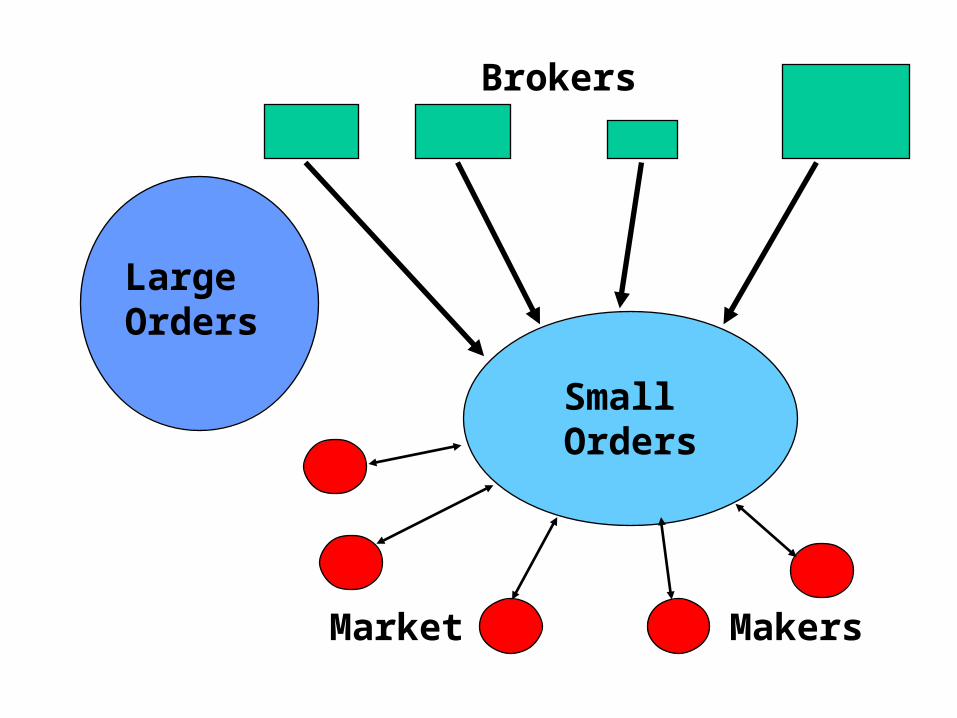
Brokers
Market Makers
Large Orders
Small Orders
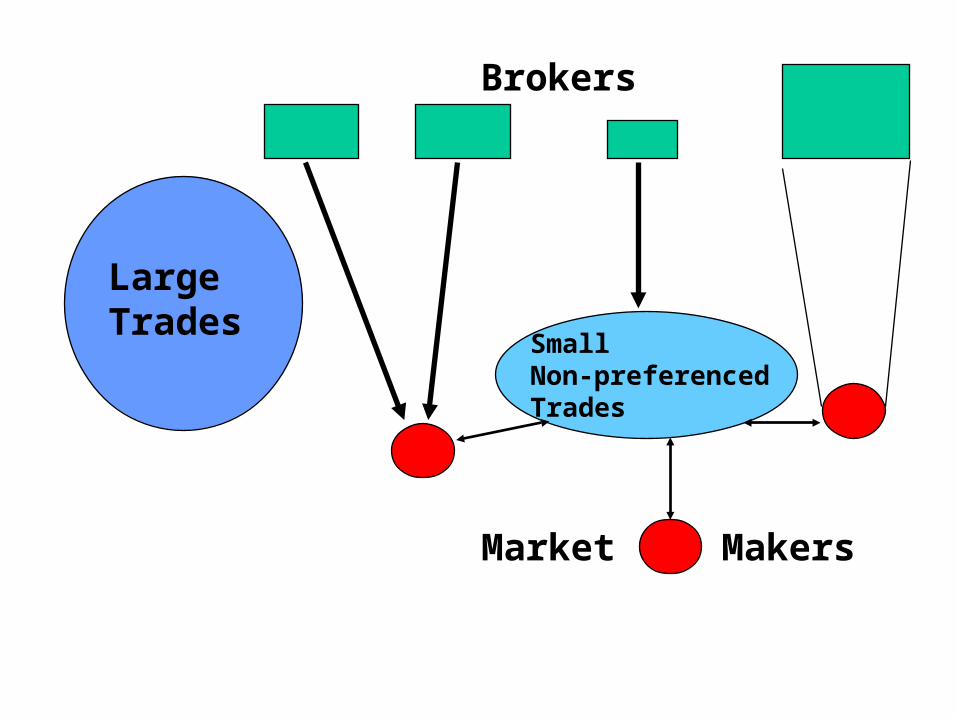
Brokers
Market Makers
Large Trades
Small Non-preferenced Trades
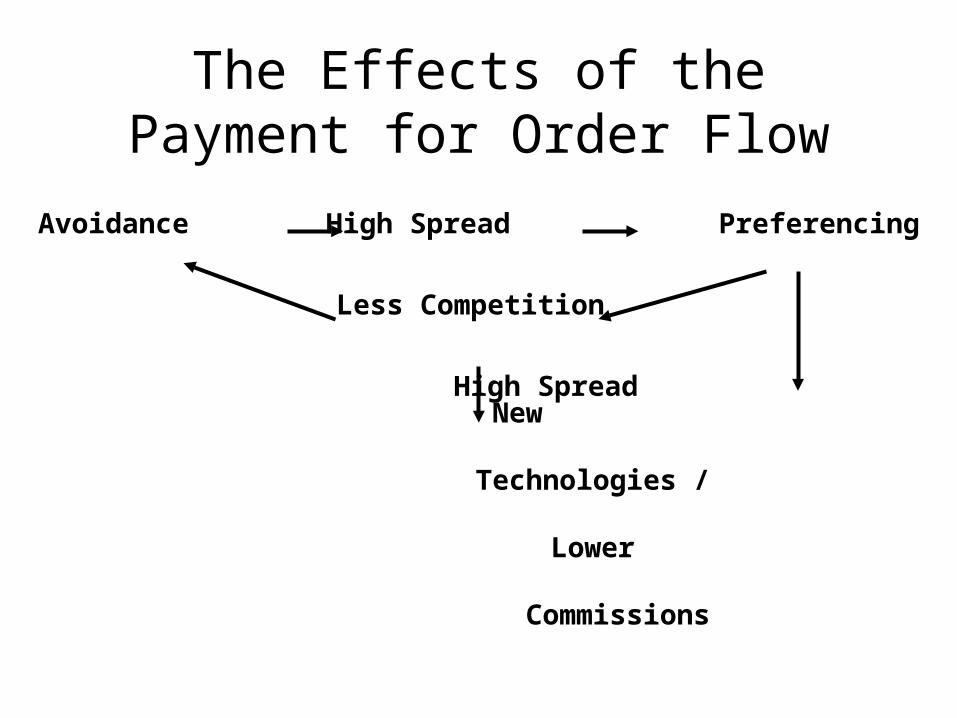
The Effects of the Payment for Order Flow
Avoidance High Spread Preferencing
Less Competition
High Spread New
Technologies /
Lower
Commissions
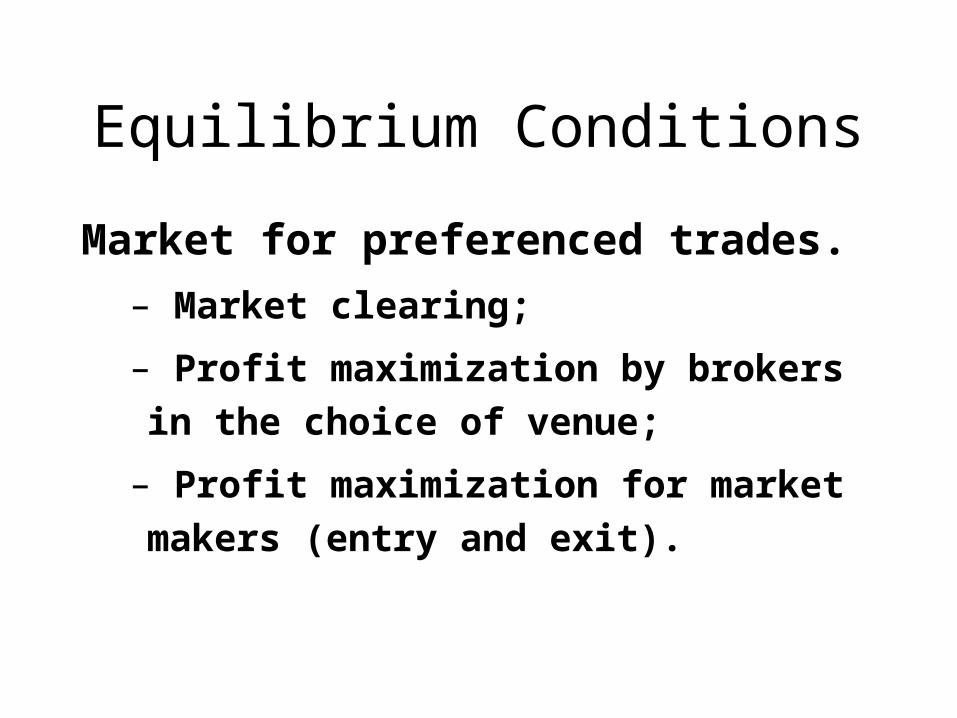
Equilibrium Conditions
Market for preferenced trades.
– Market clearing;
– Profit maximization by brokers in the choice of
venue;
– Profit maximization for market makers (entry
and exit).
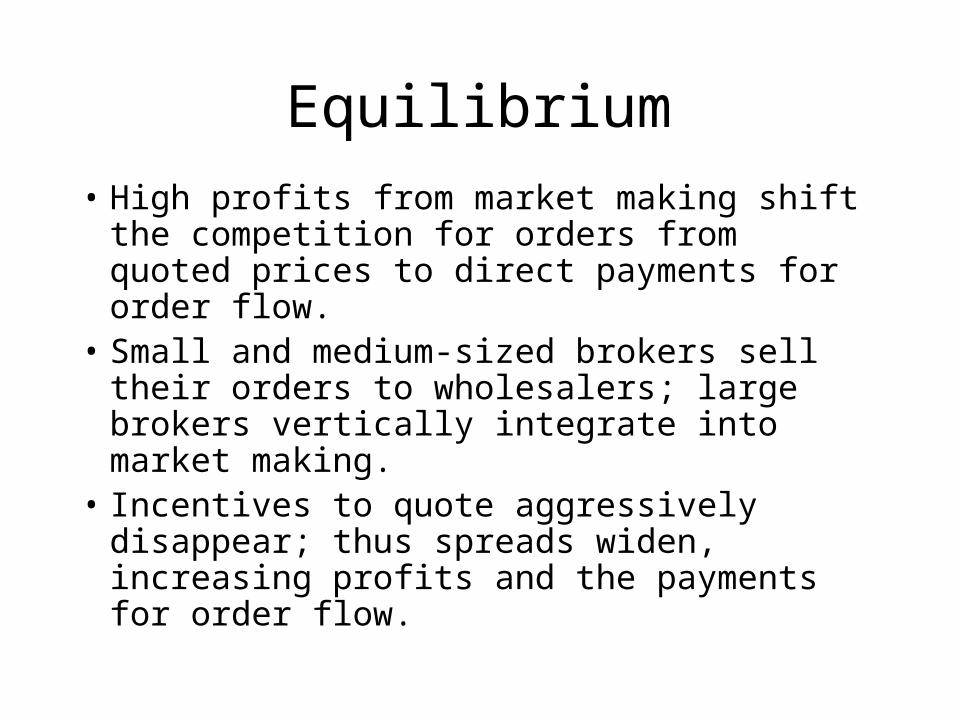
Equilibrium
• High profits from market making shift the competition for orders from quoted prices to direct payments for order flow.
• Small and medium-sized brokers sell their orders to wholesalers; large brokers vertically integrate into market making.
• Incentives to quote aggressively disappear; thus spreads widen, increasing profits and the payments for order flow.
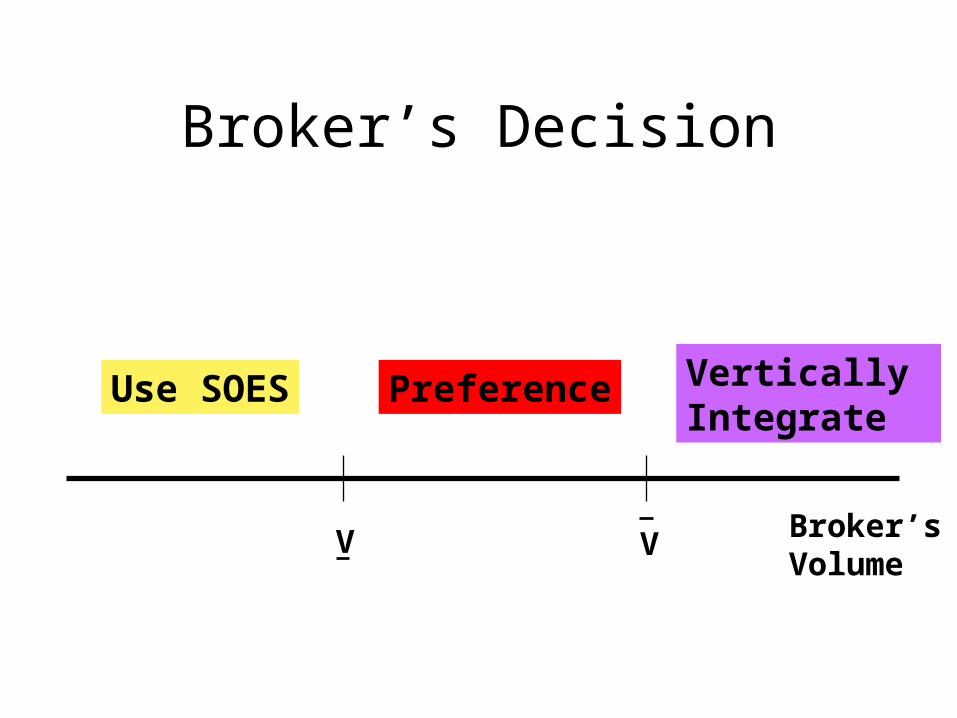
Broker’s Decision
Broker’sVolume
V V
Use SOES Preference Vertically Integrate
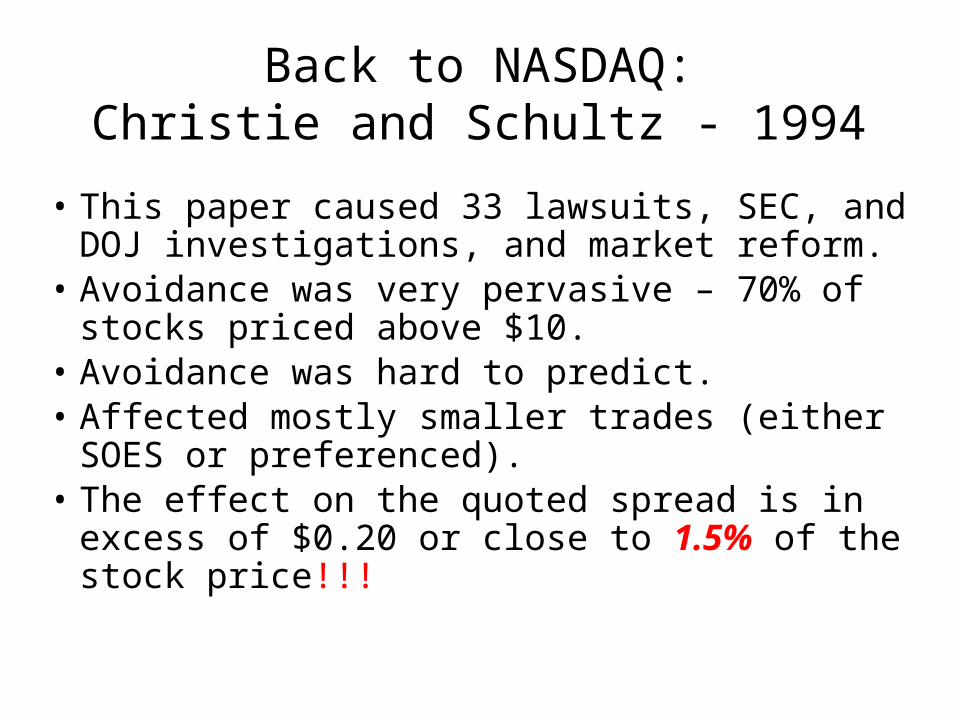
Back to NASDAQ:Christie and Schultz - 1994
• This paper caused 33 lawsuits, SEC, and DOJ investigations, and market reform.
• Avoidance was very pervasive – 70% of stocks priced above $10.
• Avoidance was hard to predict. • Affected mostly smaller trades (either SOES or
preferenced). • The effect on the quoted spread is in excess of
$0.20 or close to 1.5% of the stock price!!!
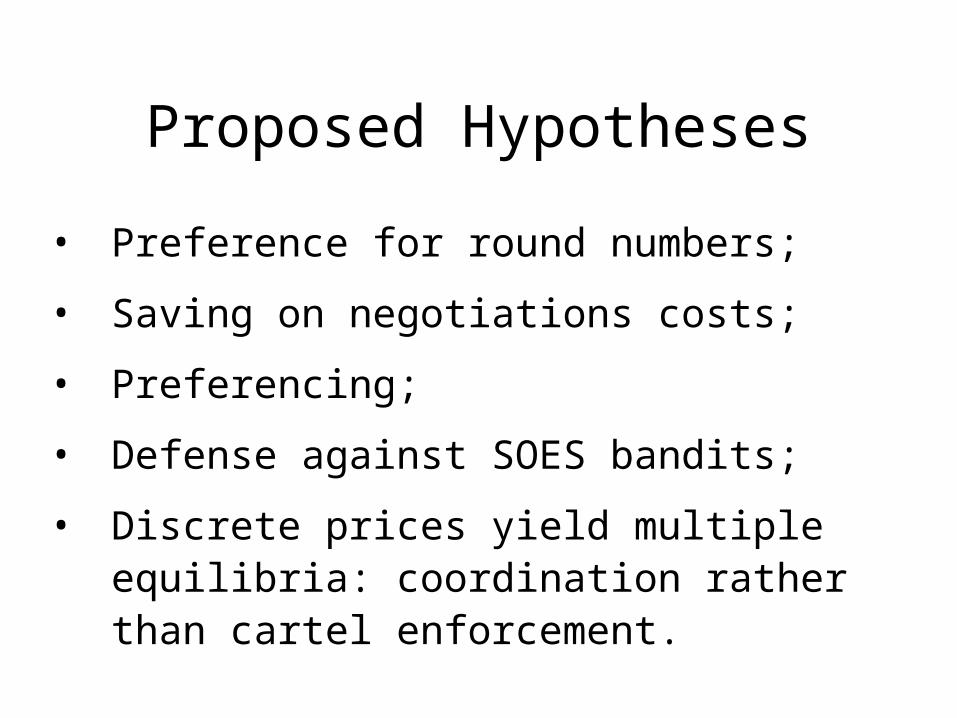
Proposed Hypotheses
• Preference for round numbers;
• Saving on negotiations costs;
• Preferencing;
• Defense against SOES bandits;
• Discrete prices yield multiple equilibria: coordination rather than cartel enforcement.
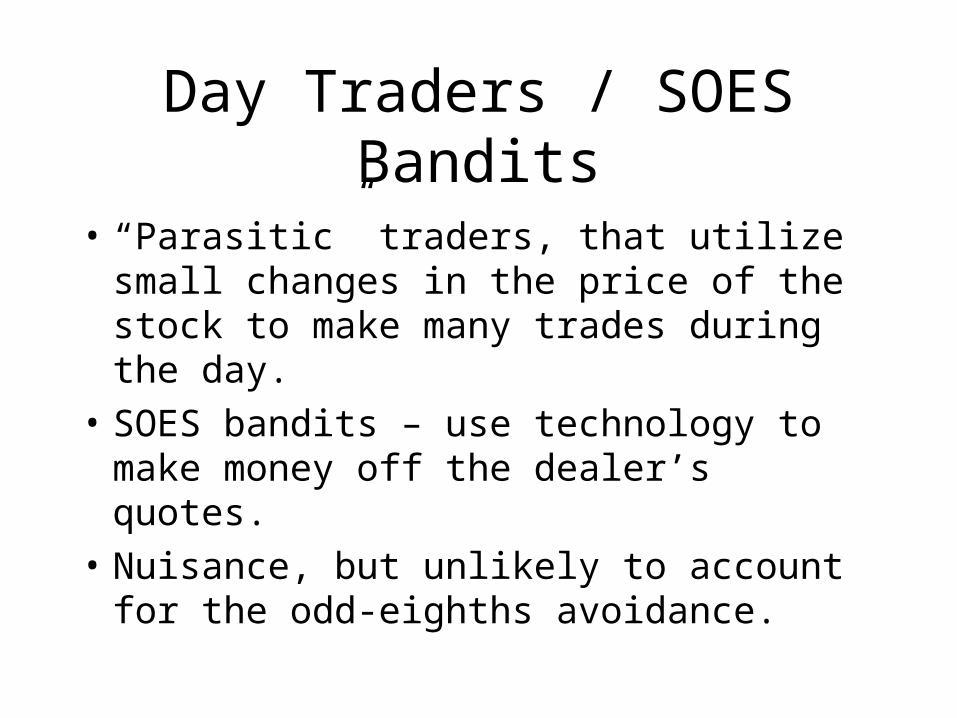
Day Traders / SOES Bandits
• “Parasitic” traders, that utilize small changes in the price of the stock to make many trades during the day.
• SOES bandits – use technology to make money off the dealer’s quotes.
• Nuisance, but unlikely to account for the odd-eighths avoidance.
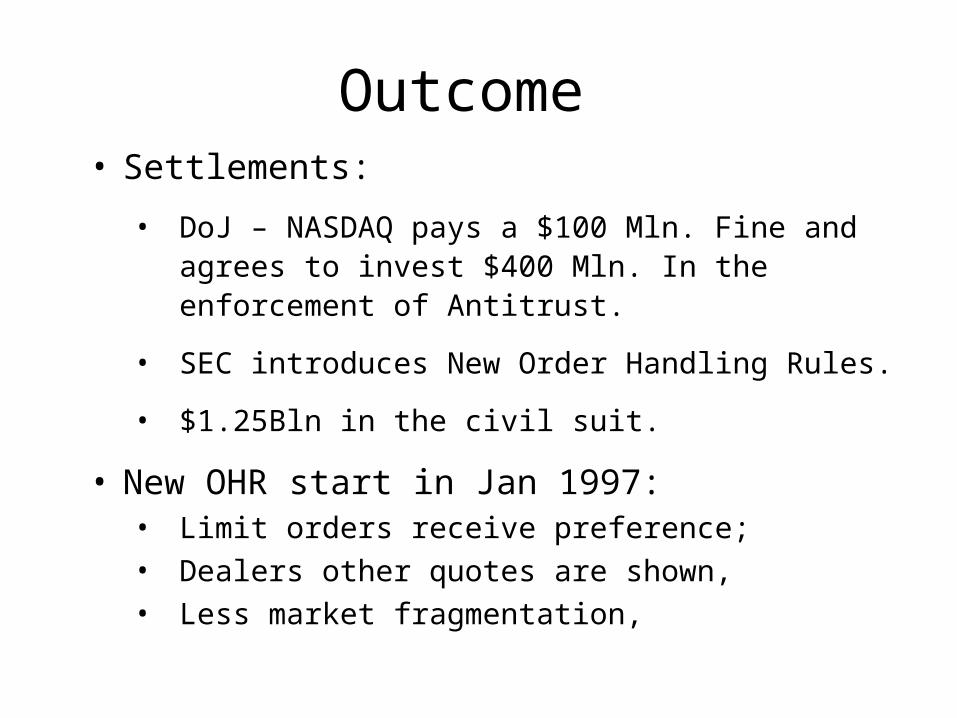
Outcome • Settlements:
• DoJ – NASDAQ pays a $100 Mln. Fine and agrees to invest $400 Mln. In the enforcement of Antitrust.
• SEC introduces New Order Handling Rules.
• $1.25Bln in the civil suit.
• New OHR start in Jan 1997:• Limit orders receive preference;
• Dealers other quotes are shown,
• Less market fragmentation,
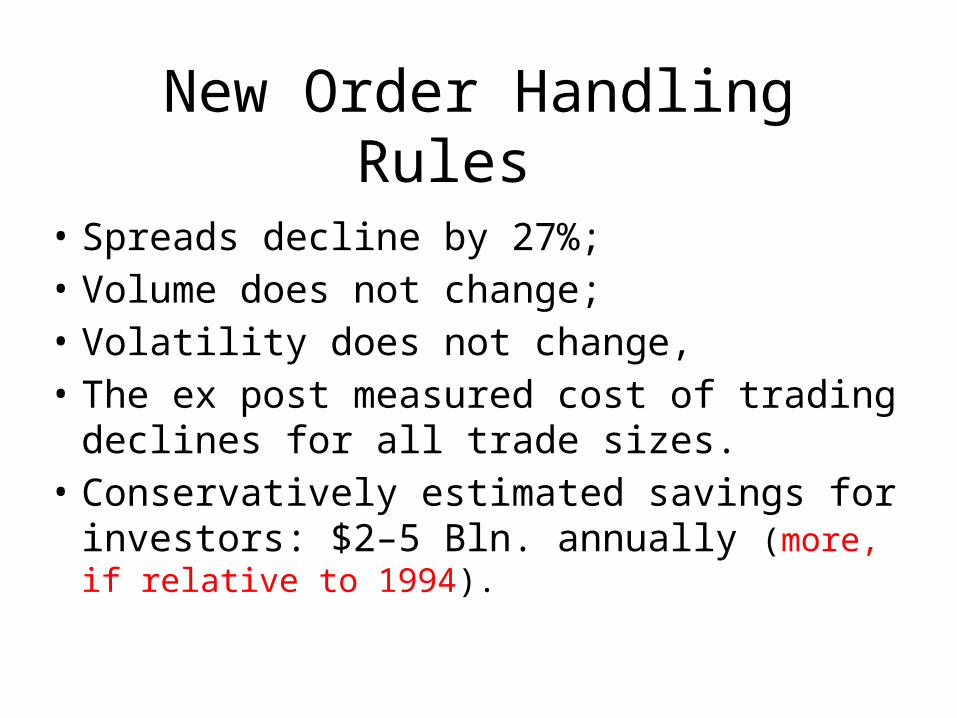
New Order Handling Rules
• Spreads decline by 27%; • Volume does not change; • Volatility does not change, • The ex post measured cost of trading declines
for all trade sizes. • Conservatively estimated savings for investors:
$2–5 Bln. annually (more, if relative to 1994).
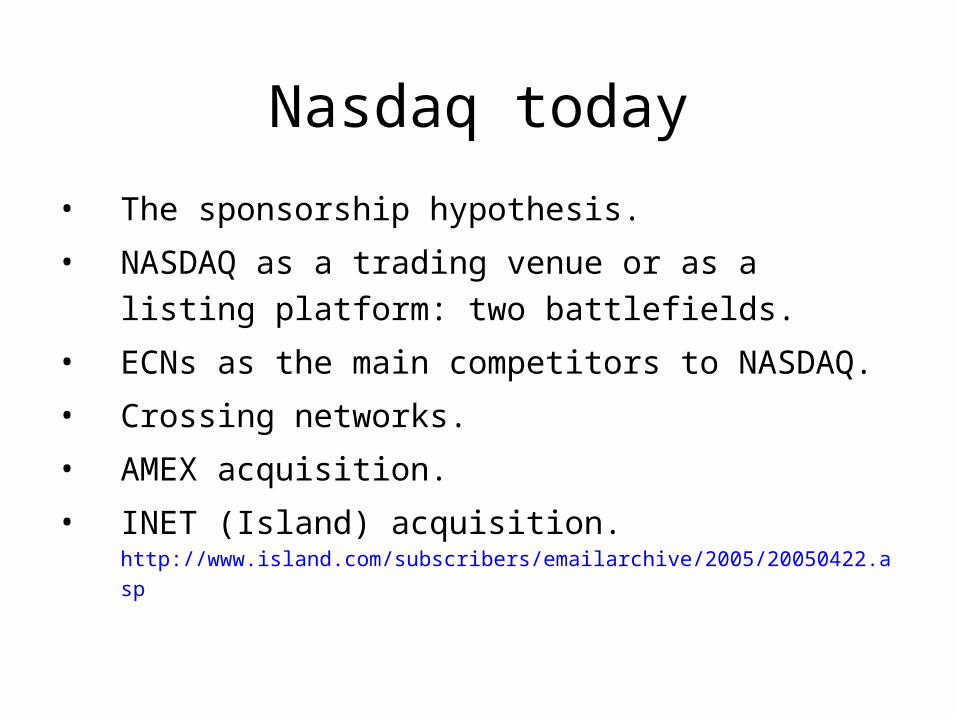
Nasdaq today
• The sponsorship hypothesis.
• NASDAQ as a trading venue or as a listing
platform: two battlefields.
• ECNs as the main competitors to NASDAQ.
• Crossing networks.
• AMEX acquisition.
• INET (Island) acquisition. http://www.island.com/subscribers/emailarchive/2005/20050422.asp
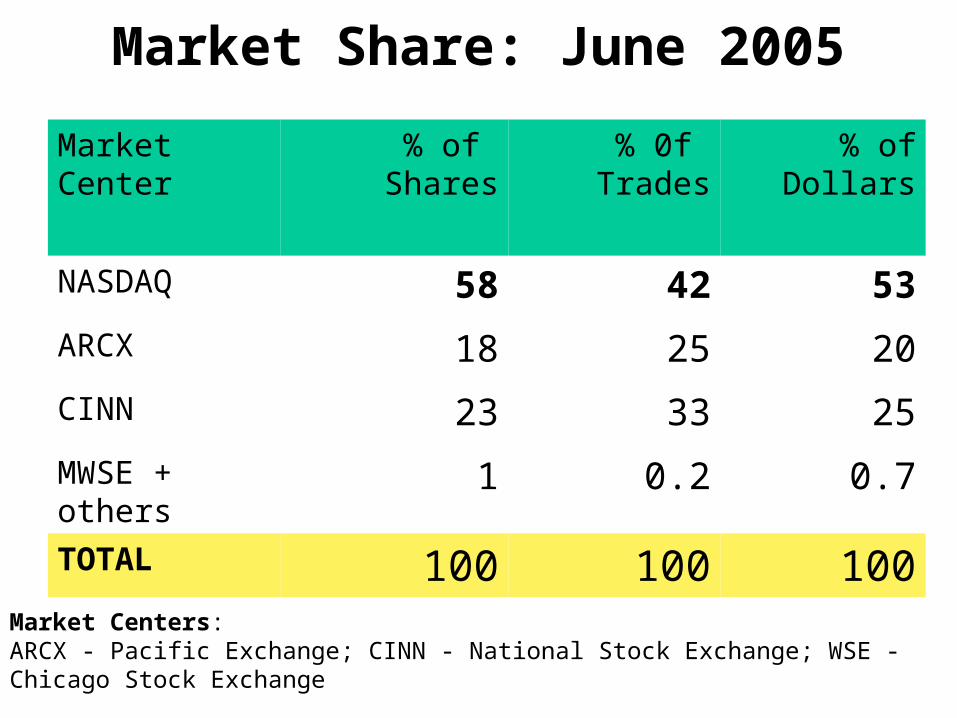
Market Share: June 2005
Market Center
% of Shares
% 0f Trades
% of Dollars
NASDAQ 58 42 53
ARCX 18 25 20
CINN 23 33 25
MWSE + others 1 0.2 0.7
TOTAL 100 100 100
Market Centers: ARCX - Pacific Exchange; CINN - National Stock Exchange; WSE - Chicago Stock Exchange
Conclusions
• Competition is a fragile creature: one must provide it with the right conditions.
• Competition takes many forms.• Very important to pay attention to small
details – they may determine the outcomes.
• Self-regulation sometimes needs help: the reduction of the tick size in 1997 and 2001.
Exercise IV
• Download the evolution of the market share
statistics from the NASDAQ Website:
www.nasdaq.com/newsroom/stats/Performance_Report.stm#item_1
• Provide a brief explanation(s) for the changes
that took place in the NASDAQ market share
over the last couple of years. Be brief.