Embed Size (px)
Citation preview

Al-Rafidain University Collage Civil Engineering Department
Soil Mechanics Lectures for Third Year Students By Dr. Ahmed Al-Adly
Ph. D Civil / Geotechnical Engineering
Lecture 5: Grain Size Analysis of Soil 52
Lecture 5
Grain Size Analysis of Soil
5.1 Grain Size Analysis of Soil
Grain size analysis, also called "Mechanical Analysis of Soil" is the standard laboratory
test for the determination of the particle size distribution of soil. Its use to determine the
size range of particles presents in a soil and finds the percentage by weight of each size.
The distribution of grain sizes affects the engineering properties of soil such as
permeability, strength, and swelling potential.
The Purpose of Grain Size Analysis is:
❶ Measure the particle size distribution of soil.
❷ Required in engineering classification of soil.
❸ The data obtained from grain size analysis used in the design of earth dams and
determination the suitability of soil for road construction and airfields.
The Methods Used in Grain Size Analysis of Soil are:
❶ Sieve Analysis for particle sizes 0.075 mm in diameter (coarse-grained soil).
❷ Hydrometer Analysis for particle sizes 0.075 mm in diameter (fine-grained soil).
Hint:
The diameter that separates between coarse-gained soil and fine-grained soil is
(0.075 mm); this diameter represents the size of sieve No. 200.
Hint: The word "Analysis" here means laboratory test

Al-Rafidain University Collage Civil Engineering Department
Soil Mechanics Lectures for Third Year Students By Dr. Ahmed Al-Adly
Ph. D Civil / Geotechnical Engineering
Lecture 5: Grain Size Analysis of Soil 53
5.2 Sieve Analysis
❶ Is a laboratory test, used to determine the particle size distribution of a coarse-grained
soil (sand and gravel).
❷ The test performed by passing the soil through a series of standard sieves having
successively smaller opening sizes as shown in Figure (5-1).
❸ A common set of sieve used in sieve analysis is U.S. standard sieve as shown in table
and Figure (5-2) below.
❹ The sieve No. 200 is the sieve with smallest opening (0.075 mm in diameter). The
sieve analysis is performed on soil retained on a sieve No. 200 only.
U.S. Sieve No. Opening Size (mm) 4 4.75 10 2.00 20 0.85 40 0.425 60 0.250 100 0.150 200 0.075
4 10 40 200
Figure (5-2): ASTM Standard Sieves used in sieve analysis
Figure (5-1): Passing the soil through the standard sieves
4 (coarsest)
200 (smallest)
Pan
Smaller opening size
Retained = Gravel
Passing = Sand
Passing = Clay & Silt
Basic Principles

Al-Rafidain University Collage Civil Engineering Department
Soil Mechanics Lectures for Third Year Students By Dr. Ahmed Al-Adly
Ph. D Civil / Geotechnical Engineering
Lecture 5: Grain Size Analysis of Soil 54
❶ Oven-dry the soil and then break all lumps into small particles.
❷ The soil then poured and shaken through a set of sieves with openings of decreasing
size from top to bottom and a pan is placed below the set as shown in Figures
(5-3), (5-4) and (5-5).
❸ After the soil is shaken, determine the weight of soil retained on each sieve as:
W1, W2, ............... Wn and in the pan (Wp)
❹ Determine the total weight (Wt) of the soil as:
Wt = W1 + W2 +............ Wn + Wp
❺ Determine the percent of soil retained on each sieve as:
Wieght retained (Wn)Total weight (Wt)
× 100
❻ Determine the cumulative percent of soil retained on each sieve.
❼ Determine the percent of finer or passing from each sieve as:
% Finer or Passing = 100 ‒ % of cumulative of soil retained
❽ From the sieve analysis, we can find the percentages of gravel, sand, silt, and clay-size
particles present in a soil as the following:
% Gravel = 100 − % passing 4
% Sand = % passing 4 − % passing 200
% Silt and Clay = % passing 200
❾ Finally, the particle size distribution of soil obtained from sieve analysis is plotted on
semi-log paper with grain size (opening size) on a log scale and percent of finer on a
natural scale. This plot called the particle-size distribution curve (Figure 5-6).
Sieve Analysis Procedure
Hint: Sieve No. represent by (), for example, sieve No. 4 4 sieve No. 200 200

Al-Rafidain University Collage Civil Engineering Department
Soil Mechanics Lectures for Third Year Students By Dr. Ahmed Al-Adly
Ph. D Civil / Geotechnical Engineering
Lecture 5: Grain Size Analysis of Soil 55
Figure (5-6): Typical Particle-Size Distribution Curve Obtained from Sieve Analysis
Figure (5-3): A Set of Sieve
Figure (5-5): Sieve Shaker
Figure (5-4): Pouring of Soil

Al-Rafidain University Collage Civil Engineering Department
Soil Mechanics Lectures for Third Year Students By Dr. Ahmed Al-Adly
Ph. D Civil / Geotechnical Engineering
Lecture 5: Grain Size Analysis of Soil 56
5.3 Hydrometer Analysis
❶ Also called "Sedimentation Analysis”, is a laboratory test that used to determine the
particle size distribution of a fine-grained soil (silt and clay) for soil finer from 200.
❷ Hydrometer analysis is based on the principle of sedimentation of soil particles in
water and uses a Stoke's law to determine the particle sizes, which governs the velocity
at which spherical particles settle in a suspension: the larger the particles the greater is
the settling velocity and vice versa. Stoke's Law:
훎 =훒퐬 − 훒퐰ퟏퟖ훈
× 퐃ퟐ
Where:
ν: Velocity of particle
ρ : Density of soil particle
ρ : Density of soil particle
η: Viscosity of water
D: Diameter of soil particle
❸ Based on Stoke's law, when a soil sample is dispersed in water, the particles settle at
different velocities, depending on their shape, size, weight, and the viscosity of the
water.
In hydrometer analysis, a soil is dispersed in a suspension as shown in Figure (5-7) above
and observing how the suspension settles in time. Larger particles will settle quickly
followed by smaller particles. By using Stoke's low, the particle size (D) and percent of
soil in suspension are computed.
Basic Principles
Hydrometer Analysis Procedure
Figure (5-7): Hydrometer Analysis

Al-Rafidain University Collage Civil Engineering Department
Soil Mechanics Lectures for Third Year Students By Dr. Ahmed Al-Adly
Ph. D Civil / Geotechnical Engineering
Lecture 5: Grain Size Analysis of Soil 57
5.4 Particle or Grain-Size Distribution Curve
The particle-size distribution curve is a plot represents the distribution of particles of
different sizes in the soil. It is represents the plot of the results obtained from grain size
analysis (sieve and hydrometer analysis). The curve is plotted on semi- log graph paper
with grain size (opening size) on a log scale and percent of finer (passing) on a natural
scale as shown in Figure (5-8).
Figure (5-8): Particle-Size Distribution Curve
The particle-size distribution curve is useful in soil classification and gradation, the
particle-size distribution curve more benefits in coarse-grained soil. From the particle-size
distribution curve, we can found the following parameters, these parameters is used to
describe the gradation and classification of coarse-grained soil (Figure 5-9):
0
10
20
30
40
50
60
70
80
90
100
0.0010.010.11
% F
iner
by
Wei
ght
Grain Size, D (mm)
Curve (1) Coarse-grained
soil
Curve (2) Fine-grained
soil
Hydrometer analysis Sieve analysis
10
Use of Particle-Size Distribution Curve

Al-Rafidain University Collage Civil Engineering Department
Soil Mechanics Lectures for Third Year Students By Dr. Ahmed Al-Adly
Ph. D Civil / Geotechnical Engineering
Lecture 5: Grain Size Analysis of Soil 58
❶ Effective Size (D10): is the diameter in particle-size distribution curve corresponding
to (10 %) finer. Effective Size (D10) very important parameter, it is used in permeability
calculations in coarse-grained soil.
❷ (D30): is the diameter in particle-size distribution curve corresponding to (30 %) finer.
❸ (D60): is the diameter in particle-size distribution curve corresponding to (60 %) finer.
❹ Coefficient of Uniformity (Cu): it is defined as the following:
퐂퐮 =퐃ퟔퟎ
퐃ퟏퟎ… … … … … … … … … (ퟓ − ퟏ)
❺ Coefficient of Curvature or Gradation (Cc): it is defined as the following:
퐂퐜 =(퐃ퟑퟎ)ퟐ
퐃ퟏퟎ × 퐃ퟔퟎ… … … … … … … … . . .ퟓ − ퟐ)
The coefficient of uniformity (Cu) and curvature (Cc) used to determine the gradation of
coarse-grained soil.
Figure (5-9): Determination of D10, D30, and D60
0
10
20
30
40
50
60
70
80
90
100
0.010.1110
% F
iner
by
Wei
ght
Grain Size, D (mm)D10 D30 D60
퐂퐮 =퐃ퟔퟎ
퐃ퟏퟎ=ퟎ.ퟒퟗퟎ.ퟏퟔ
= ퟑ.ퟎퟔ
퐂퐜 =(퐃ퟑퟎ)ퟐ
퐃ퟏퟎ × 퐃ퟔퟎ=
(ퟎ.ퟑퟒ)ퟐ
ퟎ.ퟏퟔ× ퟎ.ퟒퟗ= ퟏ.ퟒퟕ
For example: From the figure, we can found:
D10 = 0.16 mm, D30 = 0.34 mm, D60 = 0.49 mm

Al-Rafidain University Collage Civil Engineering Department
Soil Mechanics Lectures for Third Year Students By Dr. Ahmed Al-Adly
Ph. D Civil / Geotechnical Engineering
Lecture 5: Grain Size Analysis of Soil 59
5.5 Gradation of Soil
The gradation is a property of coarse-grained soil (sand and gravel); it is describe the
distribution of particles sizes within a soil. Gradation of a soil is determined by reading the
particle-size distribution curve (shape of curve) produced from sieve analysis of soil as
shown in Figure (5-10).
Figure (5-10): Particle-Size Distribution Curve of Different Soil Gradation
Depending on particle-size distribution curves presented in Figure (5-10), the gradation
sand and gravel can be one of the following:
❶ Well Graded Represents Curve (1): a soil is said to be well graded if it has the
wide range of particle sizes, the soil here also called non-uniform soil. Figure (5-11 a)
❷ Poorly Graded Represents Curve (2): a soil is said to be poorly graded if it has the
nearly same size of particles, the soil here also called uniform soil. Figure (5-11 b)
❸ Gap Graded Represents Curve (3): a soil is said to be gap graded if at least one
particle size is missing. Figure (5-11 c)
0
10
20
30
40
50
60
70
80
90
100
0.010.1110
% F
iner
by
Wei
ght
Grain Size, D (mm)
Curve (1): Well graded
soil
Curve (2): Poorly graded
soil
Curve (3): Gap graded soil

Al-Rafidain University Collage Civil Engineering Department
Soil Mechanics Lectures for Third Year Students By Dr. Ahmed Al-Adly
Ph. D Civil / Geotechnical Engineering
Lecture 5: Grain Size Analysis of Soil 60
Figure (5-11): Soil Gradation Categories
Gradation of a soil can be determined by calculating the coefficient of uniformity (Cu) and
coefficient of curvature (Cc) and comparing the calculated values with limits. The
following criteria are adopted for soil gradation:
❶ For a Gravelly soil:
If Cu 4 and 1 Cc 3 the gravel is termed well graded
If both of these criteria are not met the gravel is termed poorly graded
❷ For Sandy Soil:
If Cu 6 and 1 Cc 3 the sand is termed well graded
If both of these criteria are not met the sand is termed poorly graded
(a): Well Graded (b): Poorly Graded (a): Gap Graded
Criteria for Soil Gradation

Al-Rafidain University Collage Civil Engineering Department
Soil Mechanics Lectures for Third Year Students By Dr. Ahmed Al-Adly
Ph. D Civil / Geotechnical Engineering
Lecture 5: Grain Size Analysis of Soil 61
Experimental Example: The following are the results of a sieve analysis test conducted
on a soil sample of sand:
Sieve No. Sieve size (mm) Weight of soil retained (g) 4 4.75 9.7 10 2.00 39.5 20 0.850 71.6 40 0.425 129.1 60 0.250 107.4
100 0.150 105.0 200 0.075 8.5 Pan — 1.7
1- Make your analysis and draw the grain-size distribution curve.
2- Determine the percentages of gravel, sand, silt, and clay.
3- Determine D10, D30, and D60 from the grain – size distribution curve.
4- Calculate the uniformity coefficient (Cu) and the coefficient of gradation (Cc).
5- State the soil poorly graded or well graded.
Solution: Calculate the total weight of soil sample (Wt) as:
Wt = ∑ of soil retained on each sieve + weight of soil on pan
Wt = ∑ of col. (3) = 421.2 g
Calculate % retained on each sieve Col. (4) as:
% Retained on each sieve =Weight of soil retained (W)
Total weight of soil (Wt)× 100
Calculate the cumulative of (% retained on each sieve) Col. (5) as shown in table
Calculate % passing from each sieve Col. (6) as:
% Passing from each sieve = 100 − Cumulative of % retained
Col. (6) = 100 − (Col. 5)
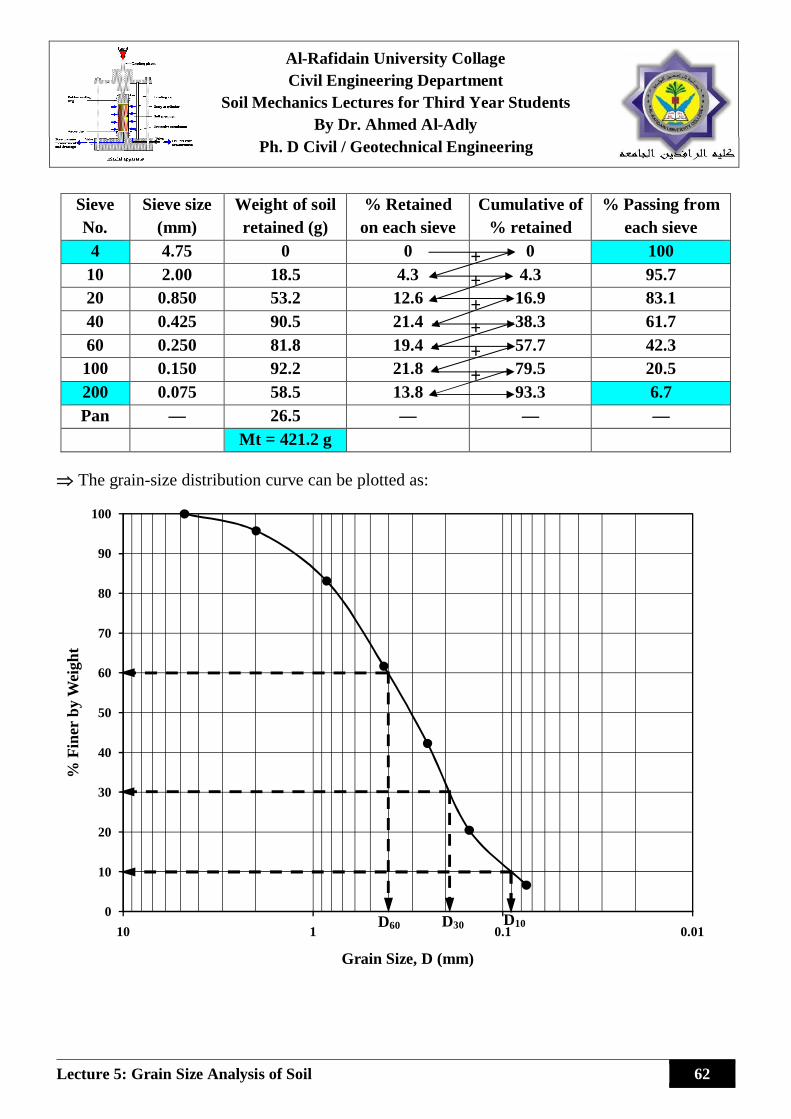
The final particle size distribution of soil is presented in the table below:
Al-Rafidain University Collage Civil Engineering Department
Soil Mechanics Lectures for Third Year Students By Dr. Ahmed Al-Adly
Ph. D Civil / Geotechnical Engineering
Lecture 5: Grain Size Analysis of Soil 62
Sieve No.
Sieve size (mm)
Weight of soil retained (g)
% Retained on each sieve
Cumulative of % retained
% Passing from each sieve
4 4.75 0 0 0 100 10 2.00 18.5 4.3 4.3 95.7 20 0.850 53.2 12.6 16.9 83.1 40 0.425 90.5 21.4 38.3 61.7 60 0.250 81.8 19.4 57.7 42.3 100 0.150 92.2 21.8 79.5 20.5 200 0.075 58.5 13.8 93.3 6.7 Pan — 26.5 — — —
Mt = 421.2 g The grain-size distribution curve can be plotted as:
+ + +
+ + +
0
10
20
30
40
50
60
70
80
90
100
0.010.1110
% F
iner
by
Wei
ght
Grain Size, D (mm)
D60 D30 D10

Al-Rafidain University Collage Civil Engineering Department
Soil Mechanics Lectures for Third Year Students By Dr. Ahmed Al-Adly
Ph. D Civil / Geotechnical Engineering
Lecture 5: Grain Size Analysis of Soil 63
2- The percentages of gravel, sand, silt and clay can be determined as:
% Gravel = 100 - % passing 4 = 100 – 100 % Gravel = 0.0 %
% Sand = % passing 4 - % passing 200 = 100 – 6.7 % Sand = 93.3 %
% Silt and Clay (fines) = % passing 200 % (fines) = 6.7 %
3- D10, D30, and D60 can be determined from the grain-size distribution curve as:
D10 = 0.09 mm, D30 = 0.19 mm, D60 = 0.4 mm
4- The uniformity coefficient (Cu) and the coefficient of gradation (Cc) can be calculated as:
Cu =DD
=0.4
0.09= ퟒ.ퟒퟒ and Cc =
(D )D × D
=(0.19)
0.09 × 0.4= ퟏ.ퟎퟎퟑ
5- From the results, we can concluded that:
The type of soil is Sand, where % sand in soil = 93.3 %
The gradation of sand can be determine as:
Cu = 4.44 6 not Okay and Cc = 1.003 between (1 and 3) the Sand is poorly graded

Al-Rafidain University Collage Civil Engineering Department
Soil Mechanics Lectures for Third Year Students By Dr. Ahmed Al-Adly
Ph. D Civil / Geotechnical Engineering
Lecture 5: Grain Size Analysis of Soil 64
Q (1): The following are the results of sieve analysis performed on soil sample:
Sieve No. Sieve size (mm) Weight of soil retained (g) 4 4.75 0 10 2.00 41.2 20 0.850 55.1 40 0.425 80.0 60 0.250 91.6
100 0.150 60.5 200 0.075 35.6 Pan — 21.5
1- Determine the percent passing than each sieve and plot a grain-size distribution curve.
2- Determine the percentages of gravel, sand, silt, and clay.
3- Determine D10, D30, and D60 from the grain -size distribution curve.
4- Calculate the uniformity coefficient (Cu) and the coefficient of gradation (Cc).
5- Comment on the type of soil and gradation.
Q (2): During sieve analysis test, the results obtained are shown in the following table:
1- Complete the empty fields in the table shown.
2- Find the coefficient of uniformity (Cu) and coefficient of curvature (Cc) for this soil.
Sieve No.
Sieve opening (mm)
Weight of soil retained (g)
Percent Retained
Cumulative of percent retained
Percent Finer
4 4.75 0 10 2.00 0 20 0.850 200 40 0.425 75
100 0.150 75 200 0.075 100 Pan — 50
Problems and Questions

Al-Rafidain University Collage Civil Engineering Department
Soil Mechanics Lectures for Third Year Students By Dr. Ahmed Al-Adly
Ph. D Civil / Geotechnical Engineering
Lecture 5: Grain Size Analysis of Soil 65
Q (3): Multiple-Choice Questions (MCQ) — Select the Correct Answer:
1- For a sandy soil, effective size (D10) = 0.09 mm and coefficient of uniformity (Cu) = 4.56,
the diameter corresponding to (60 %) finer will be:
(a): 0.02 mm (b): 50.67 mm (c): 0.41 mm (d): none of the these
2- U.S. sieve number 200 refers to:
(a): 0.075 mm (b): 0. 15 mm (c): 0.425 mm (d): 2.00 mm
3- Effective size of soil particles is denoted by:
(a): D30 (b): D50 (c): D60 (d): D10
4- The coefficient of uniformity (Cu) of well graded gravel should be:
(a): more than (6) (b): more than (4) (c): less than (6) (d): less than (4)
5- For a well graded sand, the coefficient of curvature (Cc) should be:
(a): more than (3) (b): less than (1) (c): between 1 and 3 (d): none of the these
6- Grain size analysis of a soil indicated that, D10 = 0.0005 mm, D30 = 0.003 mm, and D60 =
0.006 mm. The coefficient of uniformity (Cu) of this soil is:
(a): 0.5 (b): 6.0 (c): 12.0 (d): 2.0
Q (4): Answer with True (T) or False (F) and correct the false ones:
1- Soil particles larger than (0.075 mm) are analyzed by hydrometer analysis.
2- A soil having uniformity coefficient (Cu) less than about (1) is considered uniform.
3- The range of coefficient of curvature (Cc) of well graded soil is between 1 to 3
4- The sieve analysis is useful for all soil particles smaller than (0.075 mm).
5- A well graded soil contains particles of one size.
6- A soil is said to be poorly graded if it has wide range of particle sizes.
7- A soil is said to be gap graded if it has approximately the same size of particles.
8- A uniform soil has more strength than a non-uniform soil.