Embed Size (px)
Citation preview

Computer Graphics CMU 15-462/15-662
Lecture 5:
Drawing a Triangle (and an Intro to Sampling)

CMU 15-462/662
HW 0.5 Done, HW 1 Out Today!▪ GOAL: Implement a basic “rasterizer”
- (Topic of today’s lecture) - We hand you a bunch of lines, triangles, etc. - You draw them by lighting up pixels on the screen!
▪ Code skeleton available from course webpage
▪ DUE SEPTEMBER 24 (in 2 weeks)

CMU 15-462/662
TODAY: Rasterization▪ Two major techniques for “getting stuff on the screen”
▪ Rasterization (TODAY) - for each primitive (e.g., triangle), which pixels light up? - extremely fast (BILLIONS of triangles per second on GPU) - harder (but not impossible) to achieve photorealism - perfect match for 2D vector art, fonts, quick 3D preview, …
▪ Ray tracing (LATER) - for each pixel, which primitives are seen? - easier to get photorealism - generally slower - much more later in the semester!

CMU 15-462/662
3D Image Generation Pipeline(s)▪ Can talk about image generation in terms of a “pipeline”:
- INPUTS — what image do we want to draw?
- STAGES — sequence of transformations from input→output - OUTPUTS — the final image
VERTICESA: ( 1, 1, 1 ) E: ( 1, 1,-1 )B: (-1, 1, 1 ) F: (-1, 1,-1 )C: ( 1,-1, 1 ) G: ( 1,-1,-1 )D: (-1,-1, 1 ) H: (-1,-1,-1 )
EDGESAB, CD, EF, GH,AC, BD, EG, FH,AE, CG, BF, DH
p=(x,y,z)
q=(u,v)
1z
y
v
INPUT OUTPUTPERSPECTIVE PROJECTION
STAGE
LINE DRAWING
STAGE
E.g., our pipeline from the first lecture:

CMU 15-462/662
Rasterization Pipeline▪ Modern real time image generation based on rasterization
- INPUT: 3D “primitives”—essentially all triangles! - possibly with additional attributes (e.g., color)
- OUTPUT: bitmap image (possibly w/ depth, alpha, …) ▪ Our goal: understand the stages in between*
VERTICESA: ( 1, 1, 1 ) E: ( 1, 1,-1 )B: (-1, 1, 1 ) F: (-1, 1,-1 )C: ( 1,-1, 1 ) G: ( 1,-1,-1 )D: (-1,-1, 1 ) H: (-1,-1,-1 )
TRIANGLESEHF, GFH, FGB, CBG,GHC, DCH, ABD, CDB,HED, ADE, EFA, BAF
INPUT (TRIANGLES)
RASTERIZATION PIPELINE
OUTPUT (BITMAP IMAGE)
*In practice, usually executed by graphics processing unit (GPU)

CMU 15-462/662
▪ Rasterization pipeline converts all primitives to triangles - even points and lines!
▪ Why? - can approximate any shape - always planar, well-defined normal - easy to interpolate data at corners
- “barycentric coordinates”
▪ Key reason: once everything is reduced to triangles, can focus on making an extremely well-optimized pipeline for drawing them
Why triangles?
“point”“line”
CMU 15-462/662
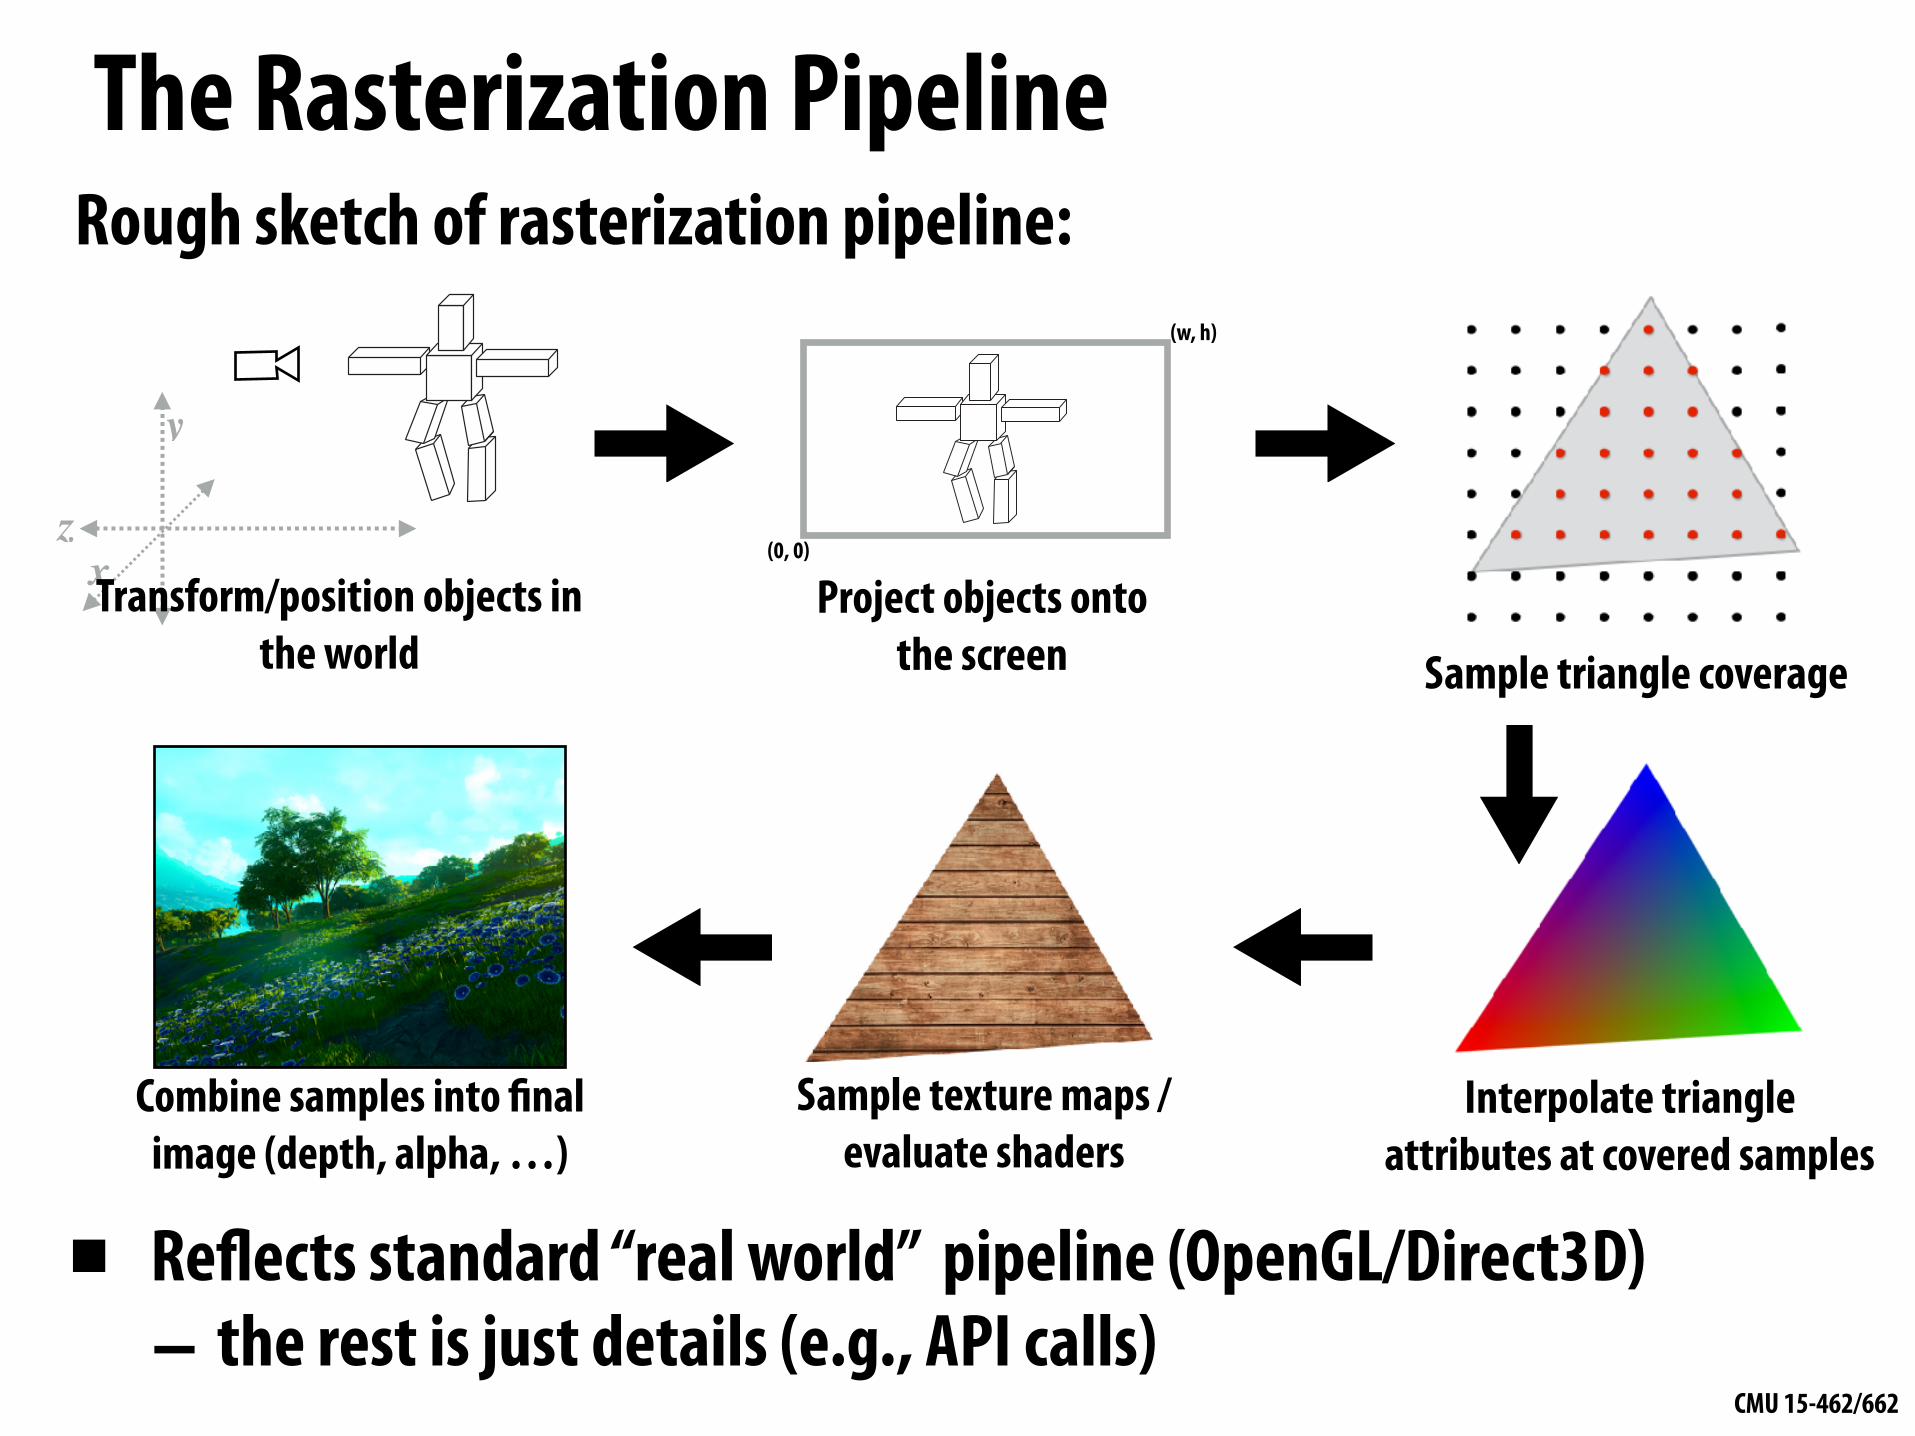
The Rasterization PipelineRough sketch of rasterization pipeline:
▪ Reflects standard “real world” pipeline (OpenGL/Direct3D) – the rest is just details (e.g., API calls)
zx
y
Project objects onto the screen
(0, 0)
(w, h)
Interpolate triangle attributes at covered samples
Sample triangle coverage
Sample texture maps / evaluate shaders
Combine samples into final image (depth, alpha, …)
Transform/position objects in the world

CMU 15-462/662
Let’s draw some triangles on the screen
Question 1: what pixels does the triangle overlap? (“coverage”)
Question 2: what triangle is closest to the camera in each pixel? (“occlusion”)
Pixel

CMU 15-462/662
The visibility problem▪ An informal definition: what scene geometry is visible
within each screen pixel? - What scene geometry projects into a screen pixel? (coverage)
- Which geometry is visible from the camera at that pixel? (occlusion)
Pinhole Camera
(0,0)Virtual Sensor
(x,z)
1
x/zz-axis
x-axis
(Recall pinhole camera from first lecture)

CMU 15-462/662
The visibility problem
Pinhole Camera
(0,0)Virtual Sensor
(x,z)
1
x/z
z-axis
x-axis
▪ An informal definition: what scene geometry is visible within each screen pixel? - What scene geometry projects into a screen pixel? (coverage)
- Which geometry is visible from the camera at that pixel? (occlusion)
CMU 15-462/662
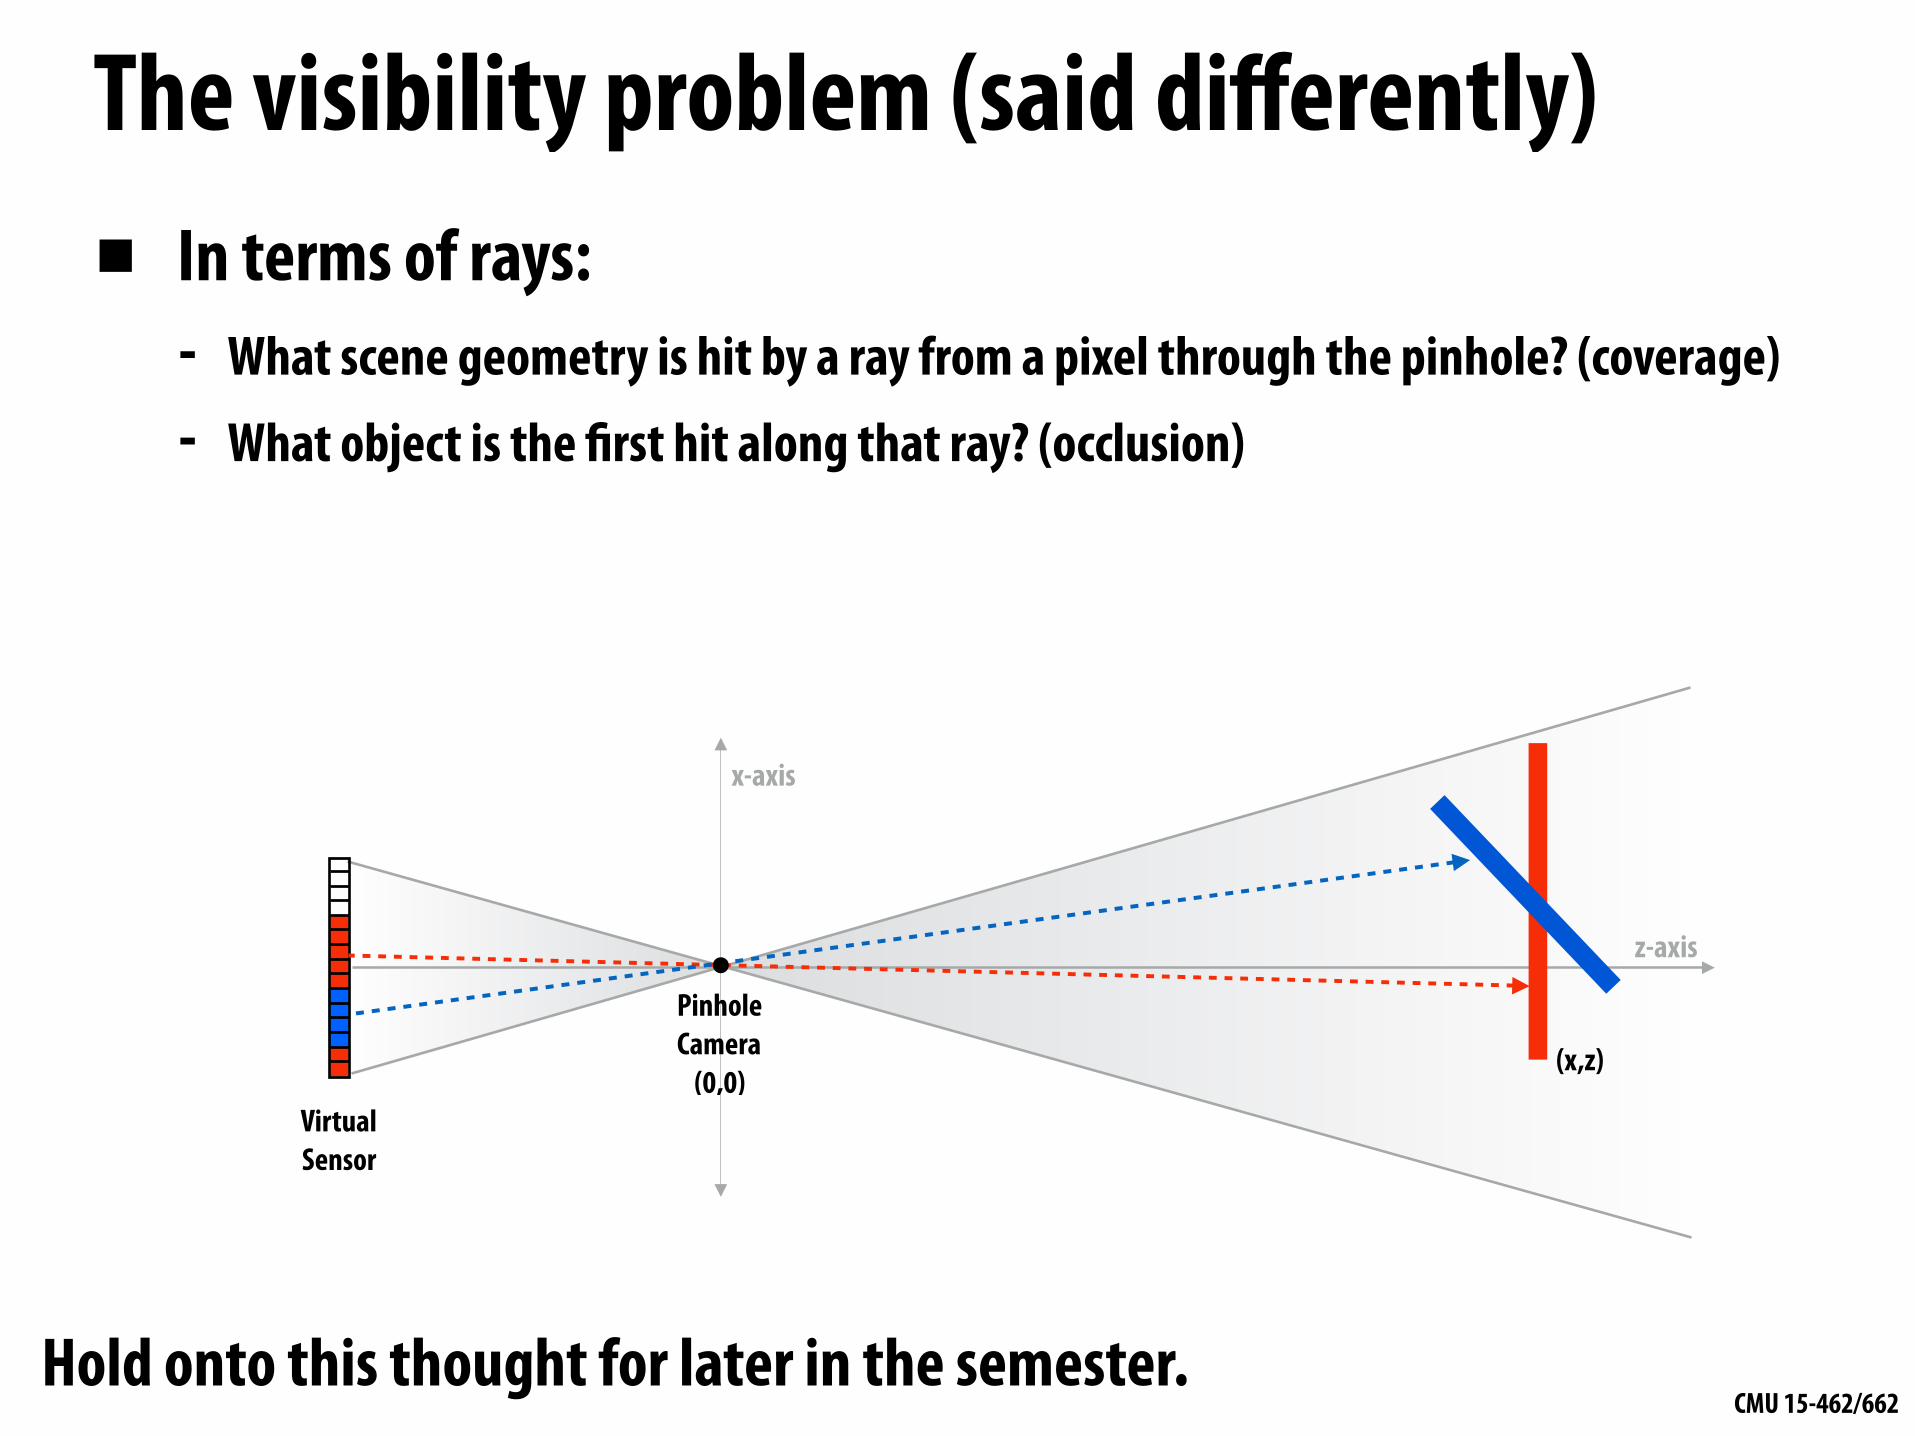
The visibility problem (said differently)▪ In terms of rays:
- What scene geometry is hit by a ray from a pixel through the pinhole? (coverage)
- What object is the first hit along that ray? (occlusion)
Pinhole Camera
(0,0)Virtual Sensor
(x,z)
z-axis
x-axis
Hold onto this thought for later in the semester.
CMU 15-462/662
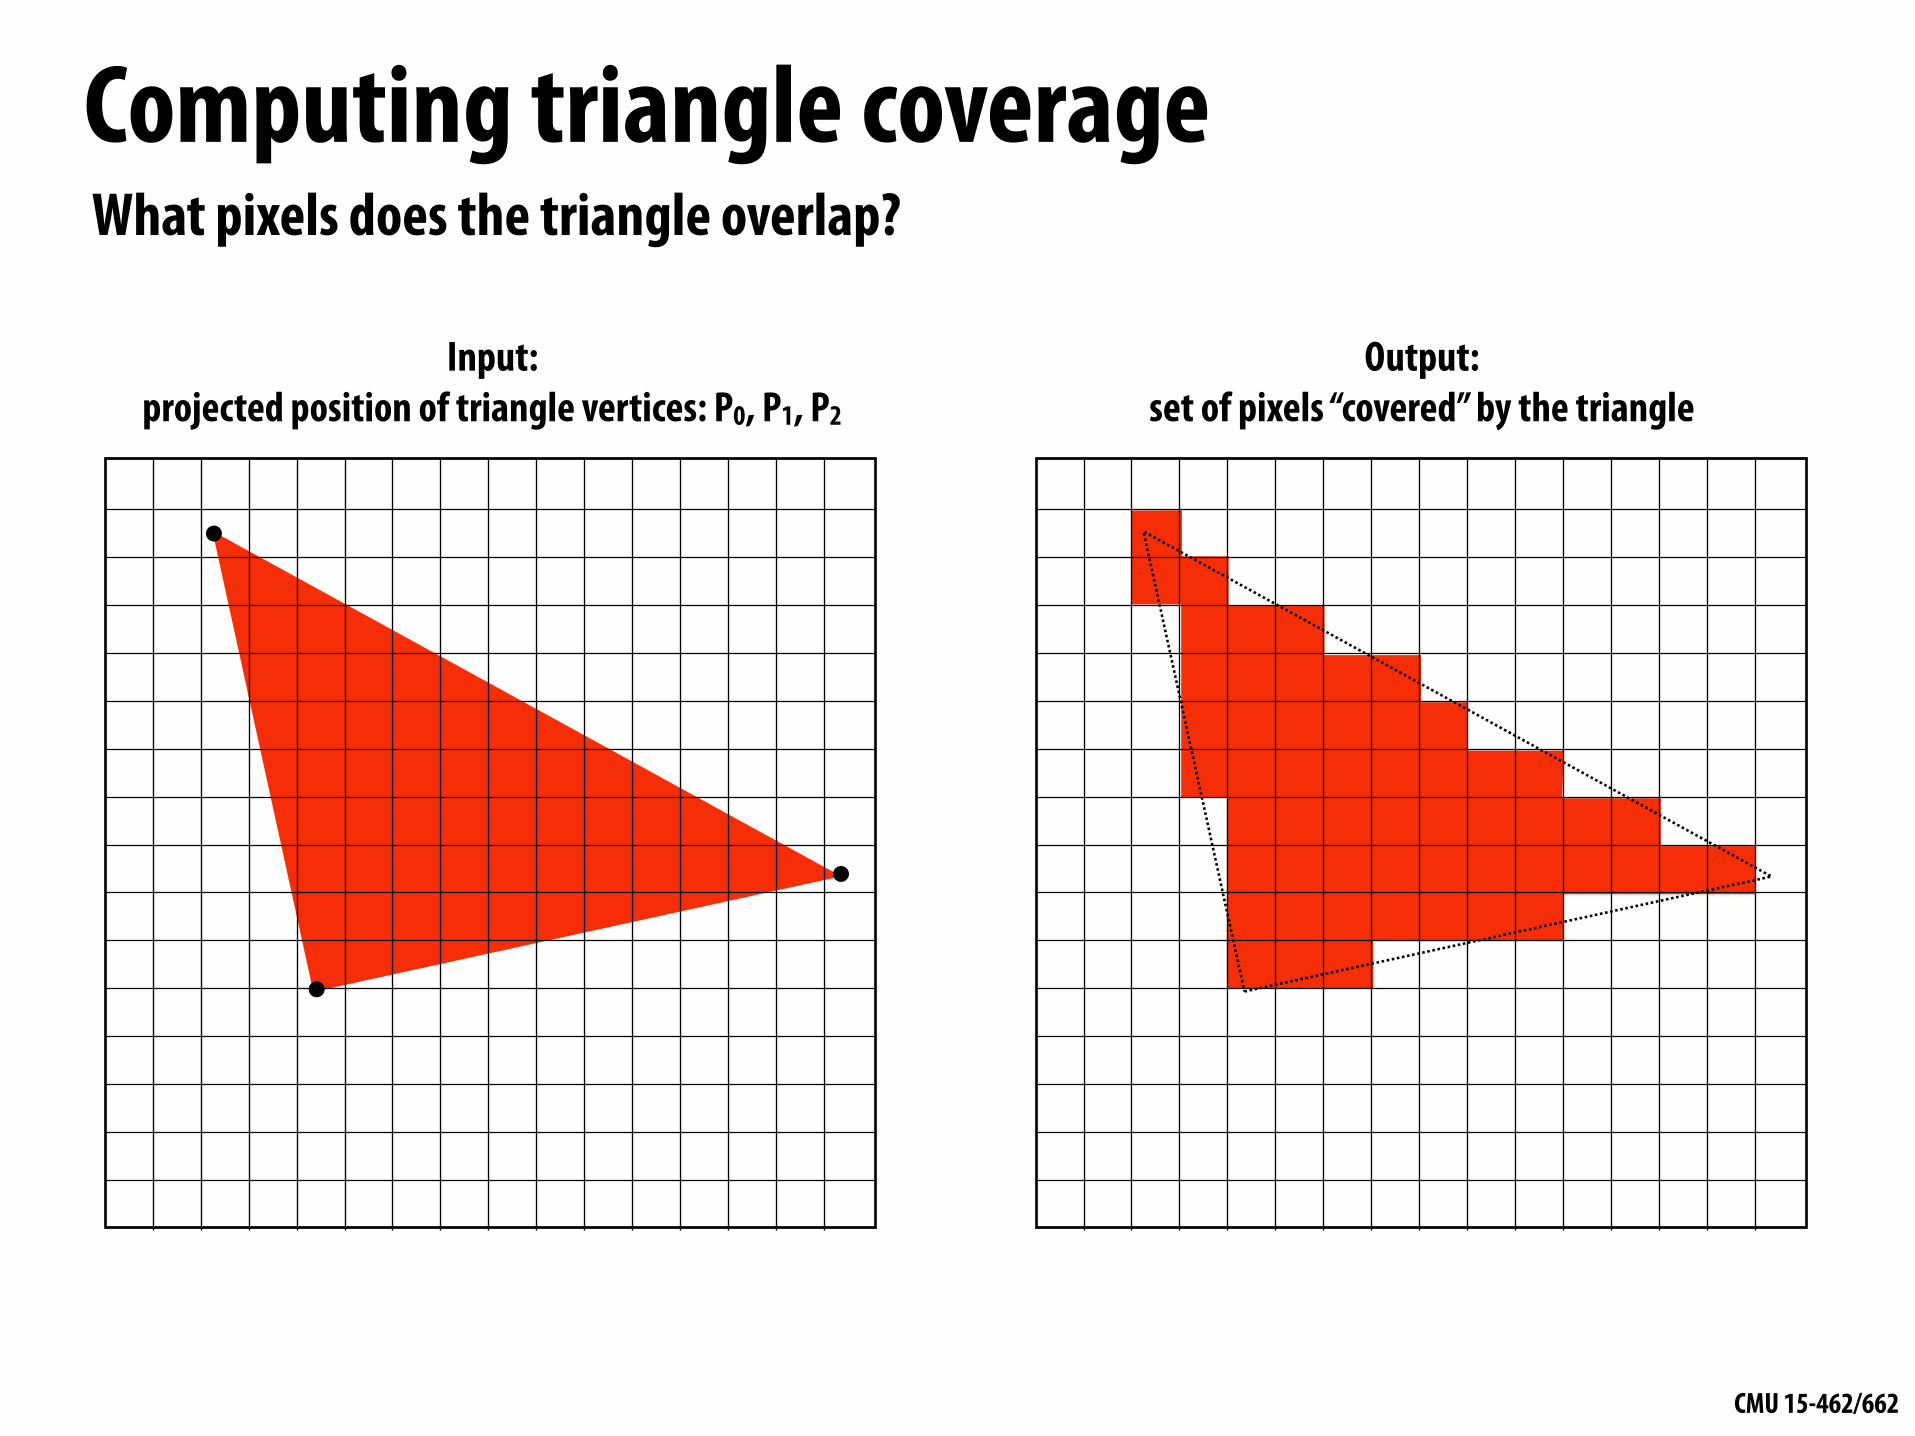
Input: projected position of triangle vertices: P0, P1, P2
Computing triangle coverage
Output: set of pixels “covered” by the triangle
What pixels does the triangle overlap?

CMU 15-462/662
What does it mean for a pixel to be covered by a triangle? Question: which triangles “cover” this pixel?
Pixel
1
2
3
4
CMU 15-462/662
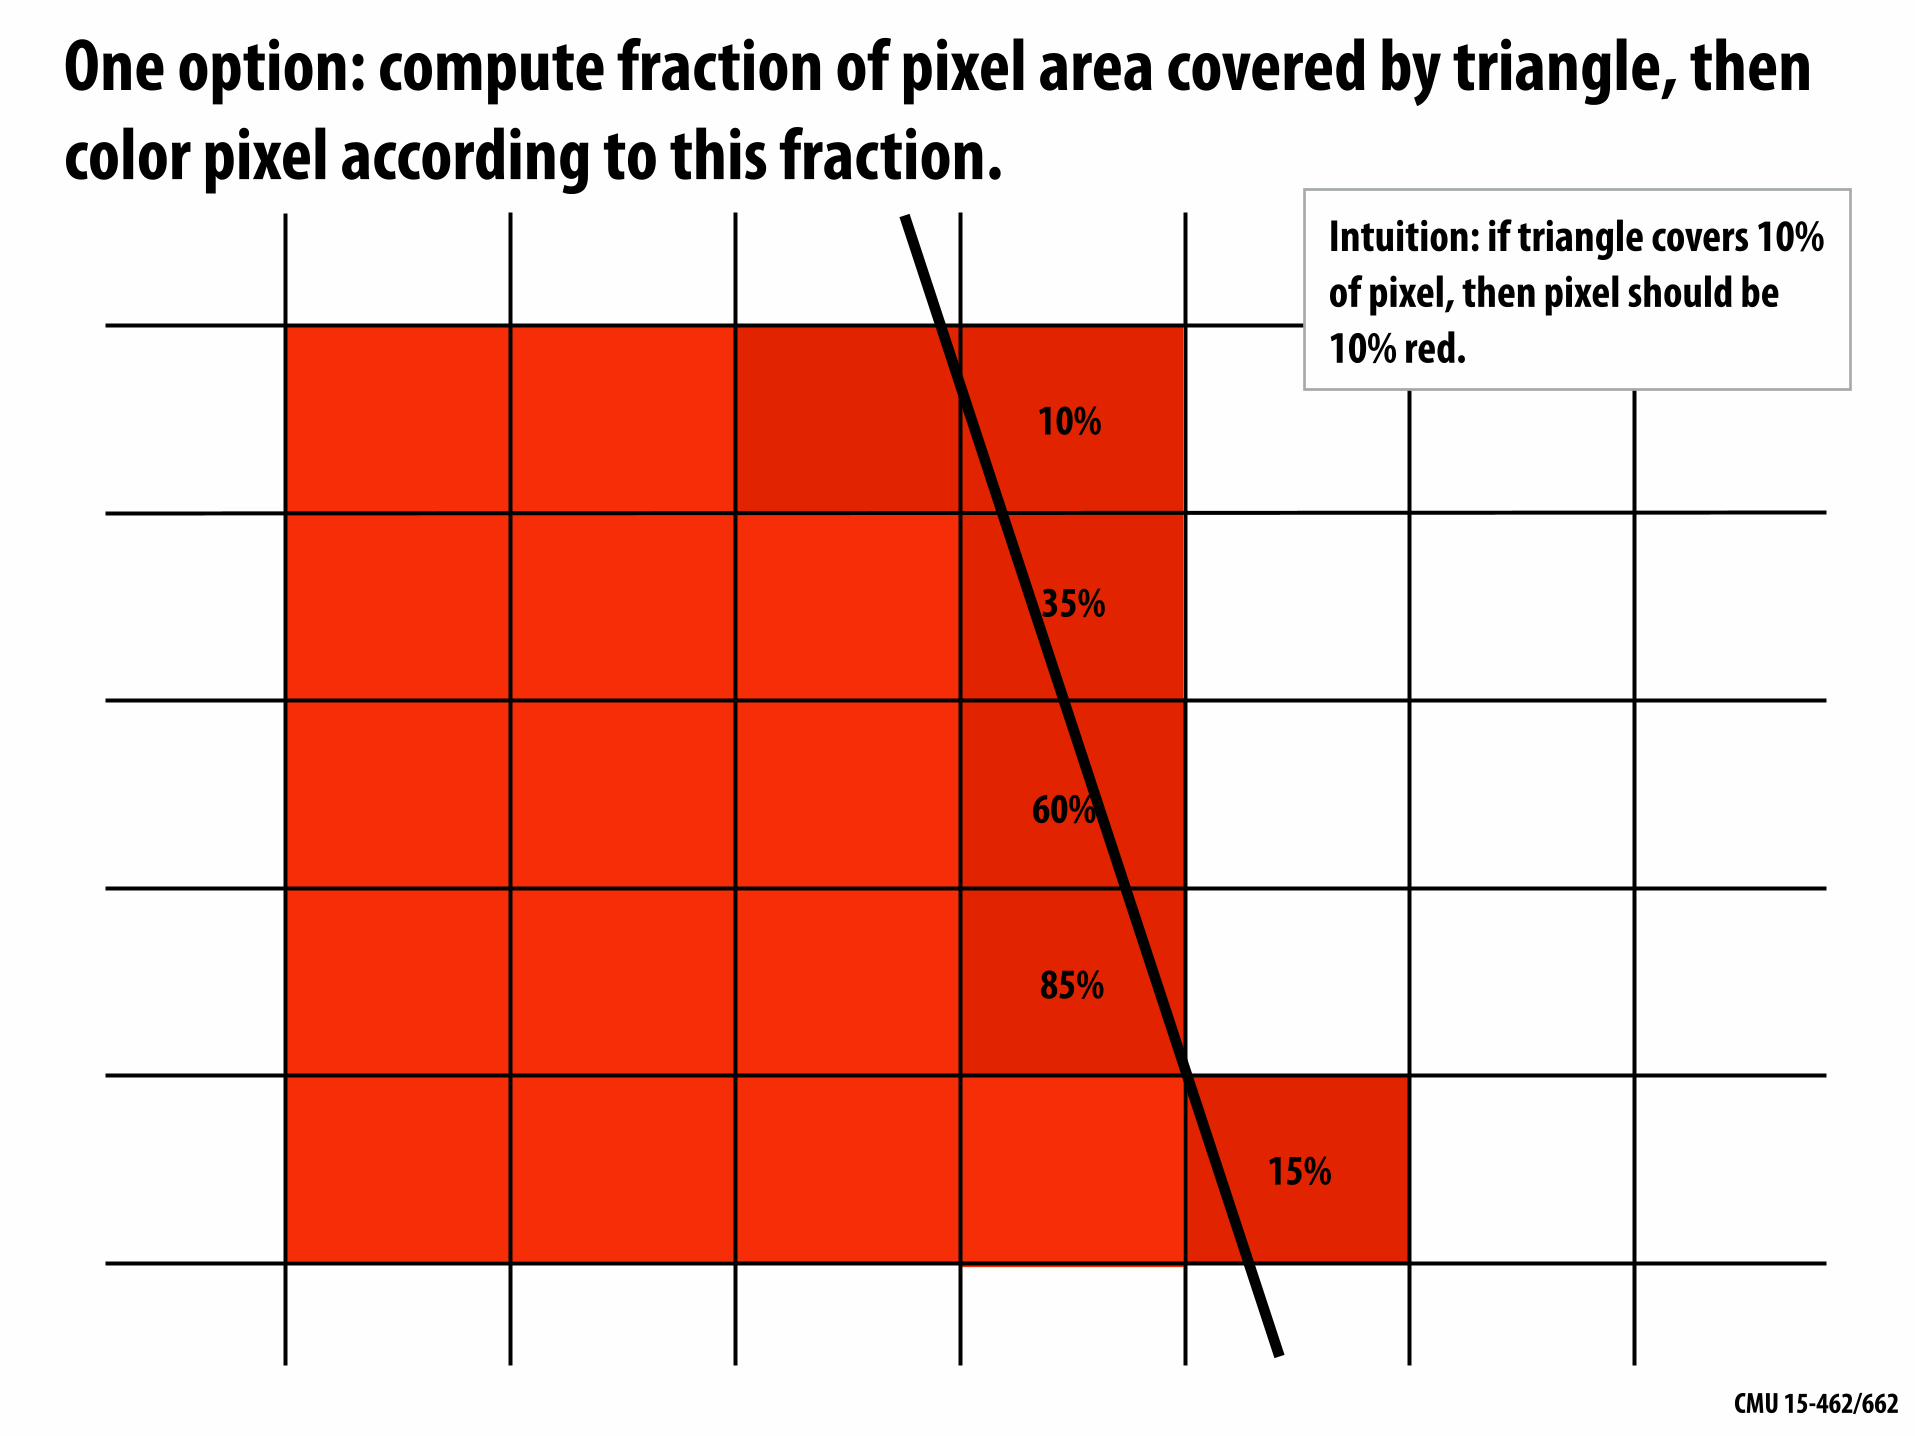
One option: compute fraction of pixel area covered by triangle, then color pixel according to this fraction.
10%
35%
60%
85%
15%
Intuition: if triangle covers 10% of pixel, then pixel should be 10% red.
CMU 15-462/662
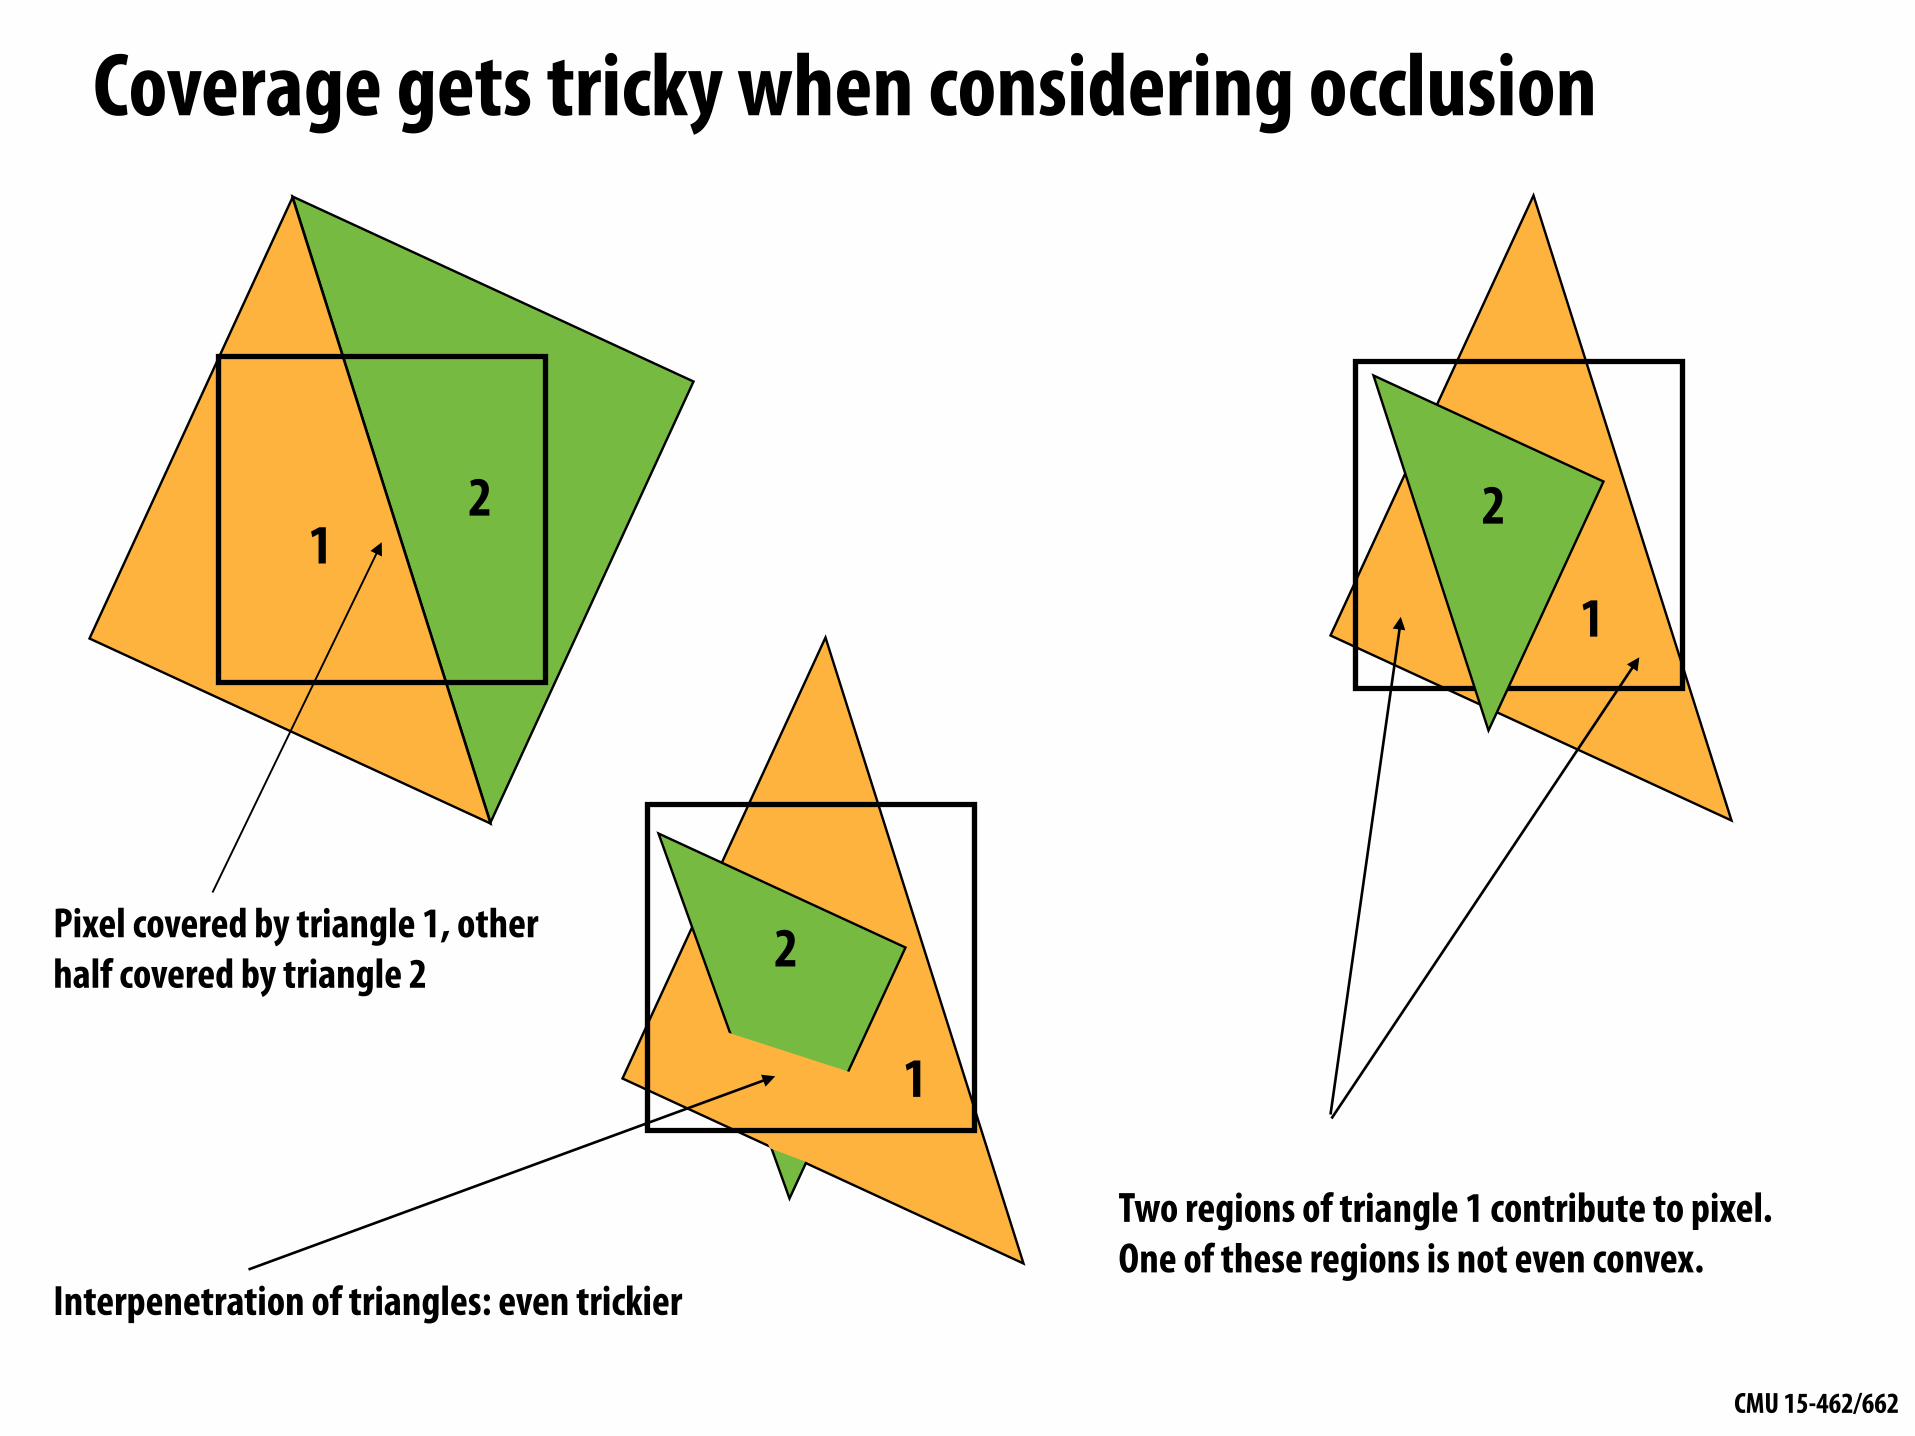
Coverage gets tricky when considering occlusion
Two regions of triangle 1 contribute to pixel. One of these regions is not even convex.
12 2
1
2
1
Interpenetration of triangles: even trickier
Pixel covered by triangle 1, other half covered by triangle 2

CMU 15-462/662
Coverage via sampling▪ Real scenes are complicated!
- occlusion, transparency, …
▪ Computing exact coverage is not practical
▪ Instead: view coverage as a sampling problem - don’t compute exact/analytical answer - instead, test a collection of sample points - with enough points & smart choice of
sample locations, can start to get a good estimate
▪ First, let’s talk about sampling in general…
CMU 15-462/662
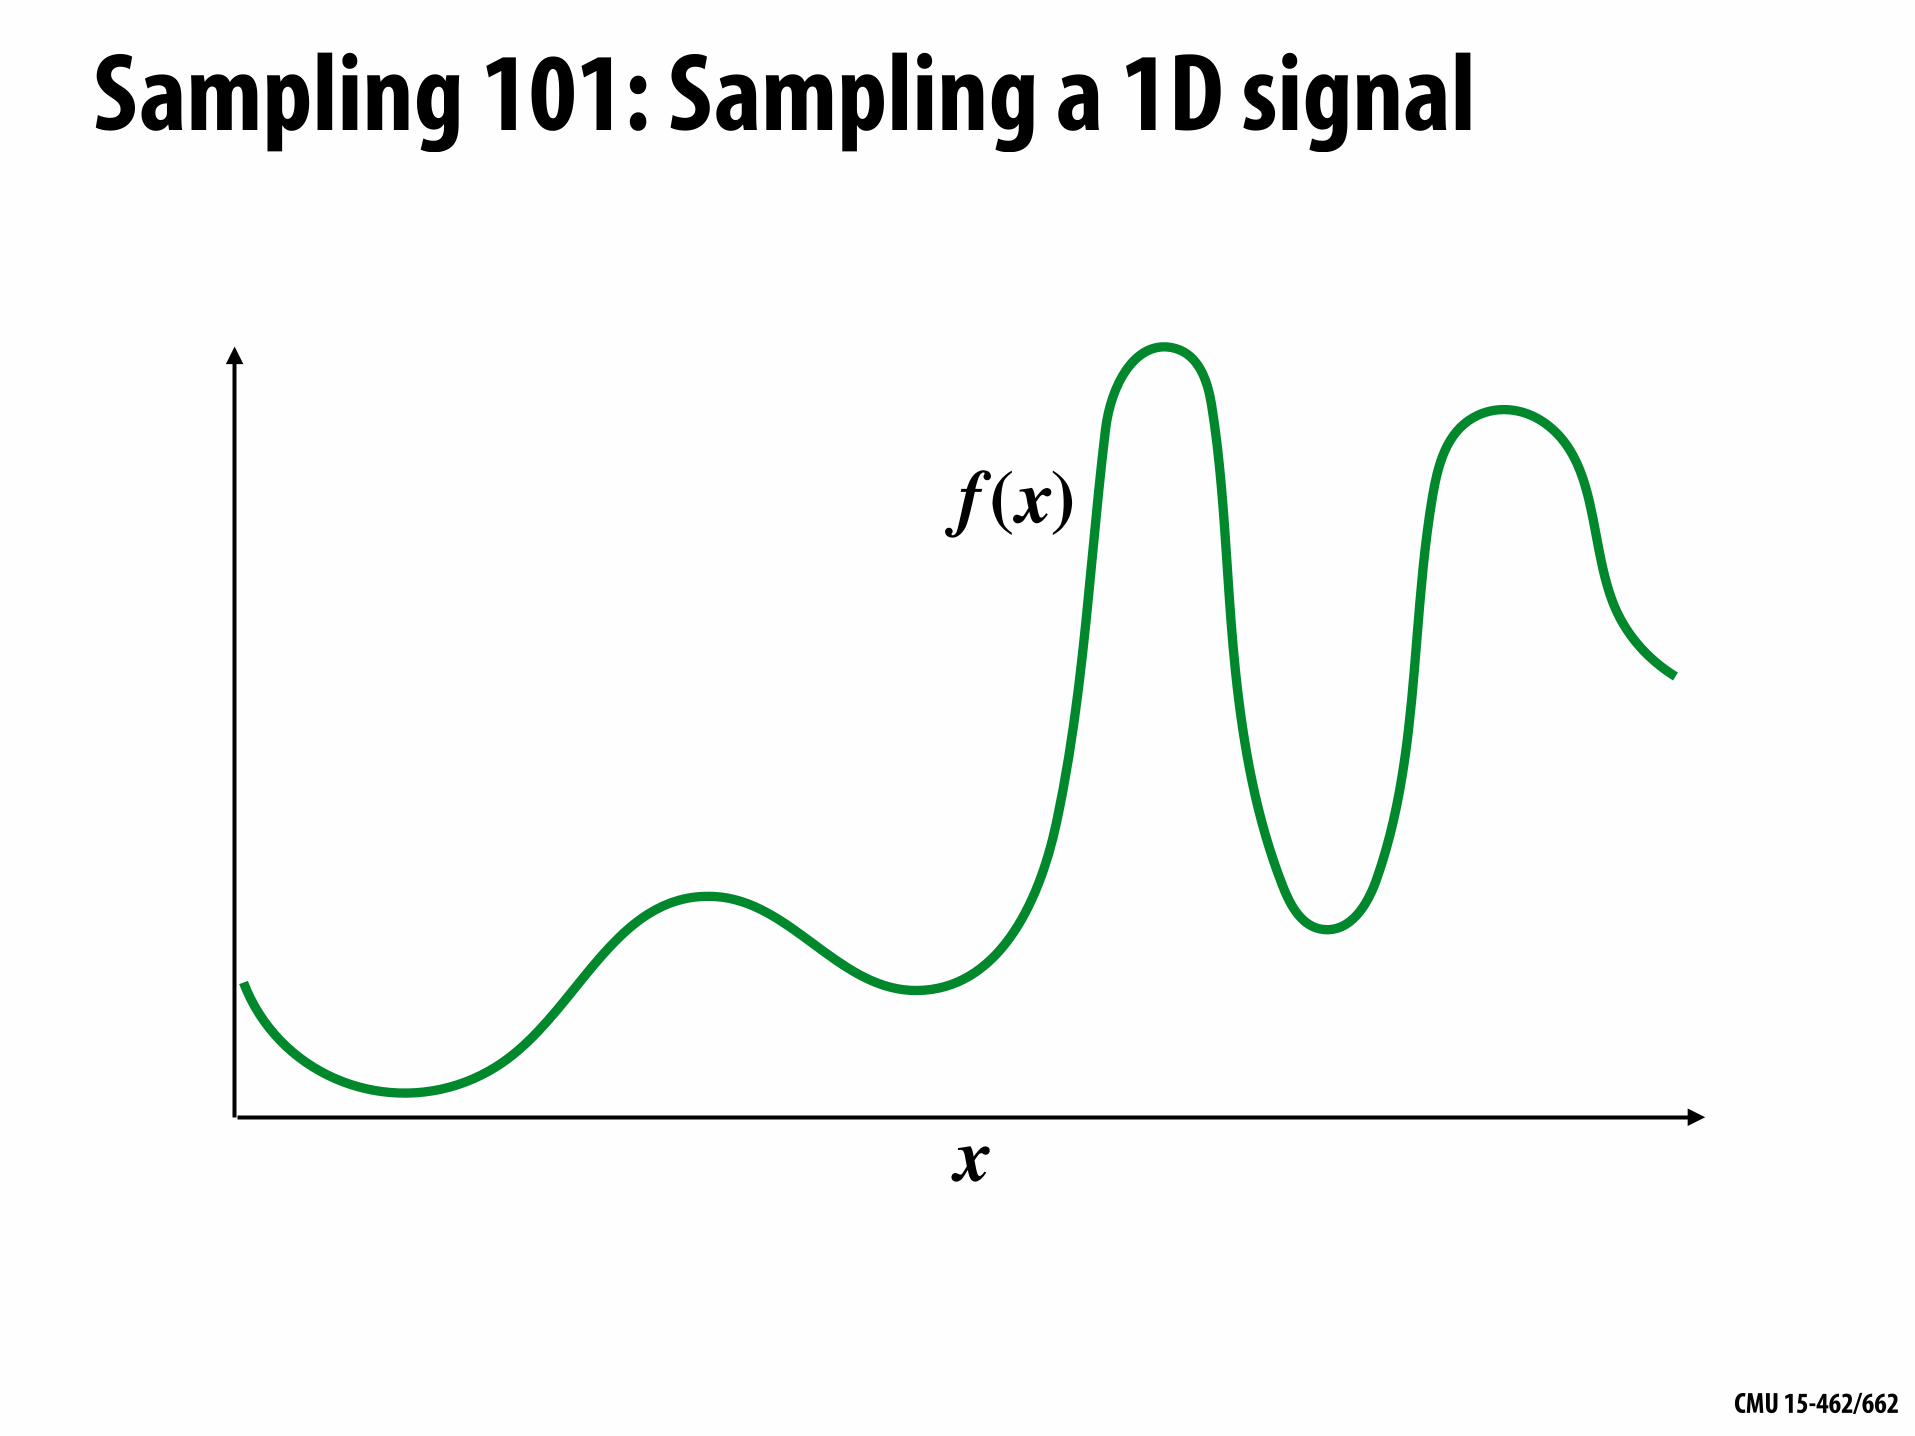
Sampling 101: Sampling a 1D signal
x
f (x)
CMU 15-462/662
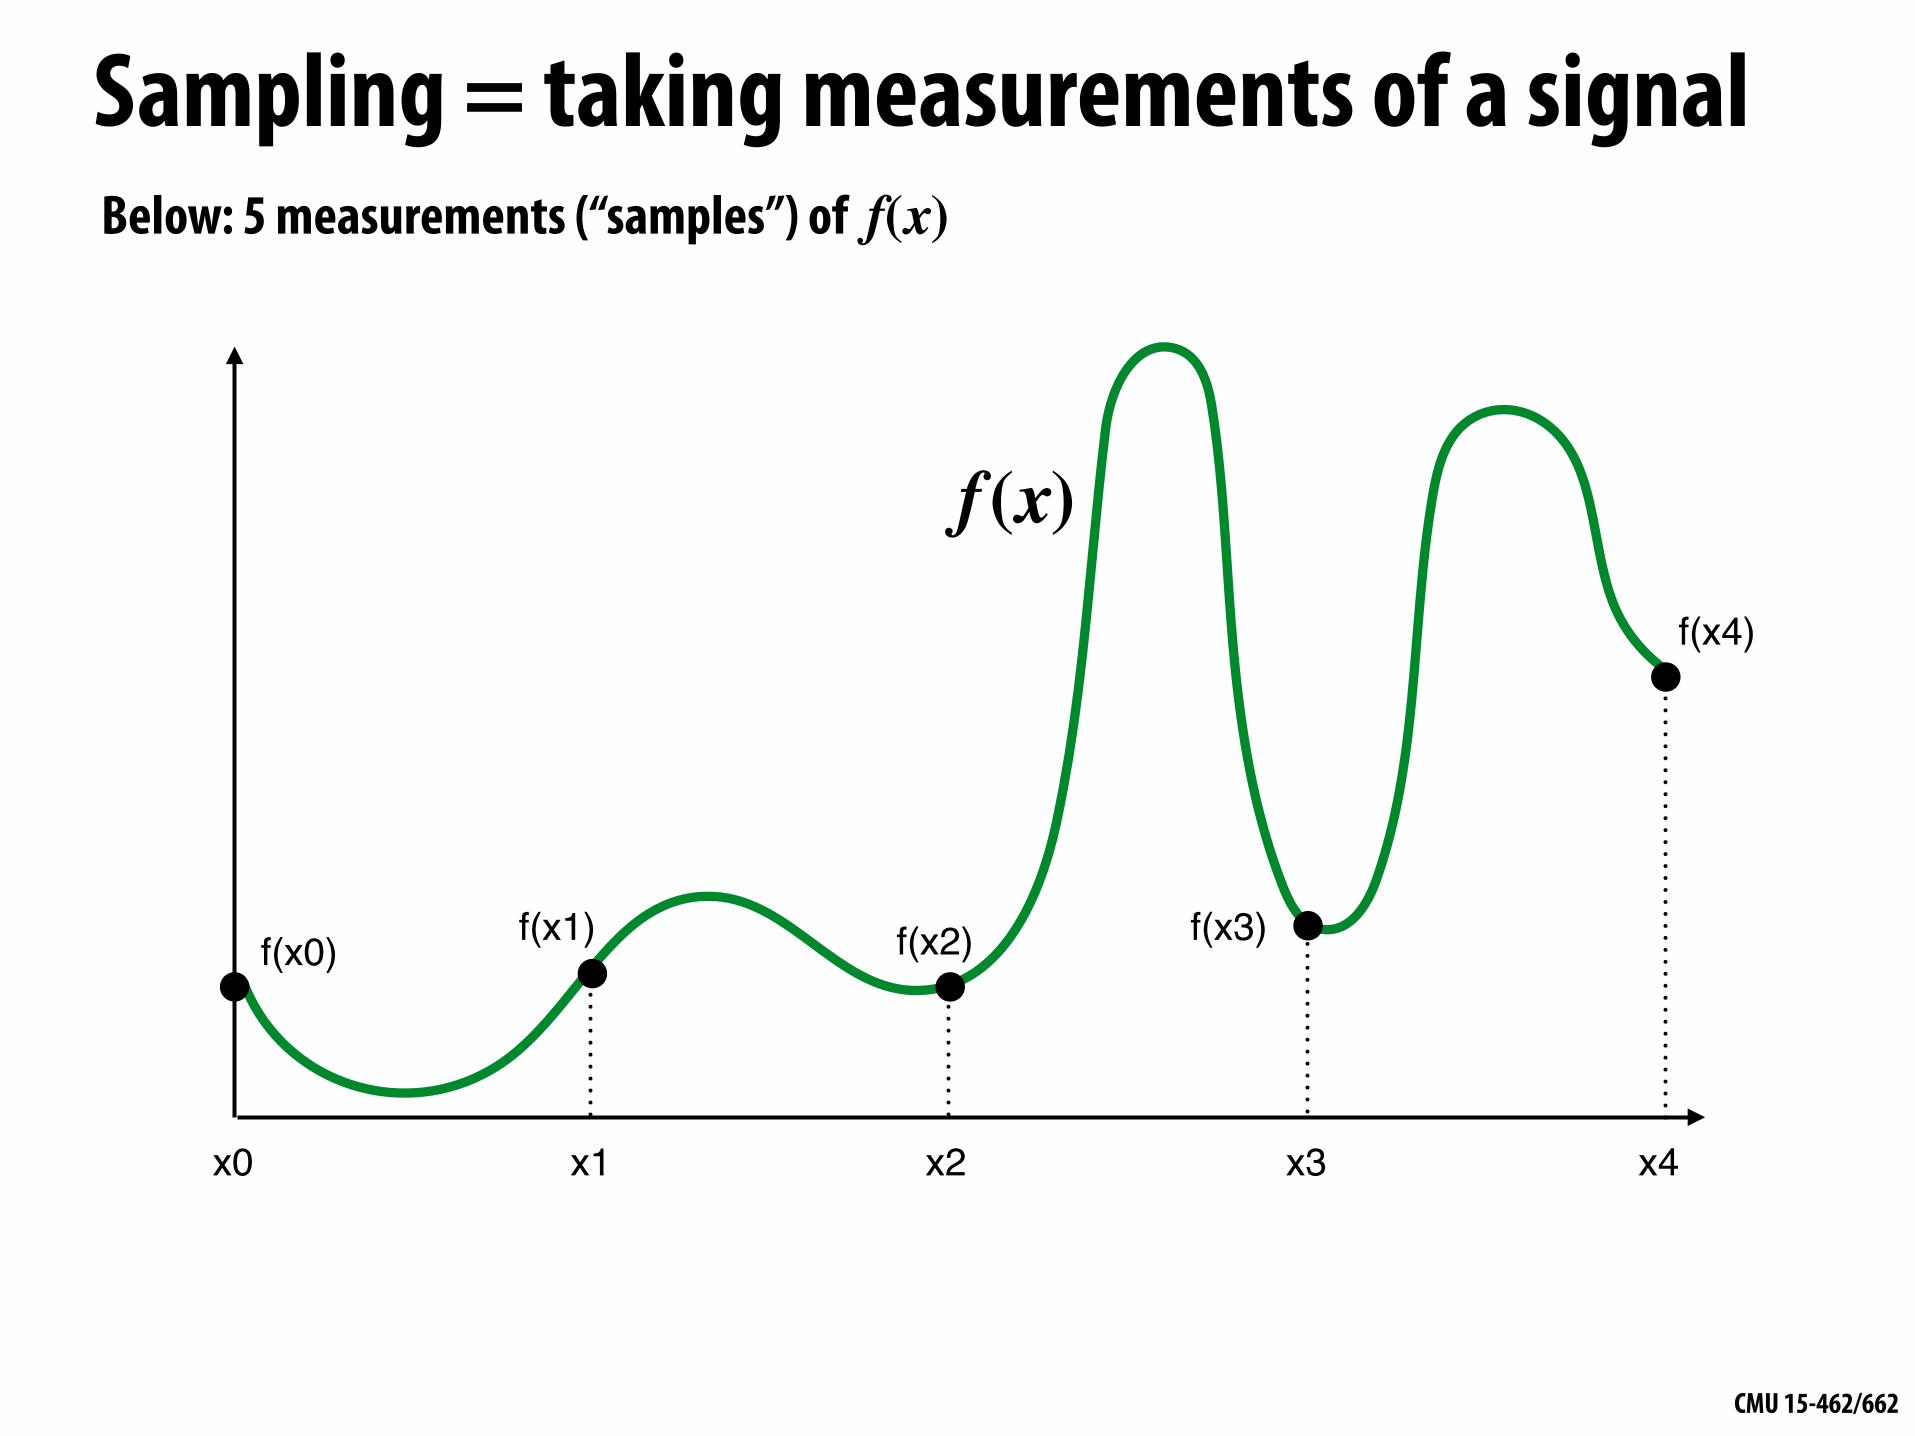
Sampling = taking measurements of a signal
x1x0 x2 x3 x4
f(x0) f(x1) f(x2) f(x3)
f(x4)
f (x)
Below: 5 measurements (“samples”) of f(x)
CMU 15-462/662
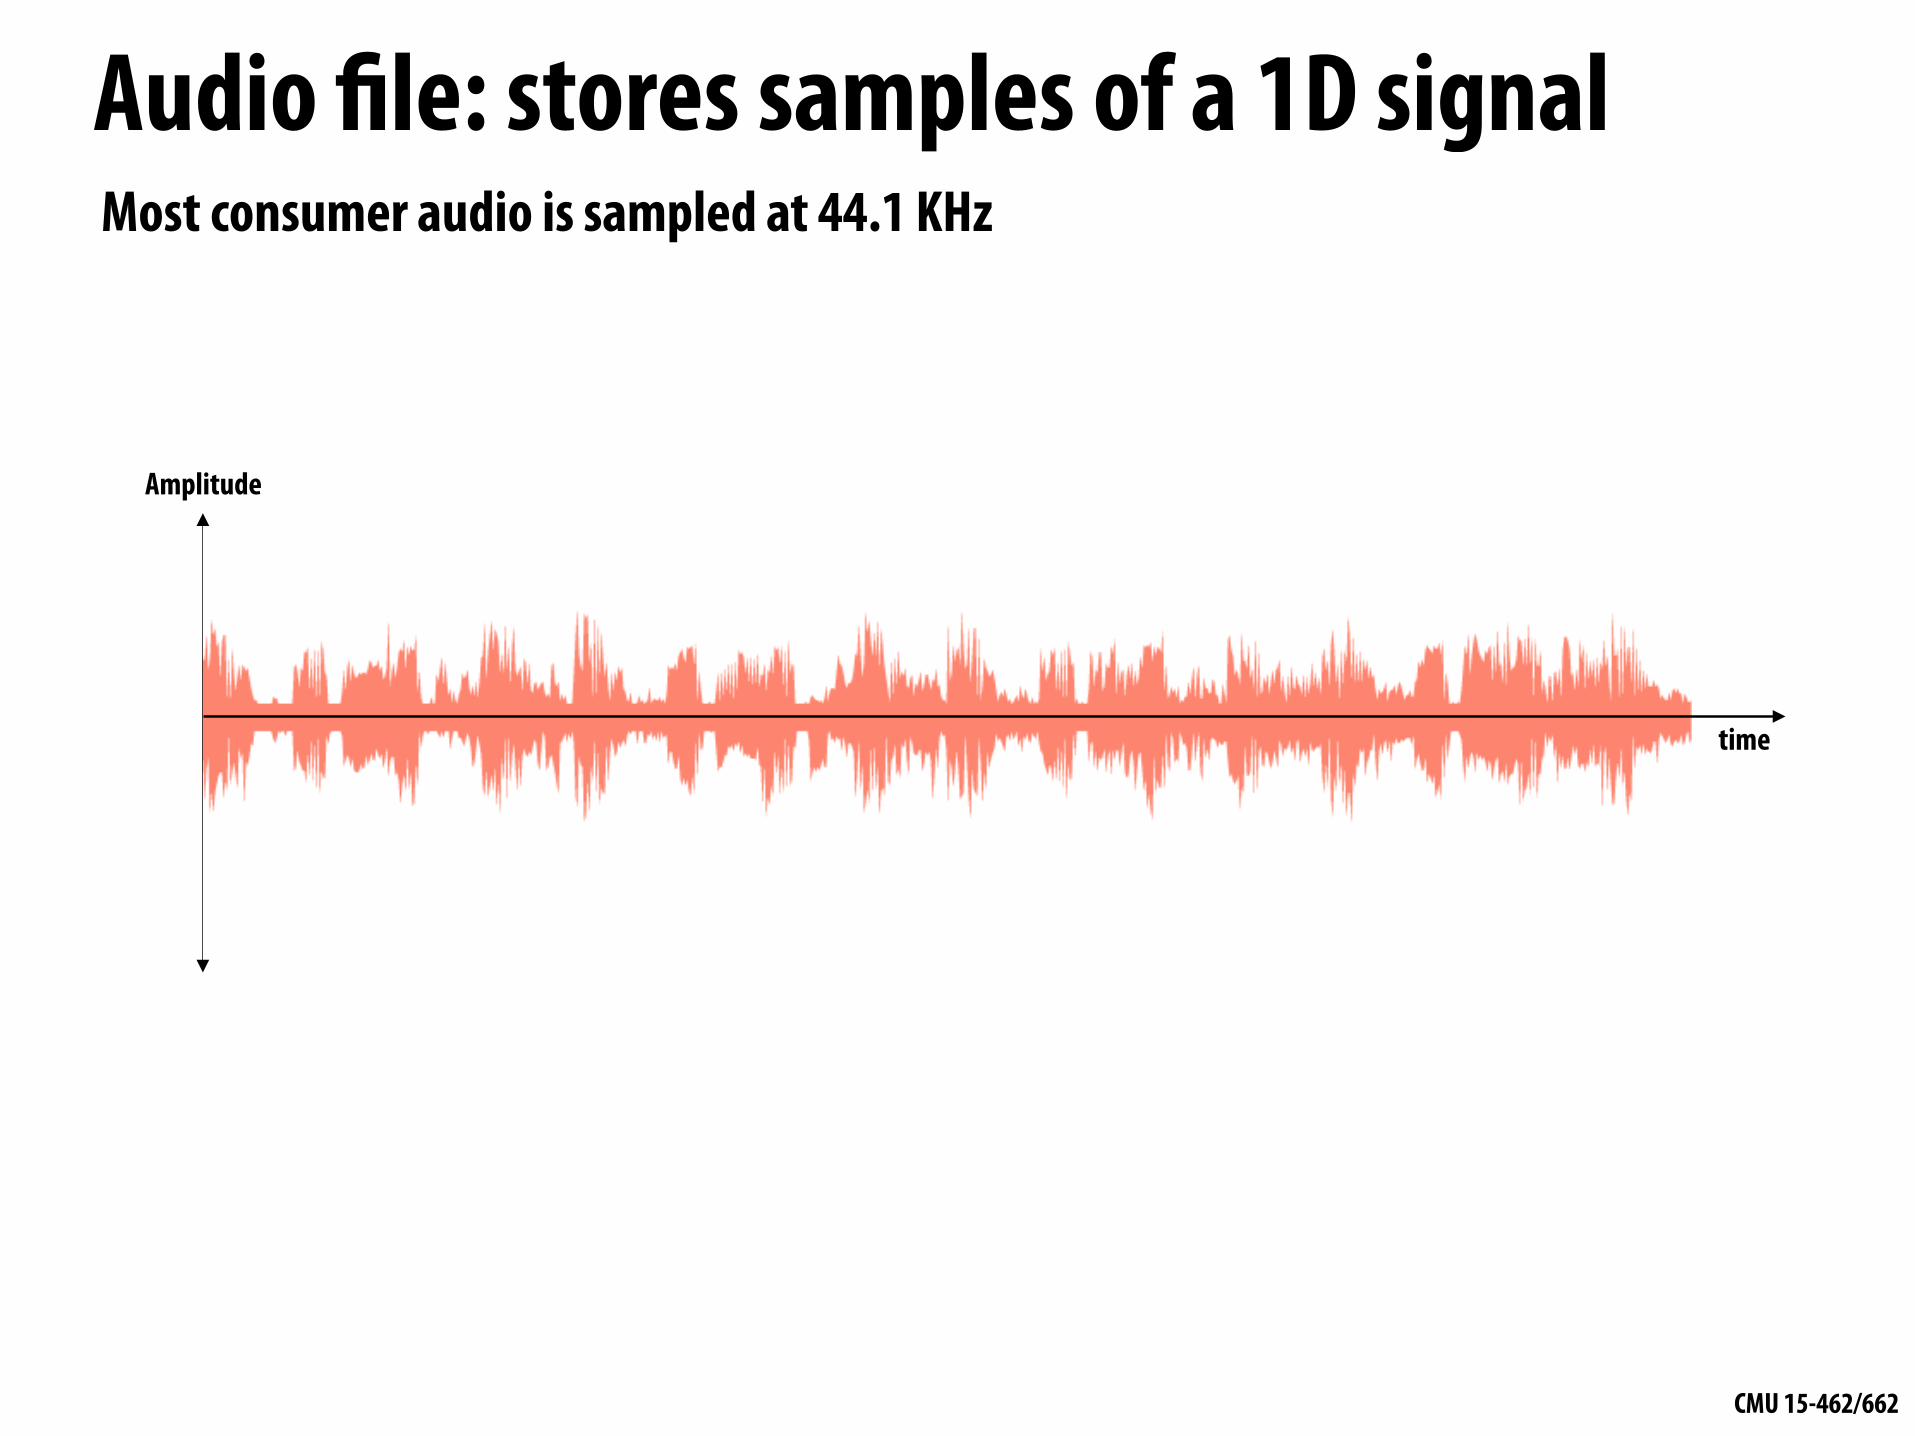
Audio file: stores samples of a 1D signal
time
Amplitude
Most consumer audio is sampled at 44.1 KHz
CMU 15-462/662
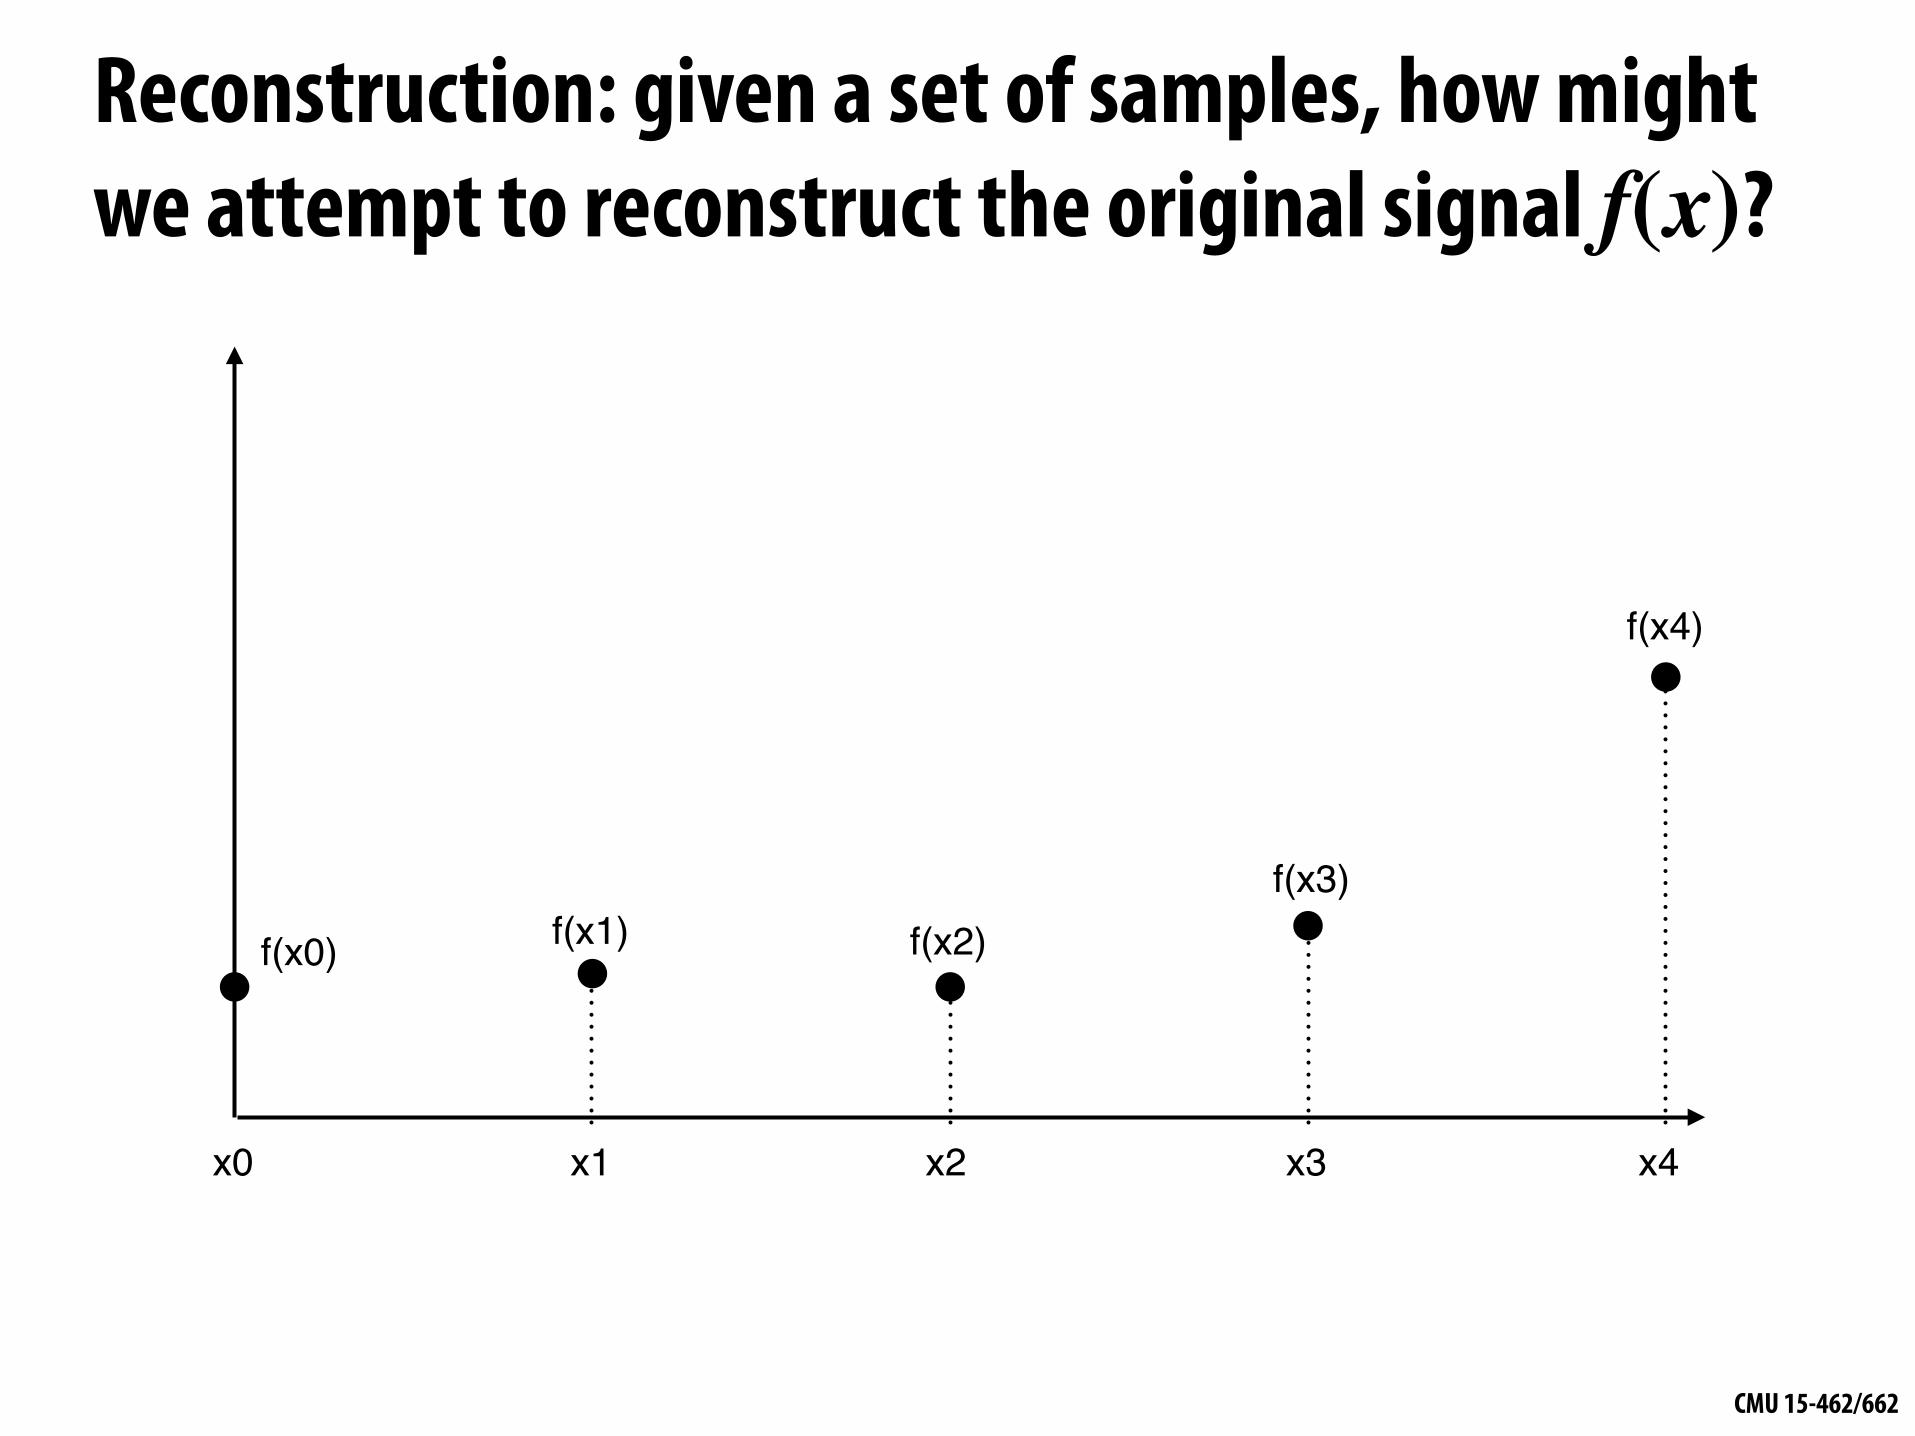
Reconstruction: given a set of samples, how might we attempt to reconstruct the original signal f(x)?
x1x0 x2 x3 x4
f(x0) f(x1) f(x2)f(x3)
f(x4)
CMU 15-462/662
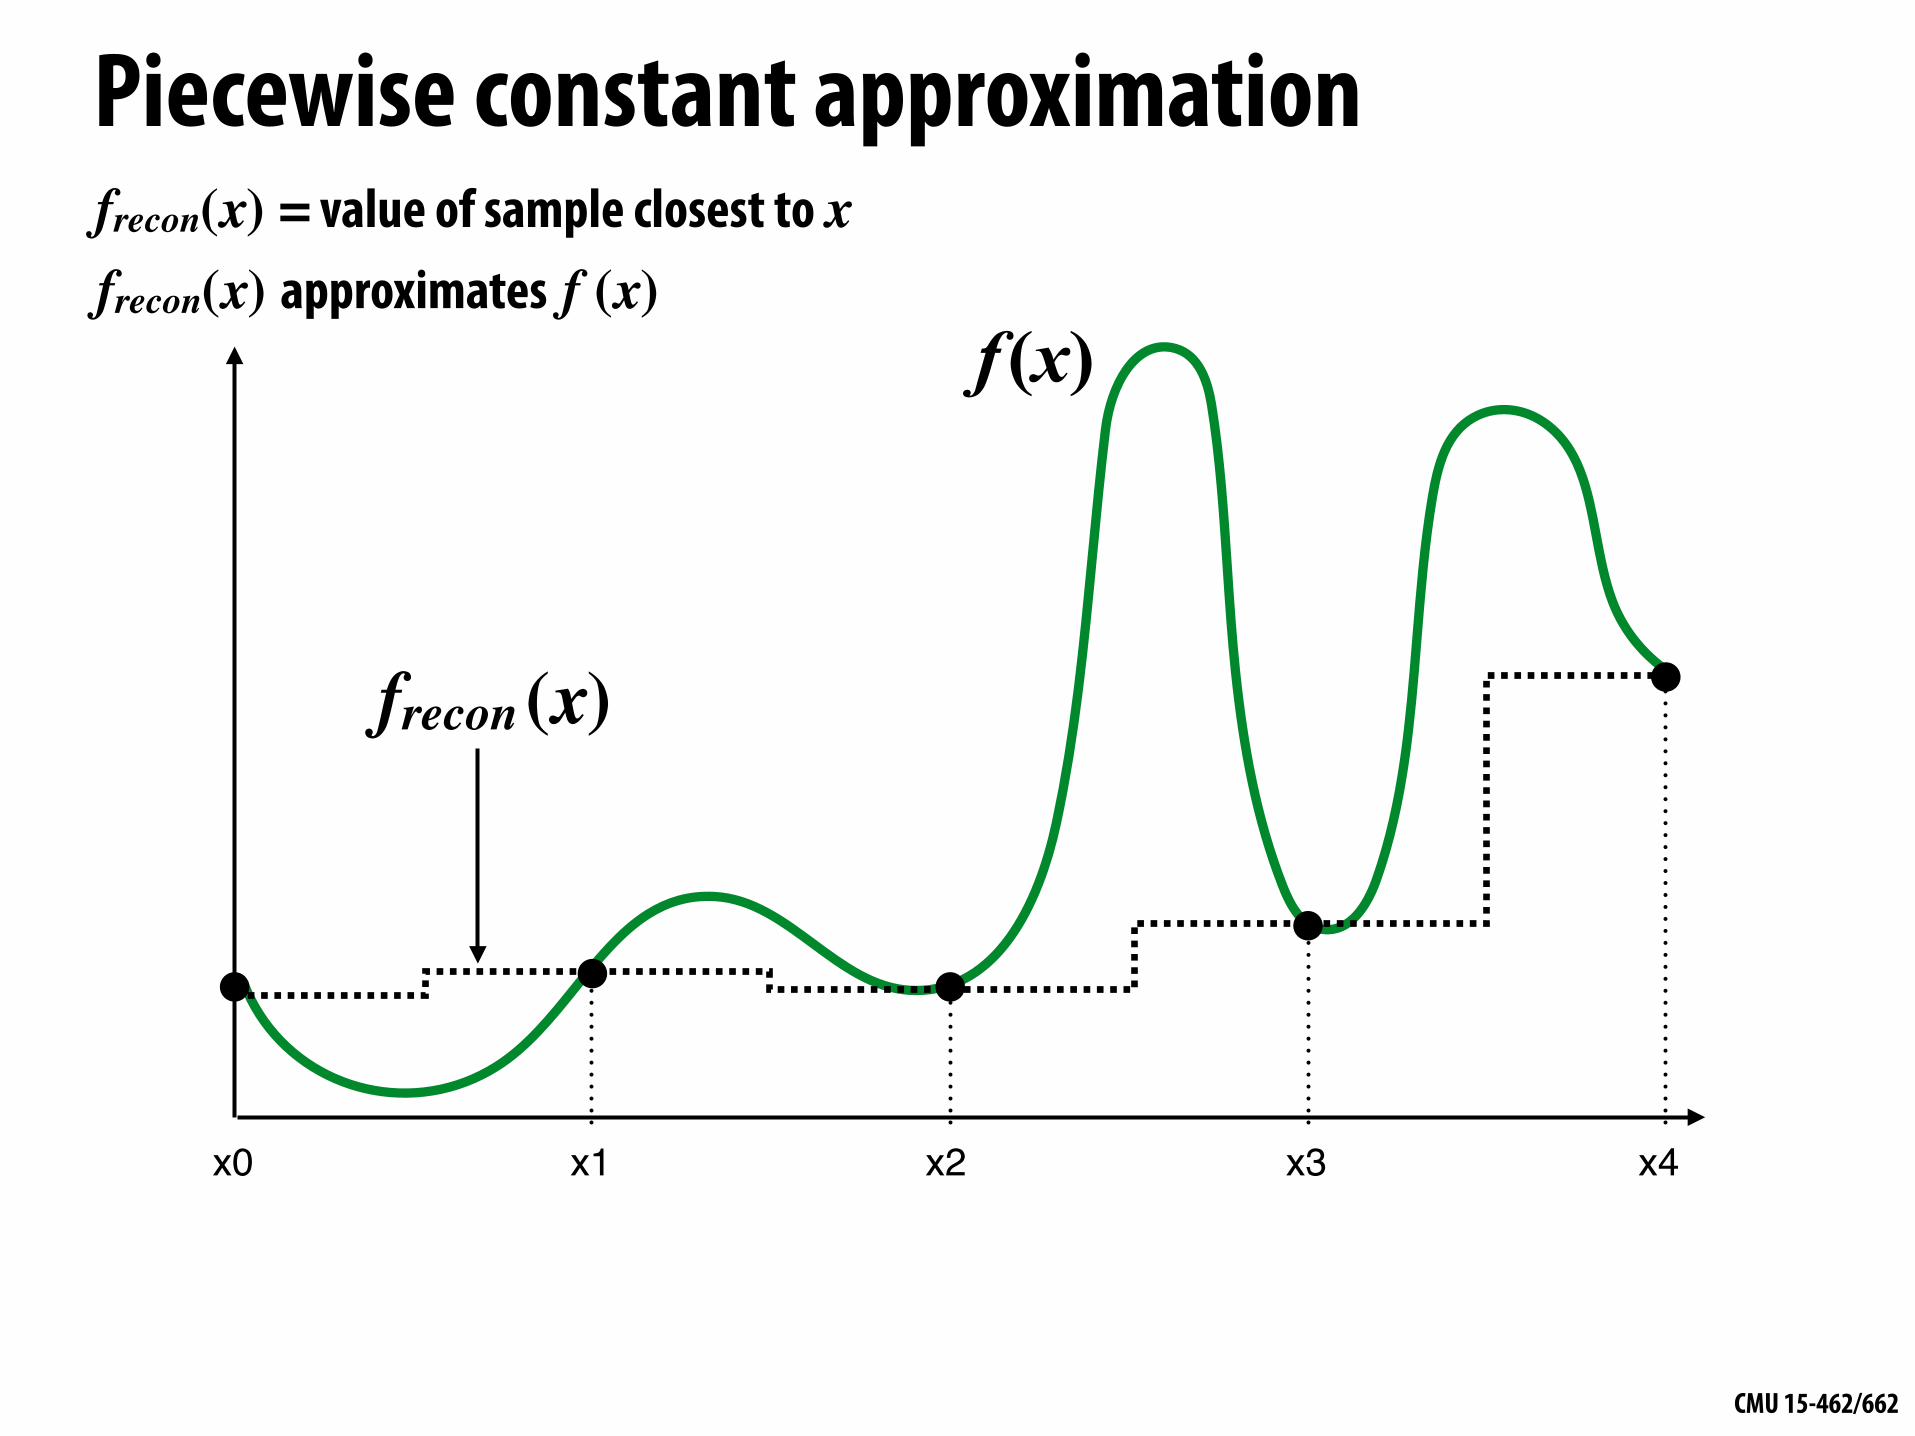
Piecewise constant approximation
x1
f (x)
x0 x2 x3 x4
frecon (x)
frecon(x) approximates f (x)frecon(x) = value of sample closest to x
CMU 15-462/662
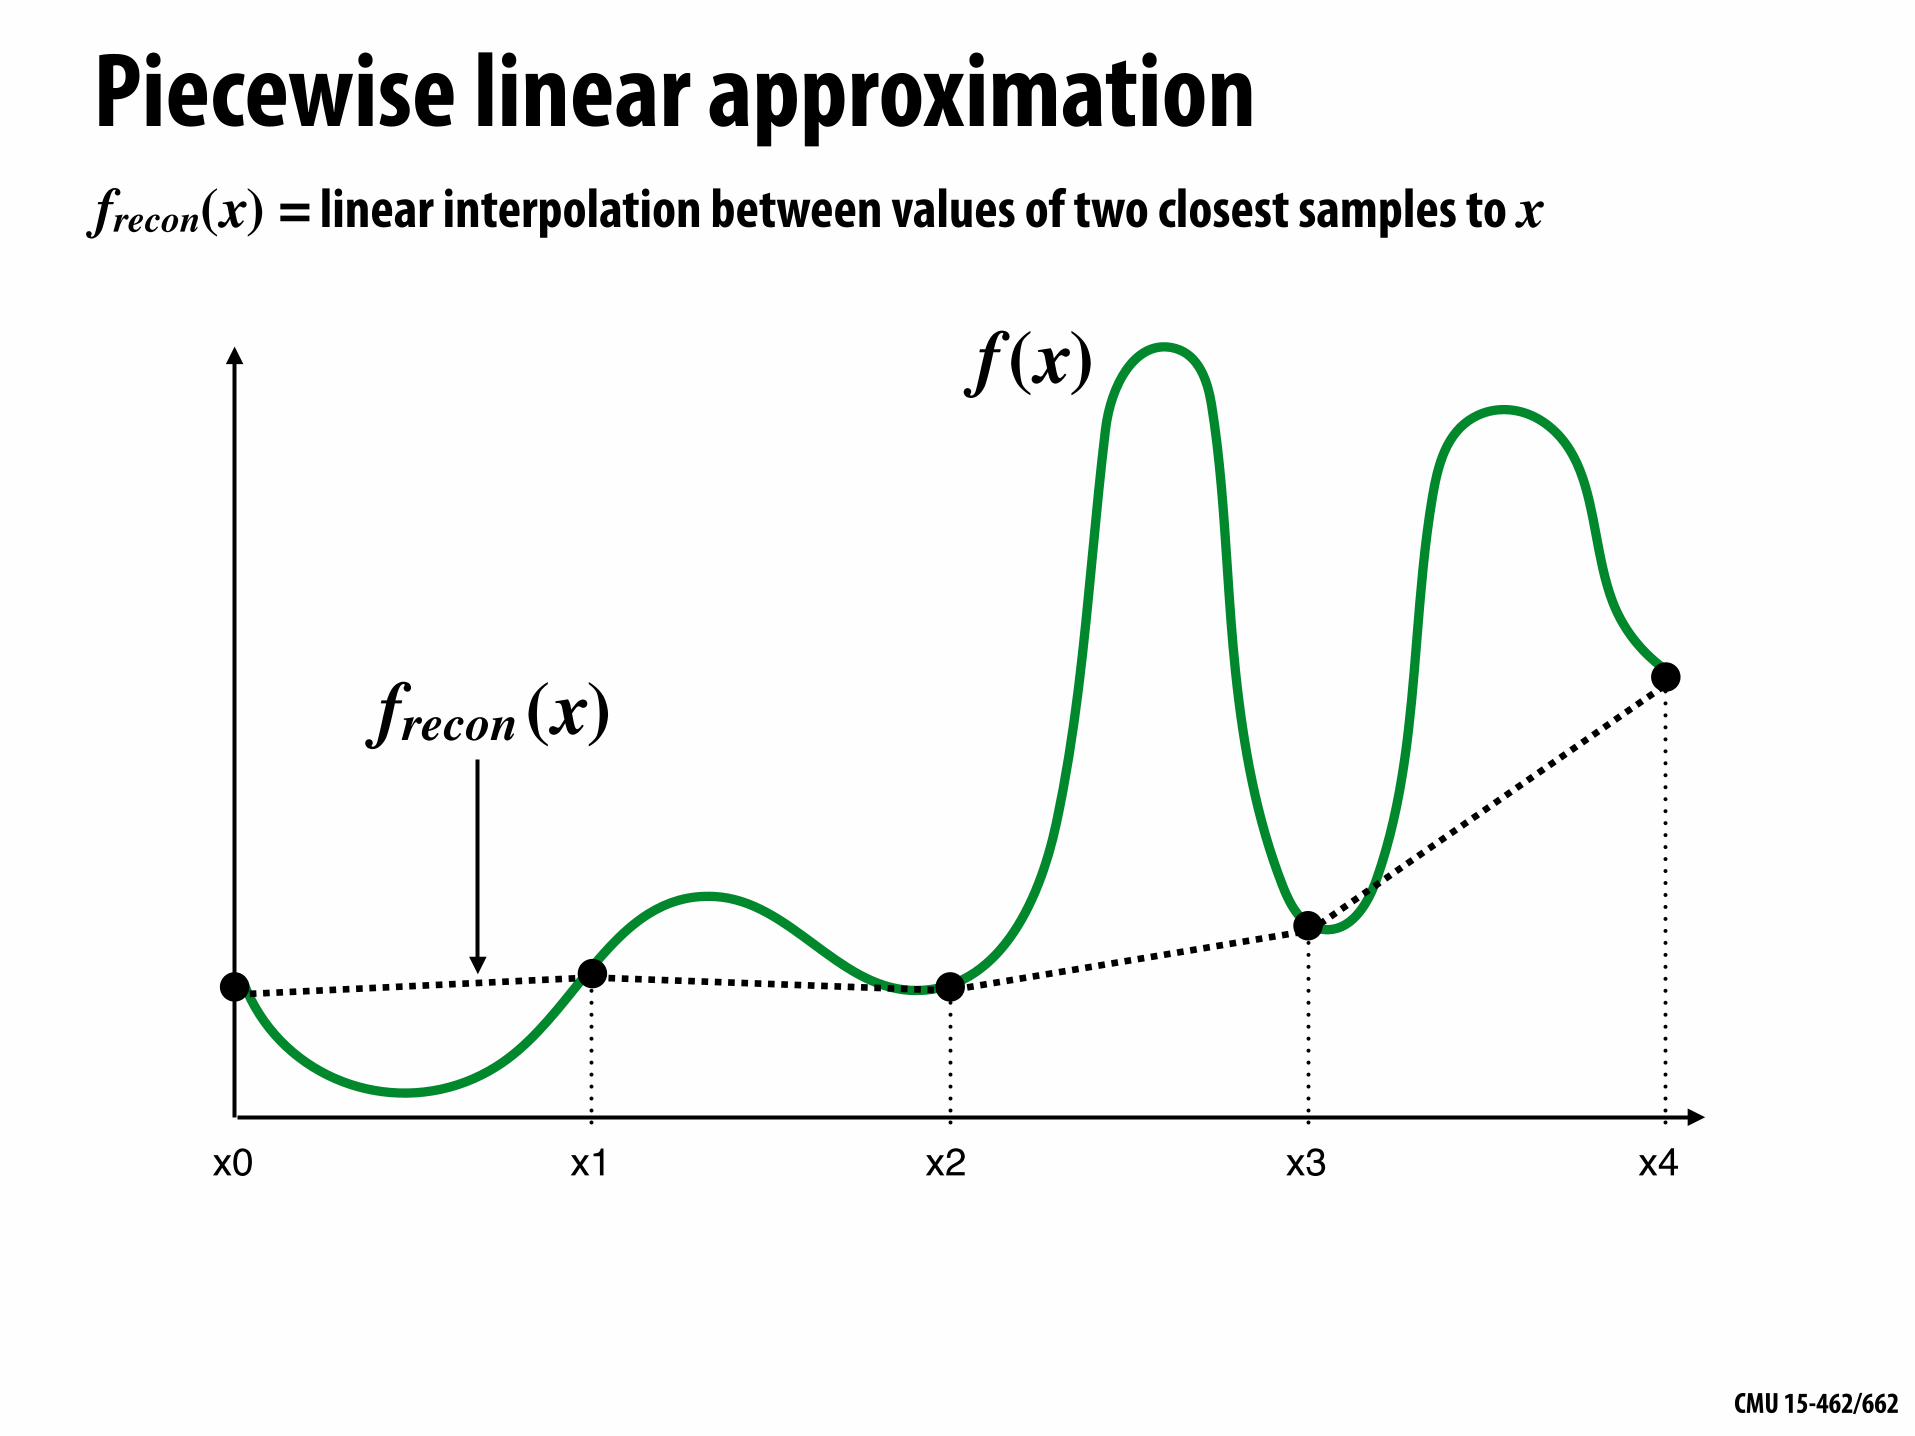
Piecewise linear approximation
x1x0 x2 x3 x4
f (x)
frecon (x)
frecon(x) = linear interpolation between values of two closest samples to x
CMU 15-462/662
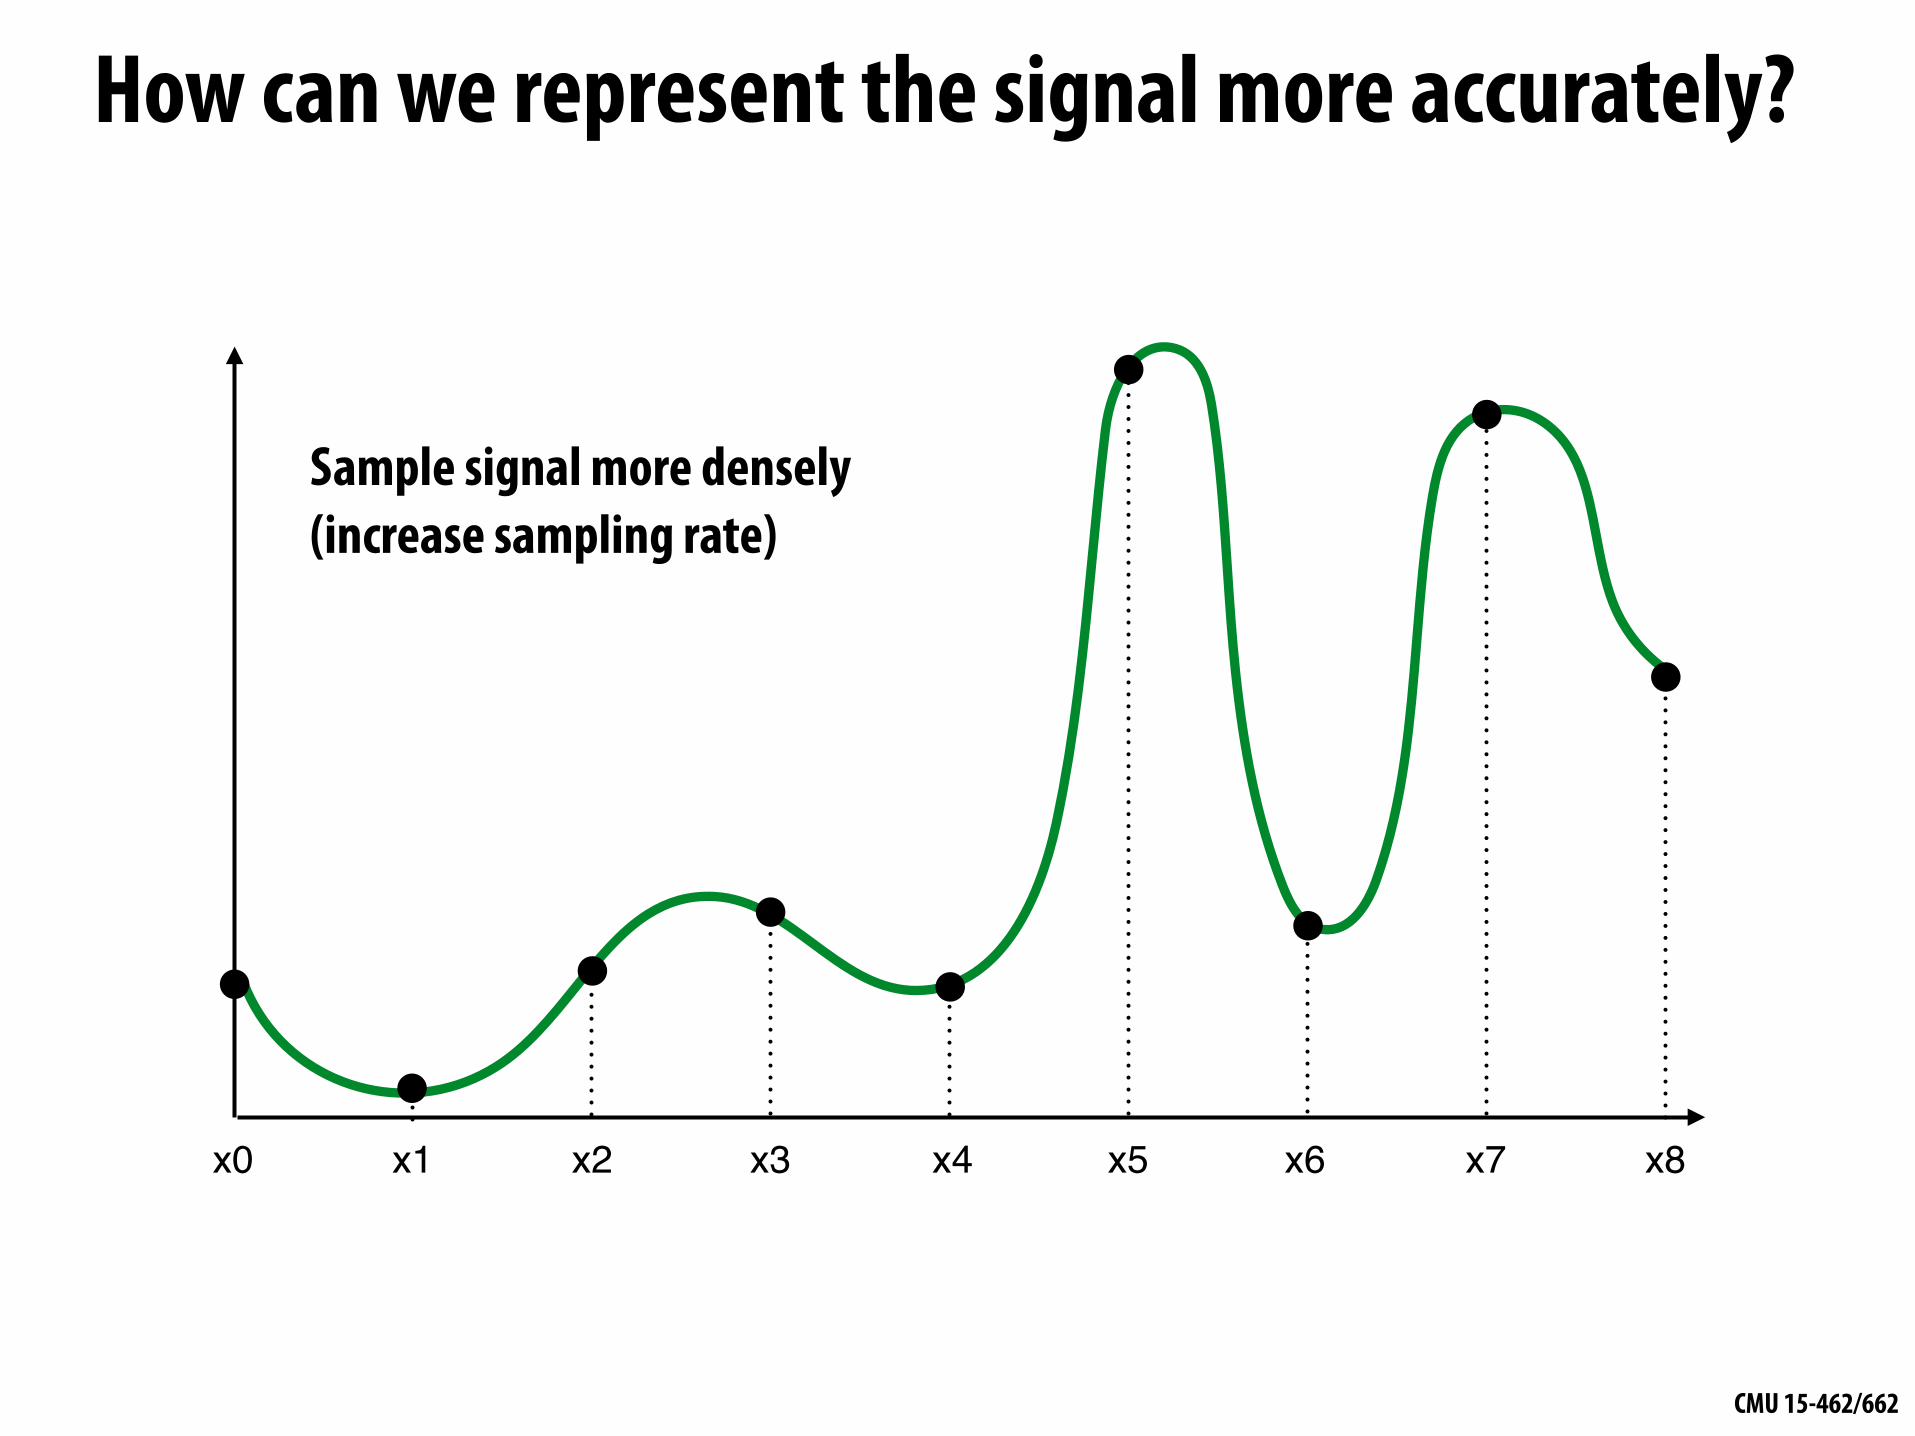
How can we represent the signal more accurately?
x1x0 x2 x3 x4 x5 x6 x7 x8
Sample signal more densely (increase sampling rate)
CMU 15-462/662
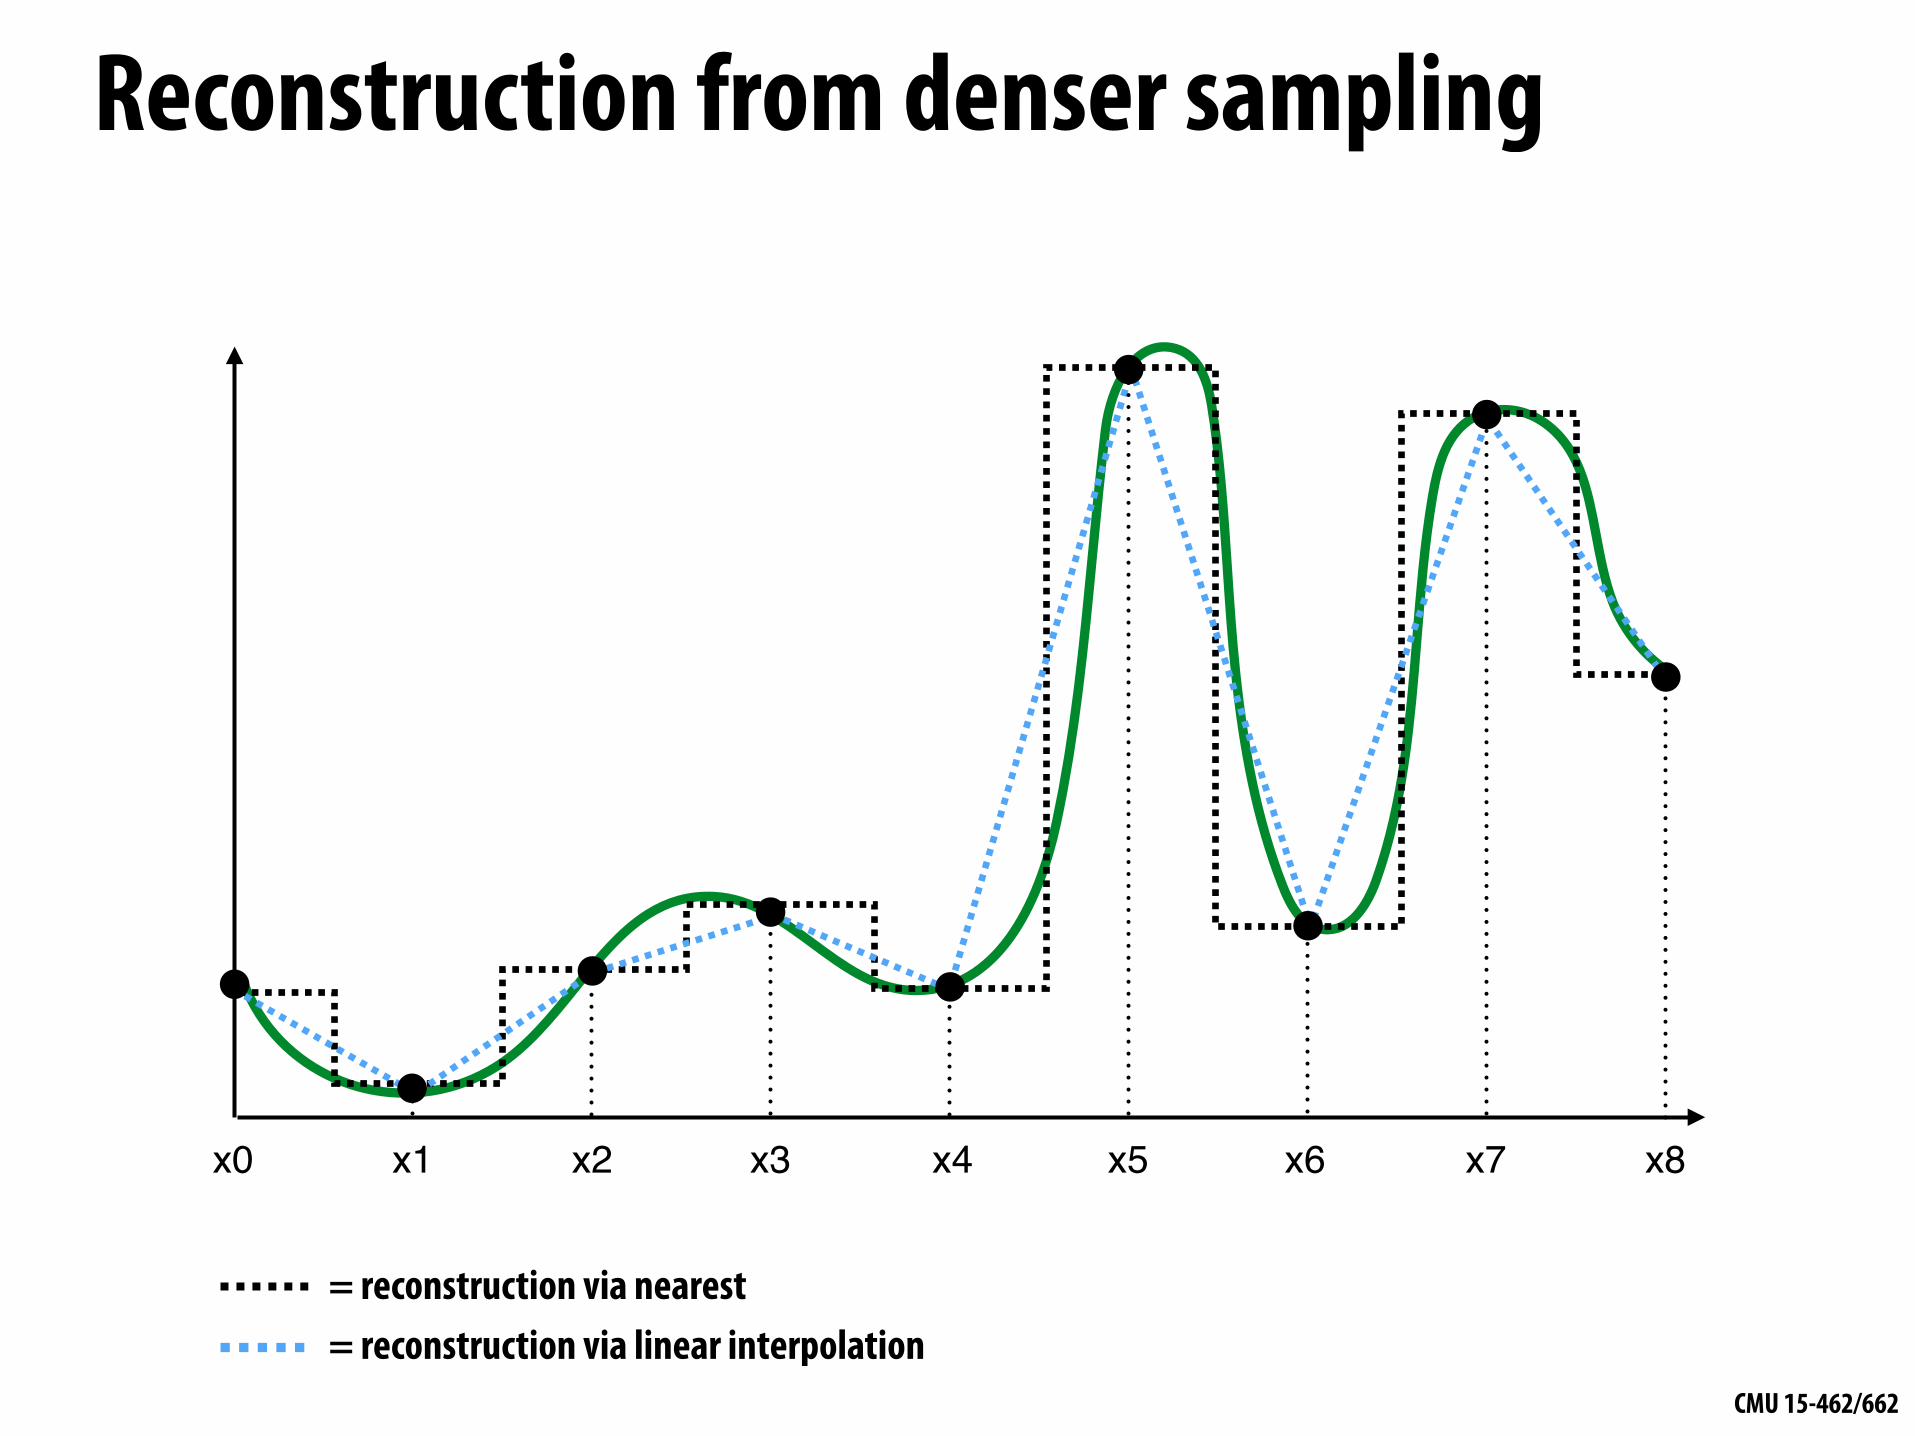
Reconstruction from denser sampling
x1x0 x2 x3 x4 x5 x6 x7 x8
= reconstruction via linear interpolation= reconstruction via nearest

CMU 15-462/662
2D Sampling & Reconstruction▪ Basic story doesn’t change much for images:
- sample values measure image (i.e., signal) at sample points - apply interpolation/reconstruction filter to approximate image
original piecewise constant (“nearest neighbor”)
piecewise bi-linear
CMU 15-462/662
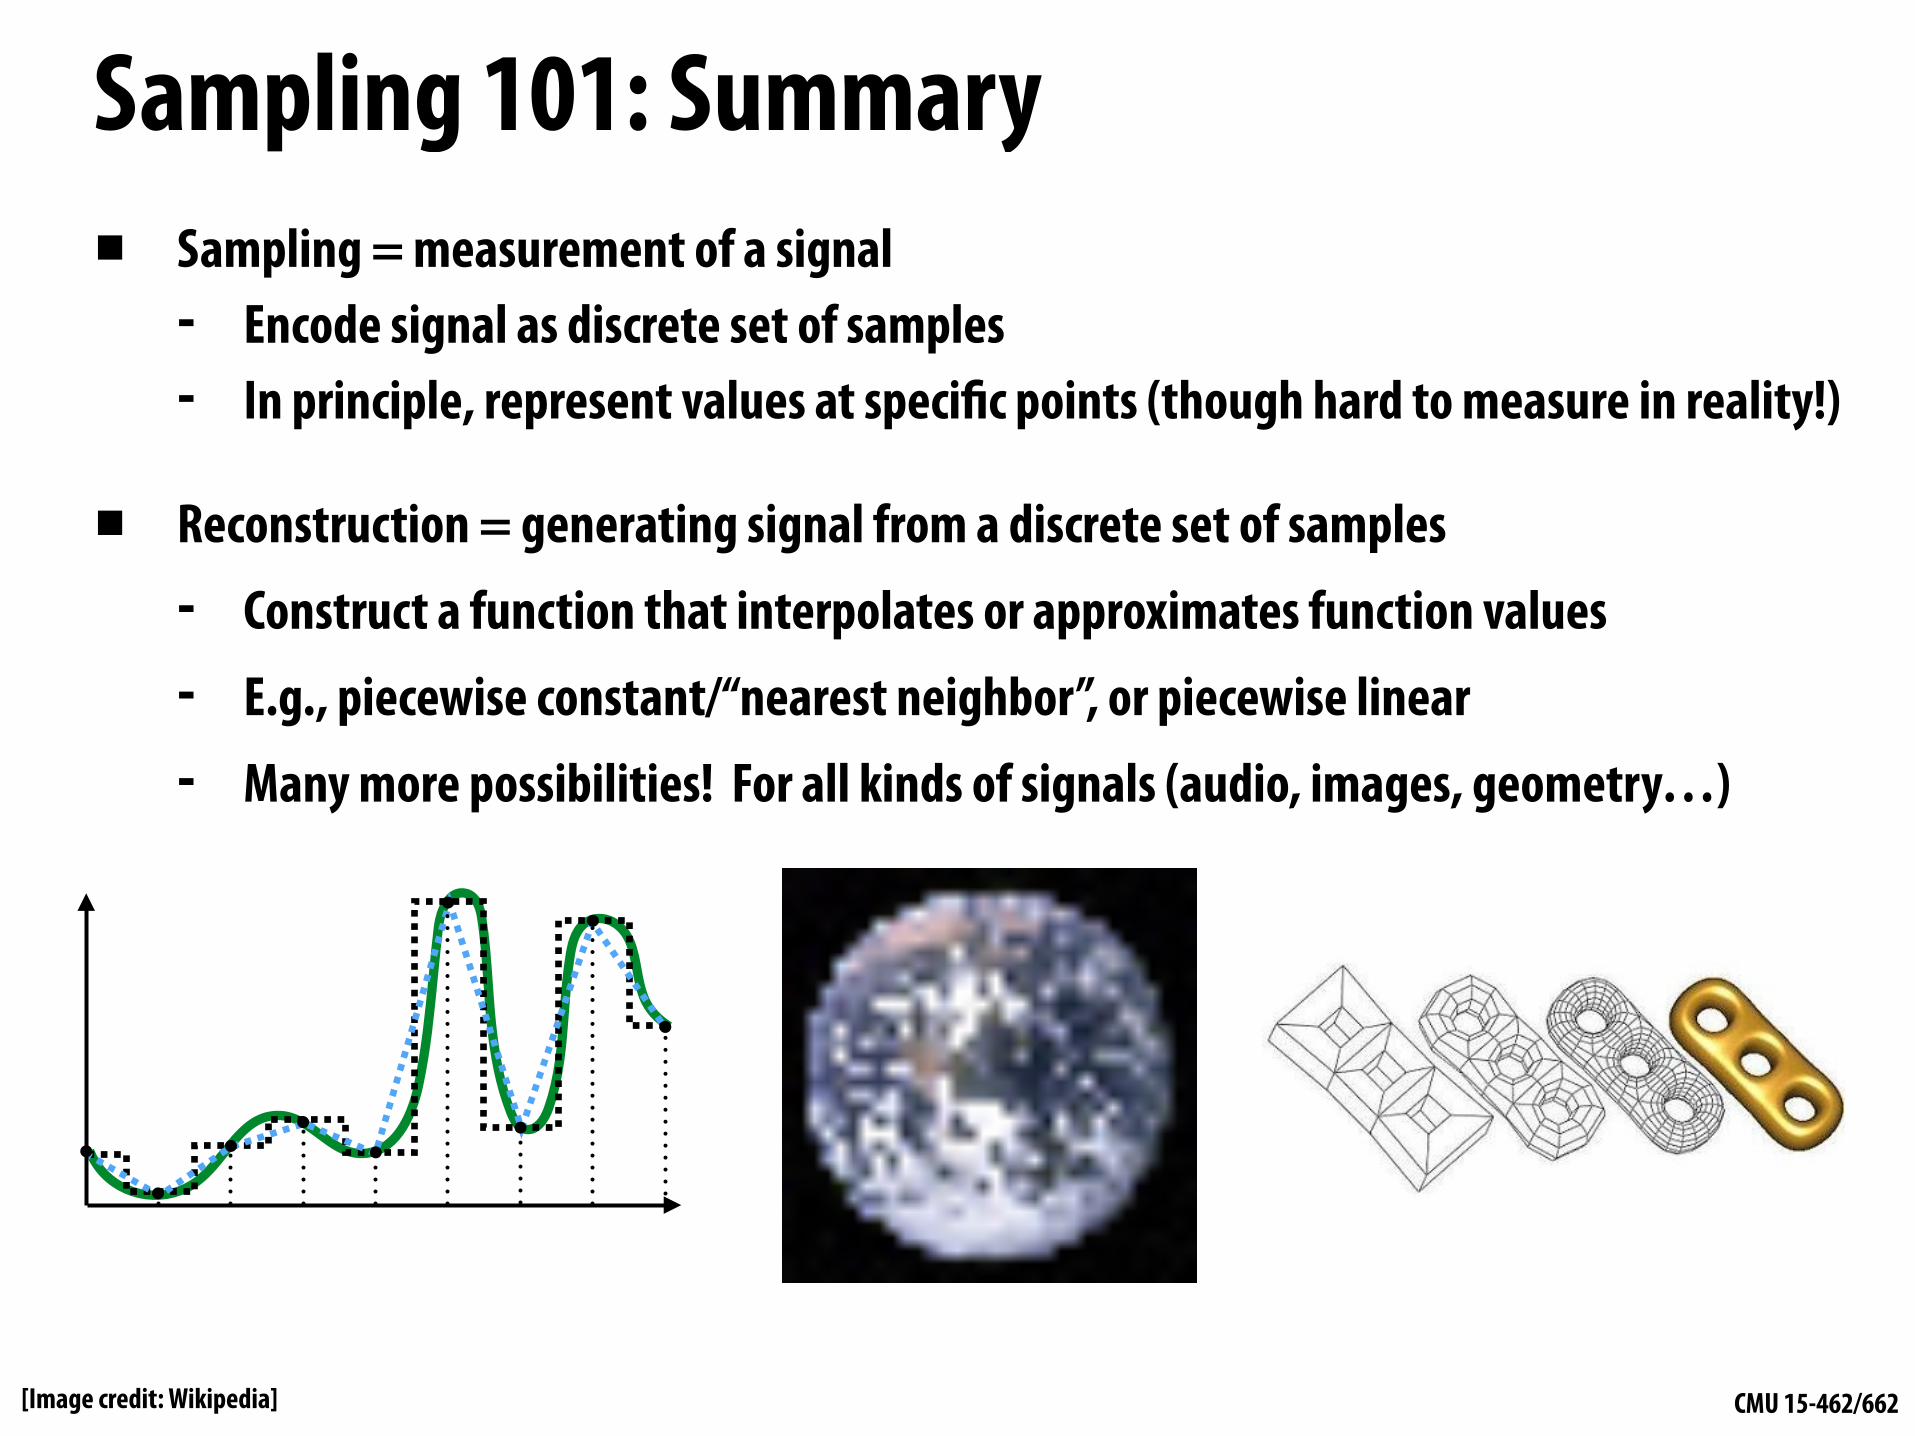
Sampling 101: Summary▪ Sampling = measurement of a signal
- Encode signal as discrete set of samples - In principle, represent values at specific points (though hard to measure in reality!)
▪ Reconstruction = generating signal from a discrete set of samples
- Construct a function that interpolates or approximates function values
- E.g., piecewise constant/“nearest neighbor”, or piecewise linear
- Many more possibilities! For all kinds of signals (audio, images, geometry…)
[Image credit: Wikipedia]

CMU 15-462/662
For coverage, what function are we sampling?
coverage(x,y) = 1
0
if the trianglecontains point (x,y)
otherwise
CMU 15-462/662
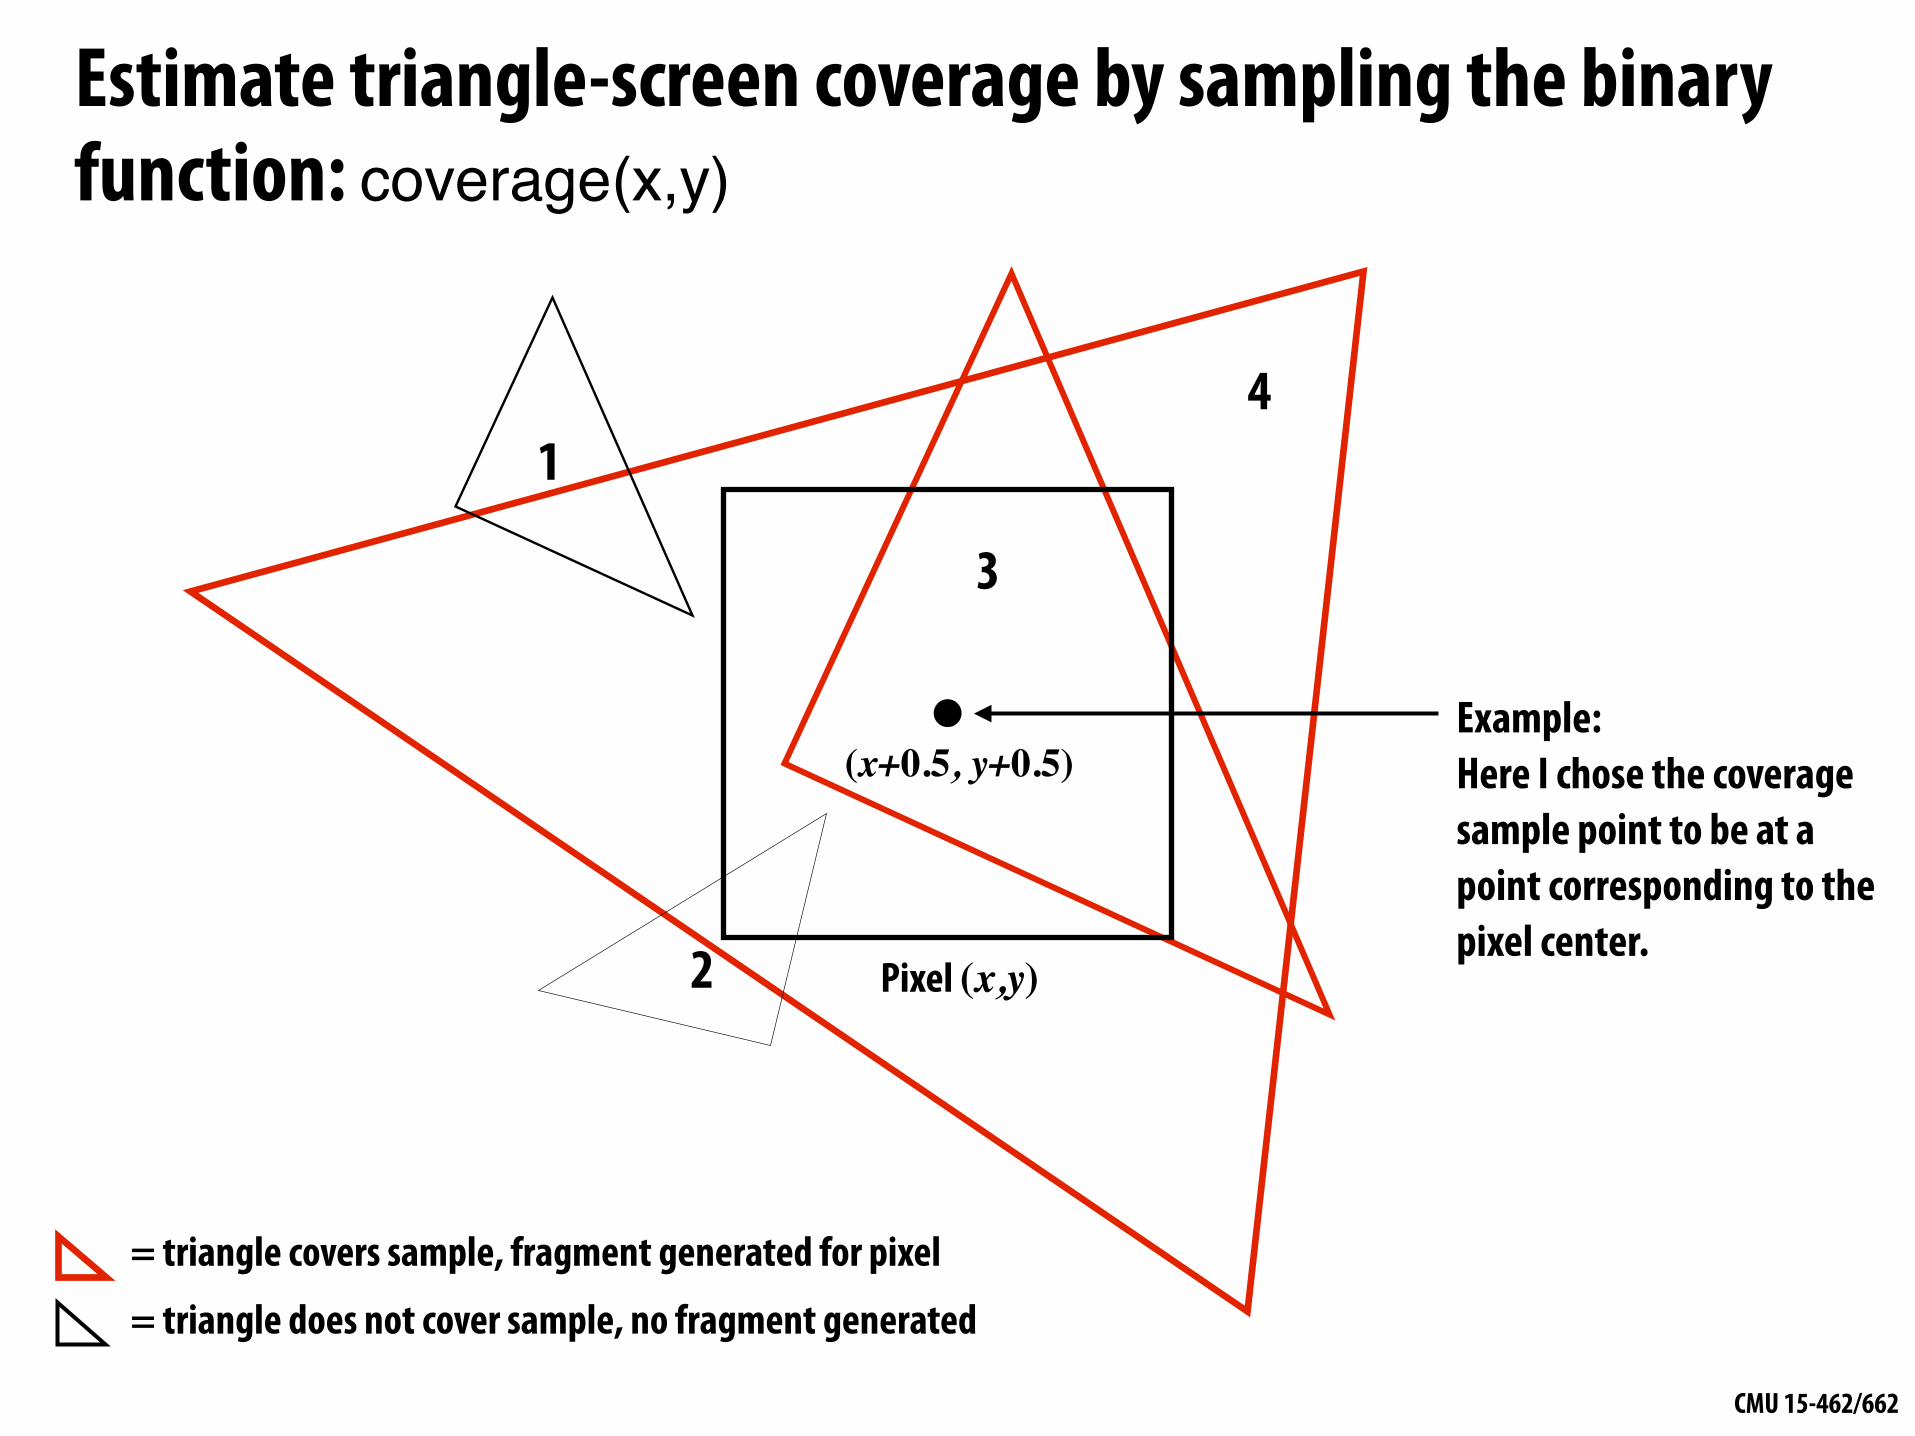
Estimate triangle-screen coverage by sampling the binary function: coverage(x,y)
Pixel (x,y)
1
2
3
4
Example: Here I chose the coverage sample point to be at a point corresponding to the pixel center.
= triangle covers sample, fragment generated for pixel
= triangle does not cover sample, no fragment generated
(x+0.5, y+0.5)
CMU 15-462/662
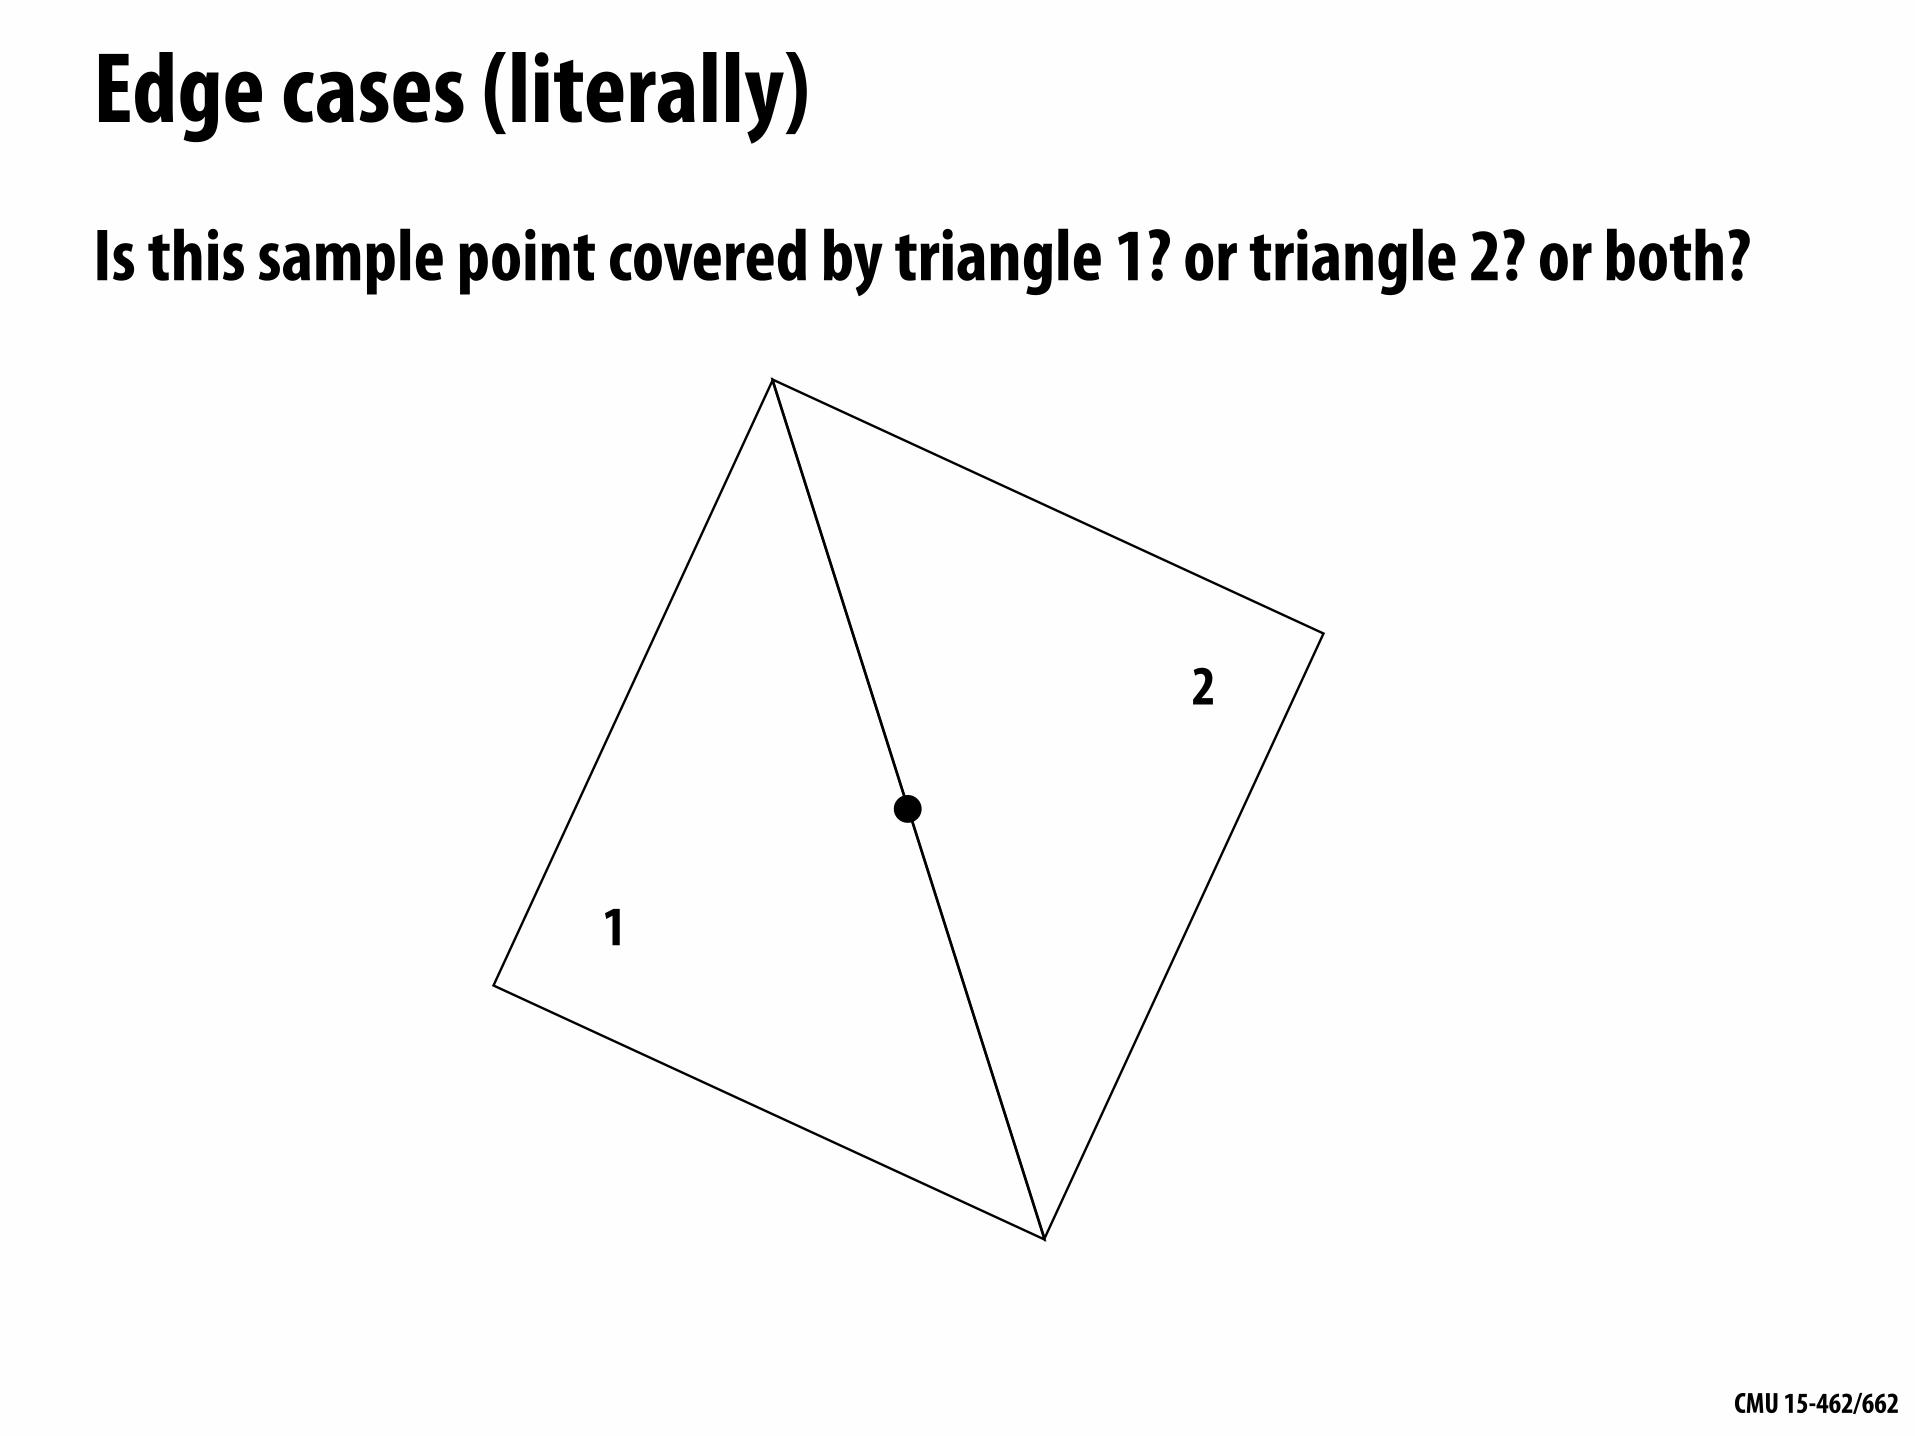
Edge cases (literally)
Is this sample point covered by triangle 1? or triangle 2? or both?
1
2
CMU 15-462/662
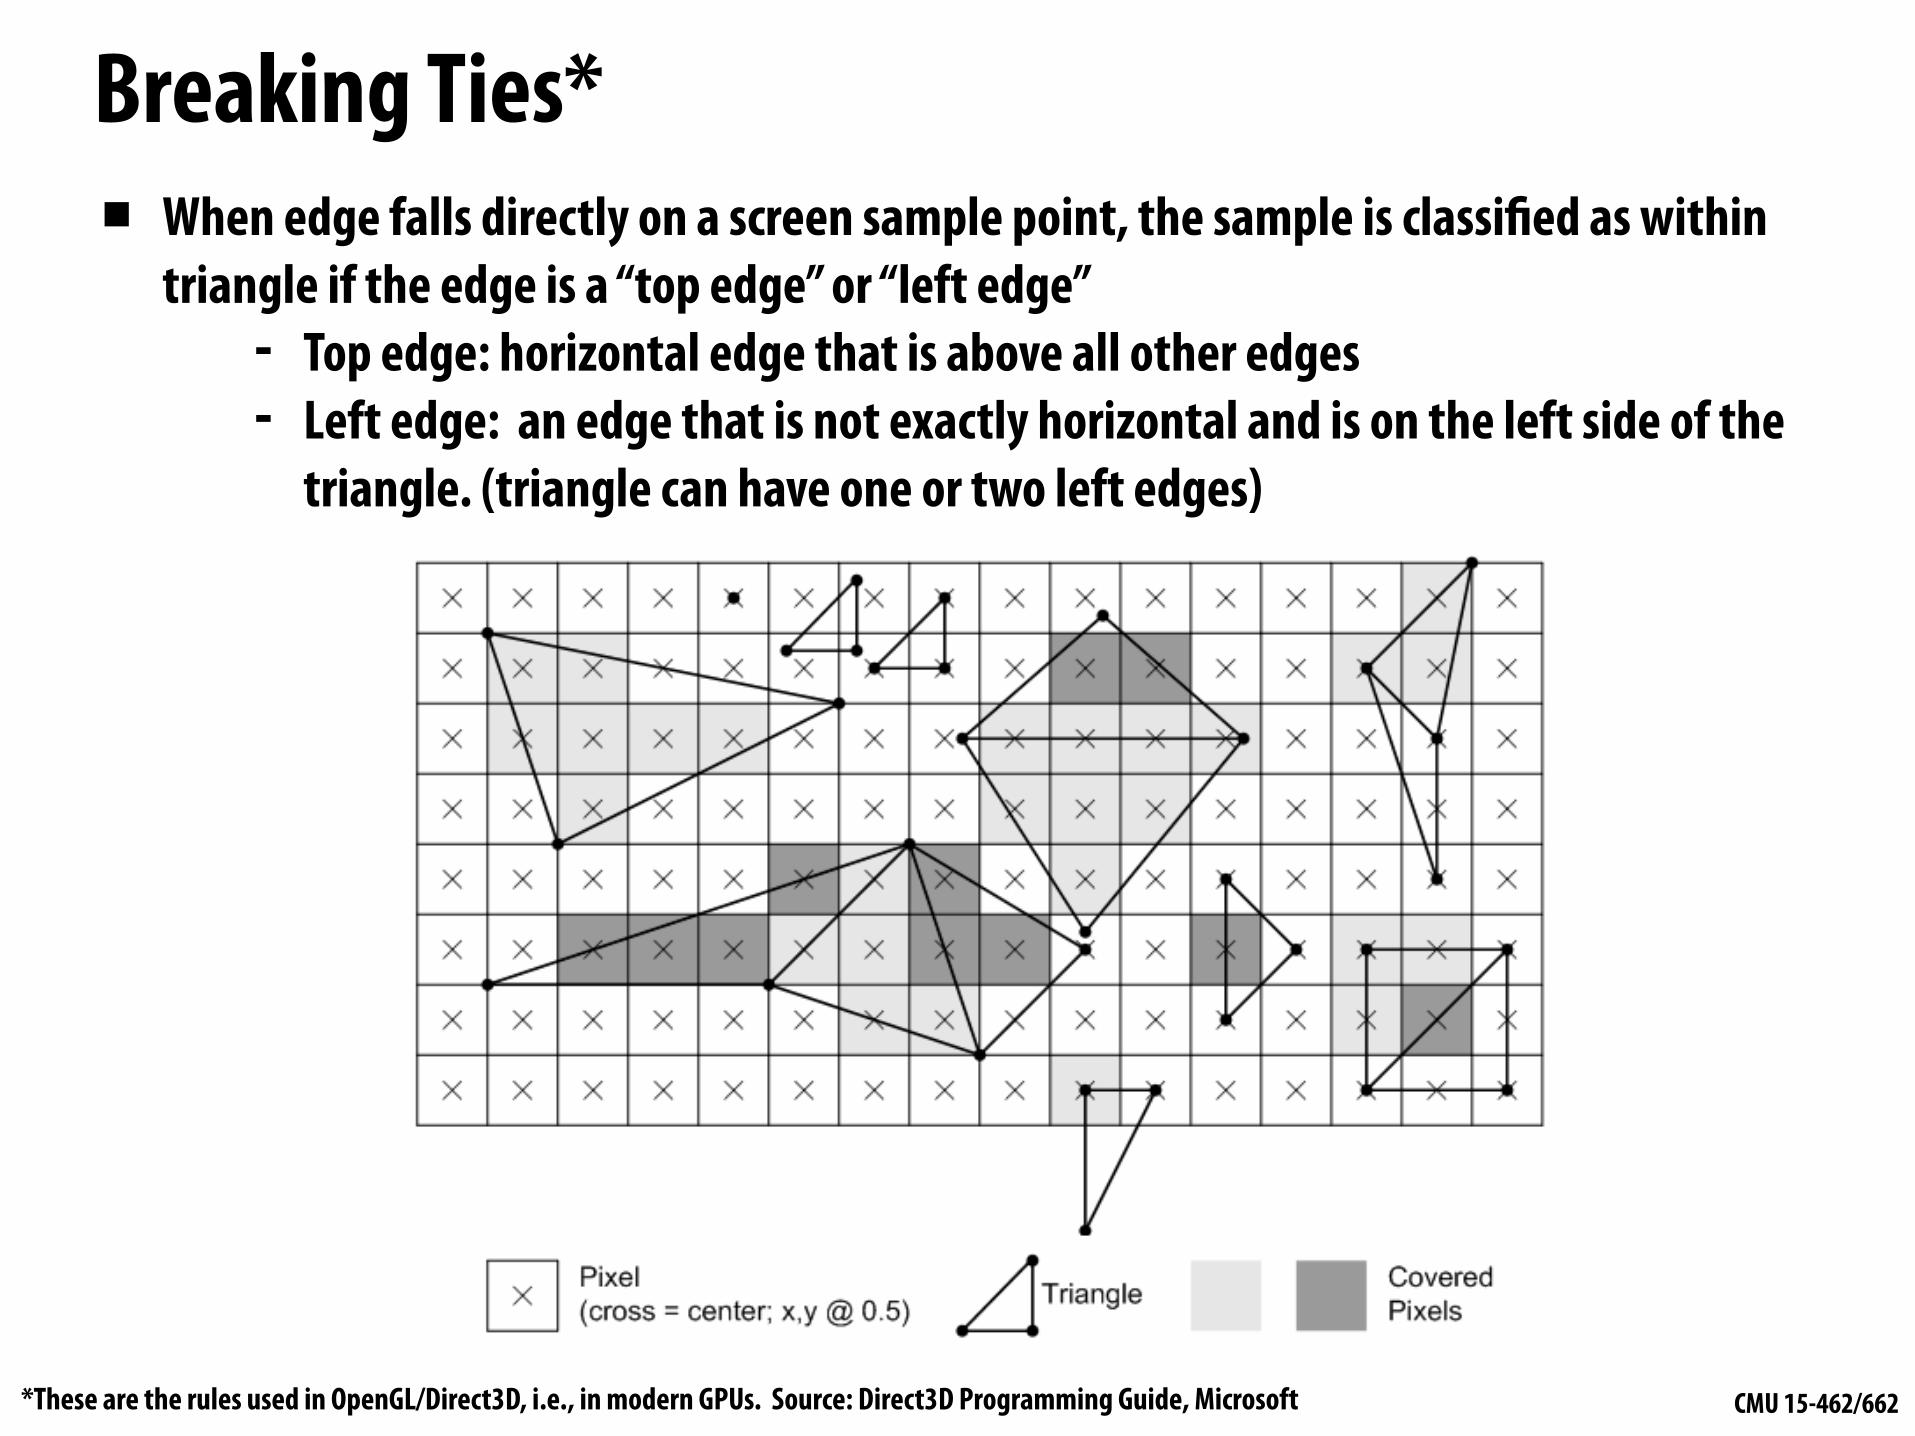
Breaking Ties*▪ When edge falls directly on a screen sample point, the sample is classified as within
triangle if the edge is a “top edge” or “left edge” - Top edge: horizontal edge that is above all other edges - Left edge: an edge that is not exactly horizontal and is on the left side of the
triangle. (triangle can have one or two left edges)
*These are the rules used in OpenGL/Direct3D, i.e., in modern GPUs. Source: Direct3D Programming Guide, Microsoft
CMU 15-462/662
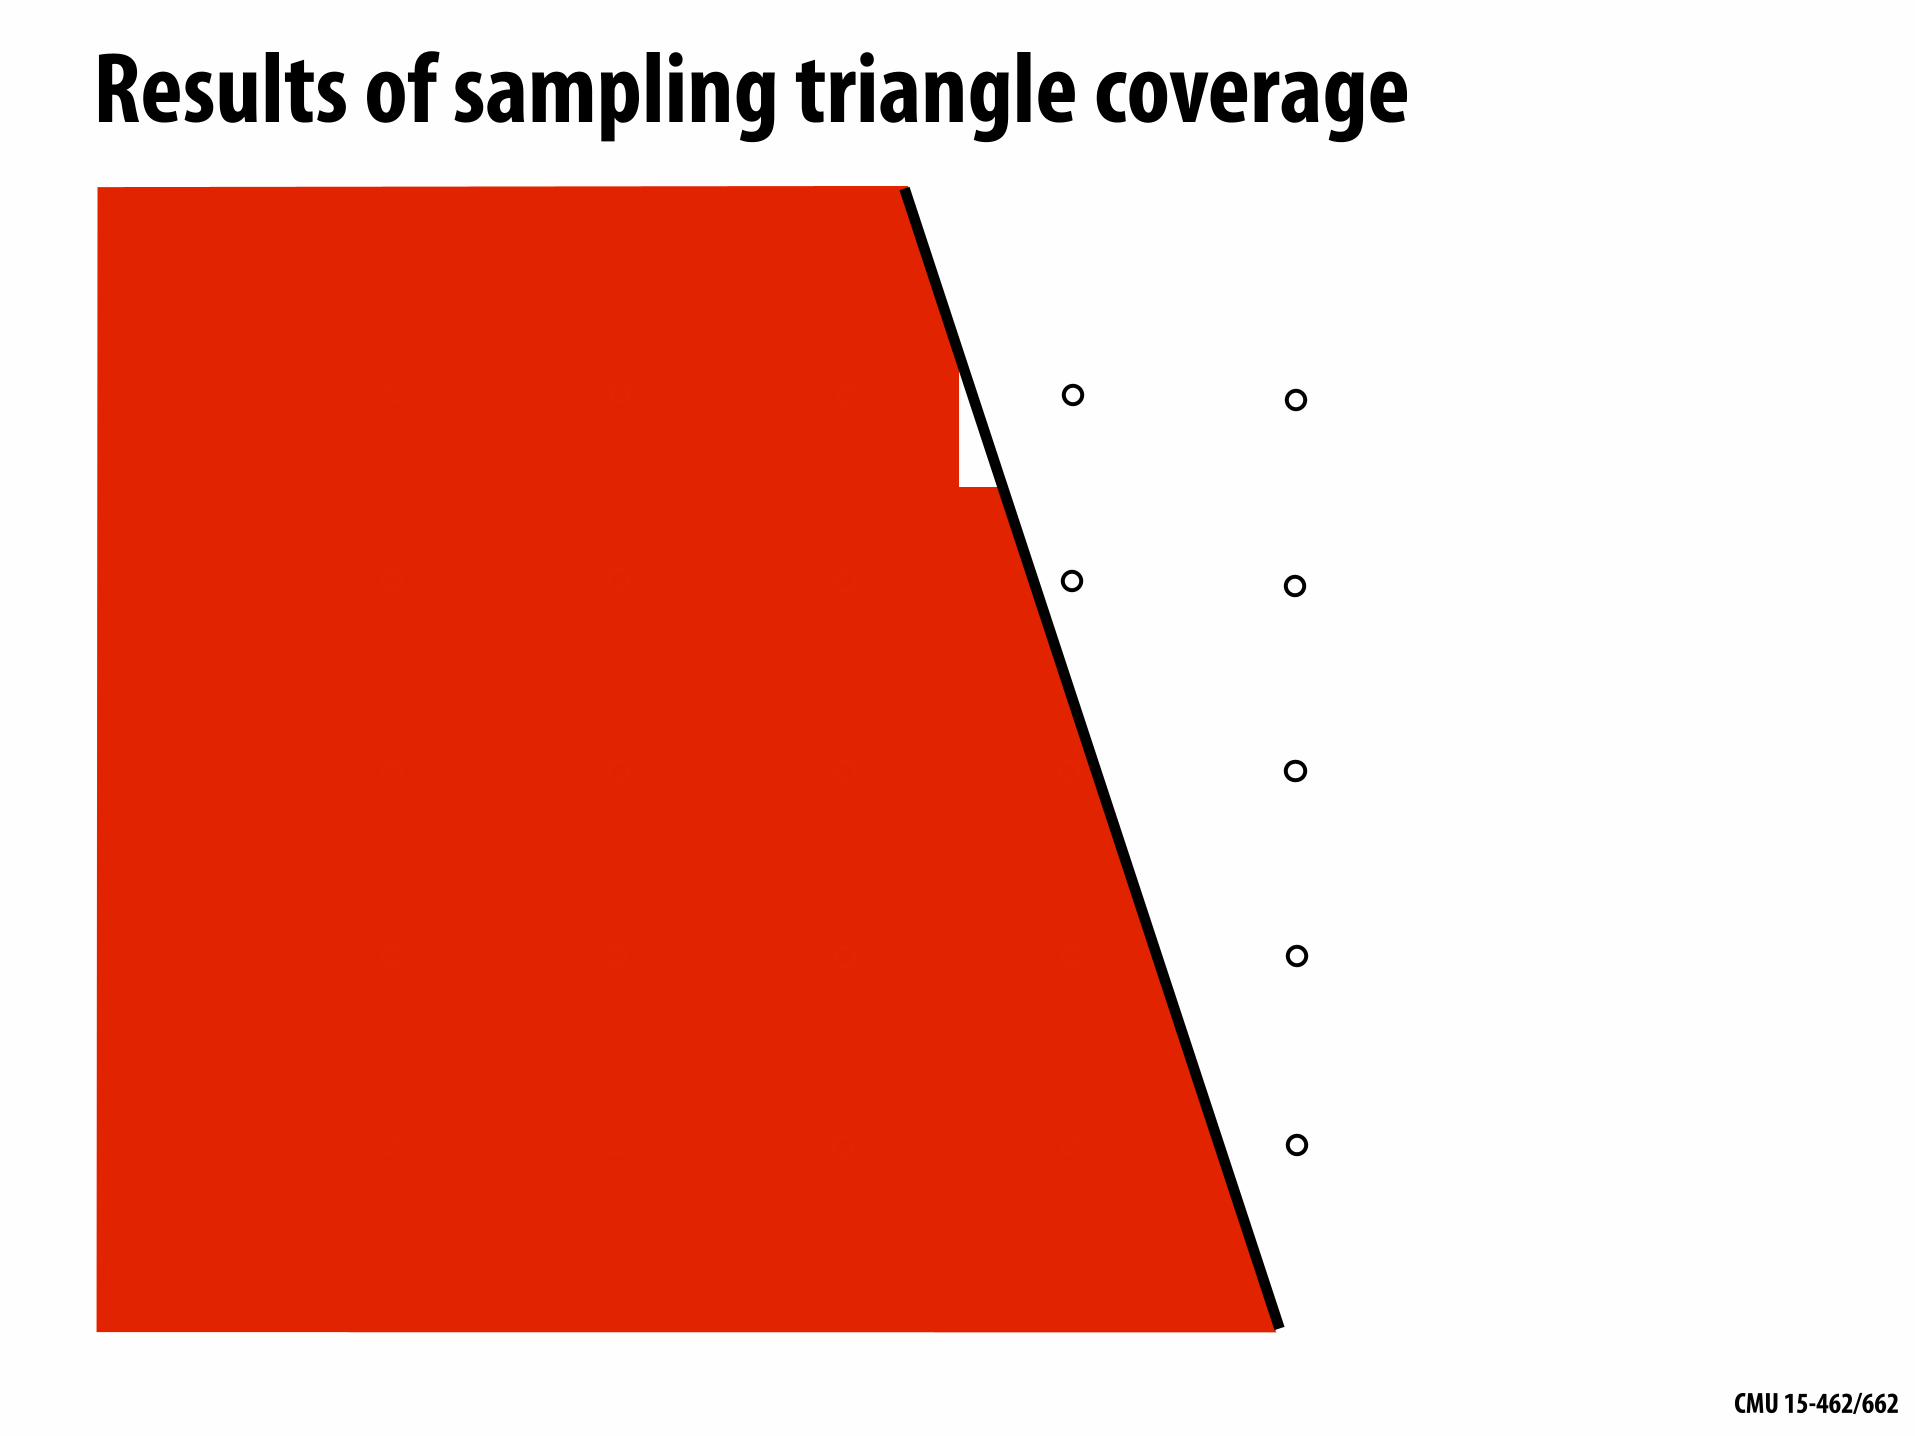
Results of sampling triangle coverage

CMU 15-462/662
I have a sampled signal, now I want to display it on a screen

CMU 15-462/662
Pixels on a screen
LCD display pixel on my laptop
Each image sample sent to the display is converted into a little square of light of the appropriate color: (a pixel = picture element)
* Thinking of each LCD pixel as emitting a square of uniform intensity light of a single color is a bit of an approximation to how real displays work, but it will do for now.
CMU 15-462/662
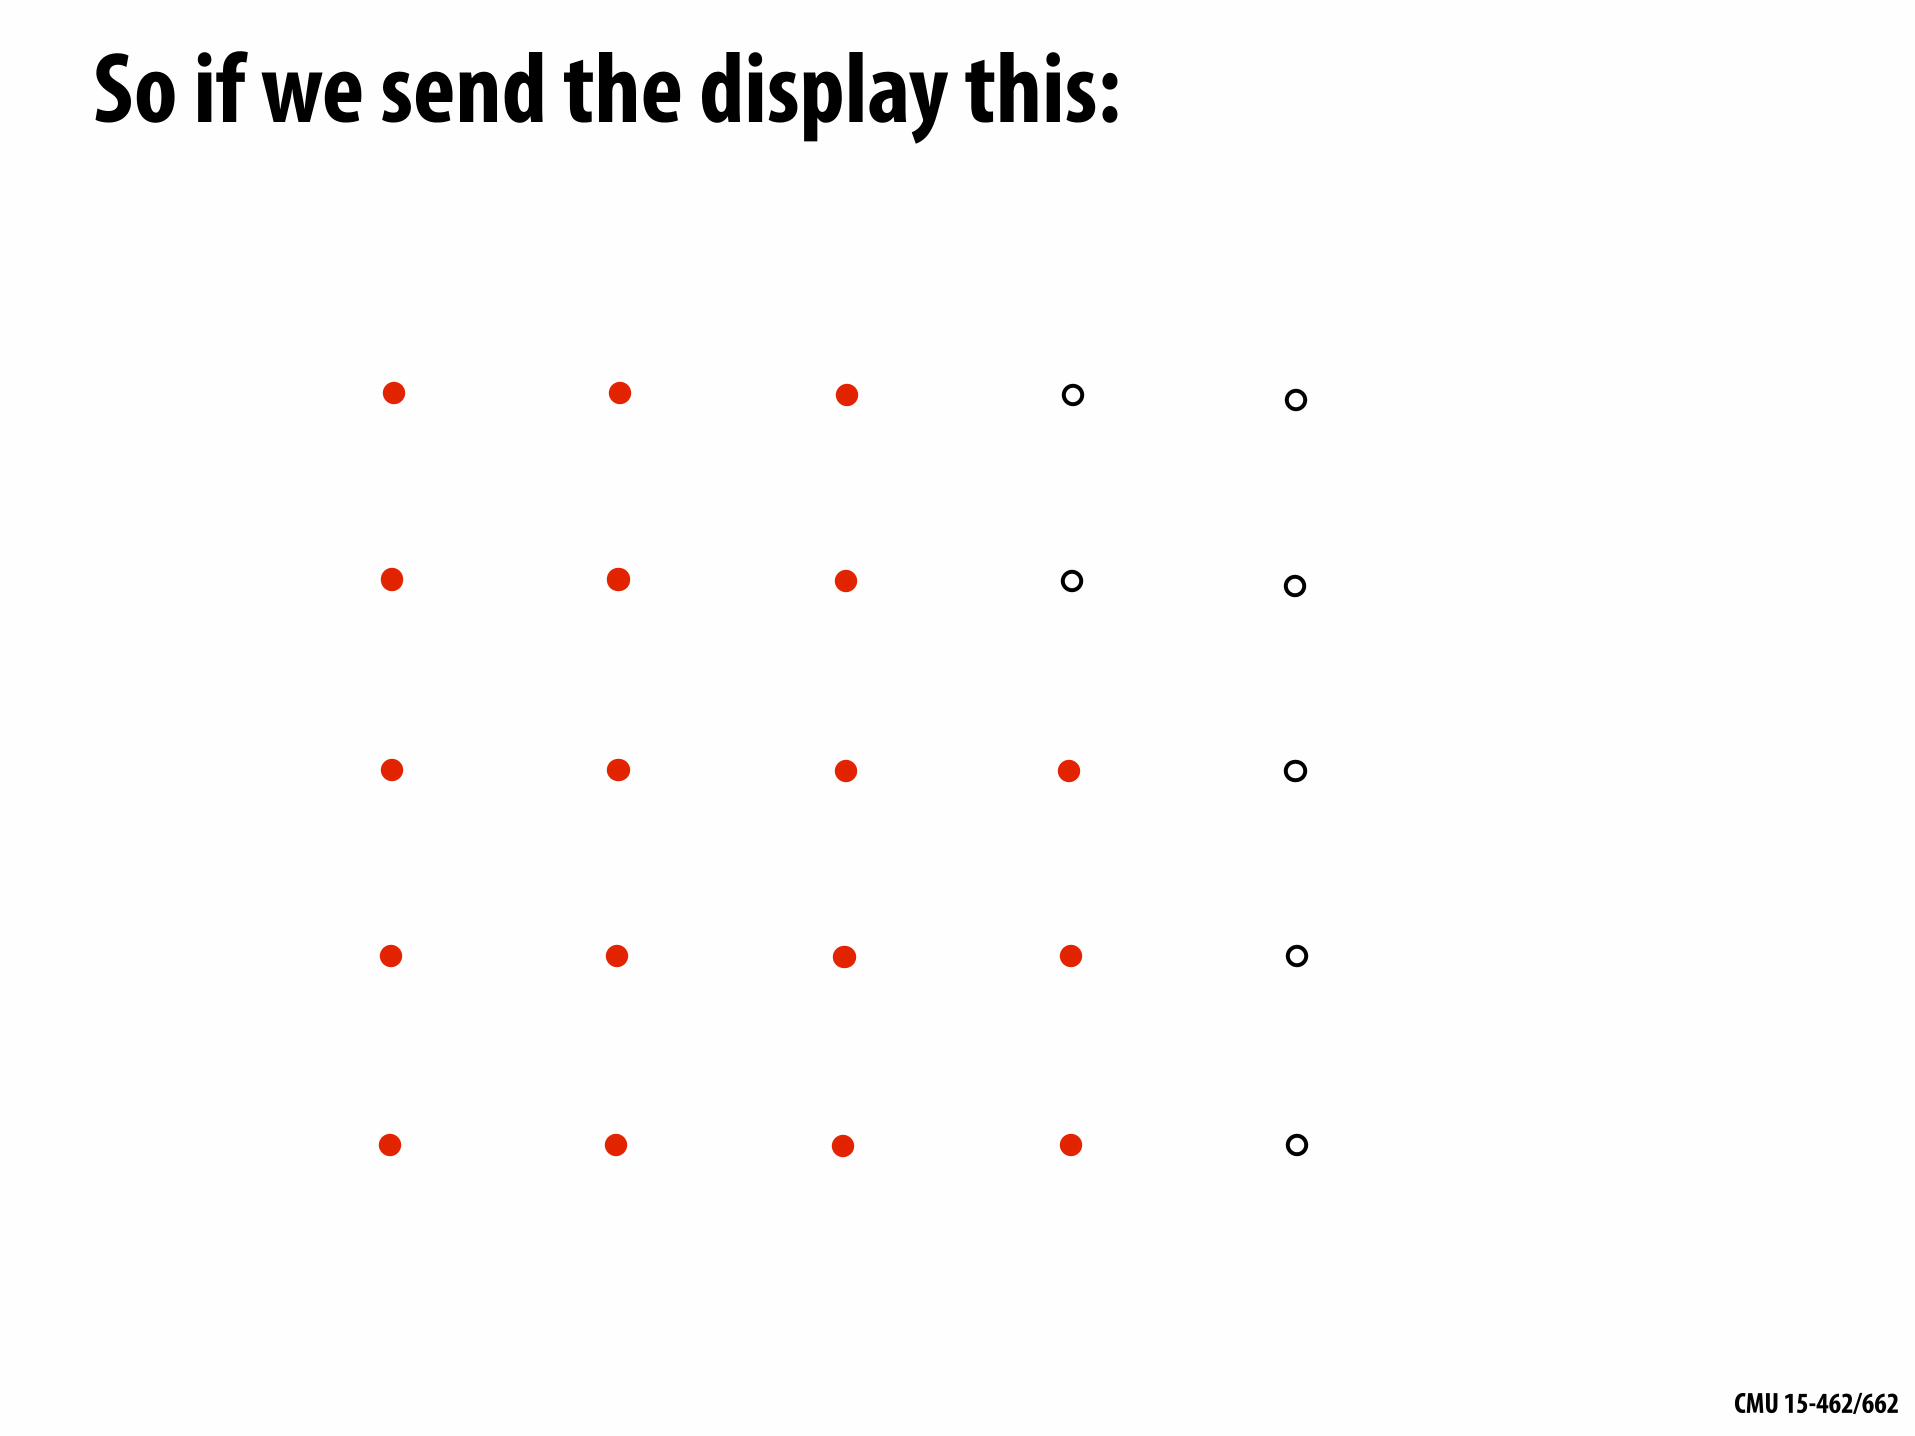
So if we send the display this:

CMU 15-462/662
We see this when we look at the screen (assuming a screen pixel emits a square of perfectly uniform intensity of light)

CMU 15-462/662
Recall: the real coverage signal was this
CMU 15-462/662
Aliasing
CMU 15-462/662
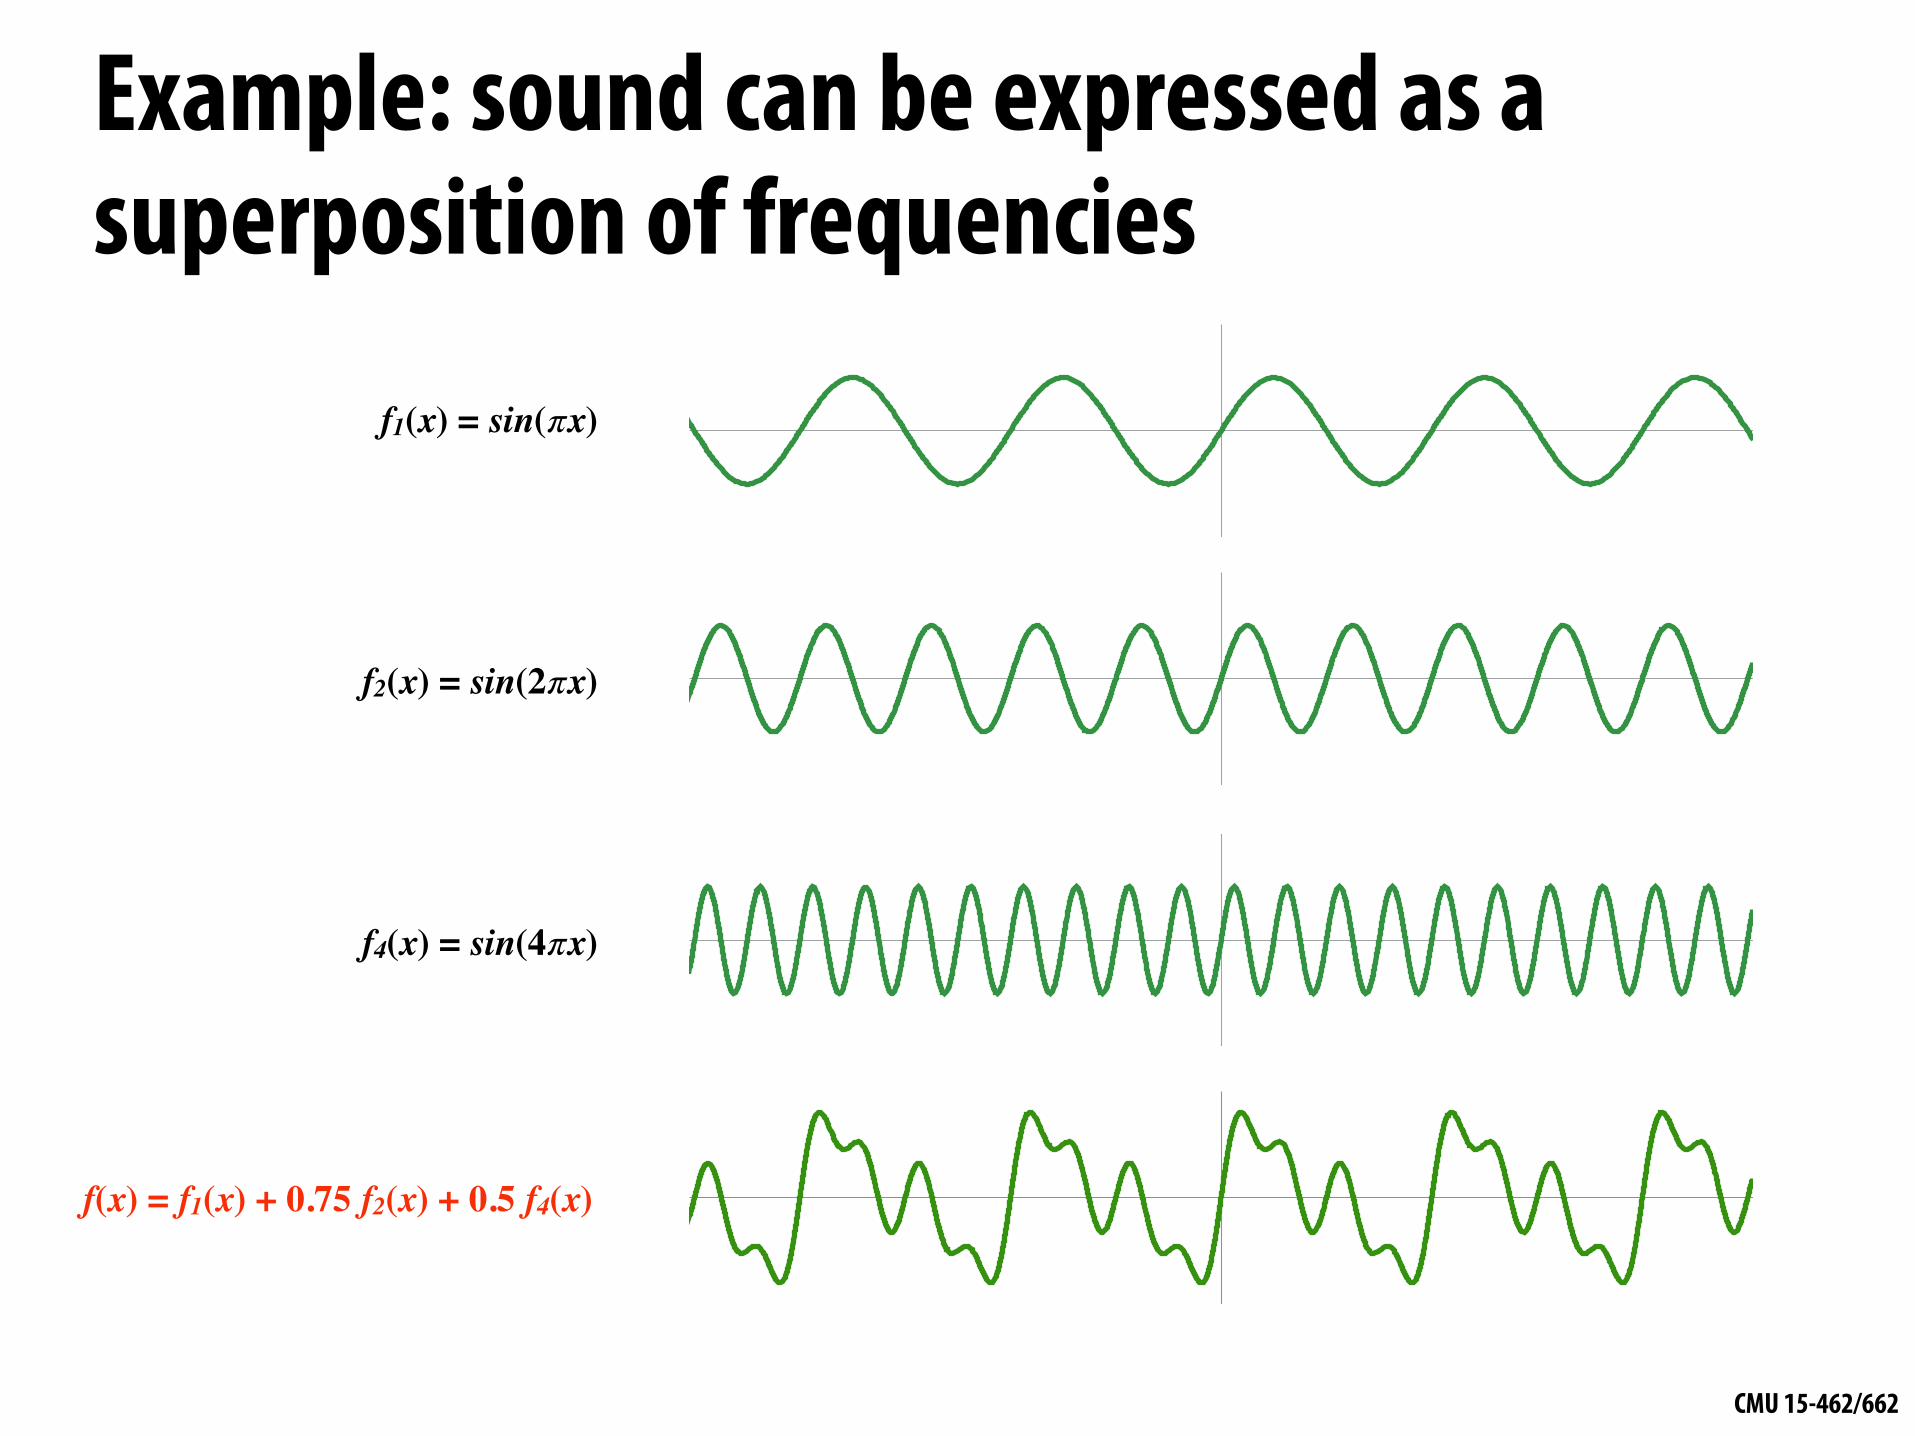
Example: sound can be expressed as a superposition of frequencies
f1(x) = sin(𝜋x)
f2(x) = sin(2𝜋x)
f4(x) = sin(4𝜋x)
f(x) = f1(x) + 0.75 f2(x) + 0.5 f4(x)
CMU 15-462/662
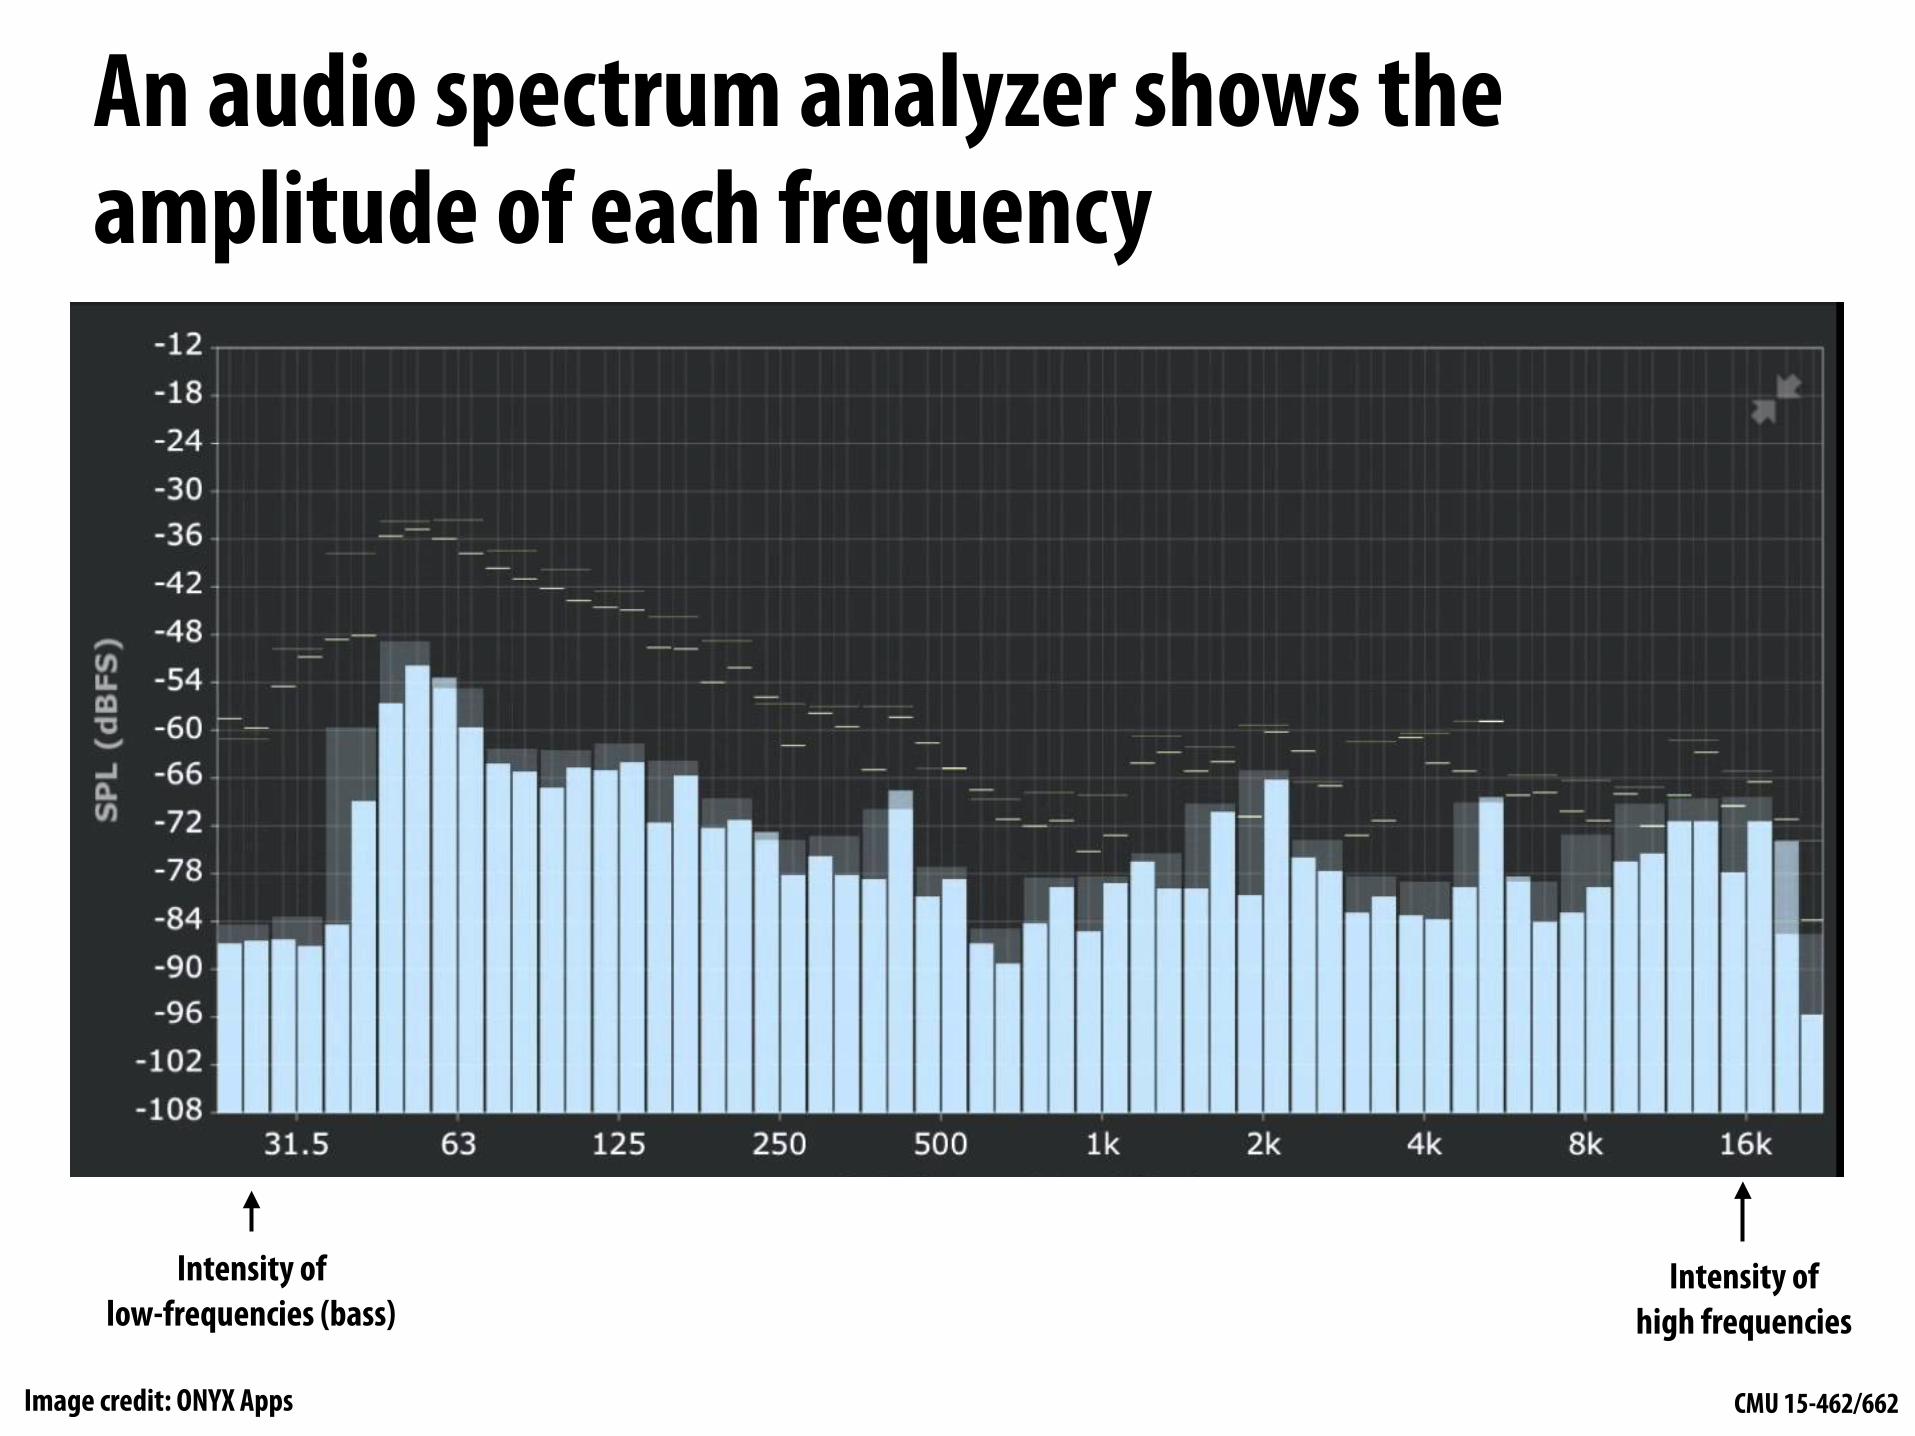
An audio spectrum analyzer shows the amplitude of each frequency
Intensity of low-frequencies (bass)
Image credit: ONYX Apps
Intensity of high frequencies

CMU 15-462/662
Images can also be decomposed into “frequencies”
SpectrumSpatial domain result
CMU 15-462/662
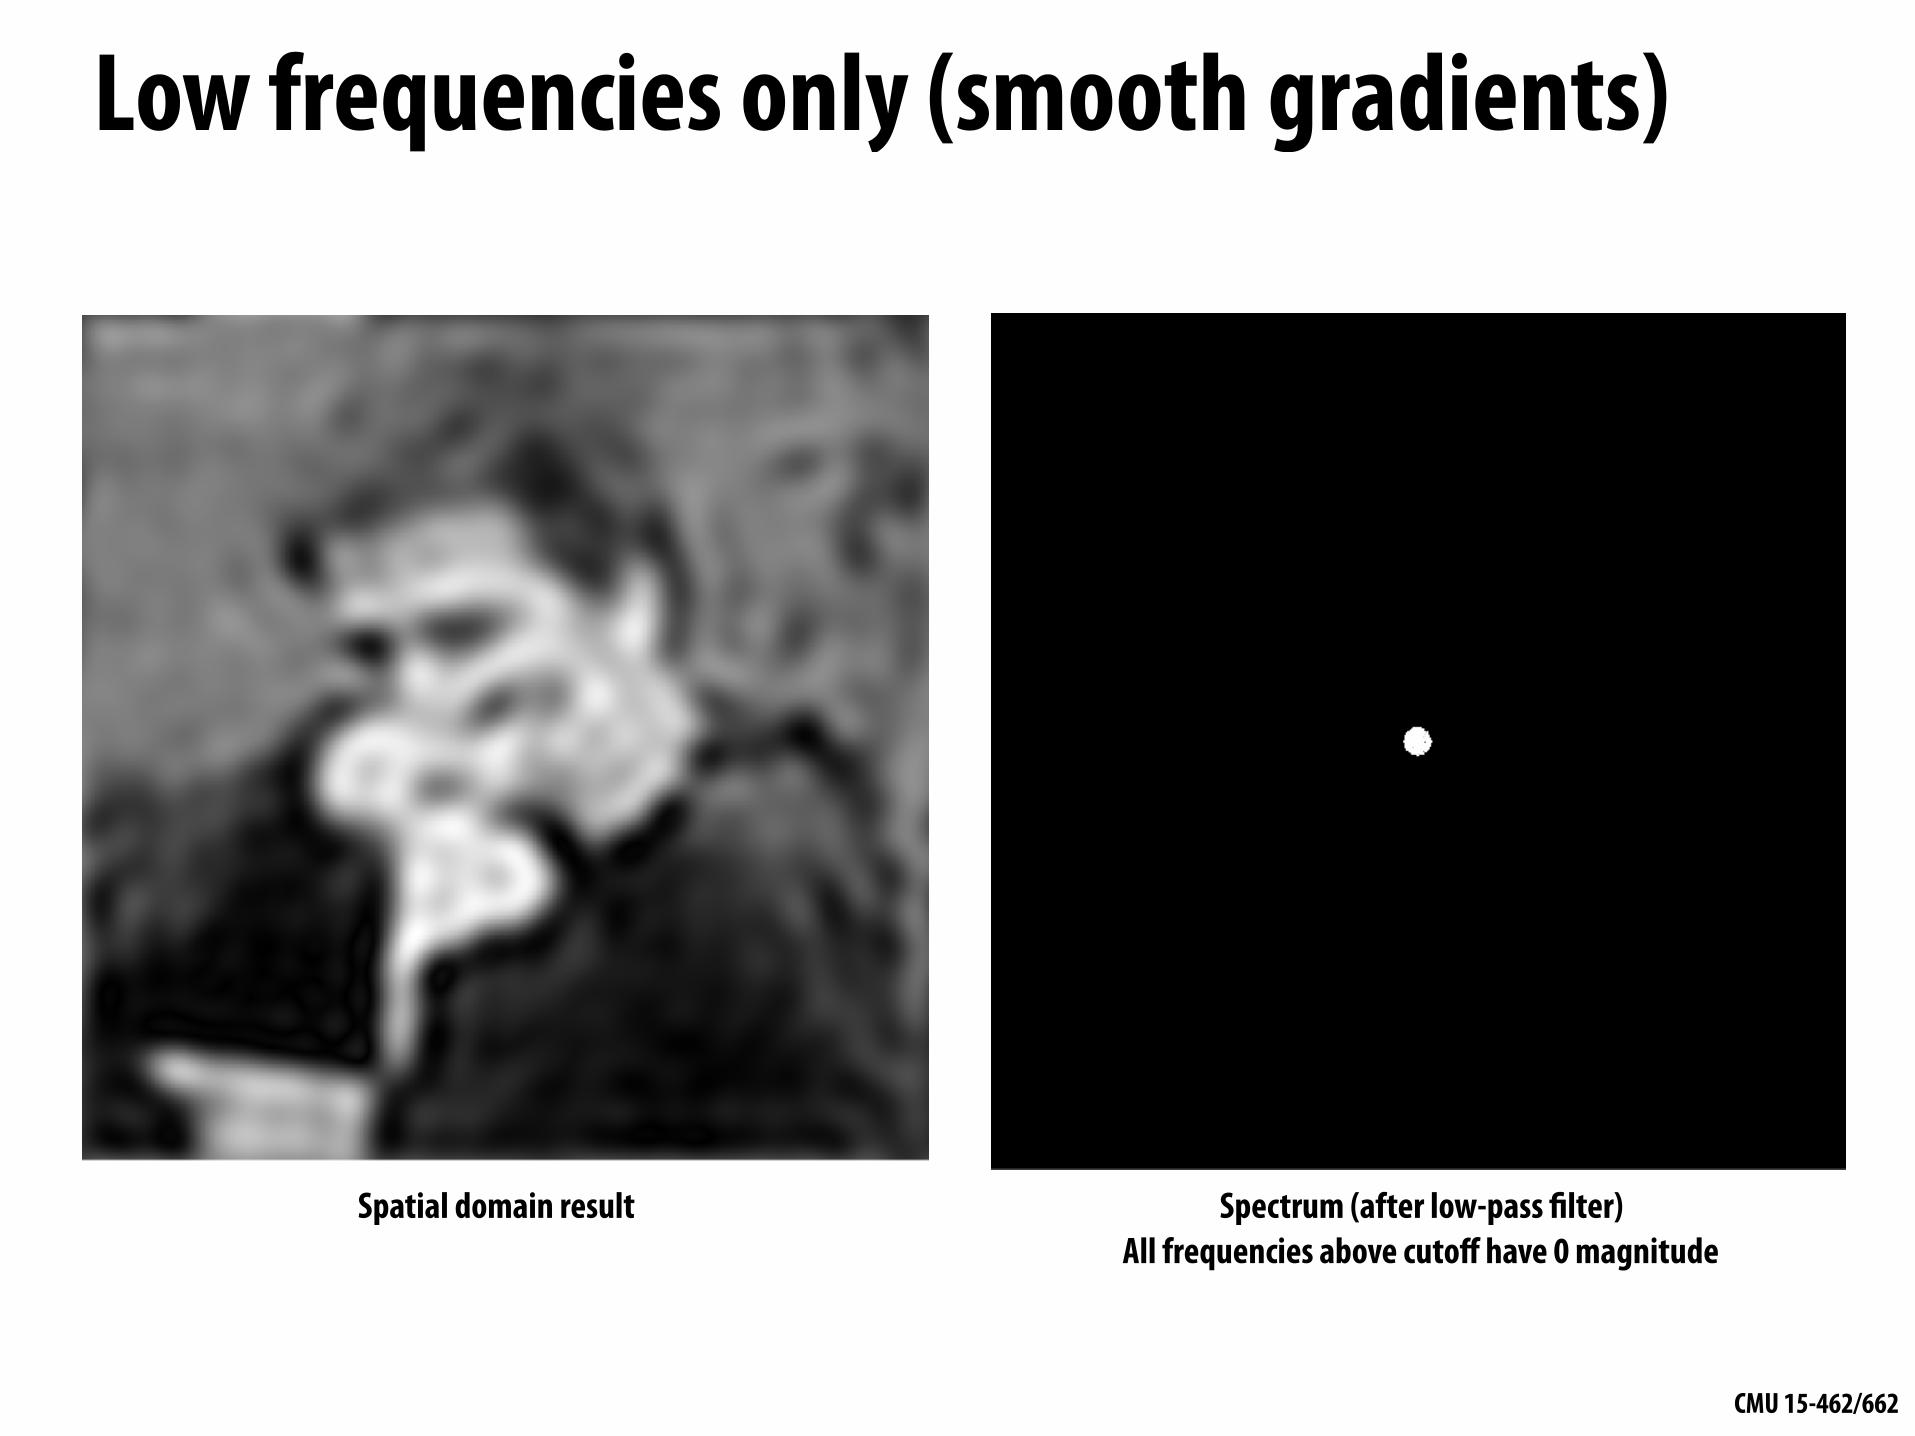
Low frequencies only (smooth gradients)
Spectrum (after low-pass filter) All frequencies above cutoff have 0 magnitude
Spatial domain result
CMU 15-462/662
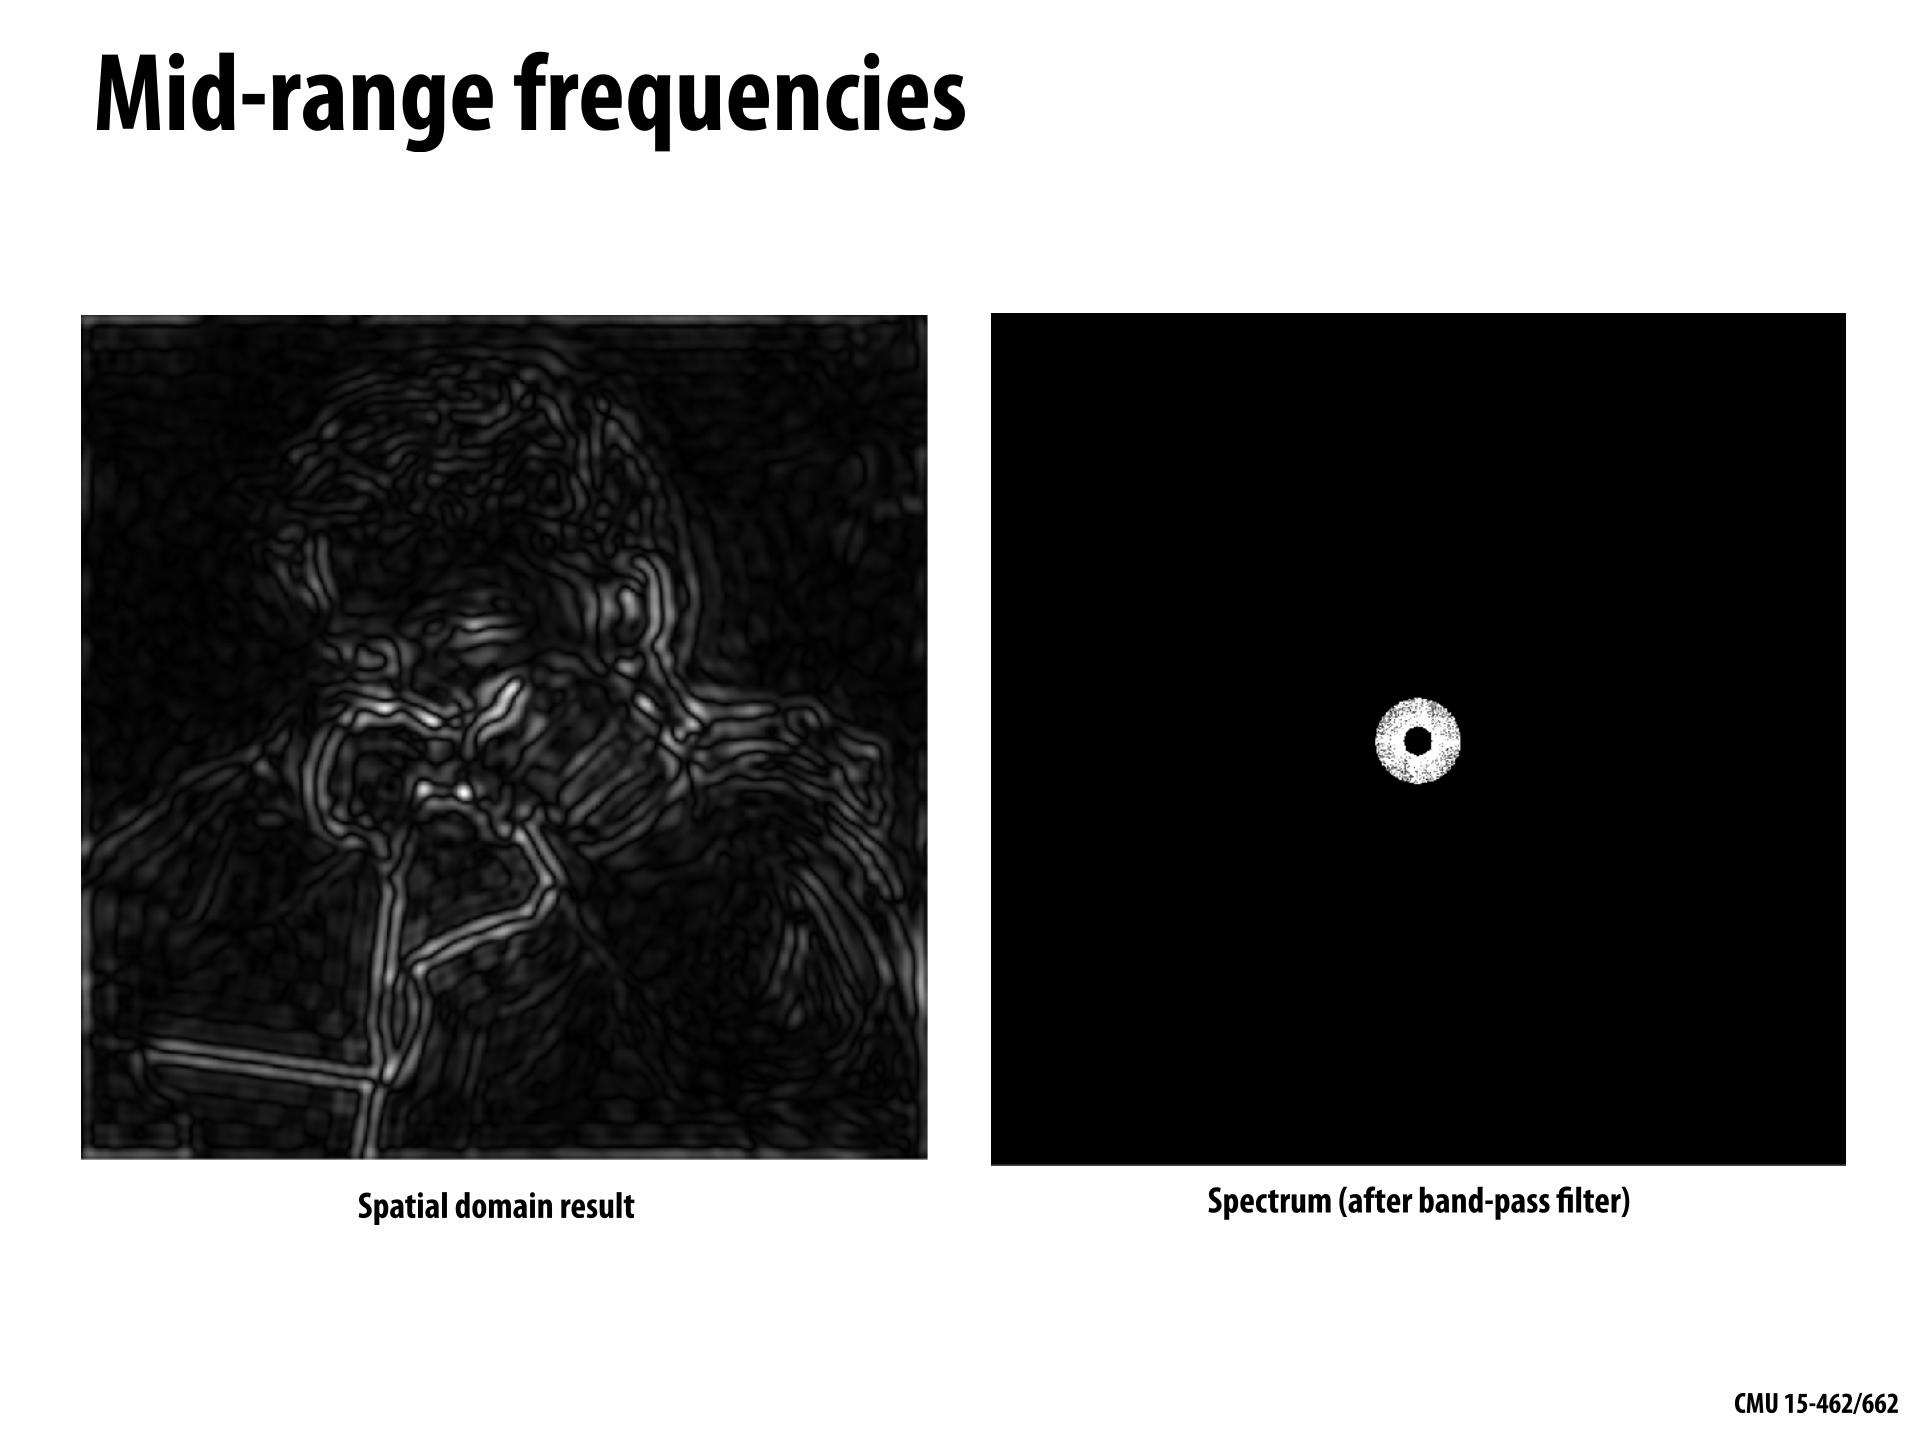
Mid-range frequencies
Spatial domain result Spectrum (after band-pass filter)

CMU 15-462/662
Mid-range frequencies
Spatial domain result Spectrum (after band-pass filter)

CMU 15-462/662
High frequencies (edges)
Spatial domain result (strongest edges)
Spectrum (after high-pass filter) All frequencies below threshold
have 0 magnitude
CMU 15-462/662
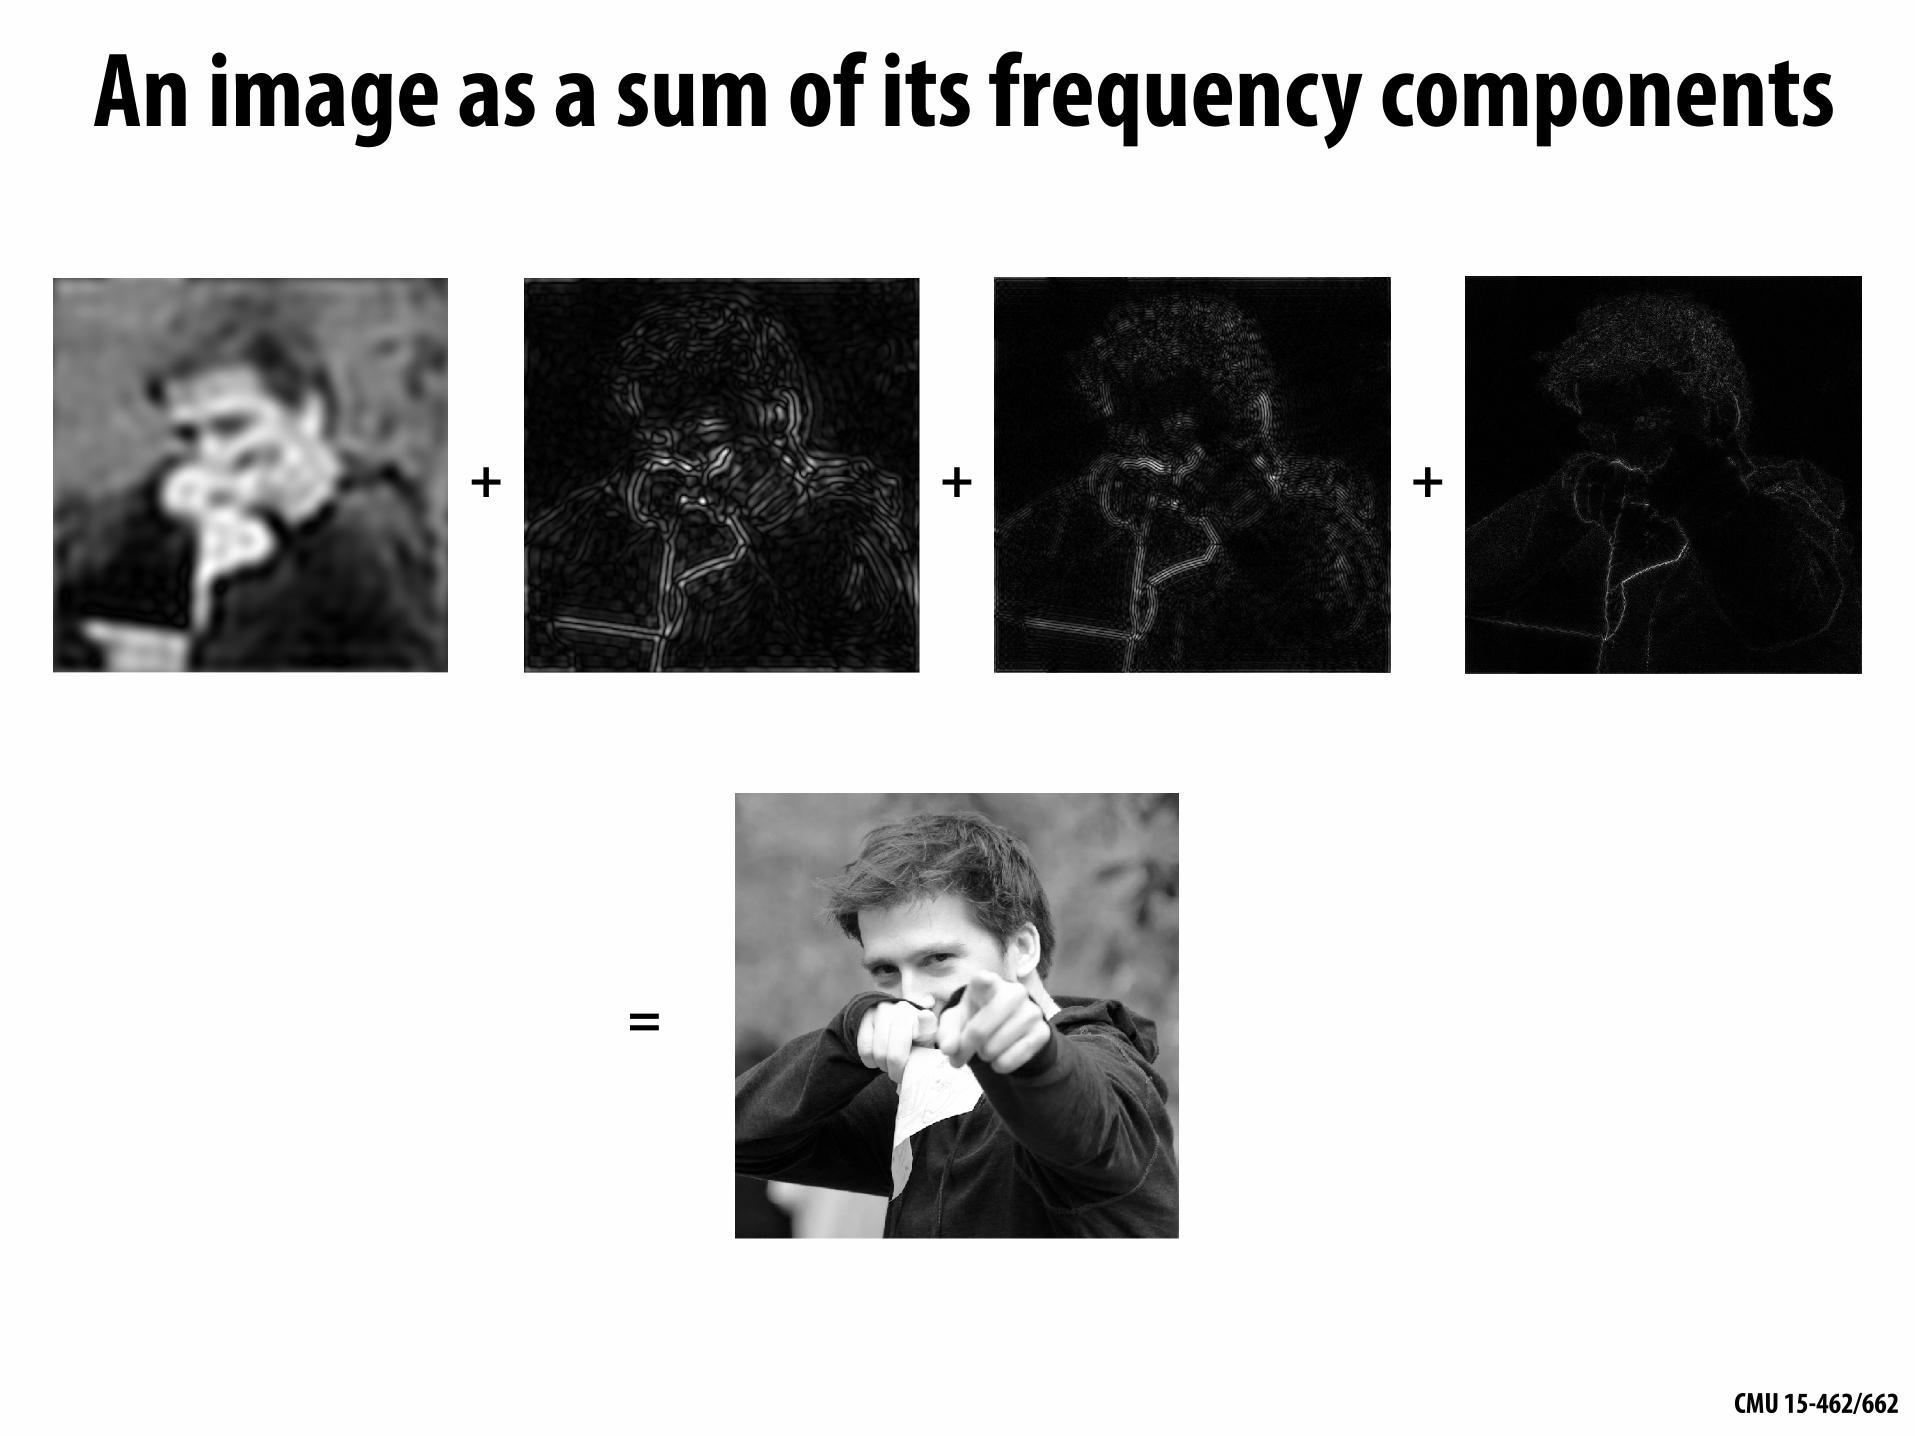
An image as a sum of its frequency components
+ + +
=
CMU 15-462/662
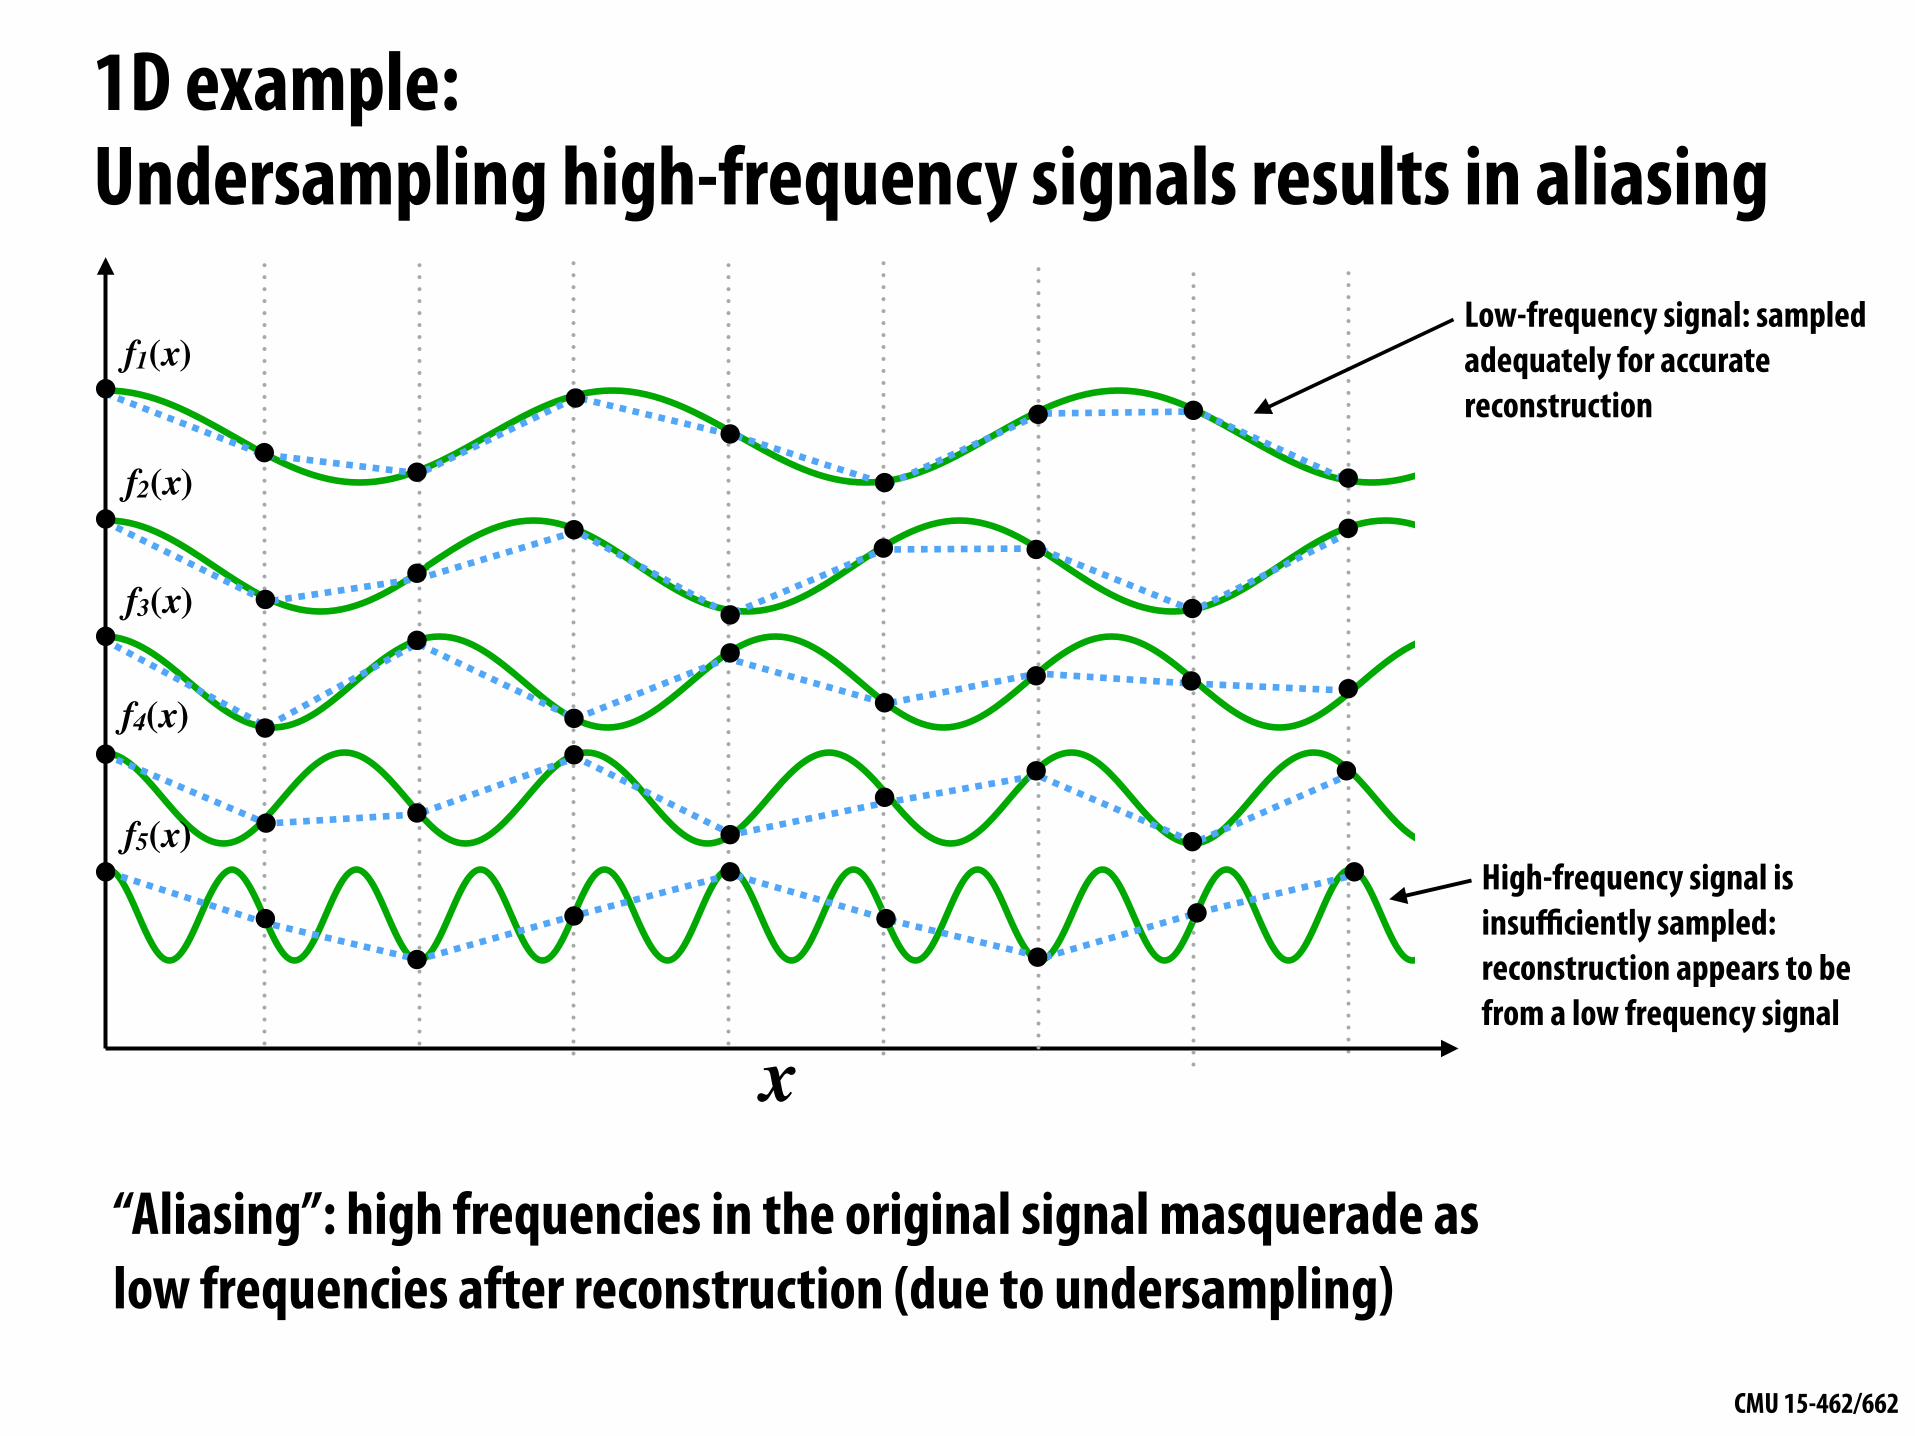
1D example: Undersampling high-frequency signals results in aliasing
Low-frequency signal: sampled adequately for accurate reconstruction
f1(x)
f2(x)
f3(x)
f4(x)
f5(x)
x
High-frequency signal is insufficiently sampled: reconstruction appears to be from a low frequency signal
“Aliasing”: high frequencies in the original signal masquerade as low frequencies after reconstruction (due to undersampling)

CMU 15-462/662
Temporal aliasing: wagon wheel effect
Camera’s frame rate (temporal sampling rate) is too low for rapidly spinning wheel.
https://www.youtube.com/watch?v=VNftf5qLpiA

CMU 15-462/662
Nyquist-Shannon theorem▪ Consider a band-limited signal: has no frequencies above ω0
- 1D: consider low-pass filtered audio signal - 2D: recall the blurred image example from a few slides ago
ω0-ω0
▪ The signal can be perfectly reconstructed if sampled with period T = 1 / 2ω0 ▪ And interpolation is performed using a “sinc filter”
▪ Ideal filter with no frequencies above cutoff (infinite extent!)
VEC: Small: Collaborative Research: The Visual Computing Database: APlatform for Visual Data Processing and Analysis at Internet Scale
sinc(x) =sin(⇡x))
⇡x
(f ⇤ g)(x) =Z 1
�1f(y)g(x� y)dy
f(x) =
⇢1 |x| 0.50 otherwise
(f ⇤ g)(x) =Z 0.5
�0.5g(x� y)dy
Z 1
�1�(x)dx = 1
x 6= 0, �(x) = 0
Z 1
�1f(x)�(x)dx = f(0)
XT (x) = T1X
i=�1�(x� iT )
XT (x)f(x) = T1X
i=�1f(iT )�(x� iT )
g(x) = XT (x)f(x) = T1X
i=�1f(iT )�(x� iT )
frecon(x) = (h ⇤ g)(x) = T
Z 1
�1h(y)
1X
i=�1f(iT )�(x� y � iT )dy =
Z T/2
�T/2
1X
i=�1f(iT )�(x� y � iT )
h(x) =
⇢1/T |x| T/20 otherwise
h(x) =
⇢(1� |x|
T )/T |x| T0 otherwise

CMU 15-462/662
▪ Our signals are not always band-limited in computer graphics. Why?
Challenges of sampling-based approaches in graphics
Hint:
▪ Also, infinite extent of “ideal” reconstruction filter (sinc) is impractical for efficient implementations. Why?
CMU 15-462/662
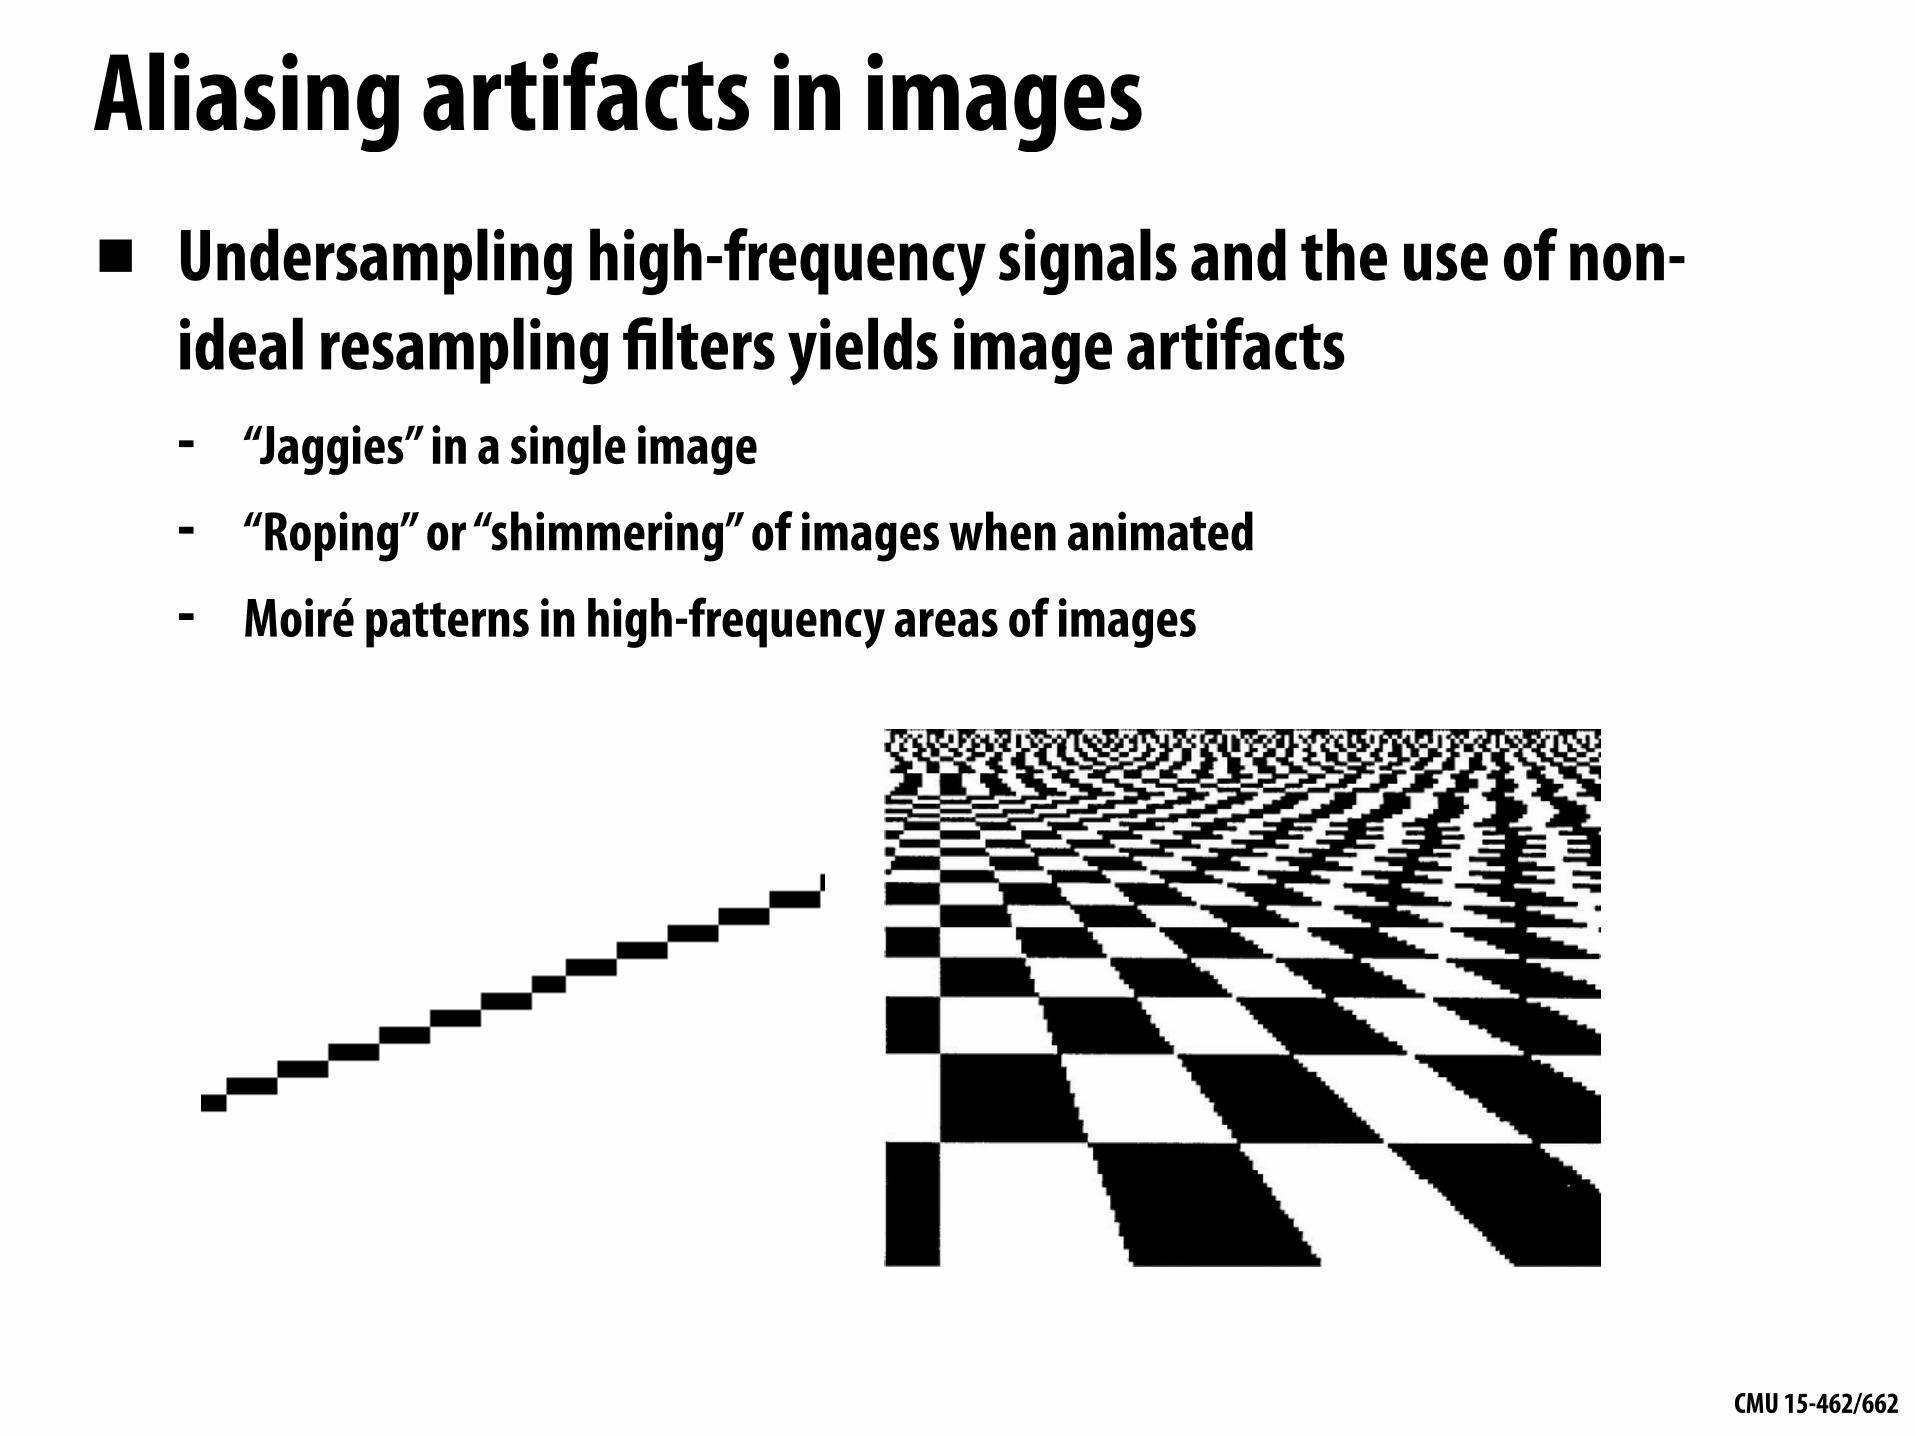
Aliasing artifacts in images▪ Undersampling high-frequency signals and the use of non-
ideal resampling filters yields image artifacts - “Jaggies” in a single image
- “Roping” or “shimmering” of images when animated
- Moiré patterns in high-frequency areas of images

CMU 15-462/662
Sampling a zone plate: sin(x2 + y2)
(0,0)
Rings in center-left: Actual signal (low frequency oscillation)
Rings on right: aliasing from undersampling high frequency oscillation and then resampling back to Keynote slide resolution
Middle: (interaction between actual signal and aliased resconstruction)
Figure credit: Pat Hanrahan and Bryce Summers
CMU 15-462/662
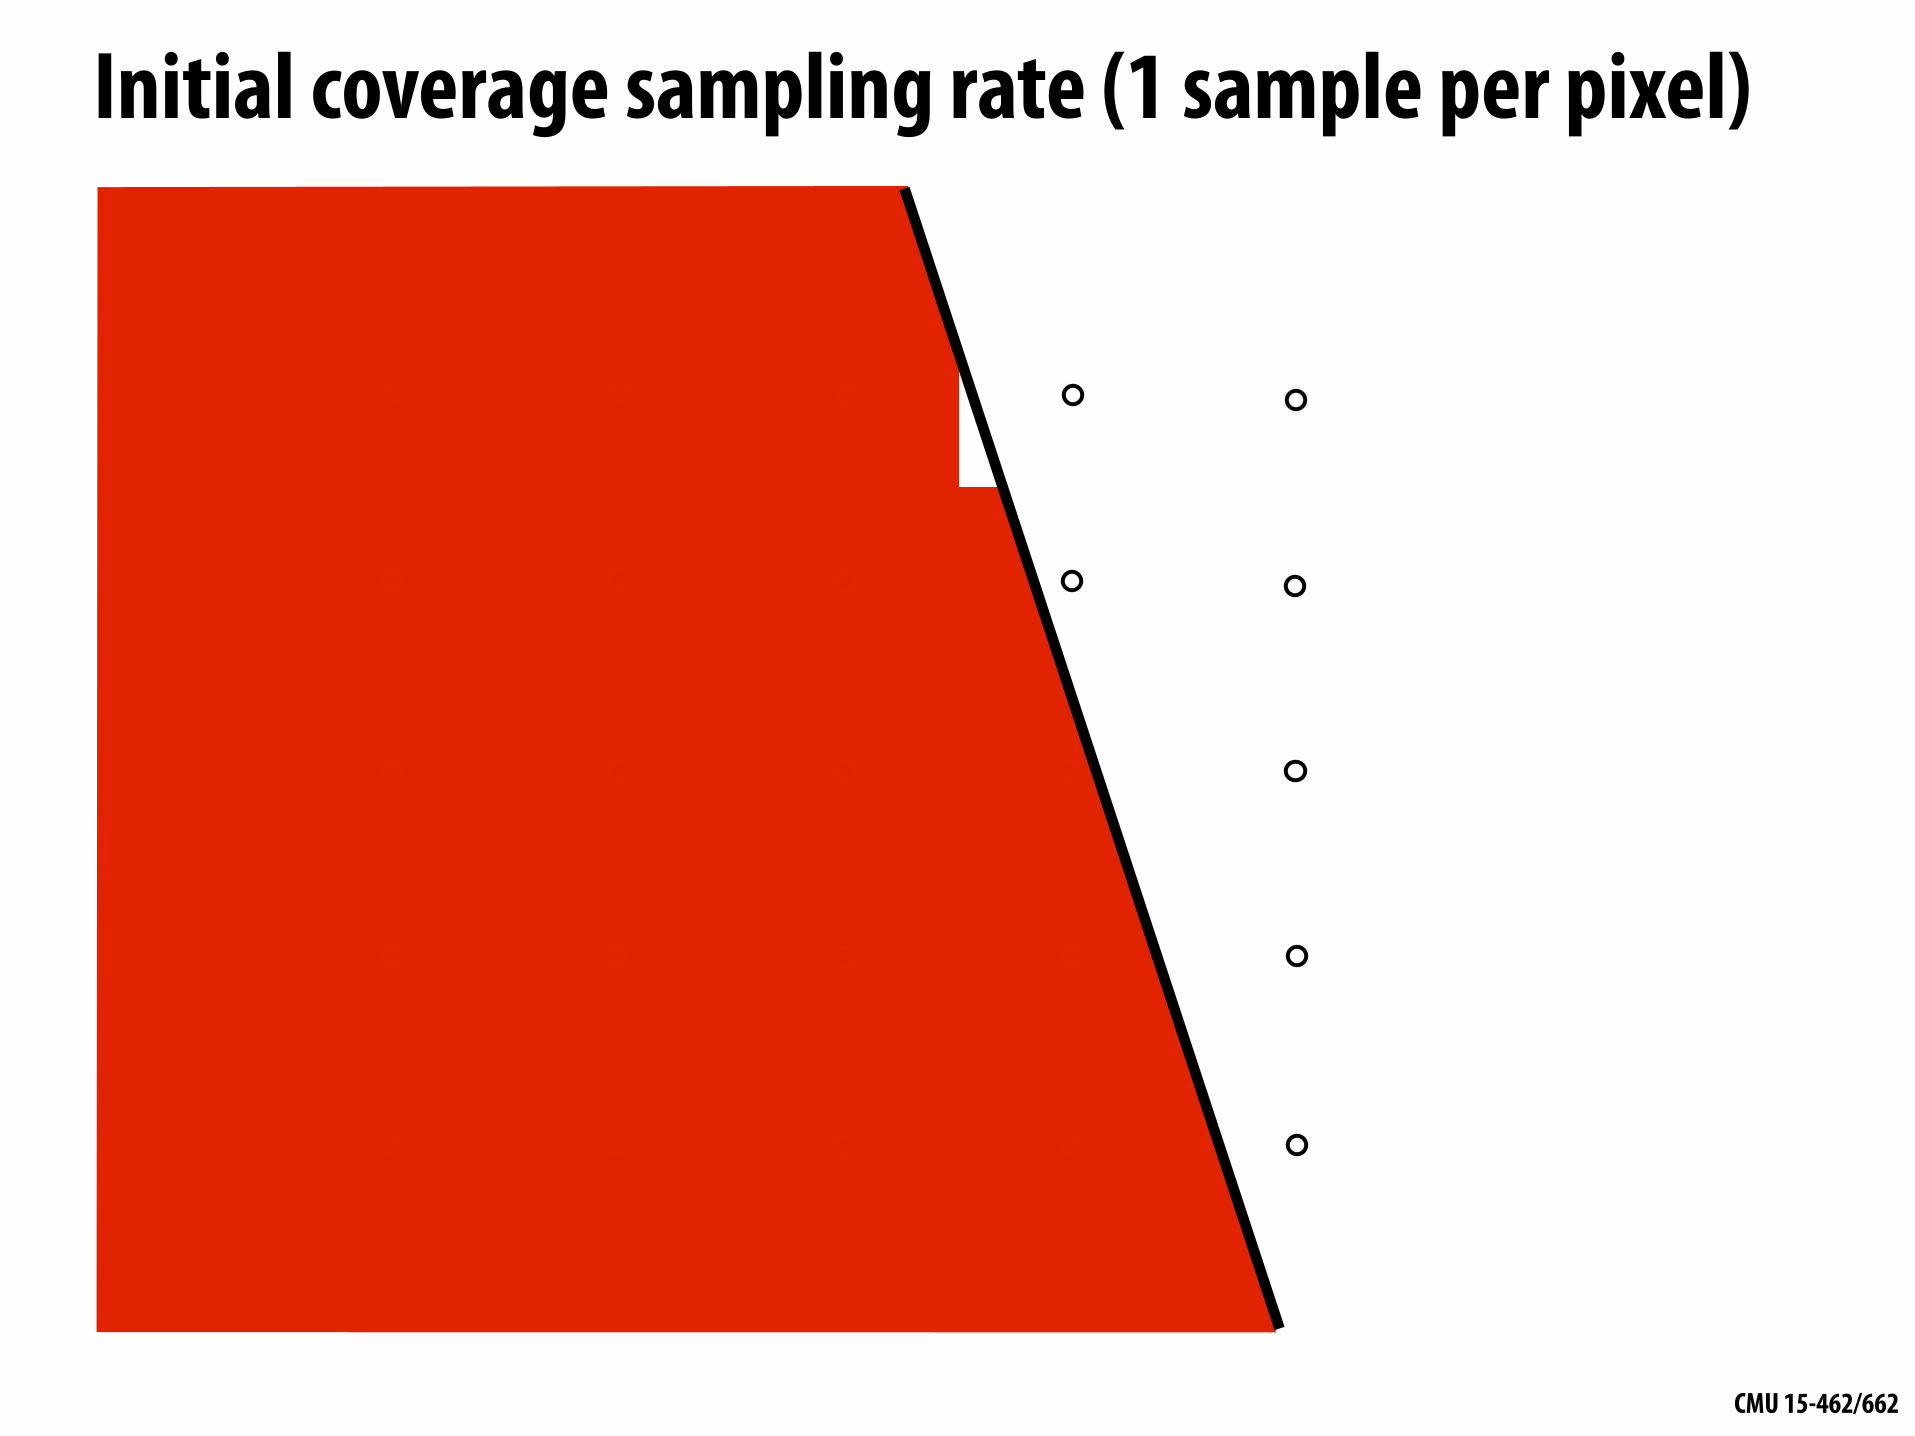
Initial coverage sampling rate (1 sample per pixel)
CMU 15-462/662
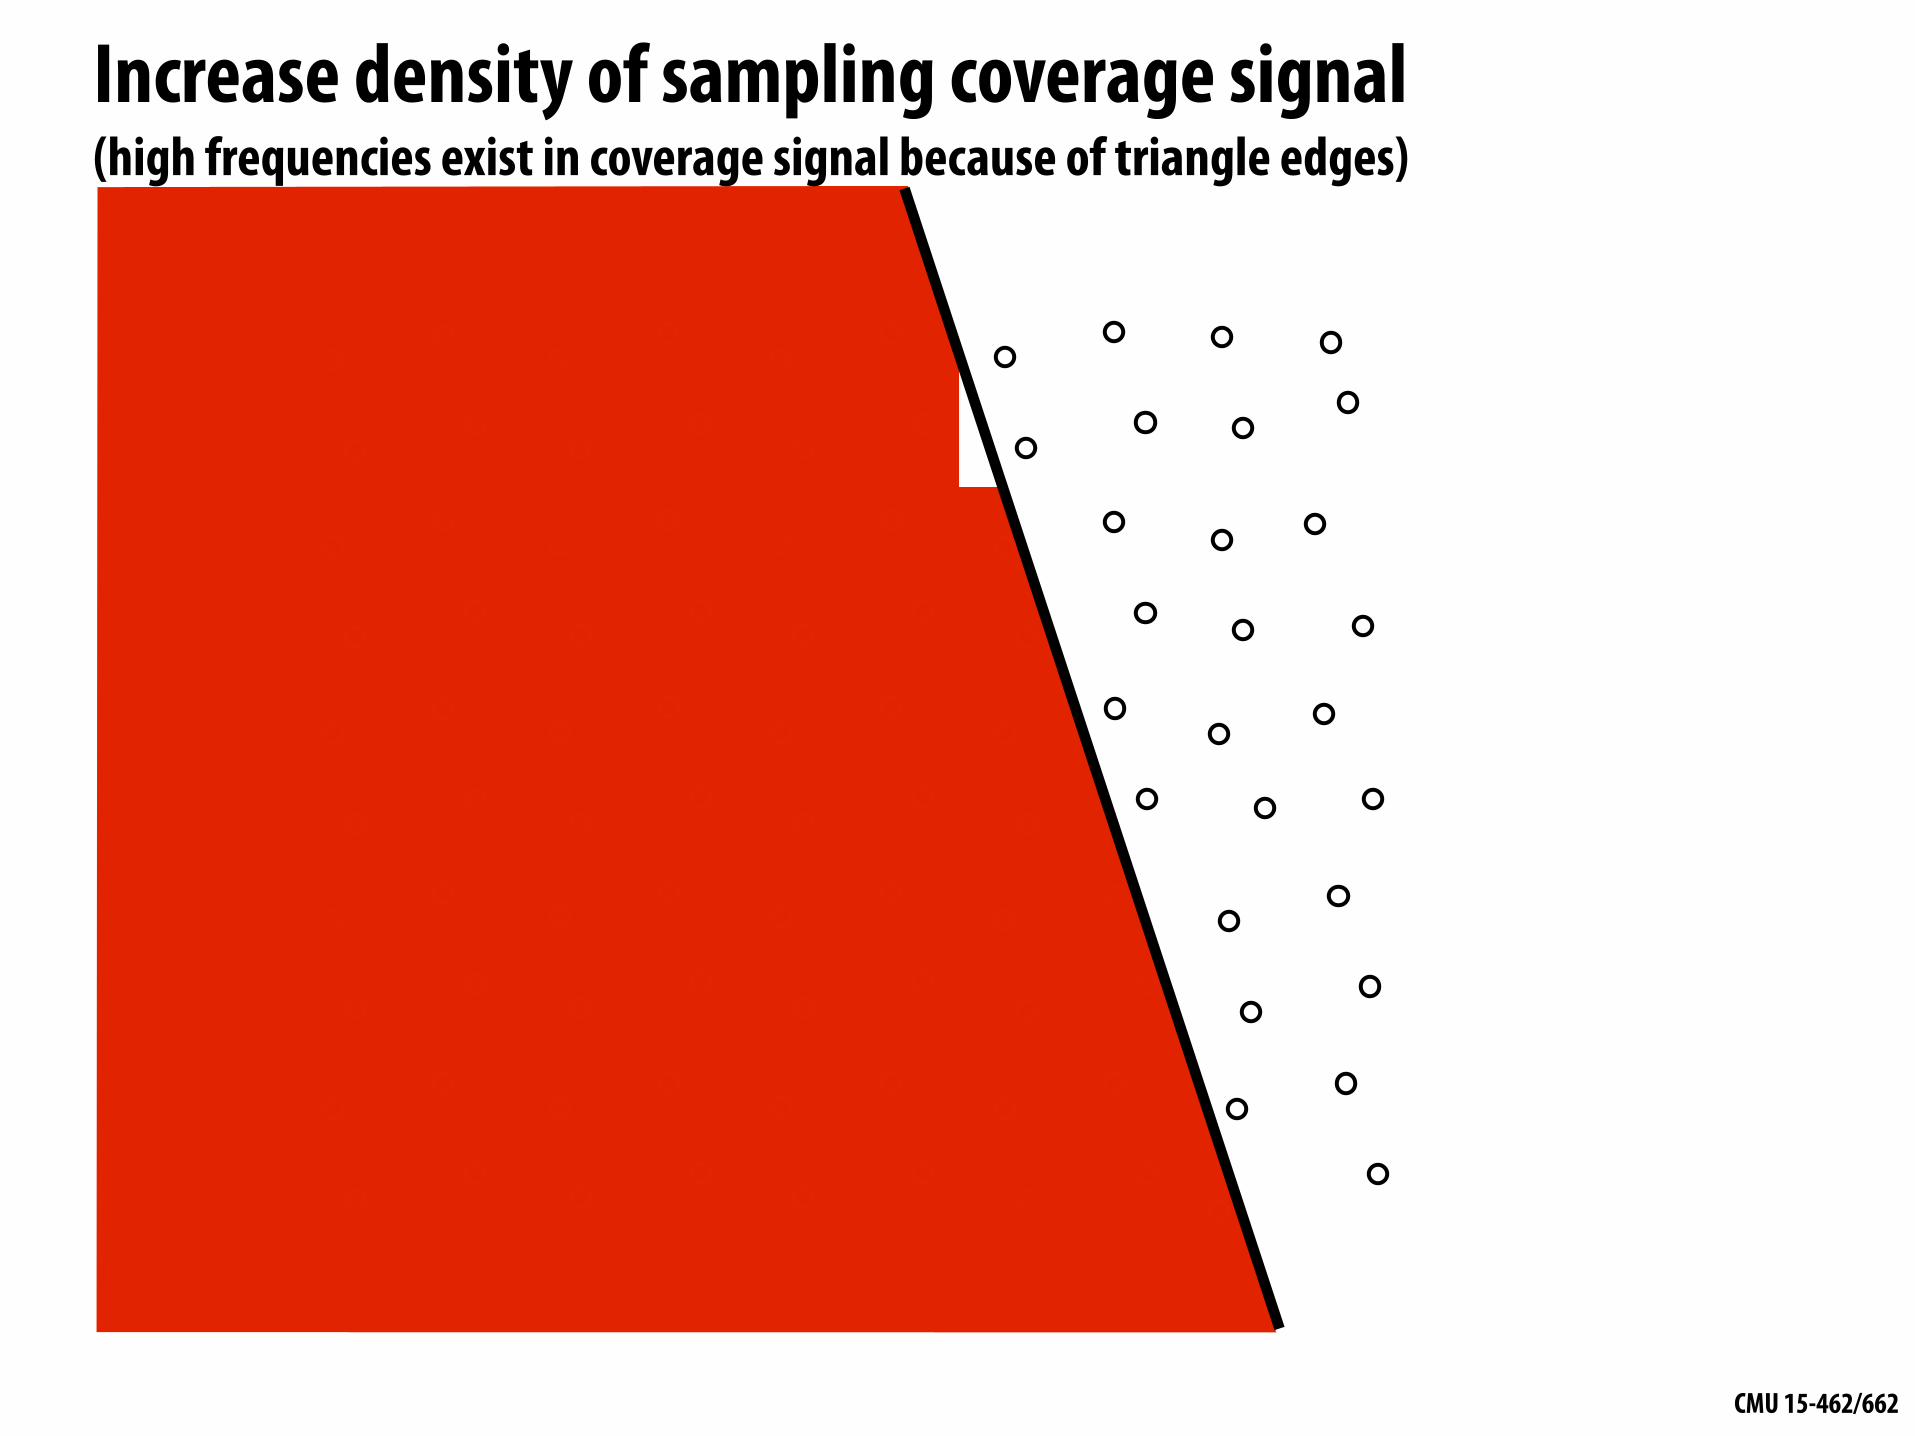
Increase density of sampling coverage signal (high frequencies exist in coverage signal because of triangle edges)

CMU 15-462/662
Supersampling Example: stratified sampling using four samples per pixel

CMU 15-462/662
Resampling
Coarsely sampled signalReconstructed signal (lacks high frequencies)
Dense sampling of reconstructed signal
Converting from one discrete sampled representation to another
Original signal (high frequency edge)

CMU 15-462/662
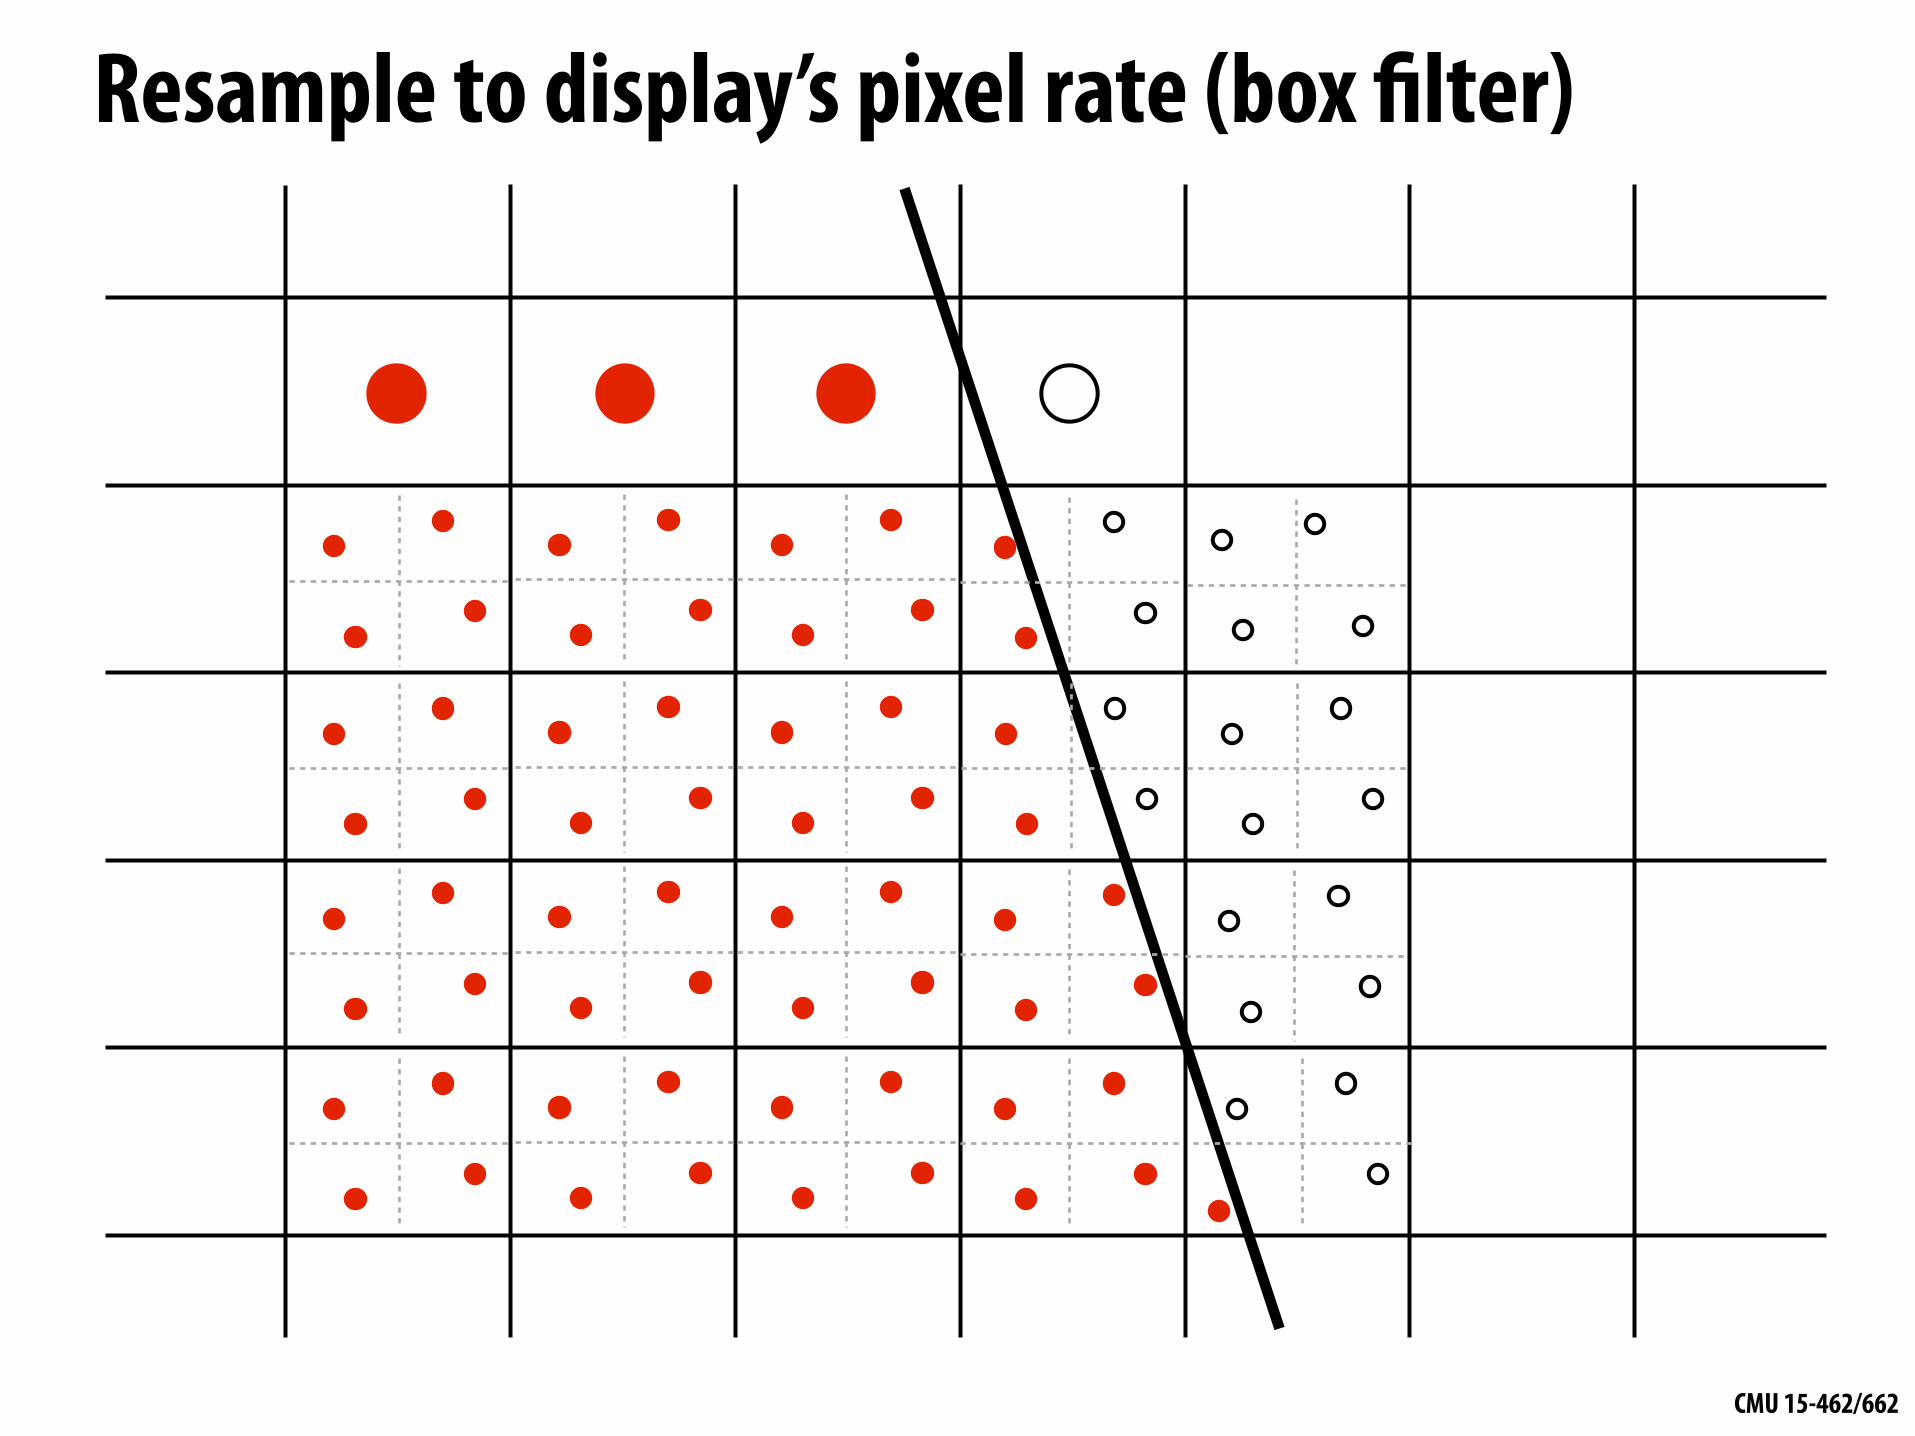
Resample to display’s pixel resolution (Because a screen displays one sample value per screen pixel...)
CMU 15-462/662
Resample to display’s pixel rate (box filter)
CMU 15-462/662
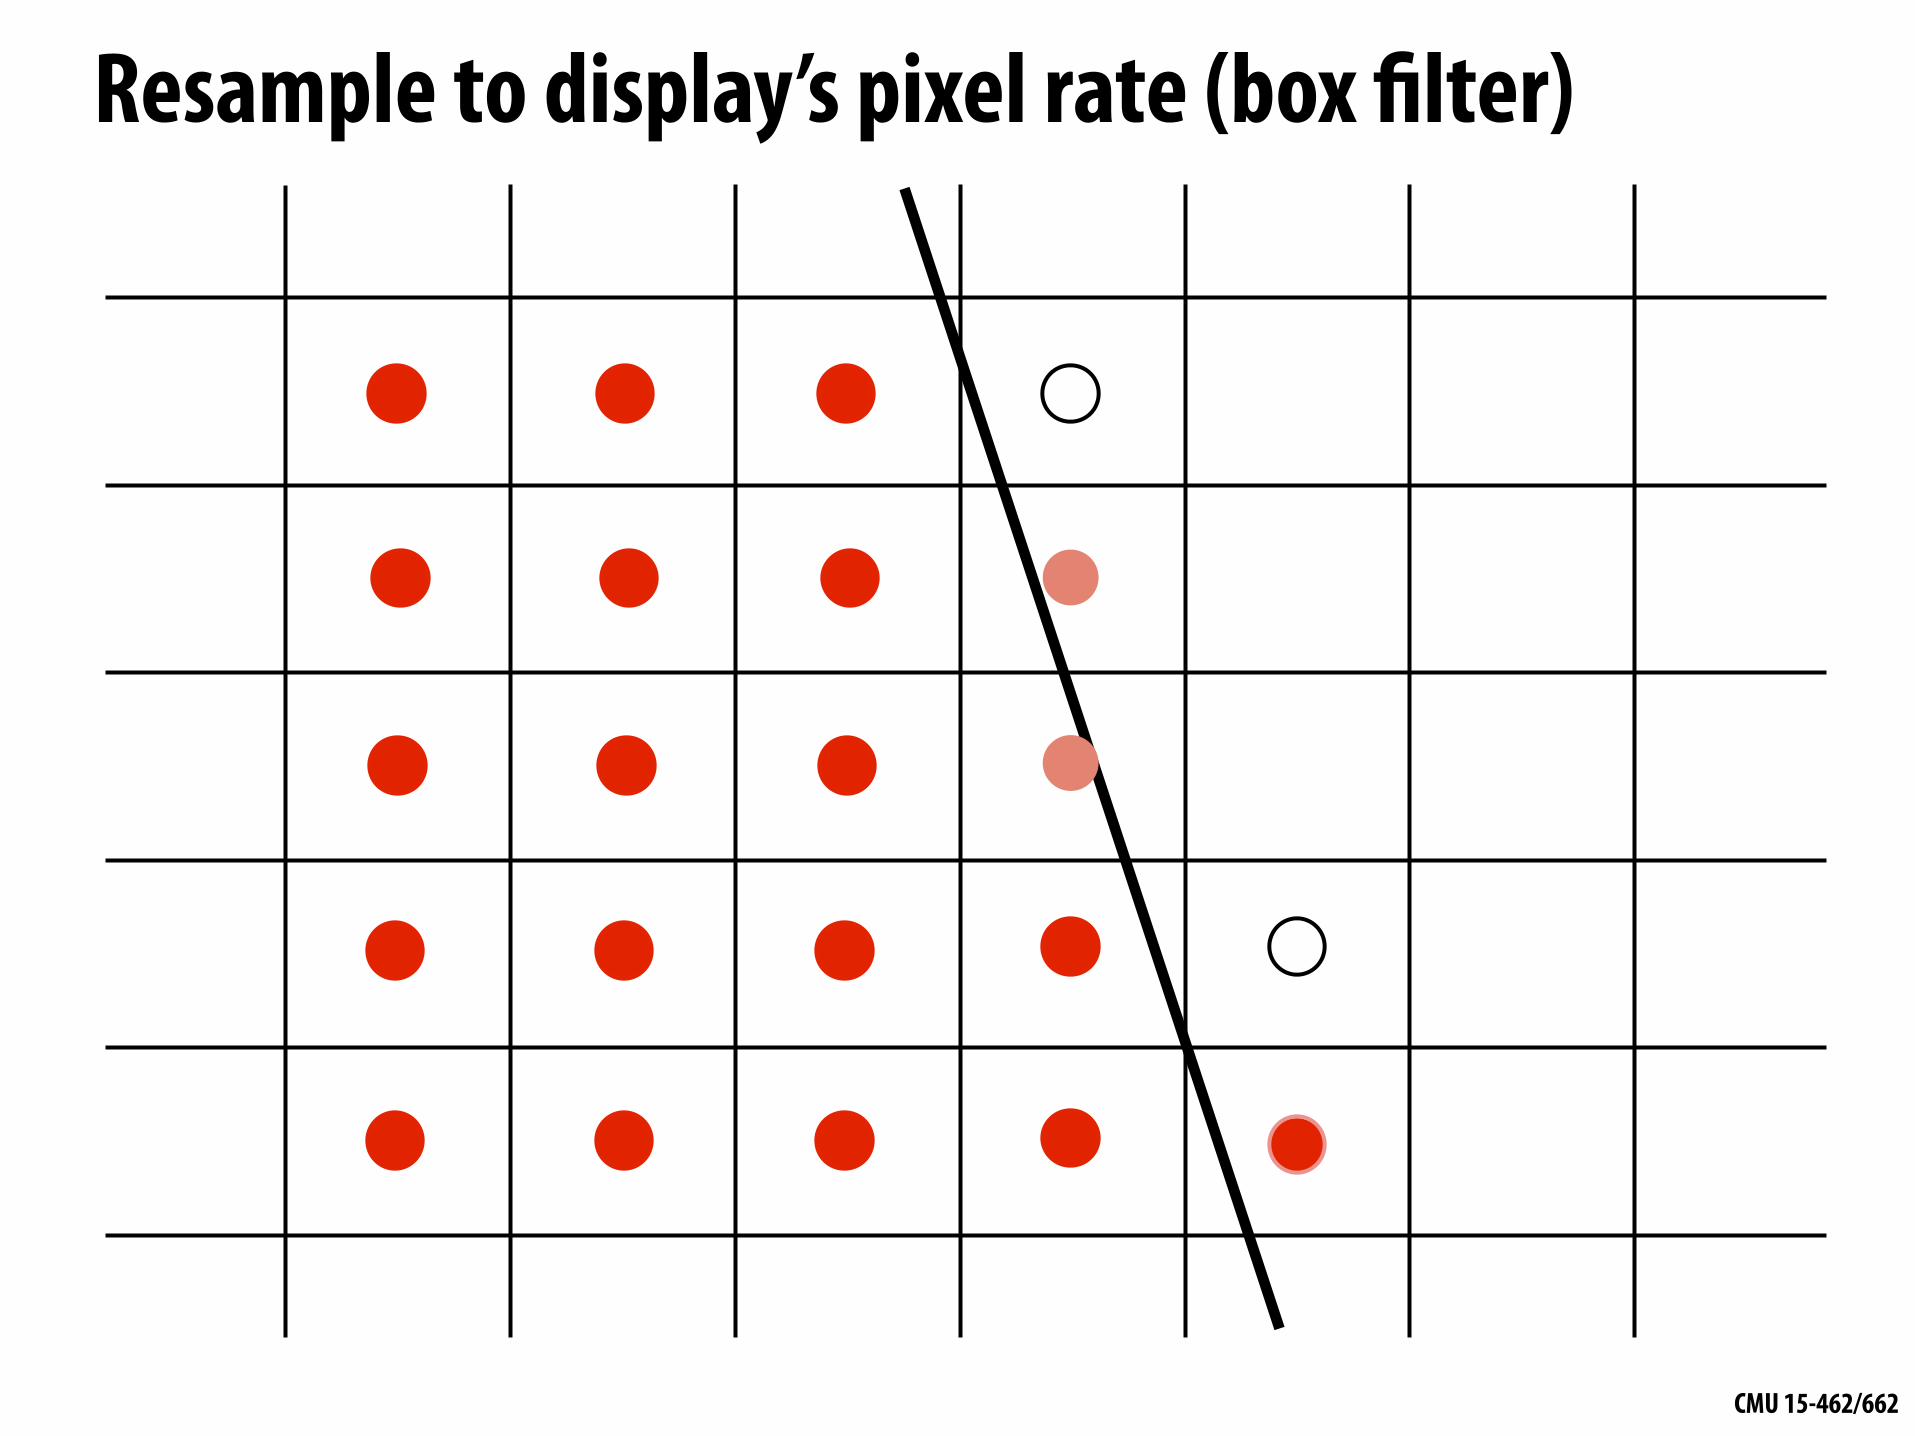
Resample to display’s pixel rate (box filter)
CMU 15-462/662
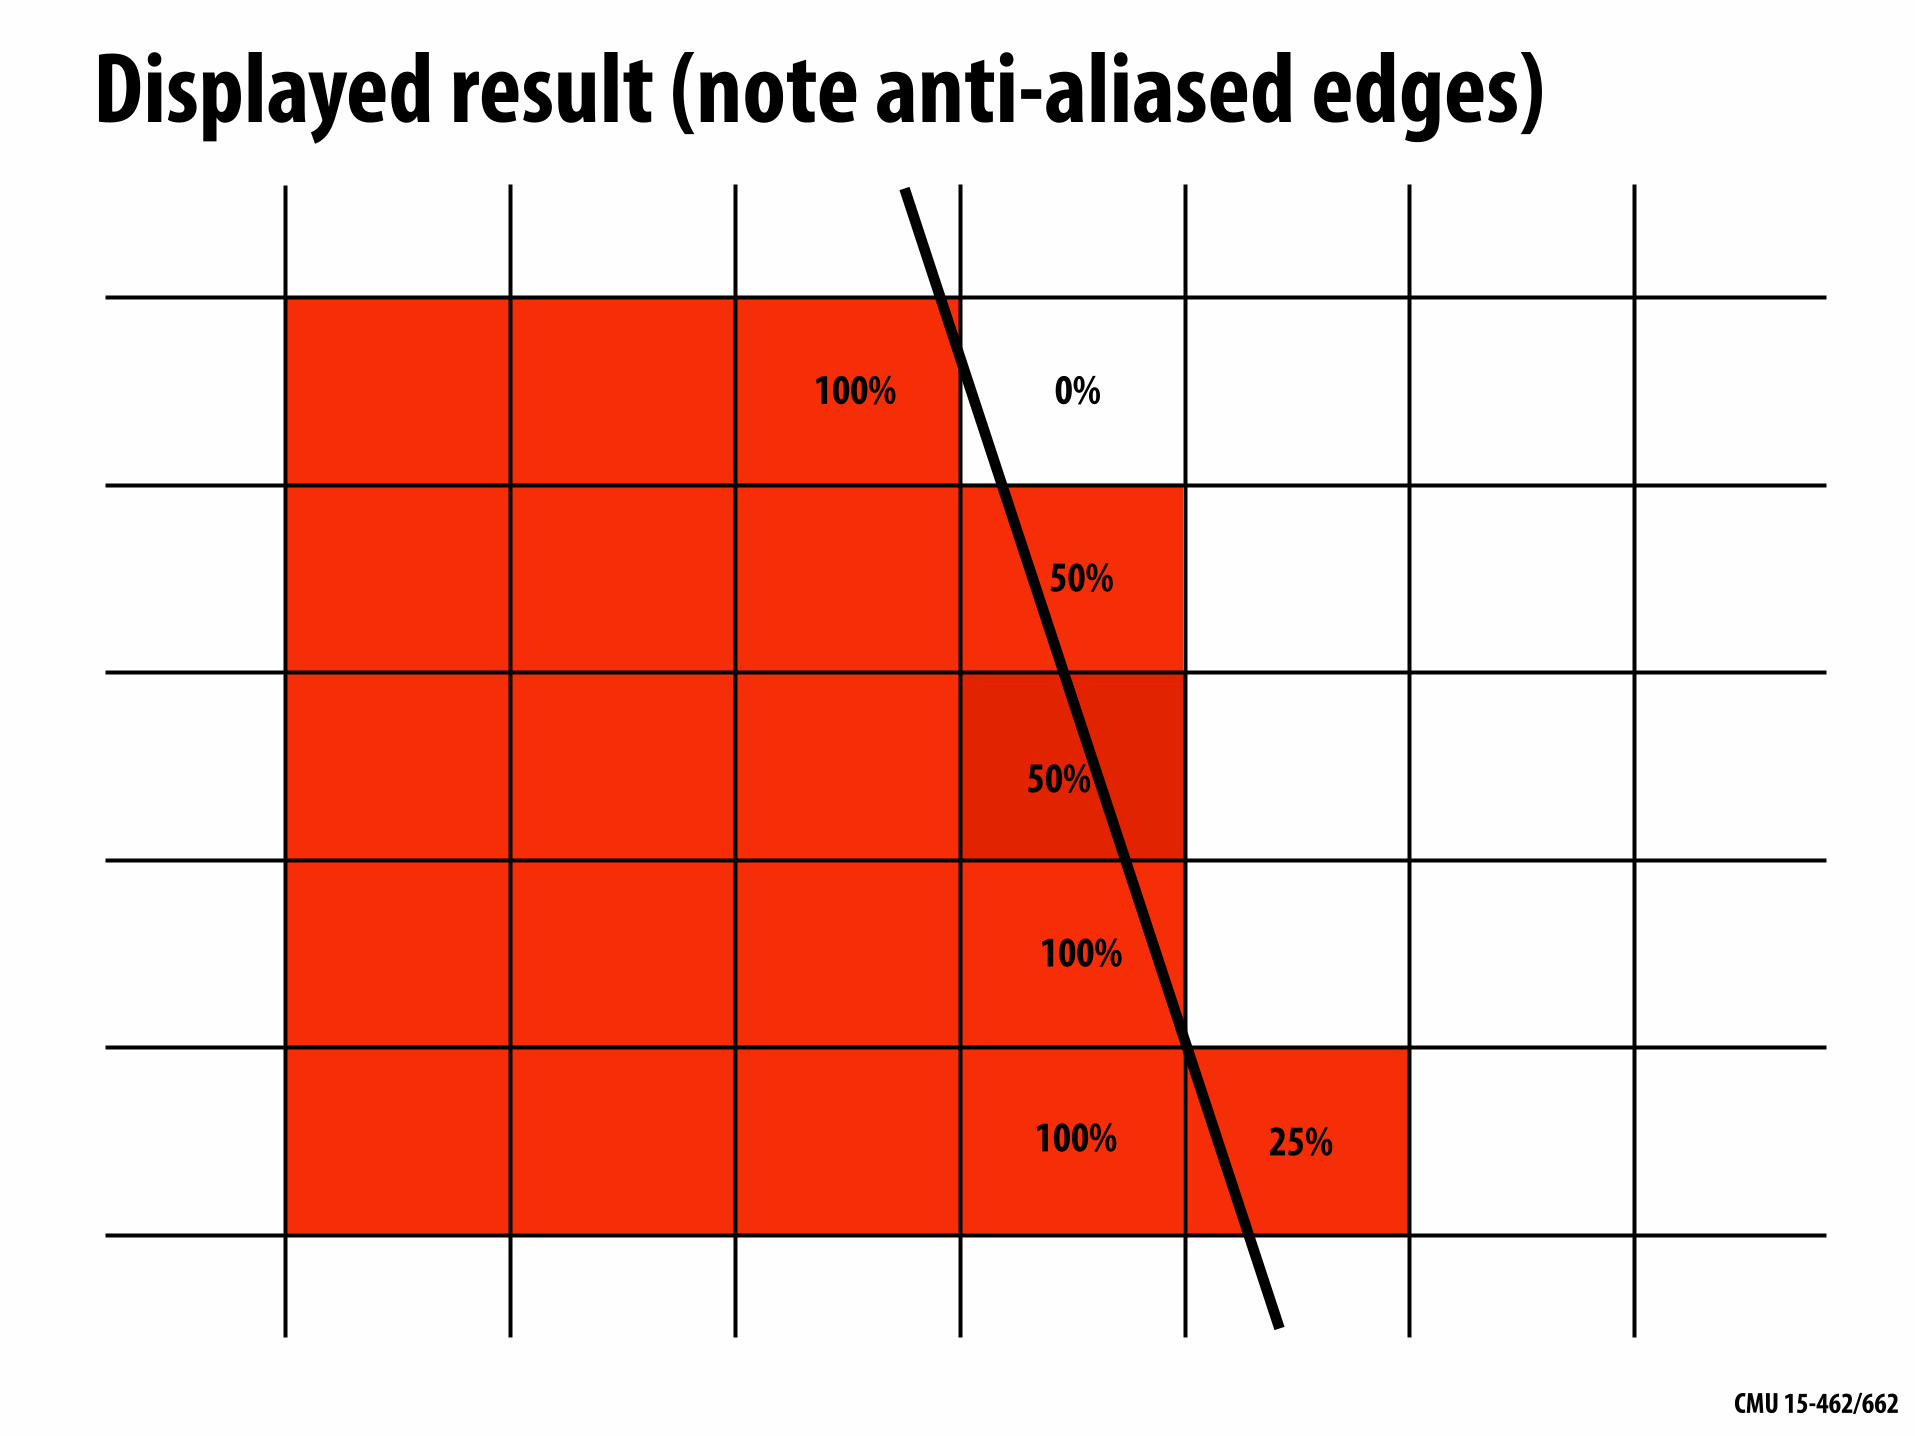
Displayed result (note anti-aliased edges)
100% 0%
50%
50%
100%
25%100%
CMU 15-462/662
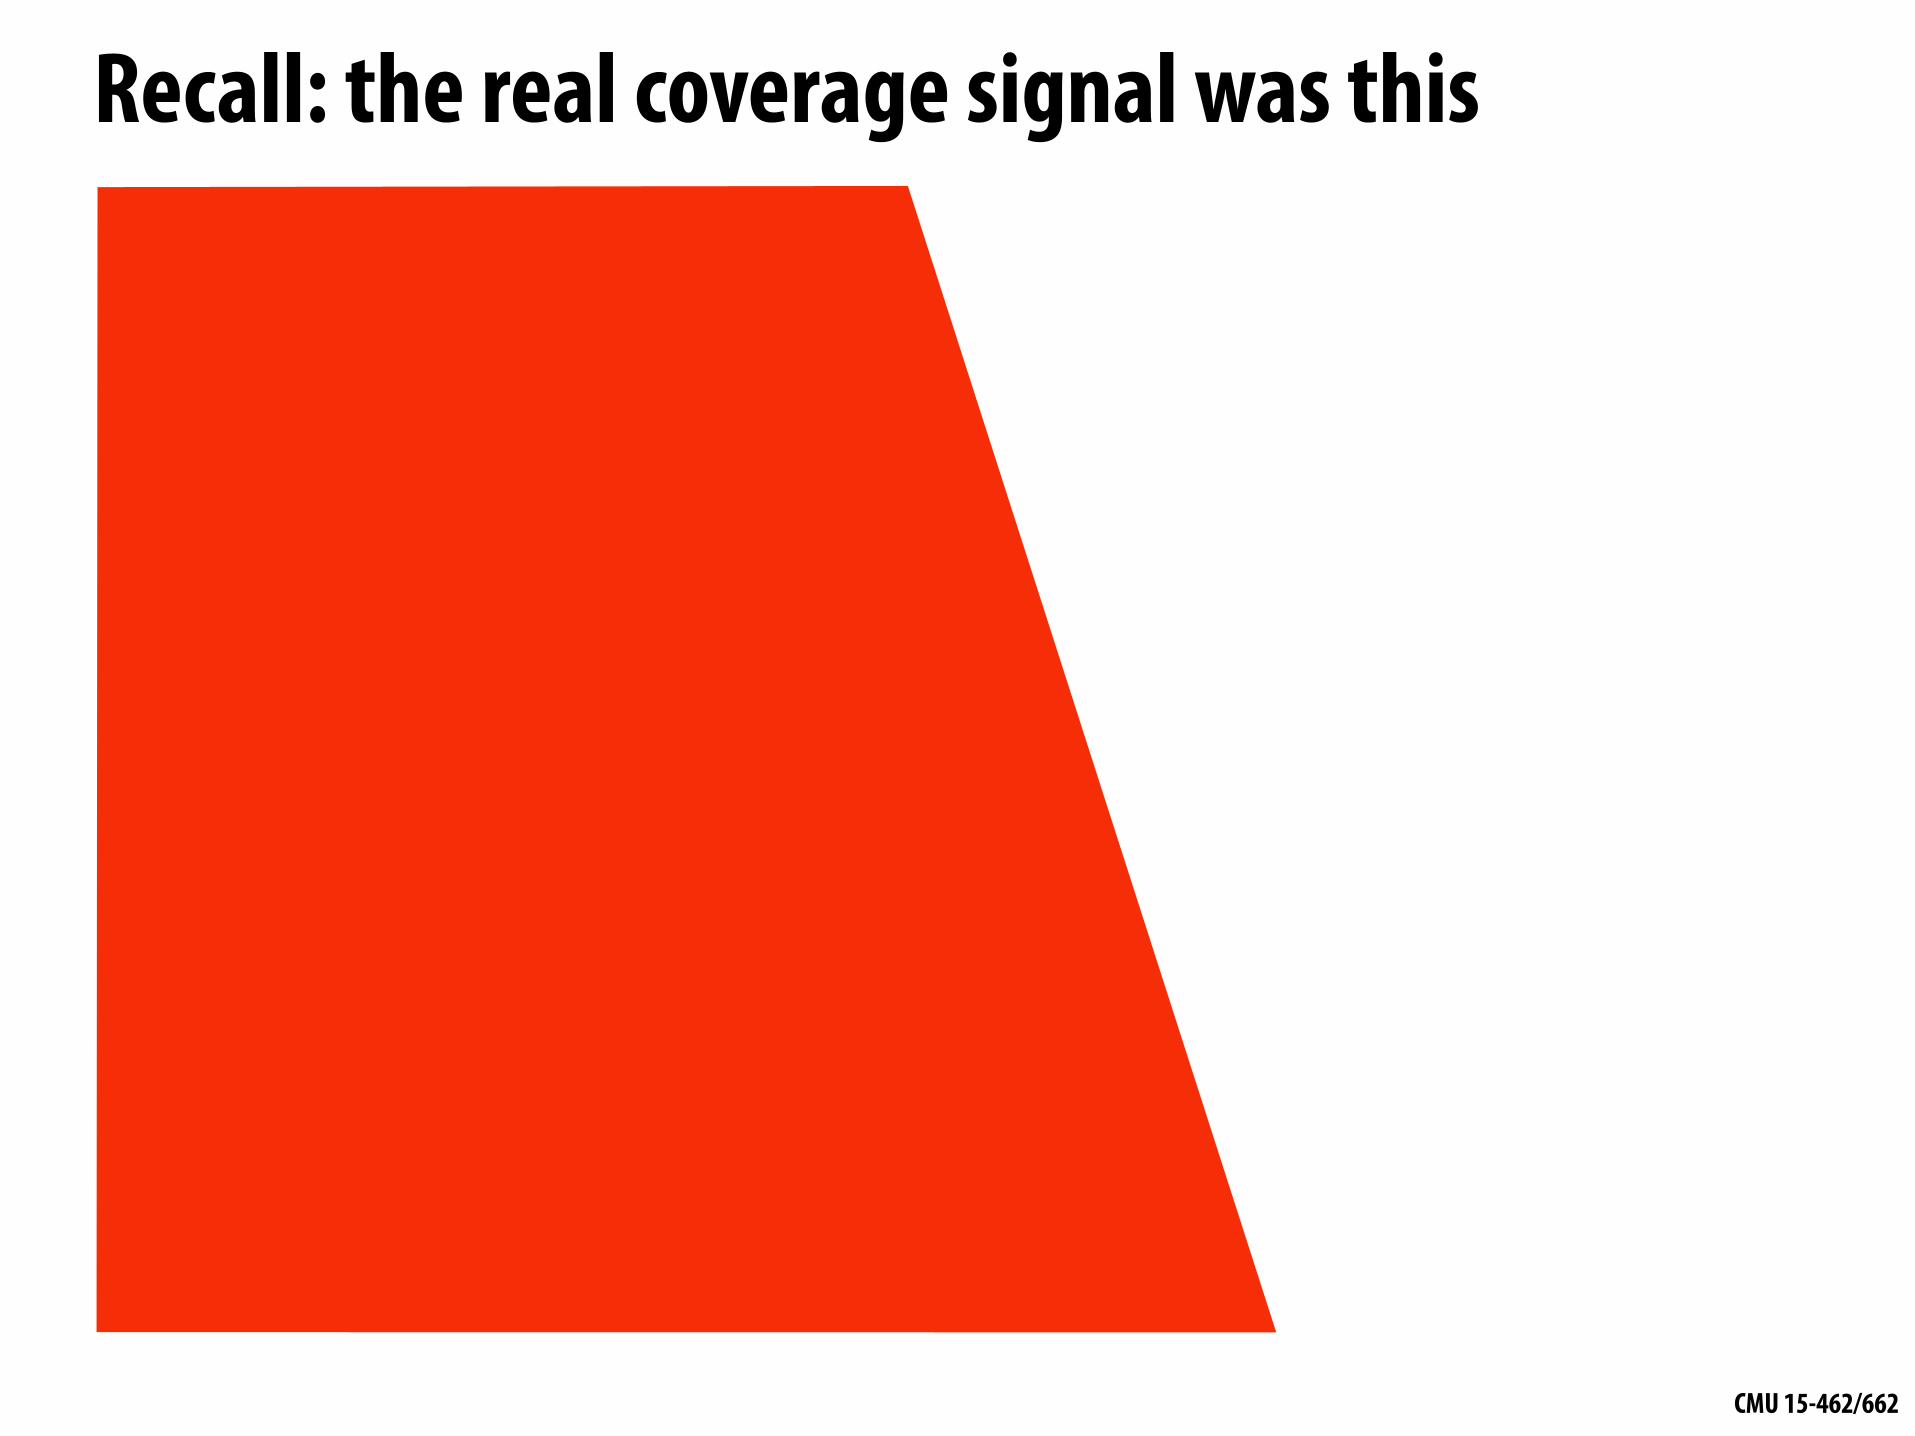
Recall: the real coverage signal was this
CMU 15-462/662
Sampling coverage▪ We want the light emitted from a display to be an accurate to
match the ground truth signal: coverage(x,y))
▪ Resampling a densely sampled signal (supersampled) integrates coverage values over the entire pixel region. The integrated result is sent to the display (and emitted by the pixel) so that the light emitted by the pixel is similar to what would be emitted in that screen region by an “infinite resolution display”
CMU 15-462/662
How do we actually evaluate coverage(x,y) for a triangle?
CMU 15-462/662
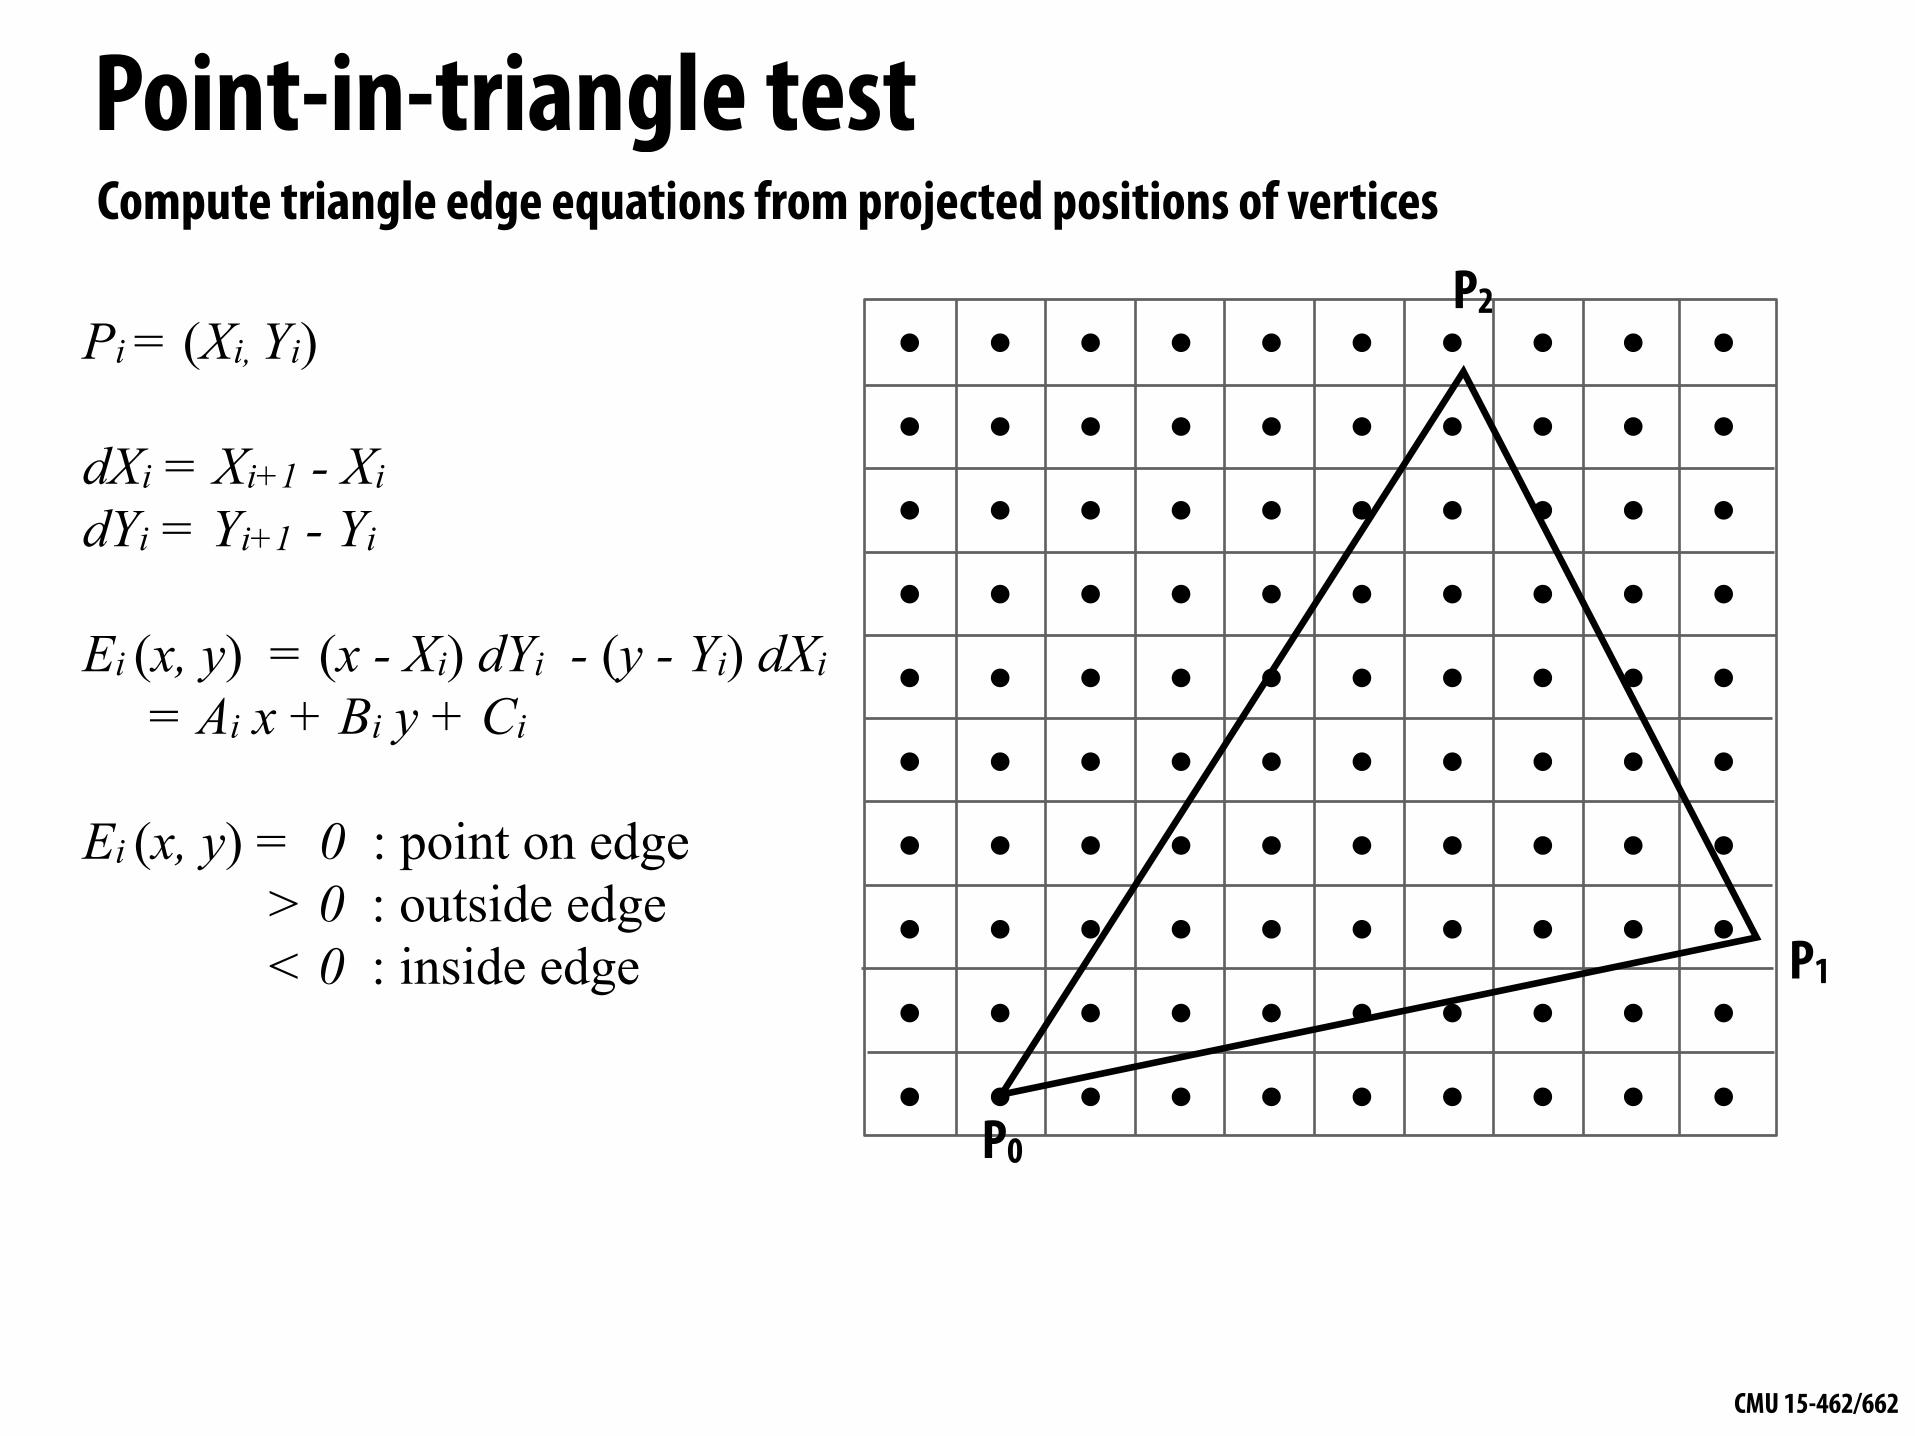
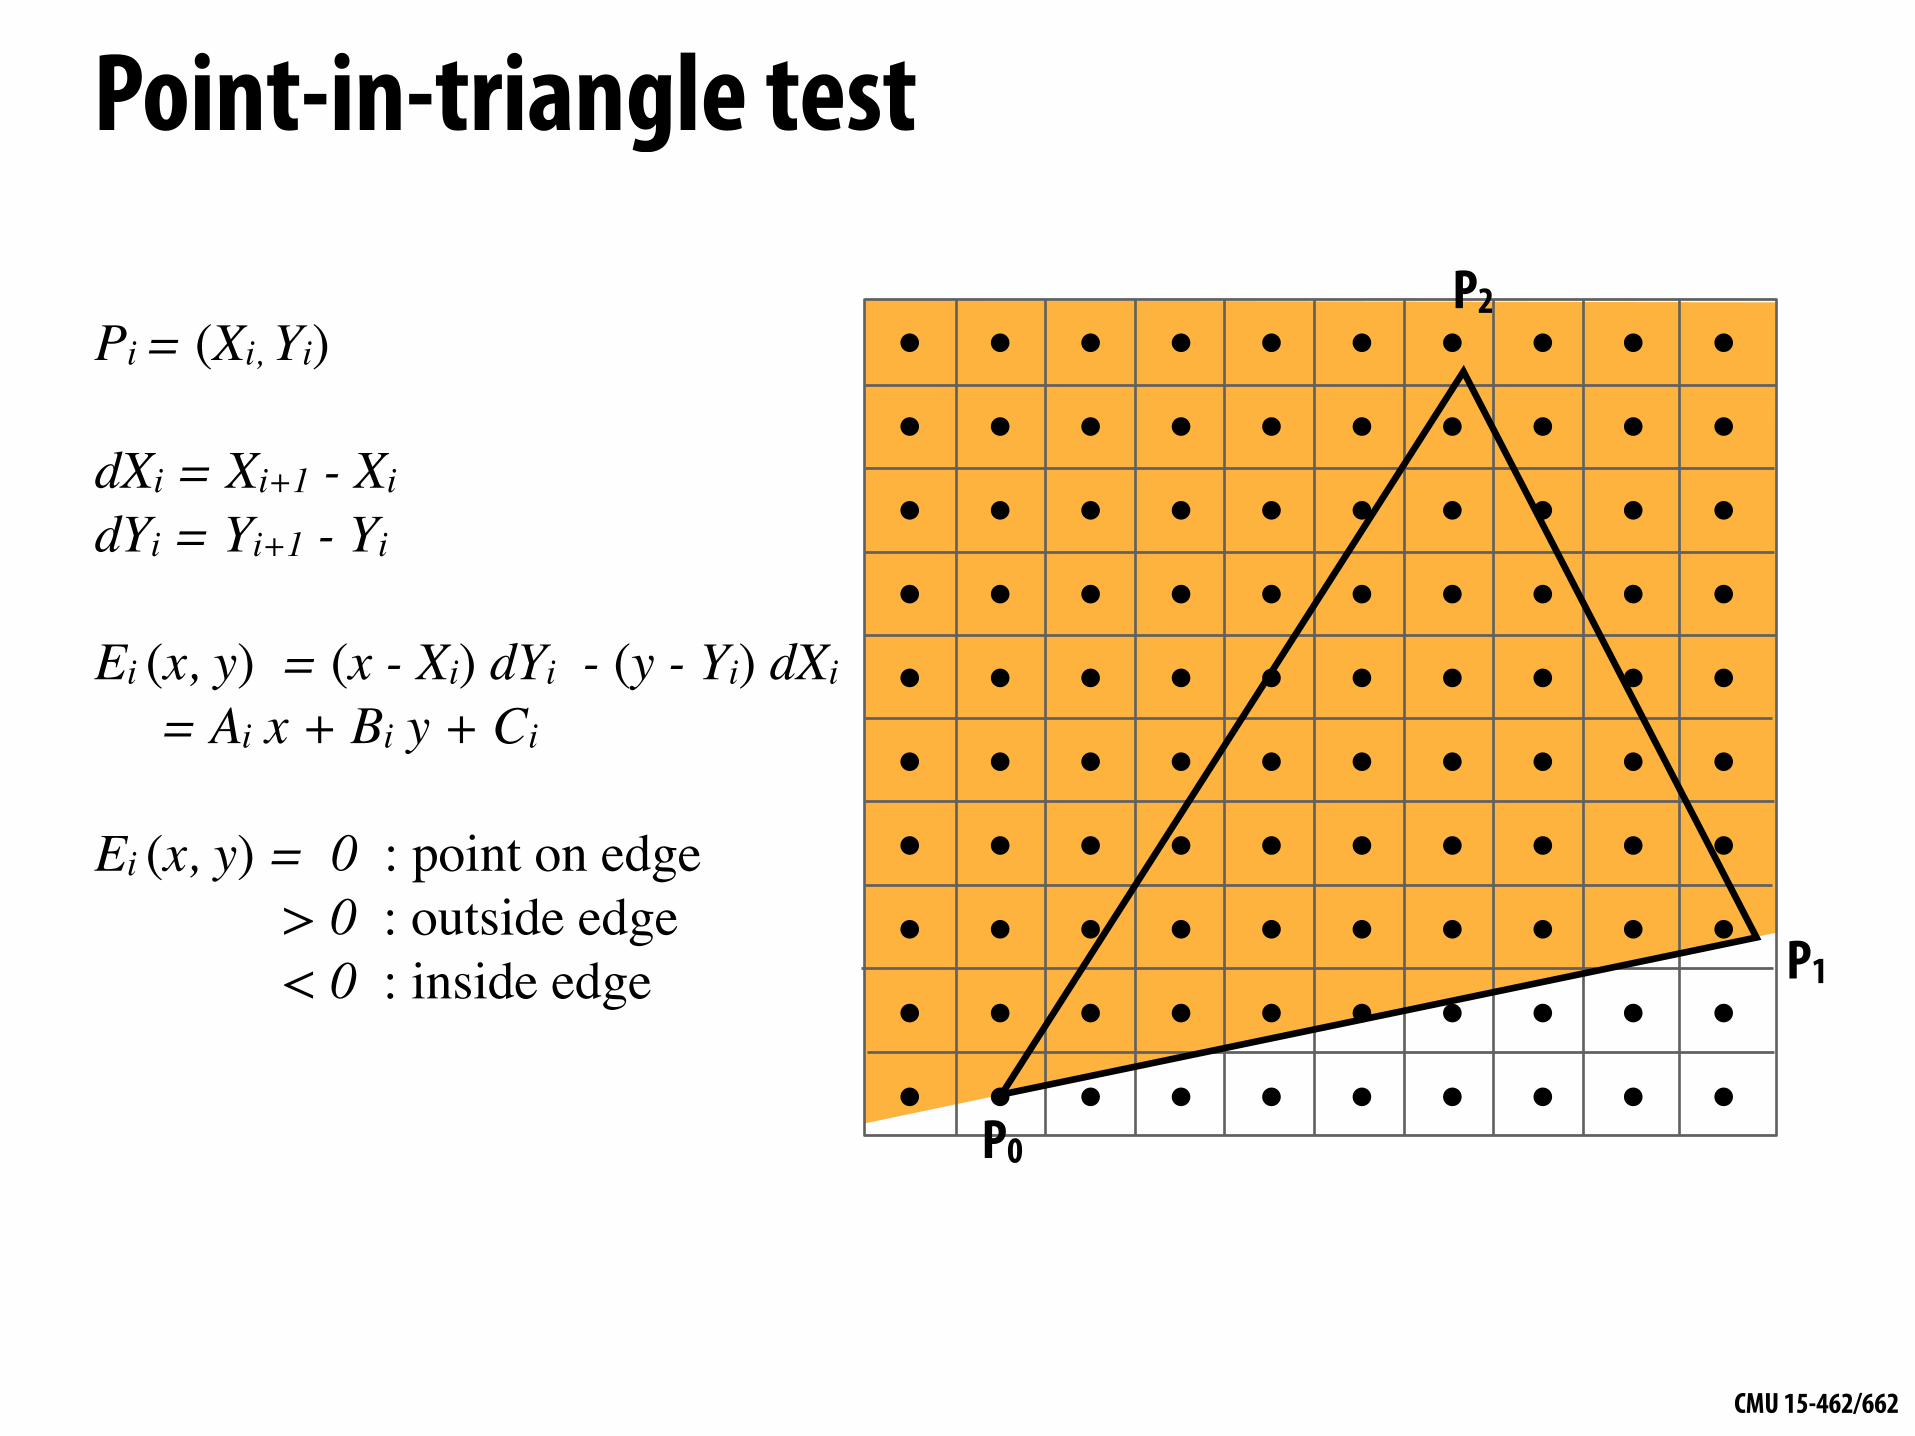
Point-in-triangle test
P0
P1
P2Pi = (Xi, Yi)
dXi = Xi+1 - Xi dYi = Yi+1 - Yi
Ei (x, y) = (x - Xi) dYi - (y - Yi) dXi = Ai x + Bi y + Ci
Ei (x, y) = 0 : point on edge > 0 : outside edge < 0 : inside edge
Compute triangle edge equations from projected positions of vertices
CMU 15-462/662
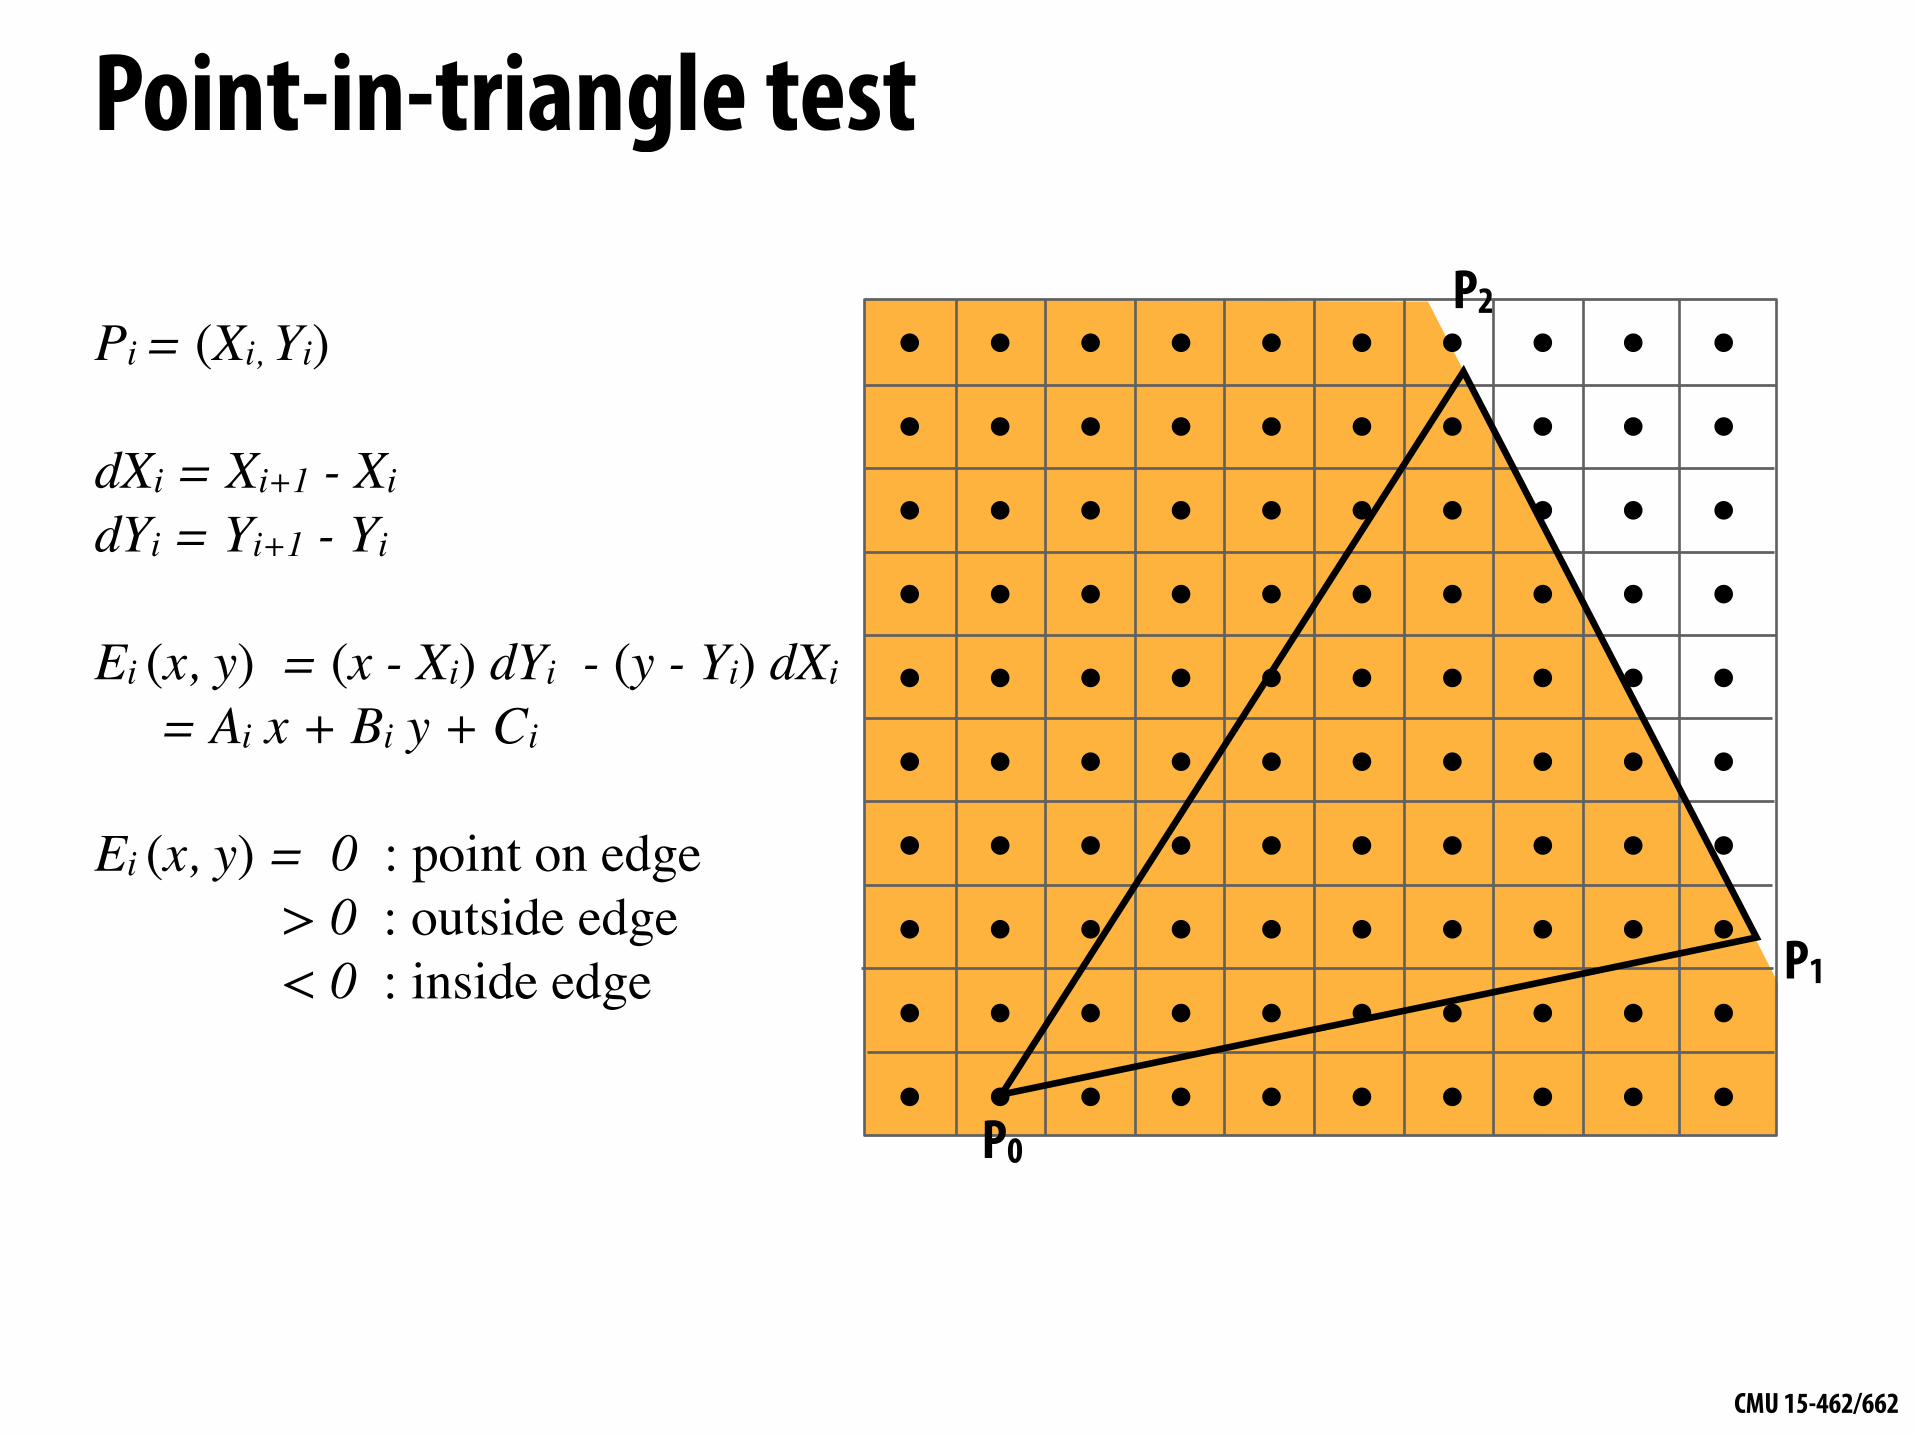
Point-in-triangle test
P0
P1
P2Pi = (Xi, Yi)
dXi = Xi+1 - Xi
dYi = Yi+1 - Yi
Ei (x, y) = (x - Xi) dYi - (y - Yi) dXi
= Ai x + Bi y + Ci
Ei (x, y) = 0 : point on edge > 0 : outside edge < 0 : inside edge
CMU 15-462/662
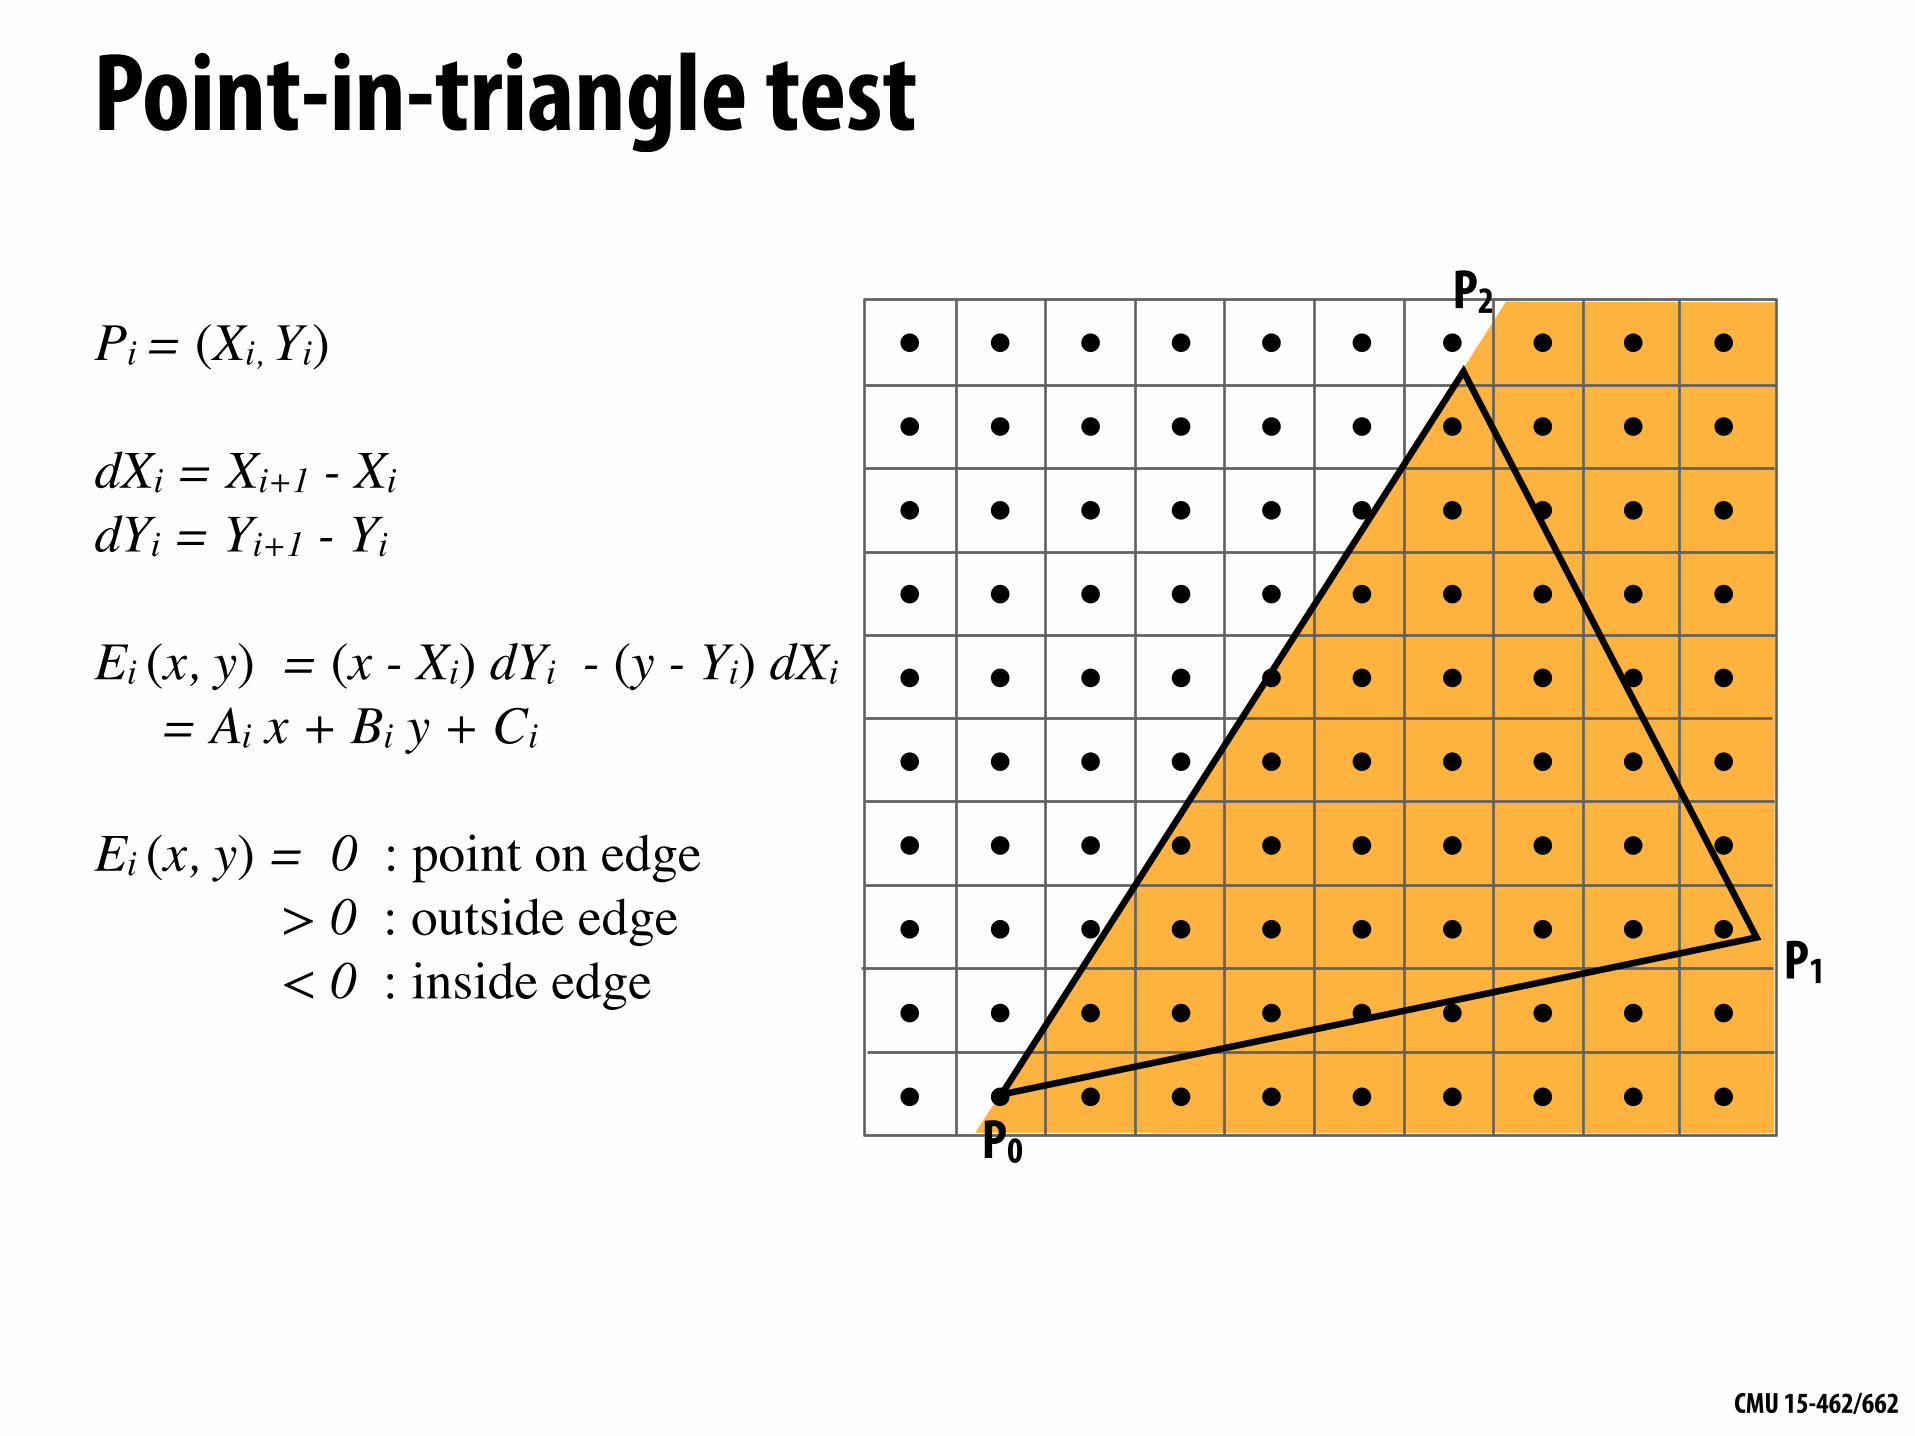
Point-in-triangle test
P0
P1
P2Pi = (Xi, Yi)
dXi = Xi+1 - Xi
dYi = Yi+1 - Yi
Ei (x, y) = (x - Xi) dYi - (y - Yi) dXi
= Ai x + Bi y + Ci
Ei (x, y) = 0 : point on edge > 0 : outside edge < 0 : inside edge
CMU 15-462/662
Point-in-triangle test
P0
P1
P2Pi = (Xi, Yi)
dXi = Xi+1 - Xi
dYi = Yi+1 - Yi
Ei (x, y) = (x - Xi) dYi - (y - Yi) dXi
= Ai x + Bi y + Ci
Ei (x, y) = 0 : point on edge > 0 : outside edge < 0 : inside edge

CMU 15-462/662
Point-in-triangle test
P0
P1
P2Sample point s = (sx, sy) is inside the triangle if it is inside all three edges.
inside(sx, sy) =E0 (sx, sy) < 0 &&E1 (sx, sy) < 0 &&E2 (sx, sy) < 0;
Note: actual implementation of inside(sx,sy) involves ≤ checks based on the triangle coverage edge rules (see beginning of lecture)
Sample points inside triangle are highlighted red.
CMU 15-462/662
Pi = (Xi, Yi)
dXi = Xi+1 - Xi
dYi = Yi+1 - Yi
Ei (x, y) = (x - Xi) dYi - (y - Yi) dXi
= Ai x + Bi y + Ci
Ei (x, y) = 0 : point on edge > 0 : outside edge < 0 : inside edge
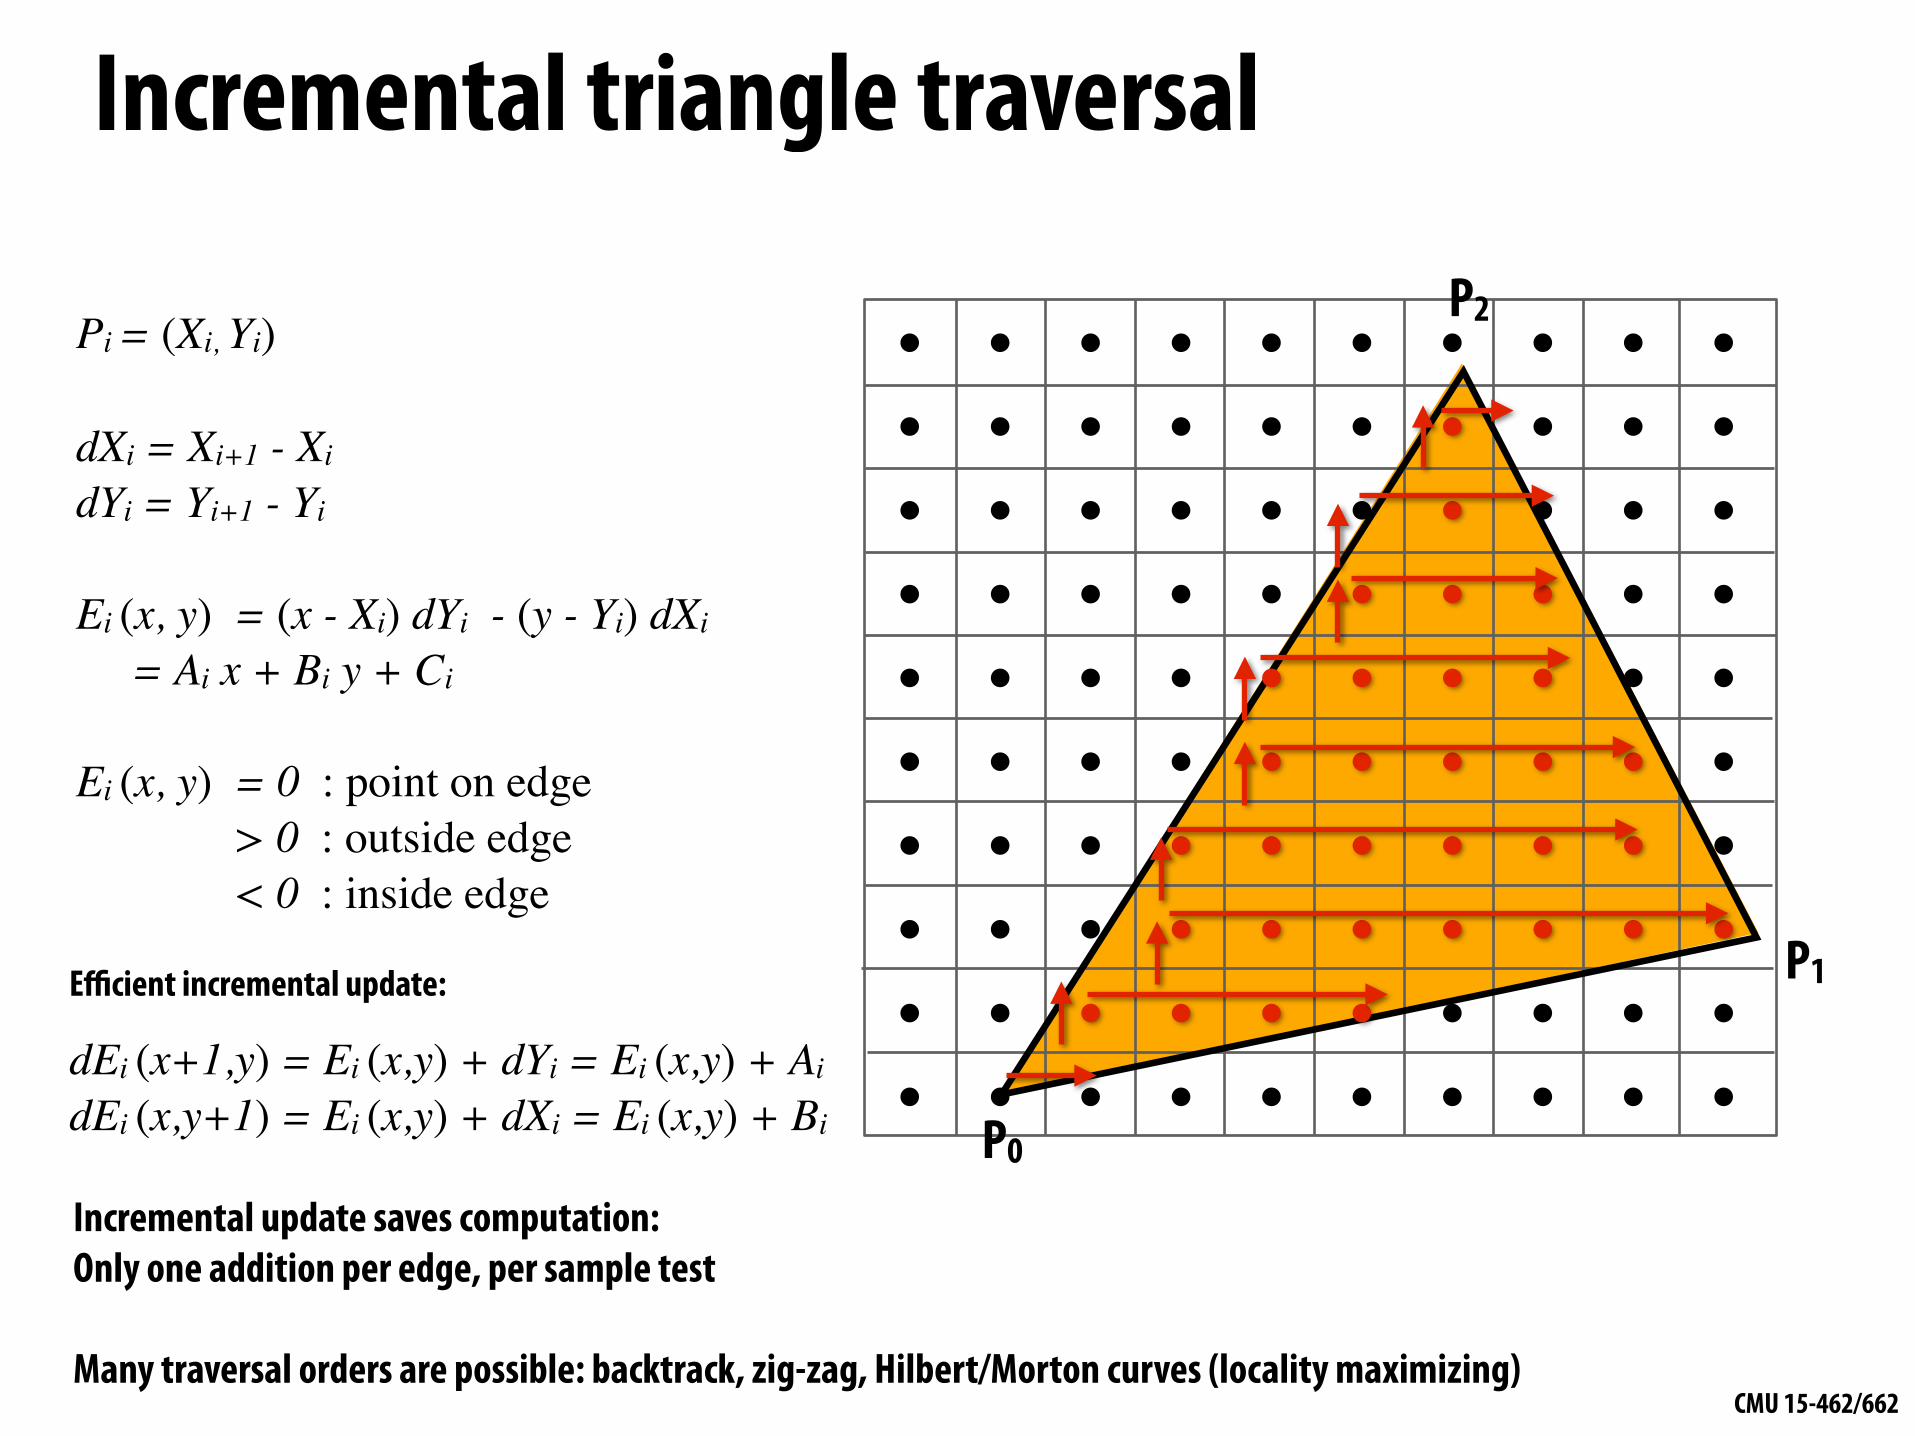
Incremental triangle traversal
P0
P1
P2
Efficient incremental update:
dEi (x+1,y) = Ei (x,y) + dYi = Ei (x,y) + Ai
dEi (x,y+1) = Ei (x,y) + dXi = Ei (x,y) + Bi
Incremental update saves computation: Only one addition per edge, per sample test
Many traversal orders are possible: backtrack, zig-zag, Hilbert/Morton curves (locality maximizing)
CMU 15-462/662
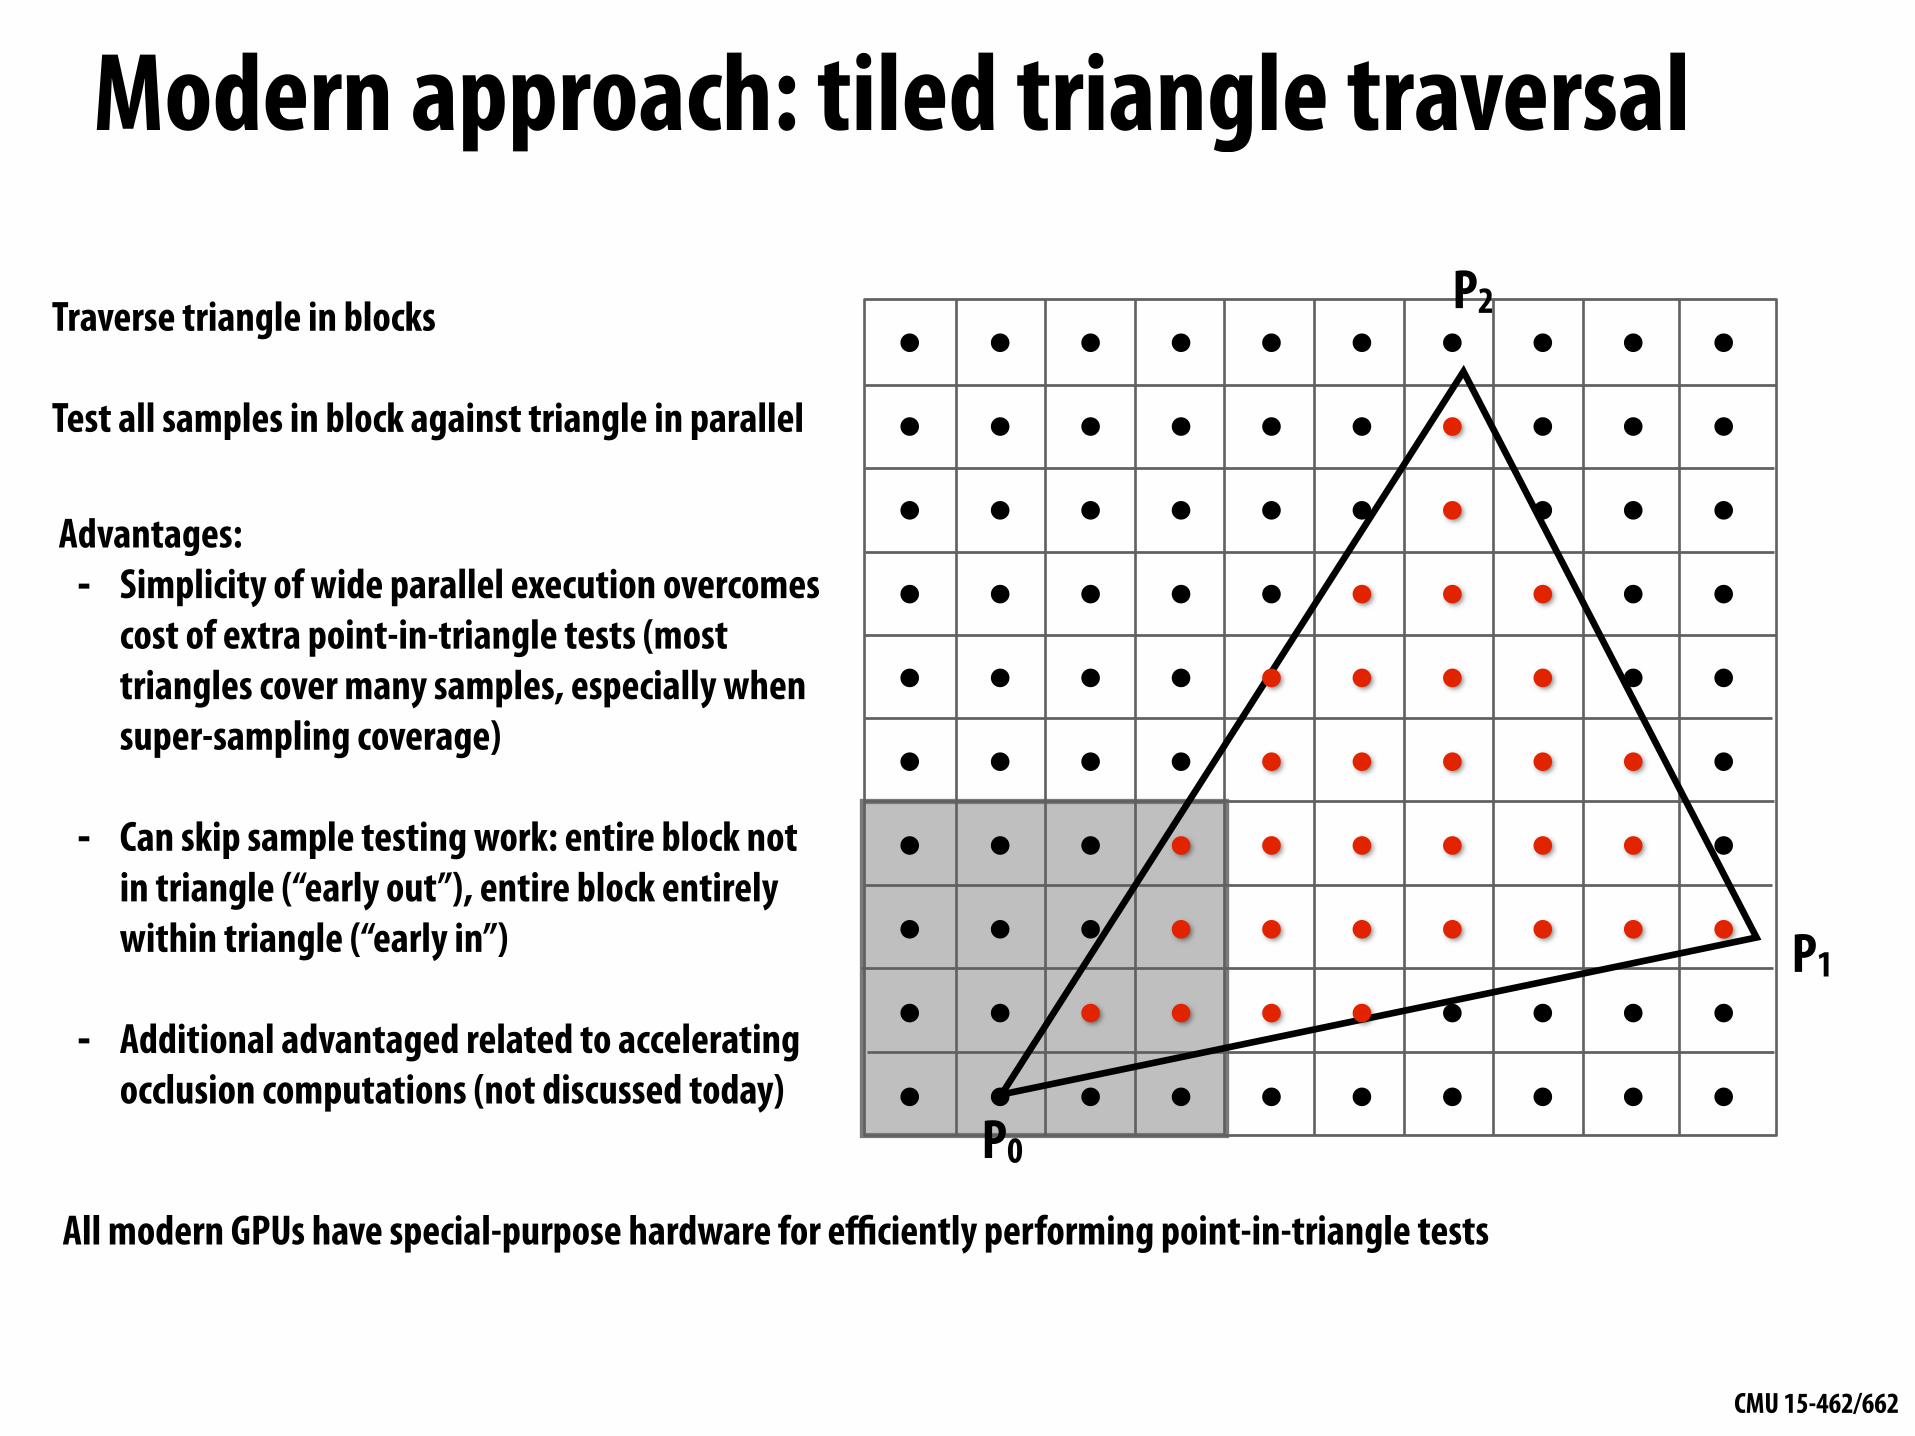
Modern approach: tiled triangle traversal
P0
P1
P2Traverse triangle in blocks
Test all samples in block against triangle in parallel
Advantages: - Simplicity of wide parallel execution overcomes
cost of extra point-in-triangle tests (most triangles cover many samples, especially when super-sampling coverage)
- Can skip sample testing work: entire block not in triangle (“early out”), entire block entirely within triangle (“early in”)
- Additional advantaged related to accelerating occlusion computations (not discussed today)
All modern GPUs have special-purpose hardware for efficiently performing point-in-triangle tests
CMU 15-462/662
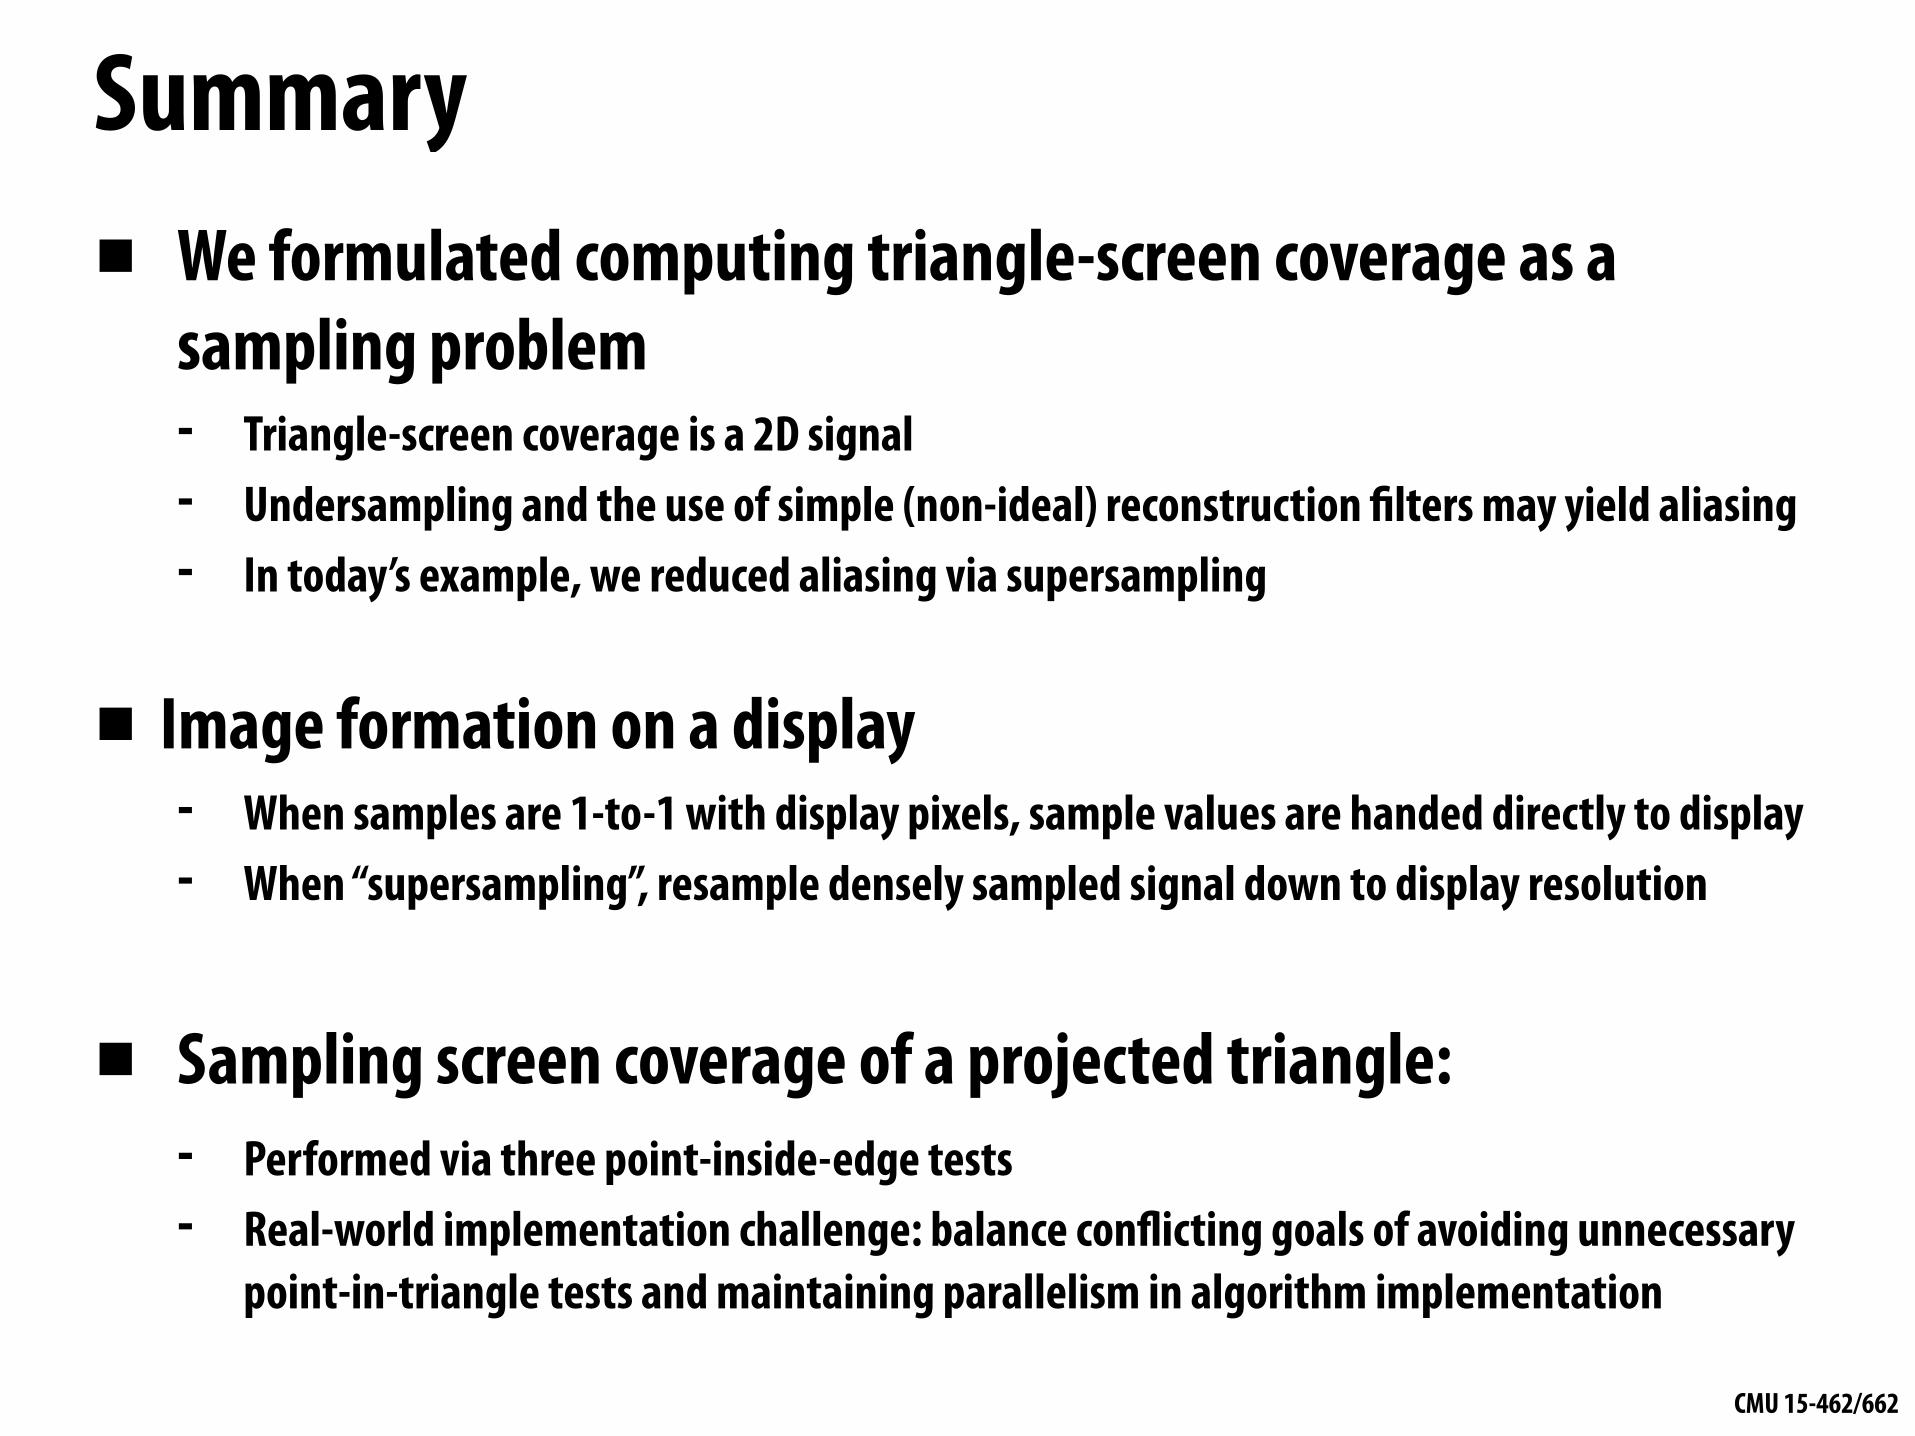
Summary▪ We formulated computing triangle-screen coverage as a
sampling problem - Triangle-screen coverage is a 2D signal - Undersampling and the use of simple (non-ideal) reconstruction filters may yield aliasing - In today’s example, we reduced aliasing via supersampling
▪ Image formation on a display - When samples are 1-to-1 with display pixels, sample values are handed directly to display - When “supersampling”, resample densely sampled signal down to display resolution
▪ Sampling screen coverage of a projected triangle: - Performed via three point-inside-edge tests - Real-world implementation challenge: balance conflicting goals of avoiding unnecessary
point-in-triangle tests and maintaining parallelism in algorithm implementation
CMU 15-462/662
Next time: 3D Transformations