Embed Size (px)
Citation preview

Lecture 4: Irrigation Water Requirements
Prepared by
Husam Al-Najar
The Islamic University of Gaza- Civil Engineering DepartmentIrrigation and Drainage- ECIV 5327

EvapotranspirationEvaporation: Process of water movement, in the vapor form, into the atmosphere from soil, water, or plant surfacesTranspiration: Evaporation of water from plant stomata into the atmosphereEvapotranspiration: Sum of evaporation and transpiration (abbreviated “ET”)Consumptive use: Sum of ET and the water taken up the plant and retained in the plant tissue (magnitude approximately equal to ET, and often used interchangeably)
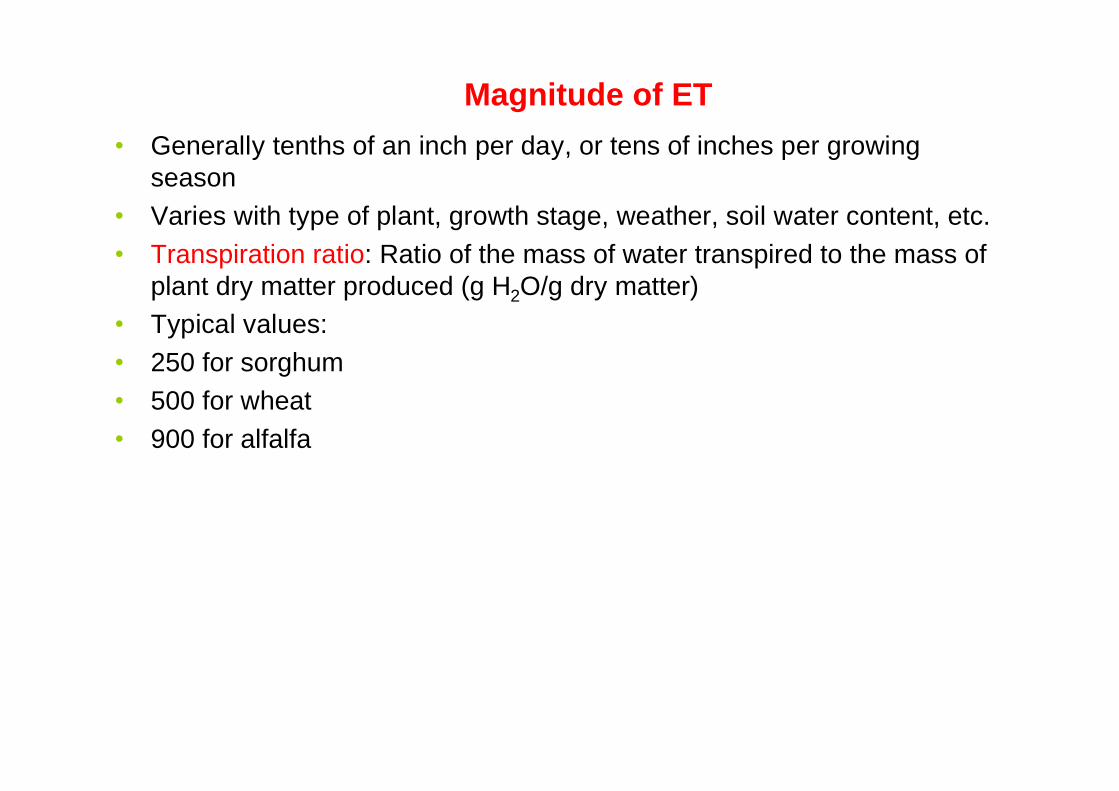
Magnitude of ET• Generally tenths of an inch per day, or tens of inches per growing
season• Varies with type of plant, growth stage, weather, soil water content, etc.• Transpiration ratio: Ratio of the mass of water transpired to the mass of
plant dry matter produced (g H2O/g dry matter)• Typical values: • 250 for sorghum• 500 for wheat • 900 for alfalfa

Plant Water Use PatternsDaily Water Use: peaks late in afternoon; very little water use at night
DAILY CROP WATER USE PATTERN
0
0.1
0.2
0.3
0.4
0.5
0.6
0.7
0.8
0 400 800 1200 1600 2000 2400
TIME OF DAY, (hour)
ET R
ATE
, (m
m/h
r)
Alfalfa:June 26, 1986

Wheat Growth Stage
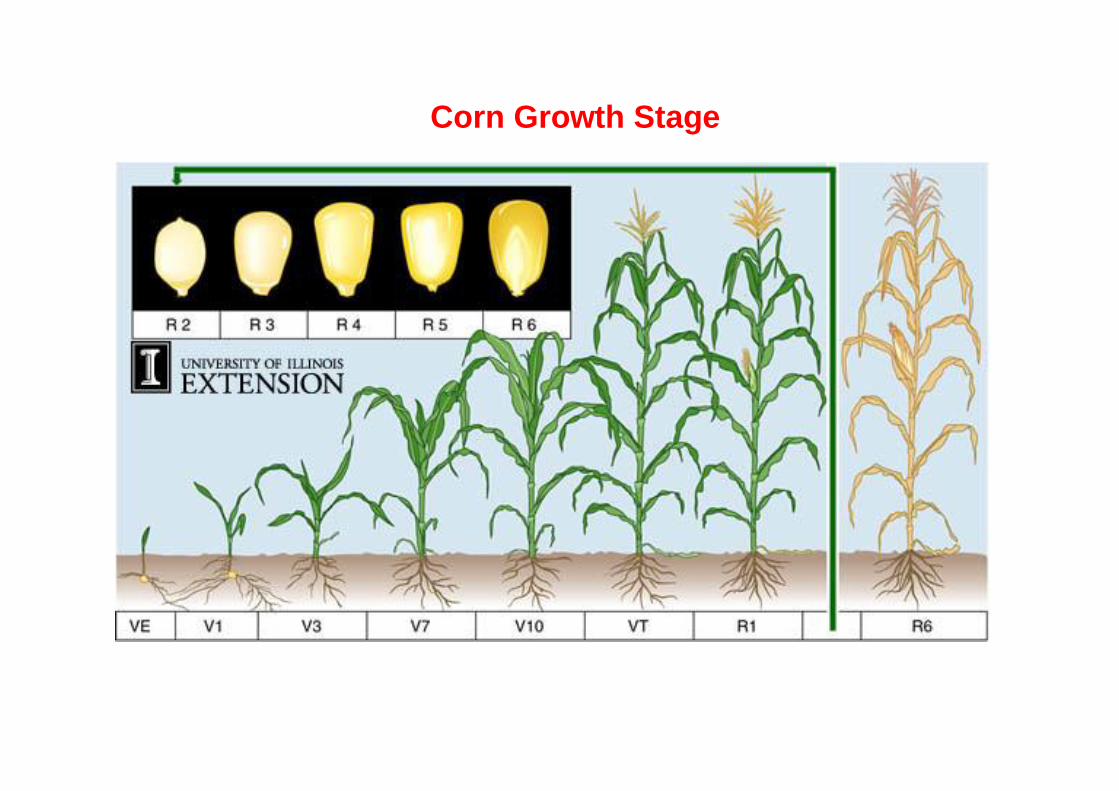
Corn Growth Stage
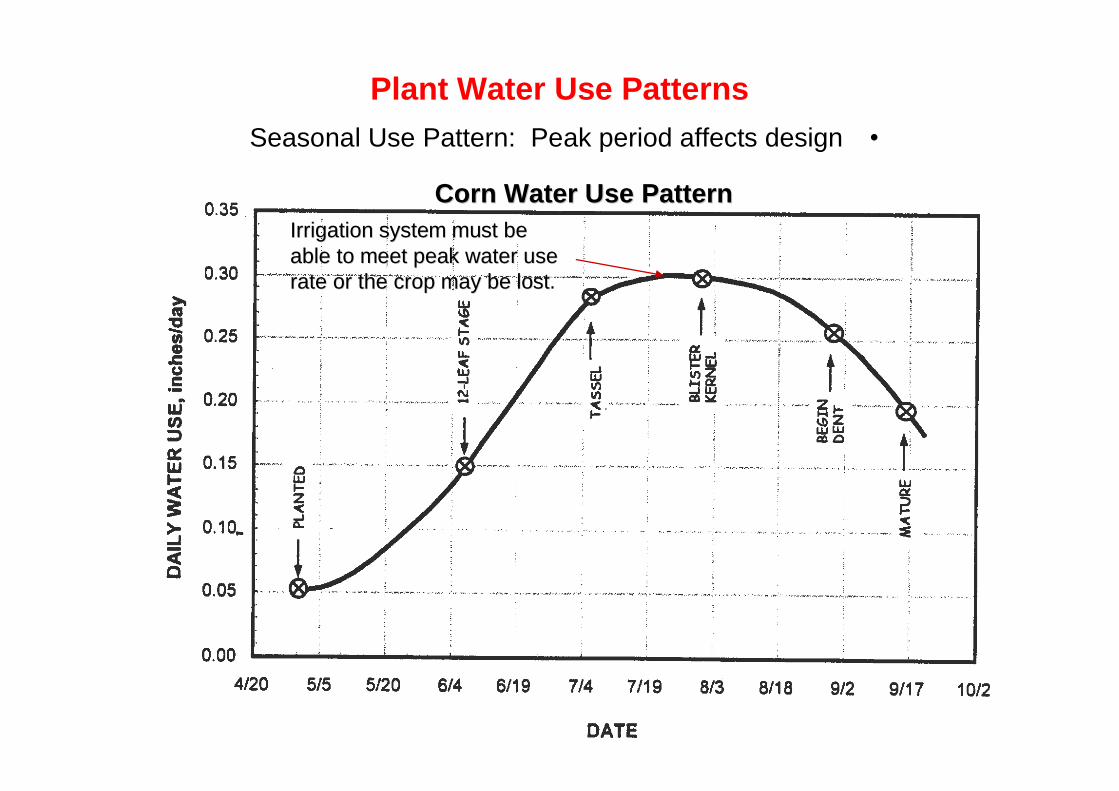
Plant Water Use Patterns•Seasonal Use Pattern: Peak period affects design
Corn Water Use PatternCorn Water Use PatternIrrigation system must be Irrigation system must be able to meet peak water use able to meet peak water use rate or the crop may be lostrate or the crop may be lost.

CROP WATER REQUIREMENTS
The depth of water to meet evapotranspiration of a disease-free crop growing in large fields without restricting conditions on soil profile, soil moisture and fertility, thus achieving full production potential.
The specific characteristics of the crop are represented by the crop coefficient k,
and the meteorological conditions by the reference crop evaporation Eref.
Eref refers to the evapotranspiration of grass and the crop coefficients correspond to this reference evapotranspiration.
Reference crop evapotranspiration (Eref): The rate of evapotranspirationfrom an extensive surface of an 8 to 15 cm tall green grass cover of uniform height, completely shading the ground and not short of water.
Ecrop = Kc Eref
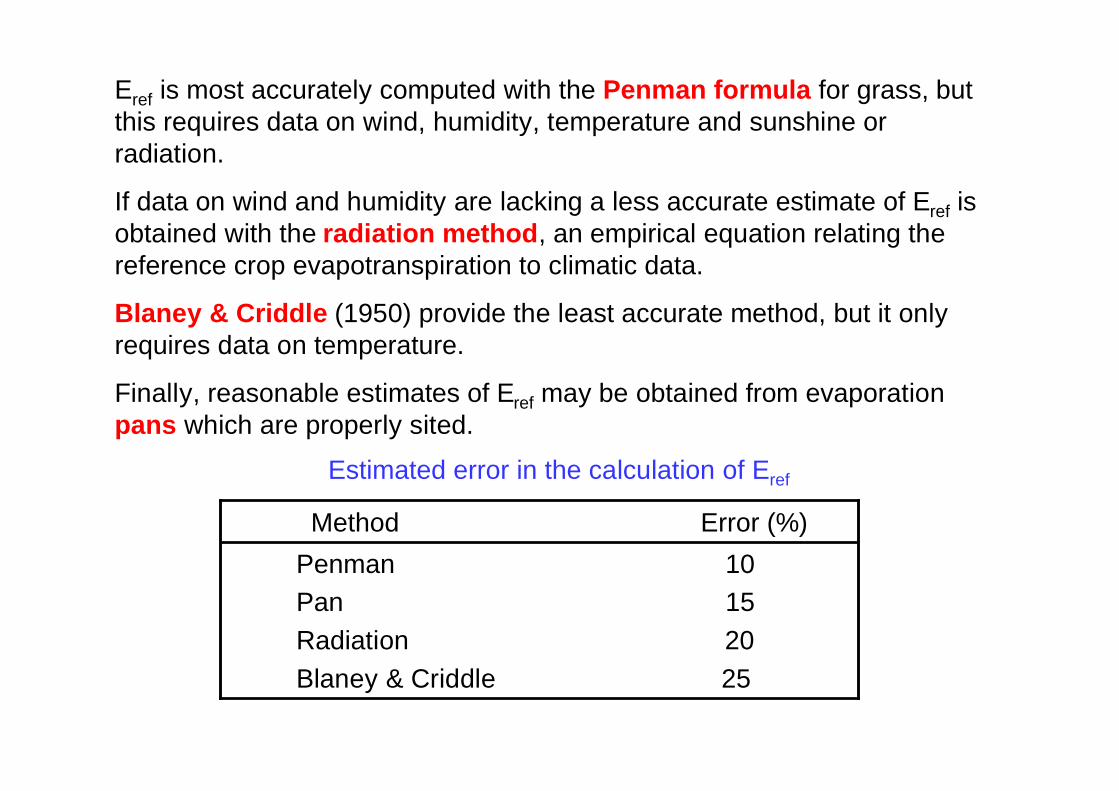
Eref is most accurately computed with the Penman formula for grass, but this requires data on wind, humidity, temperature and sunshine or radiation.
If data on wind and humidity are lacking a less accurate estimate of Eref is obtained with the radiation method, an empirical equation relating the reference crop evapotranspiration to climatic data.
Blaney & Criddle (1950) provide the least accurate method, but it only requires data on temperature.
Finally, reasonable estimates of Eref may be obtained from evaporation pans which are properly sited.
Estimated error in the calculation of Eref
Penman 10Pan 15Radiation 20Blaney & Criddle 25
Method Error (%)

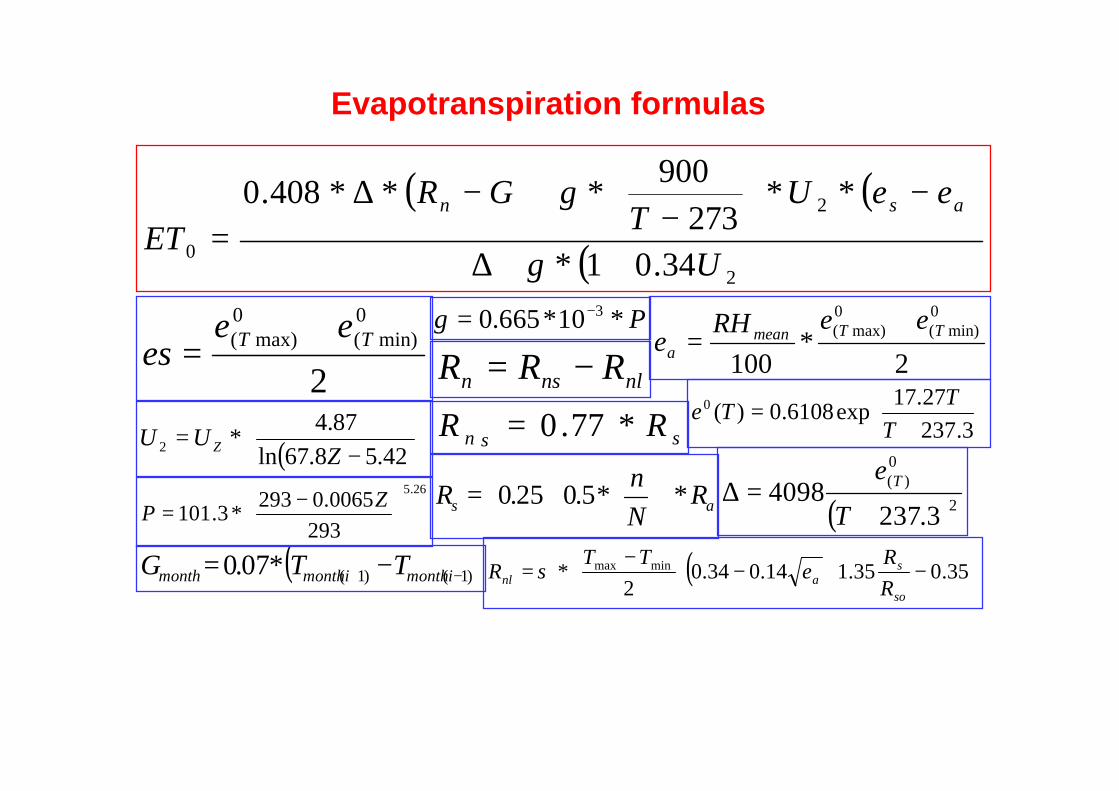
Evapotranspiration is calculated from Penman formula
( ) ( )
( )2
2
0 34.01273
900408.0
U
eeUT
GRET
asn
+∗+∆
−∗∗
−∗+−∗∆∗
=γ
γ
Rn = The remain of radiation on the plant surface (M J m -2day-1), G = The adsorbed amount of radiation by the earth (M J m -2day-1), T = The mean temperature at 2 m height (0C), U2 = wind speed at 2 meters height (m s -1), es = Saturated air pressure (kPa), ea = vapor pressure (kPa), Δ = Vapor pressure at temperature (kPa 0C-1) and ∂ = constant (kPa 0C-1)=
2100
0min)(
0max)( TTmean
a
eeRHe
+∗=
2
0min)(
0max)( TT ee
es+
=
( ))1()1(07.0 −+ −∗= imonthimonthmonth TTG
( )
−
∗=42.58.67ln
87.42 Z
UU Z
+=
3.23727.17exp6108.0)(0
TTTe
( )2
0)(
3.2374098
+=∆
T
e T
P∗∗= −310665.0γ
26.5
2930065.02933.101
−
∗=ZP
( )
−−
−
∗= 35.035.114.034.02
minmax
so
sanl R
Re
TTR σ
nlnsn RRR −=
ssn RR ∗= 77.0
as RNnR ∗
∗+= 5.025.0
( ) ( )
( )2
2
0 34.01273
900408.0
U
eeUT
GRET
asn
+∗+∆
−∗∗
−∗+−∗∆∗
=γ
γ
Evapotranspiration formulas
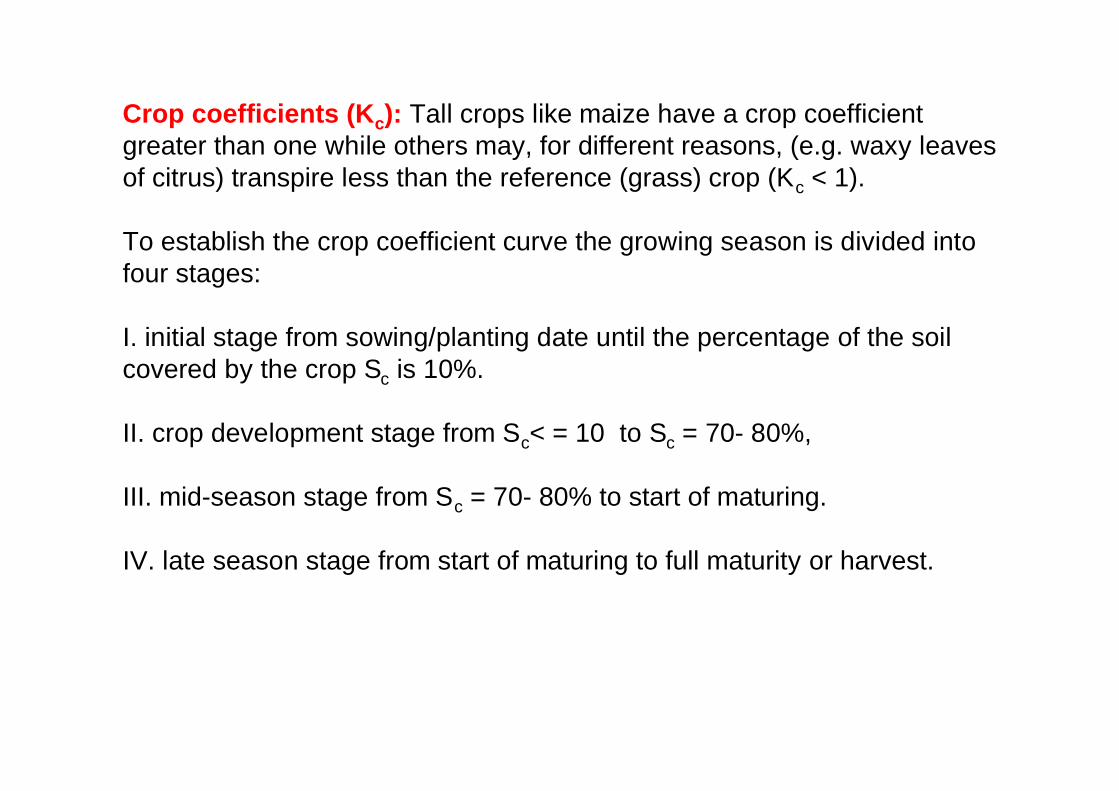
Crop coefficients (Kc): Tall crops like maize have a crop coefficient greater than one while others may, for different reasons, (e.g. waxy leaves of citrus) transpire less than the reference (grass) crop (Kc < 1).
To establish the crop coefficient curve the growing season is divided into four stages:
I. initial stage from sowing/planting date until the percentage of the soil covered by the crop Sc is 10%.
II. crop development stage from Sc< = 10 to Sc = 70- 80%,
III. mid-season stage from Sc = 70- 80% to start of maturing.
IV. late season stage from start of maturing to full maturity or harvest.

Crop coefficients

Example of crop coefficient (Kc) curve

For the construction of the crop coefficient curve the following procedure applies
1. Establish planting/sowing date (local information or table, examples are given in table 1)
2. Determine crop development stages (local information or table, examples are given).
3. The evaporation during the initial stage depends on the wetness of the almost bare soil. Estimate irrigation or rainfall frequency and derive k. for the initial stage from figure 1.
4. The effect of wind on the rate of transpiration is larger for crops which are taller than the reference crop. This effect is more pronounced in dry than in humid climates. The mid- season kc-value is therefore read from a table in relation to wind speed and humidity (examples are given in table 1) and plotted as a straight line.
5. Read Kc-value for late season stage from table (examples are given in Table 1). Assume straight line between end of mid-season and end of growing period.
6. Assume for the crop development stage a straight line between the end of the initial stage and the start of the mid-season period.
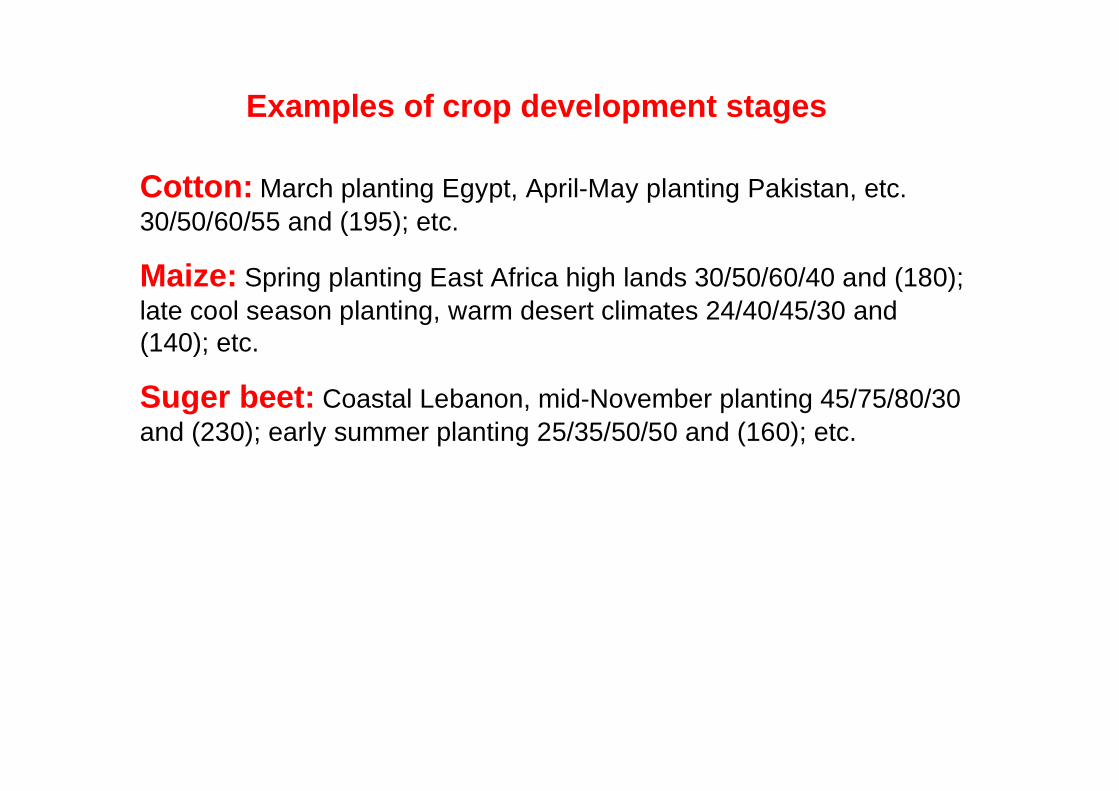
Examples of crop development stages
Cotton: March planting Egypt, April-May planting Pakistan, etc. 30/50/60/55 and (195); etc.
Maize: Spring planting East Africa high lands 30/50/60/40 and (180); late cool season planting, warm desert climates 24/40/45/30 and (140); etc.
Suger beet: Coastal Lebanon, mid-November planting 45/75/80/30 and (230); early summer planting 25/35/50/50 and (160); etc.
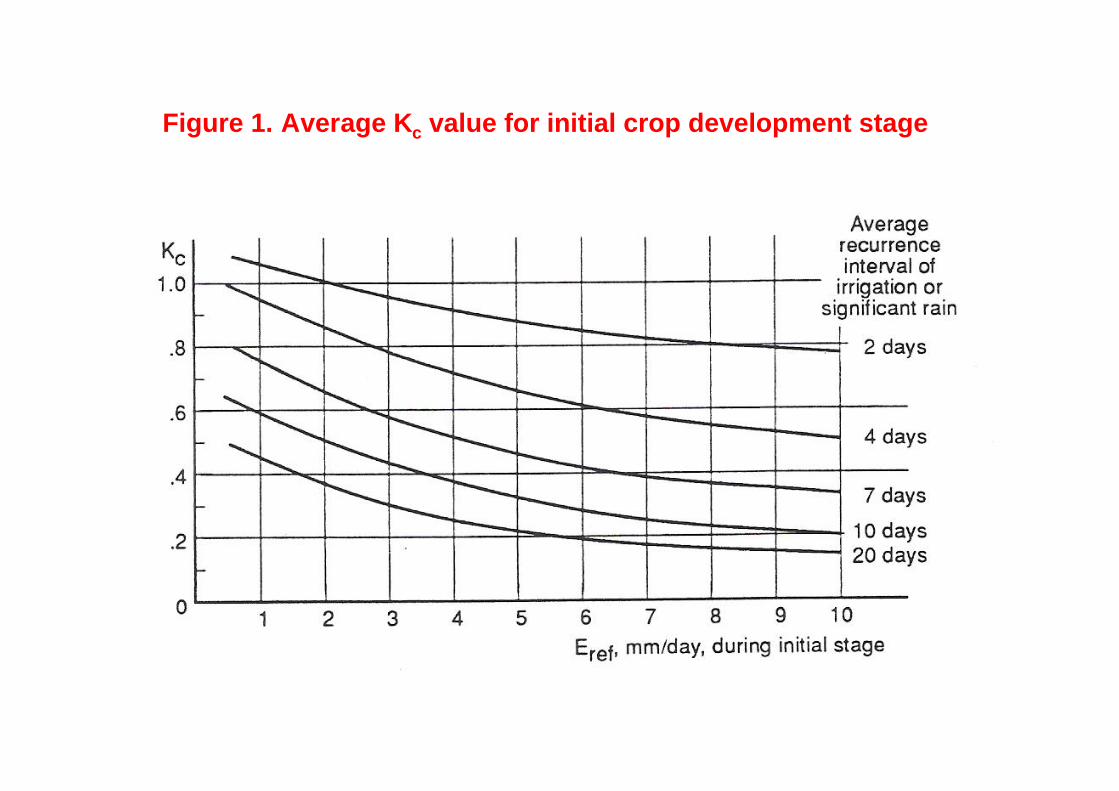
Figure 1. Average Kc value for initial crop development stage

Table 1. Examples of crop coefficient Kc

Leaching of salts

Leaching requirementsAn annual application of 1000 mm of irrigation water containing only 250 mg/l dissolved salts will add 2,500 kg salts to each ha each year. To prevent Stalinization of the top soil salts have to be washed down which is known as leaching.
LEACHING: Leaching is the process of removal of soluble materialby the passage of water through soil.
The leaching requirement is the ratio between the drainable excess and the quantity of irrigation water applied to keep the salt content in the root zone below the crop tolerance level.
The tolerance level is found from relations between crop yield and the salt concentration of the saturation extract.
The saturation extract is obtained by mixing a soil sample with distilled water until it glistens. The solution is extracted from the paste with a suction filter after which the electrical conductivity ECe is measured.

Consider for the computation of the leaching requirement the water balance of the root zone. Neglecting storage effects the equation may be written as:
where
Pe : is the effective precipitation.
I : is the irrigation.
D: is the net drainage (percolation from the root zone minus capillary rise).
Neglecting the accumulation of salts in the root zone, the salt balance can be expressed as:
where Ci and Cd are the salt concentrations of the irrigation and drainage water, respectively.
Changes in salt content due to fertilizer, crop growth or salty rainwater are not taken into consideration. Since the electrical conductivity EC of a solute is a reliable
Pe + I = D + Ecrop
I Ci = D Cd

Leaching requirements calculation
Where:
LR is the leaching requirements
ECi is the electrical conductivity of irrigation water
ECe is the electrical conductivity of the root zone- soil extraction.
Max.ECe =Maximum tolerable Electrical conductivity of the soil saturation extract for a given crop
For surface irrigation method including sprinkler
For drip irrigation method
ie
i
ECECECLR
−=
5
e
i
xECECLR
max)2(=

Examples of crop salt tolerance levels ECe in mmho/cm
The efficiency of leaching depends on:
1. The amount of water applied,2. Uniformity of water distribution, and3. The adequacy of drainage
Cotton 7.7 9.6 13.0 17.0Maize 1.7 2.5 3.8 5.9Suger beet 7.0 8.7 11.0 15.0
Yield potential 100% 90% 75% 50%

Leaching requirements based on irrigation frequency for irrigation water EC= 3.5 ds/m

Net irrigation requirements
Where:
Ge is the groundwater contribution
Pe is the effective precipitation
Wb is stored soil water at the beginning of the account period. For preliminary planning net irrigation requirements are usually computed for monthly or 10-day periods.
irrigation requirements
Effective precipitation empirical formula
Pe. = 0.8 * P - 25 for average rainfall (P) > 75 mm/monthPe. = 0.6 * P - 10 for average rainfall (P) < 75 mm/month
)( ebecropn PWGEI ++−=
LRPWGEI ebecrop
−++−
=1
)(