Embed Size (px)
Citation preview
4/9/14
1
ESD.S43 -‐ Green Supply Chain Management
Edgar Blanco Tony Craig Alexis Bateman
2nd Half Spring 2014 MIT Center for Transporta>on & Logis>cs
ESD.S43 -‐ Spring 2014
Learning Objec>ves
• Conduct a simple measurement of any organiza>on’s carbon footprint and iden>fy “hot spots”
• Recommend the right measurement approach to fit the purpose and scope of more complex carbon measurement ini>a>ves (e.g. supply chain)
• Be able to challenge other organiza>on’s carbon footprint declara>ons
ESD.S43 -‐ Spring 2014 © 2014 E. Blanco and T. Craig -‐ MIT CTL 2
ESD.S43 -‐ Green Supply Chain Management

4/9/14
2
WidgetCo Case Study
ESD.S43 -‐ Spring 2014 © 2014 E. Blanco and T. Craig -‐ MIT CTL 3
Case Study Recap -‐ WidgetCo • Global Manufacturing Global Manufacturing
–– Chair manufacturing Chair manufacturing –– Retail & Industrial customers in the US Retail & Industrial customers in the US
Facili>es Facili>es –– Two manufacturing plants one in Shanghai,Two manufacturing plants one in Shanghai, China (50% joint-‐venture) China (50% joint-‐venture)
and one in Michigan,and one in Michigan, USA (fully owned) USA (fully owned) –– Two USA DCs for finished good distribu>on (California & Georgia) Two USA DCs for finished good distribu>on (California & Georgia) –– 250 250 sq.`sq.`. dedicated showroom at 2,. dedicated showroom at 2,500 500 BiBigDepgDepotot retail loca>ons, retail loca>ons,
represen>ng 40% of retail sales represen>ng 40% of retail sales Transporta>on Transporta>on
–– Dedicated 3PL (for all imported materials) Dedicated 3PL (for all imported materials) –– Retail channel: 80% private truck fleet,Retail channel: 80% private truck fleet, 10% air, 10% air, 10% LTL 10% LTL –– Industrial channel: 40% deliveries,Industrial channel: 40% deliveries, 60% pick-‐ups at DC 60% pick-‐ups at DC
Source: E. Blanco. MIT CTL 2009 Source: E. Blanco. MIT CTL 2009
SD.S4SD.S433 -‐ Spr -‐ Springing 2 2001144 © 2014 E. Blanco and T. Craig -‐ MIT CTL © 2014 E. Blanco and T. Craig -‐ MIT CTL 4 4
•
•
E
Case Study Recap -‐ WidgetCo •
•
•
E

4/9/14
3
Supply Chain Flows
5
Shanghai Suppliers
Georgia DC
California DC
Industrial
Shanghai Plant
Michigan Plant
Retailers Local
Transporta>on
Ocean Transporta>on
+ Dedicated 3PL Rail/Truck
Rail/Truck 60% Pickup 40% Carrier
© 2014 E. Blanco and T. Craig -‐ MIT CTL
Ocean Transporta>on
+ Rail/Truck
ESD.S43 -‐ Spring 2014
Why is WidgetCo Interested in Carbon Footprint?
• Investors asking about it….
• Customers asking about it … – CEO ajen>on
• Compe>tor, FerretCo, reported emissions in Carbon Disclosure Project – 55,000 tons of CO2 – 1.1 kgs of CO2 per kg of product – Wants to become carbon neutral – Possibly labeling retail products
© 2014 E. Blanco and T. Craig -‐ MIT CTL 6 ESD.S43 -‐ Spring 2014

4/9/14
4
7
Shanghai Suppliers
Georgia DC
California DC
Shanghai Plant
Michigan Plant
Retailers
© 2014 E. Blanco and T. Craig -‐ MIT CTL
Industrial
Transporta>on
Transporta>on
Transporta>on
Transporta>on
Transporta>on Electricity
Electricity
Electricty Direct Emissions
Electricity Direct Emissions
Electricity
WidgetCo Emission Sources
ESD.S43 -‐ Spring 2014
WidgetCo Carbon Footprint Calcula>ons
© 2014 E. Blanco and T. Craig -‐ MIT CTL 8 ESD.S43 -‐ Spring 2014
Facili;es Electricity Consump;on * Electricity Factor + Direct CO2 Emissions
Transporta;on Method 1 (Ton-‐Miles) Used for shared transporta>on assets: Number of Shipments * Distance * Weight * Mode Emission Factor
Transporta;on Method 2 (Fuel Consump;on) Used for dedicated transporta>on assets: Fuel Consumed * Fuel Emission Factor

4/9/14
5
GHG Emission Factors Category Process Emission Factor (kg CO2e)
Electricity Electricity, USA (kWh) 0.596
Electricity Electricity, Michigan (kWh) 0.703
Electricity Electricity, China (kWh) 0.788
Transporta>on Truck (ton-‐mile) 0.086
Transporta>on Rail (ton-‐mile) 0.032
Transporta>on Ocean (ton-‐mile) 0.016
Transporta>on Air, Shorthaul (ton-‐mile) 2.528
Transporta>on Air, Longhaul (ton-‐mile) 0.912
Fuel Diesel (Gallon) 10.2
For most firms, cross sector tools that cover energy consump>on and transporta>on are all that is needed
ESD.S43 -‐ Spring 2014 © 2014 E. Blanco and T. Craig -‐ MIT CTL 9
GHG Emission Factors ers to the six greenhouse gases covered by the Kyoto Protocol • Usually ref
– carbon dioxide (CO2) – methane (CH4 ) – nitrous oxide (N2O) – hydrofluorocarbons (HFCs) – perfluorocarbons (PFCs) – sulfur hexafluoride (SF6) – Other gases may need to be accounted for an reported separately Single unit of measure: CO2-‐equivalents – Combined using 100-‐year “Global Warming Poten>al” – Regularly updated as part of the IPCC Assessment Reports – hjps://www.ipcc.ch/publica>ons_and_data/
publica>ons_and_data_reports.shtml
“Carbon” is common word
D.S43 -‐ Spring 2014 © 2014 E. Blanco and T. Craig -‐ MIT CTL 10
•
•
ES
GHG Emission Factors

4/9/14
6
The GHG Protocol Emission Scopes
CO2 SF6 CH4 N2O HFCs PCFs
Scope 2: Scope 1: Scope 3: Indirect emissions Direct emissions
from electricity Other Indirect
emissions
INDIRECT INDIRECT DIRECT
© 2014 E. Blanco and T. Craig -‐ MIT CTL
www.ghgprotocol.org 11 ESD.S43 -‐ Spring 2014
Case Study Ques>ons 1. Calculate WidgetCo’s carbon footprint (Excel File)
1. Correct emission factor for each WidgetCo supply chain ac>vity 2. Share to include in WidgetCo footprint (0-‐100%) 3. Iden>fy the emissions by scope
2. What did you include in your calcula>on and why? Explain to CEO and Board…
3. Will you recommend publicly disclosing WidgetCo’s carbon footprint? Why or why not? What about pledging to become carbon neutral or labeling your products?
© 2014 E. Blanco and T. Craig -‐ MIT CTL 12 ESD.S43 -‐ Spring 2014

4/9/14
7
WidgetCo Case Study Discussion
Breakout in groups of three Agree on WidgetCo Carbon Footprint
– One computer ready with the XLS – Emission Factors, Scopes, and Contribu>on
Prepare to share your answers to the ques>ons to the larger group
SD.S43 -‐ Spring 2014 © 2014 E. Blanco and T. Craig -‐ MIT CTL 13
••
•
E
What is WidgetCo’s Carbon Footprint?
ESD.S43 -‐ Spring 2014 © 2014 E. Blanco and T. Craig -‐ MIT CTL 14

4/9/14
8
Your Individual Answers
ESD.S43 -‐ Spring 2014 © 2014 E. Blanco and T. Craig -‐ MIT CTL 15
Your Individual Answers
ESD.S43 -‐ Spring 2014 © 2014 E. Blanco and T. Craig -‐ MIT CTL 16
-‐
100,000
200,000
300,000
400,000
500,000
600,000
700,000
800,000
1 2 3 4 5 6 7 8 9 10 11 12 13
tons CO
2e
Other
Distribu>on Facili>es
Transporta>on into DCs
Transporta>on to Customers
Manufacturing China
Manufacturing US

4/9/14
9
Which is the correct one?
© 2014 E. Blanco and T. Craig -‐ MIT CTL 17 ESD.S43 -‐ Spring 2014
6.93 6.50
4.51
2.52
1.10
0.00
1.00
2.00
3.00
4.00
5.00
6.00
7.00
8.00
-‐
100,000
200,000
300,000
400,000
500,000
600,000
700,000
Supply Chain Control Equity Share Corporate FerretCo
tons CO
2e
Other
Distribu>on Facili>es
Transporta>on into DCs
Transporta>on to Customers
Manufacturing China
Manufacturing US
Per kg
18
Shanghai Suppliers
Georgia DC
California DC
Shanghai Plant
Michigan Plant
Retailers
© 2014 E. Blanco and T. Craig -‐ MIT CTL
Industrial
Ocean Transporta>on
Rail Transporta>on
Customer Pickup
Private Fleet
Electricity
Electricity
Electricity
Electricity
Electricity
WidgetCo Emission Sources
ESD.S43 -‐ Spring 2014
3PL Truck Transporta>on
Direct Emissions
Air Shipments
Direct Emissions

4/9/14
10
Your Answers
ESD.S43 -‐ Spring 2014 © 2014 E. Blanco and T. Craig -‐ MIT CTL 19
Scope 3 Emissions Reported in the CDP
ESD.S43 -‐ Spring 2014 © 2014 E. Blanco and T. Craig -‐ MIT CTL 20
Courtesy of CDP. Used with permission.
Courtesy of CDP. Used with permission.

4/9/14
11
Mechanics of Carbon Footprints
• Determine your organiza>on boundary – Equity share, Financial or opera>onal control
• Determine your opera>onal boundary – Calculate Scope 1 and Scope 2 emissions
• Minimum requirements – Iden>fy Scope 3 emissions to include
• Generally not required, but o`en included • Gather data on opera>ons
– Apply appropriate emissions factors
ESD.S43 -‐ Spring 2014 © 2014 E. Blanco and T. Craig -‐ MIT CTL 21
Issues with Carbon Footprints • Merging data from many sources
– Facili>es, transporta>on, procurement, etc. • Data integrity
– Do the numbers make sense? – Are there missing values?
• Data aggrega>on issues – Do air shipments have the same average weight as truck shipments?
• Finding the right emissions factors – Pay ajen>on to units – Apply consistently
ESD.S43 -‐ Spring 2014 © 2014 E. Blanco and T. Craig -‐ MIT CTL 22

4/9/14
12
Tricks & Traps for Corporate Carbon Footprint
• Carefully define corporate boundaries – Read the GHG Protocol and understand it – Scope 1, 2 and 3 are a good framework – Rela>onship between internal vs. external stakeholders may affect
your calcula>on of the carbon footprint • Use the right data and emissions factors
– Preferred accoun>ng methods – Consistent choices of factors
• Absolute vs. rela>ve measures • Expect the carbon footprint to be refined over >me.
– Keep in mind as you share outside your organiza>on or make reduc>on commitments
– The primary goal is year-‐on-‐year comparisons • May require occasional restatements
ESD.S43 -‐ Spring 2014 © 2014 E. Blanco and T. Craig -‐ MIT CTL 23
Would you disclose? Would you disclose?
© 2014 E. Blanco and T. Craig -‐ MIT CTL 24 ESD.S43 -‐ Spring 2014

4/9/14
13
Carbon Disclosure Project 767 Ins>tu>onal investors with $92 trillion in assets
ESD.S43 -‐ Spring 2014 © 2014 E. Blanco and T. Craig -‐ MIT CTL 25
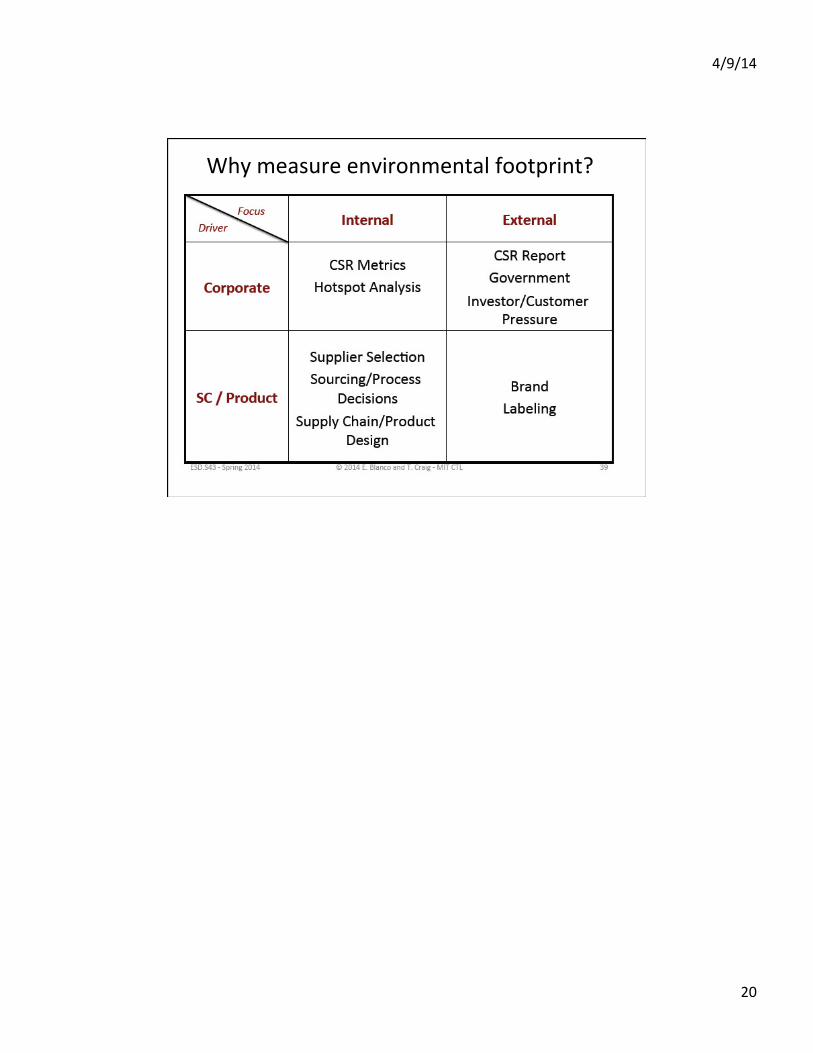
Why measure environmental footprint?
• Boundaries for internal may differ from external
ESD.S43 -‐ Spring 2014 © 2014 E. Blanco and T. Craig -‐ MIT CTL 26
Courtesy of CDP. Used with permission.

4/9/14
14
Does it make sense to compare WidgetCo and FerretCo?
ESD.S43 -‐ Spring 2014 © 2014 E. Blanco and T. Craig -‐ MIT CTL 27
Distribu;on Suppliers Manufacturing Customers
Supply Chain Flows
28
Suppliers
Georgia DC
California DC Industrial
Shanghai Plant
Michigan Plant
Retailers
© 2014 E. Blanco and T. Craig -‐ MIT CTL ESD.S43 -‐ Spring 2014
Suppliers
West Coast DC
Midwest DC
Industrial Contract
Manufacturers
Northeast DC
Southeast DC
Local Sales Office
Local Sales Office
FerretCo Boundary
WidgetCo Boundary

4/9/14
15
Supply chain and corporate comparison
Scope WidgetCo FerretCo
Corporate (Equity Share) 378,986 47,499
Per kg of sold product 4.51 0.95
Disclosed (Equity Share) 414,824 55,219
Per kg of sold product 4.94 1.10
Supply Chain 581,724 365,019
Per kg of sold product 6.93 7.30
SD.S43 -‐ Spring 2014 © 2014 E. Blanco and T. Craig -‐ MIT CTL 29
Increasing need for a broader view of emissions
Apple has been voted the best supply chain company for 6 years straight by Gartner Inc.
E
ESD.S43 -‐ Spring 2014 © 2014 E. Blanco and T. Craig -‐ MIT CTL 30
Increasing need for a broader view of emissions
• Apple has been voted the best supply chain company for 6 years straight by Gartner Inc.
ESD.S43 -‐ Spring 2014 © 2014 E. Blanco and T. Craig -‐ MIT CTL 30
Figure removed due to copyright restrictions. See the lecture video for further details.

4/9/14
16
Many sectors would have less than 25% of their total GHG footprint represented by Scope 1 and 2 es>mates
ESD.S43 -‐ Spring 2014 © 2014 E. Blanco and T. Craig -‐ MIT CTL 31
© ACS. All rights reserved. This content is excluded from our Creative Commonslicense. For more information, see http://ocw.mit.edu/help/faq-fair-use/.
Expanding the GHG Protocol
The Greenhouse Gas Protocol (2011), Corporate Value Chain (Scope 3) Accounting and Reporting Standard
ESD.S43 -‐ Spring 2014 © 2014 E. Blanco and T. Craig -‐ MIT CTL 32
Courtesy of The Greenhouse Gas Protocol. Used with permission.
Expanding the GHG Protocol

4/9/14
CDP Supply Chain Started in 2008
ESD.S43 -‐ Spring 2014 © 2014 E. Blanco and T. Craig -‐ MIT CTL 33
Courtesy of CDP. Used with permission.
More pressure leads to more responses
ESD.S43 -‐ Spring 2014 © 2014 E. Blanco and T. Craig -‐ MIT CTL 34
Courtesy of CDP. Used with permission.
17
More pressure leads to more responses
4/9/14
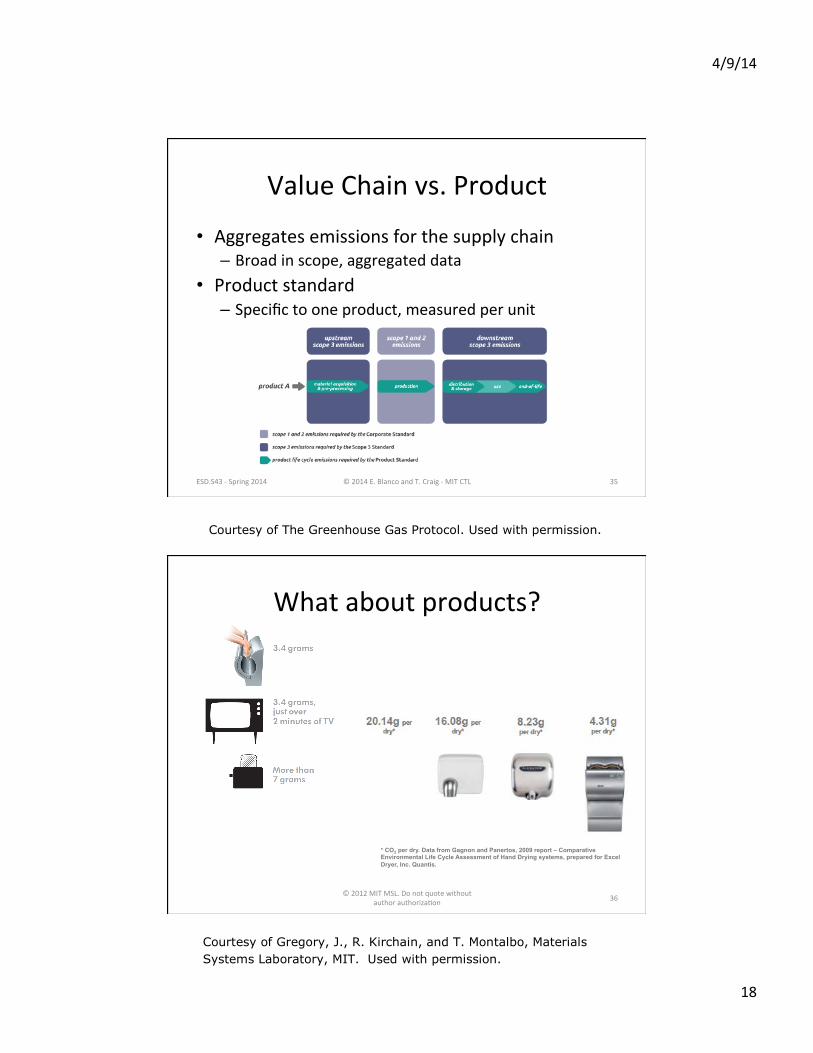
Value Chain vs. Product
• Aggregates emissions for the supply chain– Broad in scope, aggregated data
• Product standard– Specific to one product, measured per unit
ESD.S43 -‐ Spring 2014 35
Courtesy of The Greenhouse Gas Protocol. Used with permission.
What about products?
20.14g per 16.08g per 8.23g 4.31g dry* dry* per dry* per dry*
* CO2 per dry. Data from Gagnon and Panertos, 2009 report – Comparative Environmental Life Cycle Assessment of Hand Drying systems, prepared for Excel Dryer, Inc. Quantis.
© 2012 MIT MSL. Do not quote without 36 author authoriza>on
Courtesy of Gregory, J., R. Kirchain, and T. Montalbo, Materials
Systems Laboratory, MIT. Used with permission.
18
Value Chain vs. Product
• Aggregates emissions for the supply chain– Broad in scope, aggregated data
• Product standard– Specific to one product, measured per unit
ESD.S43 -‐ Spring 2014 35
What about products?
© 2012 MIT MSL. Do not quote without author authoriza>on 36
* CO2 per dry. Data from Gagnon and Panertos, 2009 report – Comparative Environmental Life Cycle Assessment of Hand Drying systems, prepared for Excel Dryer, Inc. Quantis.
© 2014 E. Blanco and T. Craig -‐ MIT CTL

4/9/14
19
Does it make sense to be carbon neutral?
• Ongoing expense to purchase offsets – 550,000 tons * $10-‐15/ton = $5.5-‐8.25 million
• Carbon footprint generally reported before factoring in offsets
• Fraud/Corrup>on/Misleading – Fiji Water sued over forward credi>ng
ESD.S43 -‐ Spring 2014 © 2014 E. Blanco and T. Craig -‐ MIT CTL 37
Carbon Offsets
• Voluntary market of $569 million in 2011 – World Bank Carbon Finance Report 2012
• Several cer>fica>on schemes – Gold Standard, Voluntary Carbon Standard, etc.
• Voluntary Carbon Standard Principles – Addi>onal – Real – Measurable – Permanent
ESD.S43 -‐ Spring 2014 © 2014 E. Blanco and T. Craig -‐ MIT CTL 38
4/9/14
20
Why measure environmental footprint?

MIT OpenCourseWarehttp://ocw.mit.edu
ESD.S43 Green Supply Chain ManagementSpring 2014
For information about citing these materials or our Terms of Use, visit: http://ocw.mit.edu/terms.