Embed Size (px)
Citation preview
Lecture 3:Technologies
Allen D. Malony
Department of Computer and Information Science
Tools and Technologies
"If I have seen further it is by standing on the shoulders of giants.”
- Sir Isaac Newton
Parallel Performance Tools: A Short Course, Beihang University, December 2-4, 2013 2
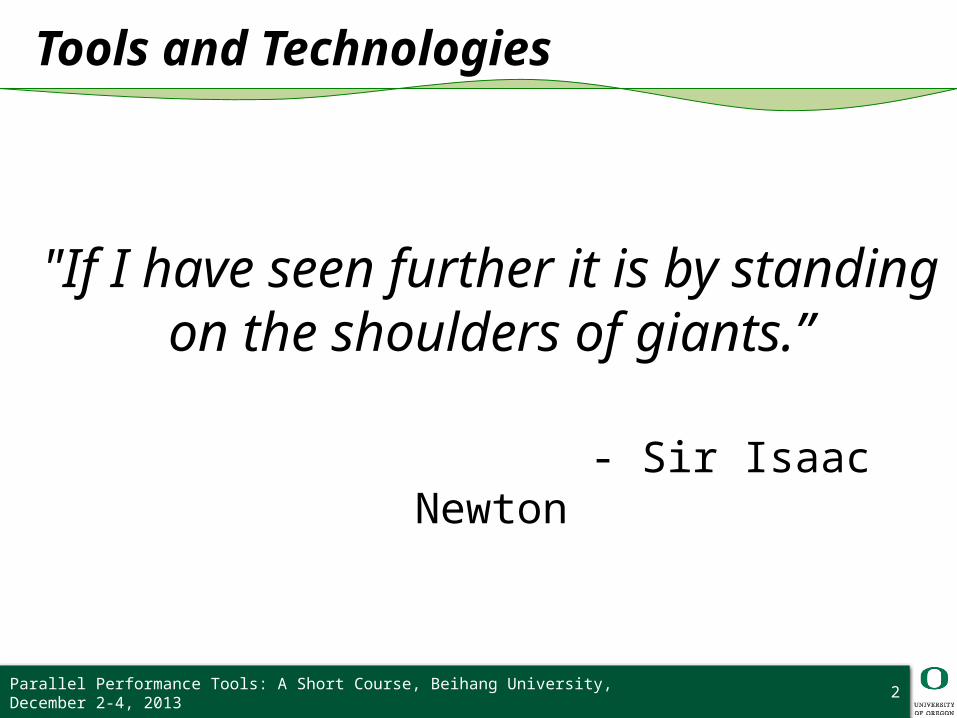
Tools and Technologies
Timers PAPI Instrumentation
❍ Source (PDT)❍ PMPI❍ Compiler instrumentation❍ Binary
◆ Dyninst◆ PEBIL◆ MAQAO
Program Address Resolution: Binutils Stack Walking
❍ StackwalkerAPI❍ Libunwind
CUPTIParallel Performance Tools: A Short Course, Beihang University, December 2-4, 2013 3
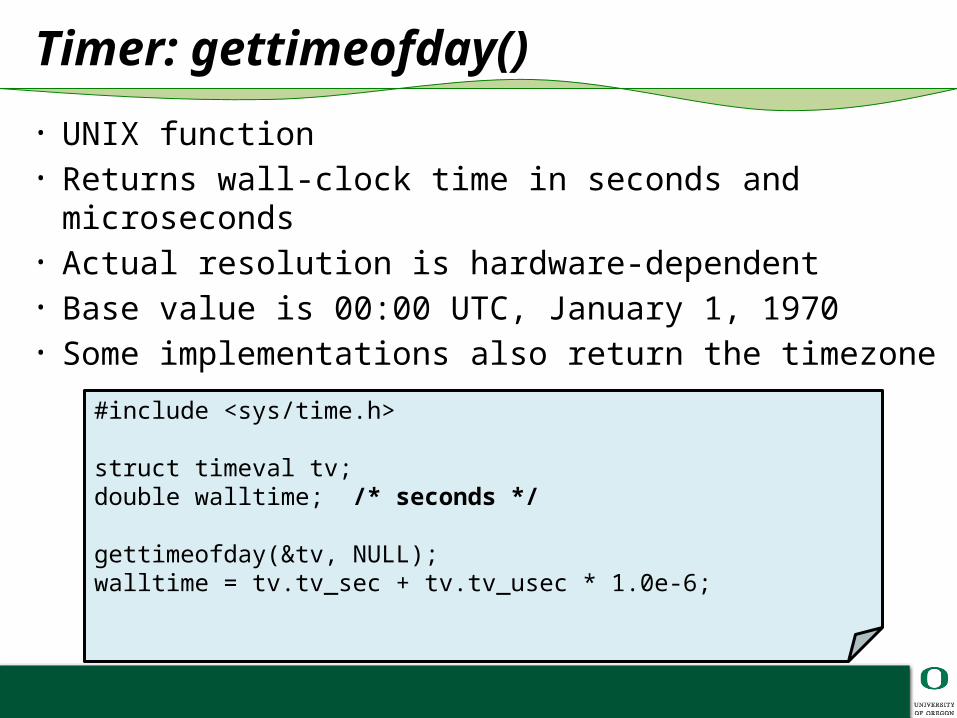
Timer: gettimeofday()
• UNIX function• Returns wall-clock time in seconds and microseconds • Actual resolution is hardware-dependent• Base value is 00:00 UTC, January 1, 1970• Some implementations also return the timezone
#include <sys/time.h>
struct timeval tv;double walltime; /* seconds */
gettimeofday(&tv, NULL);walltime = tv.tv_sec + tv.tv_usec * 1.0e-6;
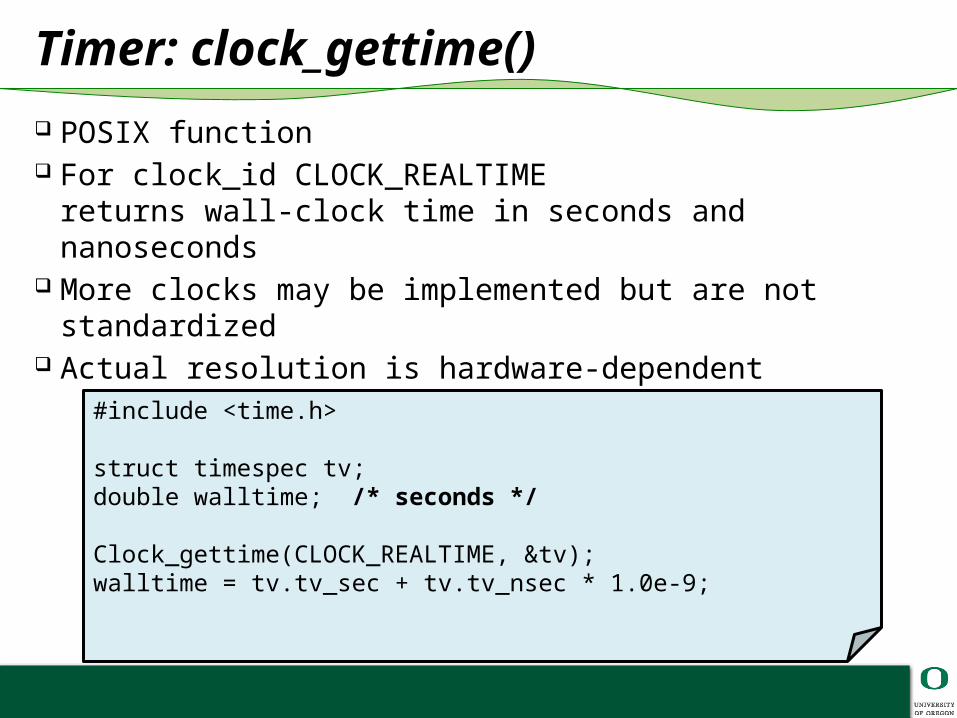
Timer: clock_gettime()
POSIX function For clock_id CLOCK_REALTIME
returns wall-clock time in seconds and nanoseconds More clocks may be implemented but are not standardized Actual resolution is hardware-dependent
#include <time.h>
struct timespec tv;double walltime; /* seconds */
Clock_gettime(CLOCK_REALTIME, &tv);walltime = tv.tv_sec + tv.tv_nsec * 1.0e-9;
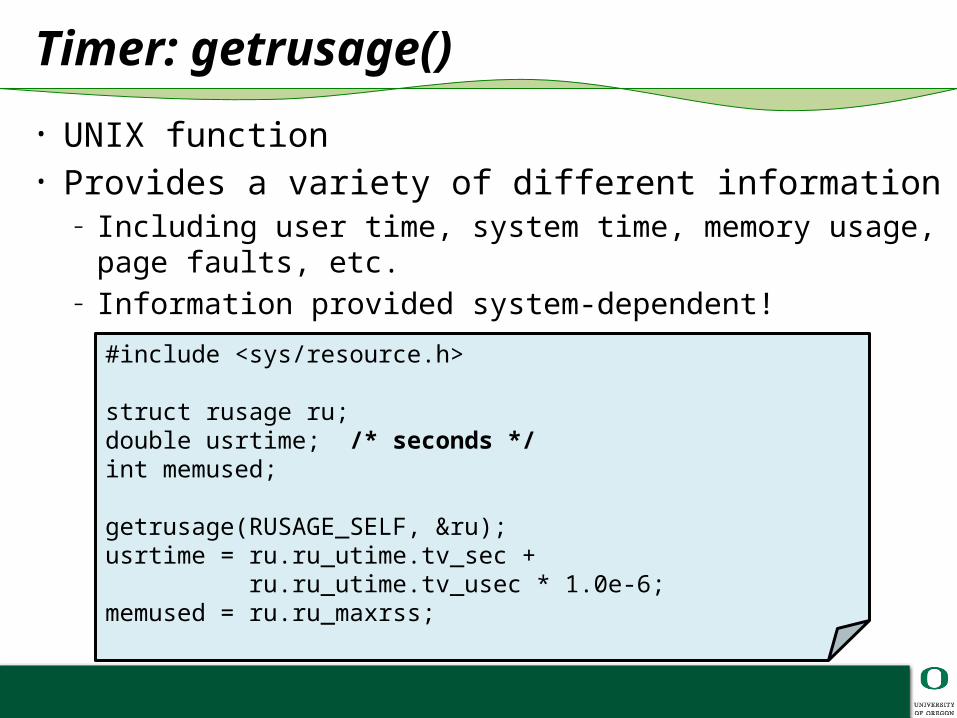
Timer: getrusage()
• UNIX function• Provides a variety of different information
– Including user time, system time, memory usage, page faults, etc.– Information provided system-dependent!
#include <sys/resource.h>
struct rusage ru;double usrtime; /* seconds */int memused;
getrusage(RUSAGE_SELF, &ru);usrtime = ru.ru_utime.tv_sec + ru.ru_utime.tv_usec * 1.0e-6;memused = ru.ru_maxrss;
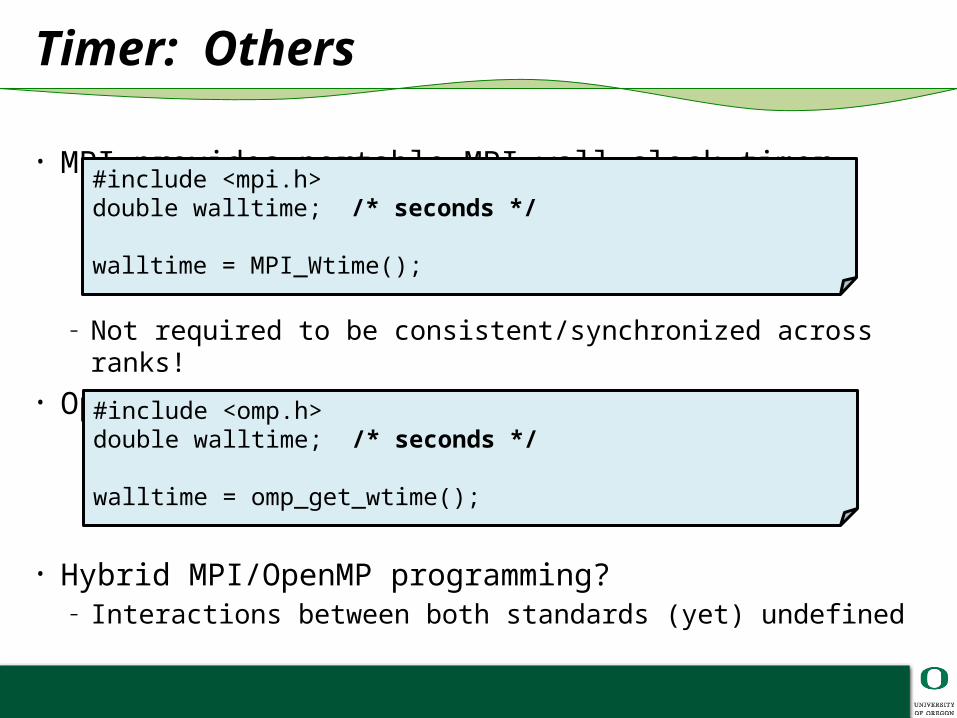
Timer: Others
• MPI provides portable MPI wall-clock timer
– Not required to be consistent/synchronized across ranks!• OpenMP 2.0 also provides a library function
• Hybrid MPI/OpenMP programming?– Interactions between both standards (yet) undefined
#include <mpi.h>double walltime; /* seconds */
walltime = MPI_Wtime();
#include <omp.h>double walltime; /* seconds */
walltime = omp_get_wtime();
Timer: Others
• Fortran 90 intrinsic subroutines– cpu_time()– system_clock()
• Hardware Counter Libraries– Vendor APIs
• PMAPI, HWPC, libhpm, libpfm, libperf, …
– PAPI
What Are Performance Counters
• Extra processor logic inserted to count specific events• Updated at every cycle• Strengths
– Non-intrusive– Very accurate– Low overhead
• Weaknesses– Provides only hard counts– Specific for each processor– Access is not appropriate for the end user
nor well documented– Lack of standard on what is counted
10
Hardware Counter Issues
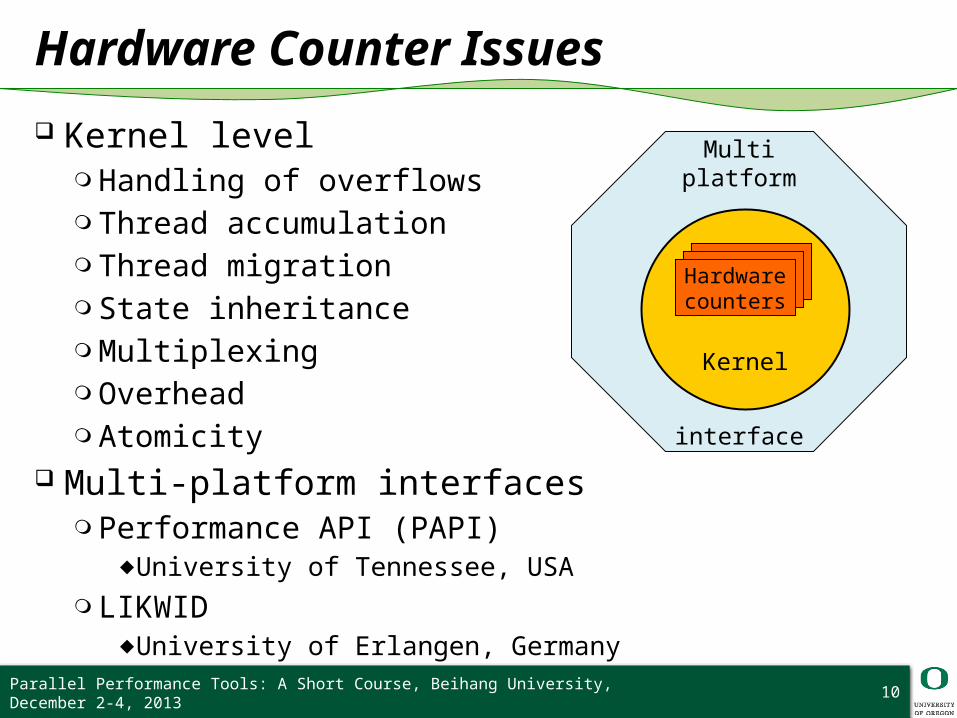
Kernel level❍ Handling of overflows❍ Thread accumulation❍ Thread migration❍ State inheritance❍ Multiplexing❍ Overhead❍ Atomicity
Multi-platform interfaces❍ Performance API (PAPI)
◆University of Tennessee, USA
❍ LIKWID◆University of Erlangen, Germany
Parallel Performance Tools: A Short Course, Beihang University, December 2-4, 2013
Multiplatform
interface
Kernel
Hardwarecounters
Hardware Measurement
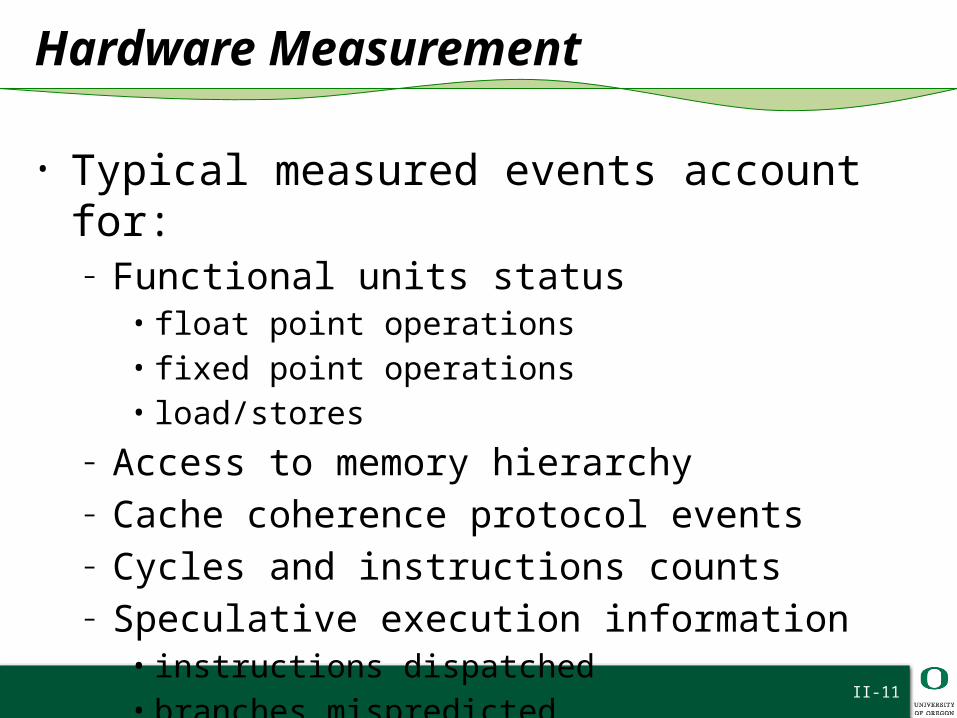
• Typical measured events account for:– Functional units status
• float point operations• fixed point operations• load/stores
– Access to memory hierarchy– Cache coherence protocol events– Cycles and instructions counts– Speculative execution information
• instructions dispatched• branches mispredicted
II-11
Hardware Metrics
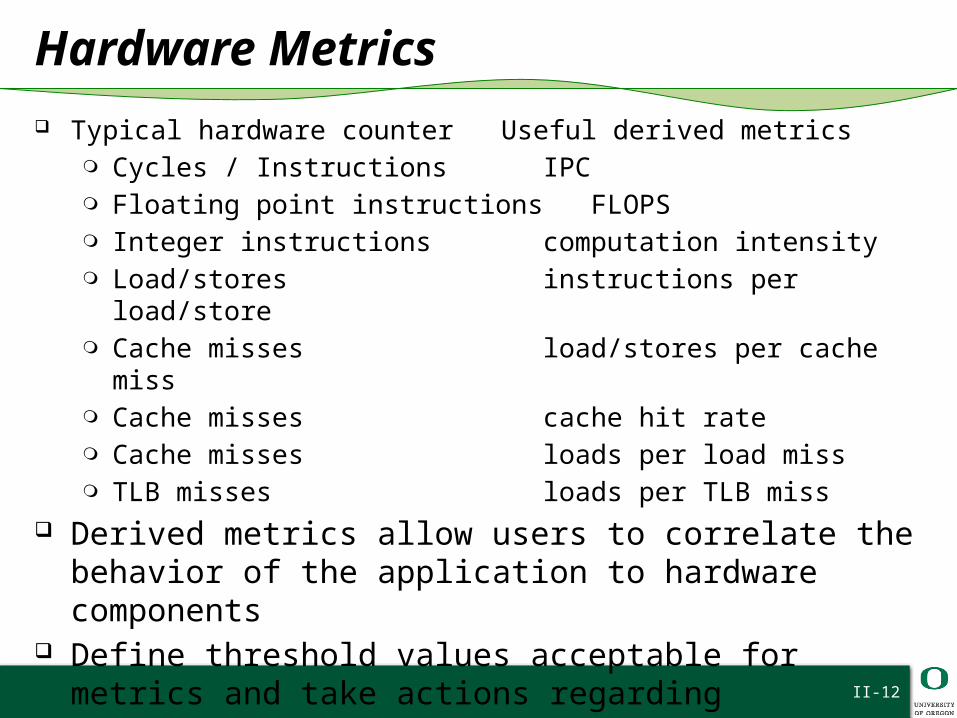
Typical hardware counter Useful derived metrics❍ Cycles / Instructions IPC❍ Floating point instructions FLOPS❍ Integer instructions computation intensity❍ Load/stores instructions per load/store❍ Cache misses load/stores per cache miss❍ Cache misses cache hit rate❍ Cache misses loads per load miss❍ TLB misses loads per TLB miss
Derived metrics allow users to correlate the behavior of the application to hardware components
Define threshold values acceptable for metrics and take actions regarding optimization when below/above thresholds
II-12
Accuracy Issues
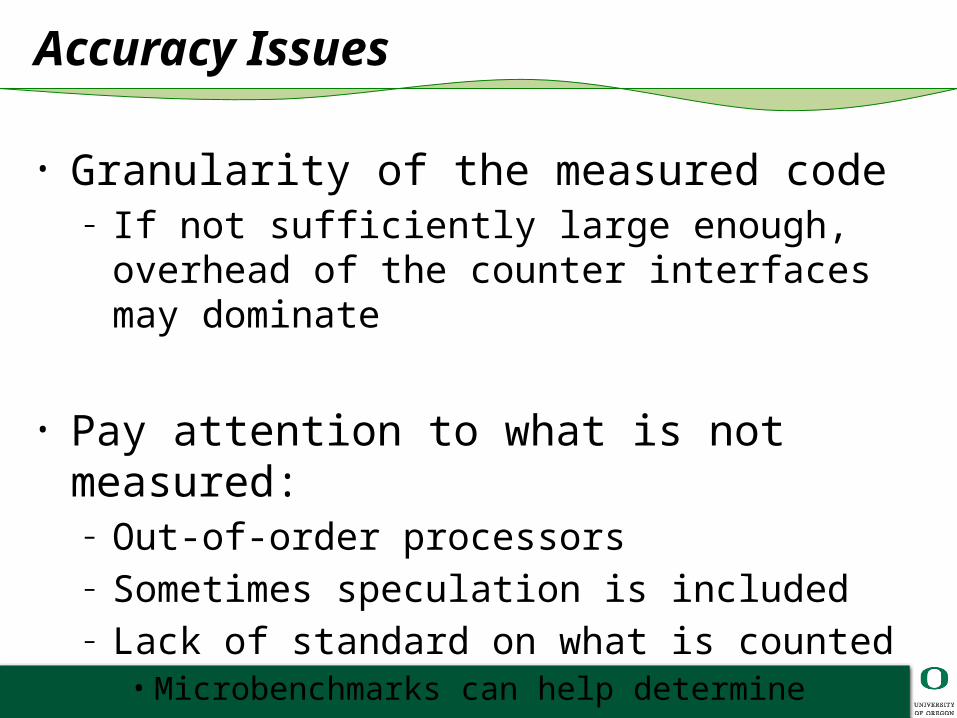
• Granularity of the measured code– If not sufficiently large enough, overhead of the
counter interfaces may dominate
• Pay attention to what is not measured:– Out-of-order processors– Sometimes speculation is included– Lack of standard on what is counted
• Microbenchmarks can help determine accuracyof the hardware counters
Hardware Counters Access on Linux
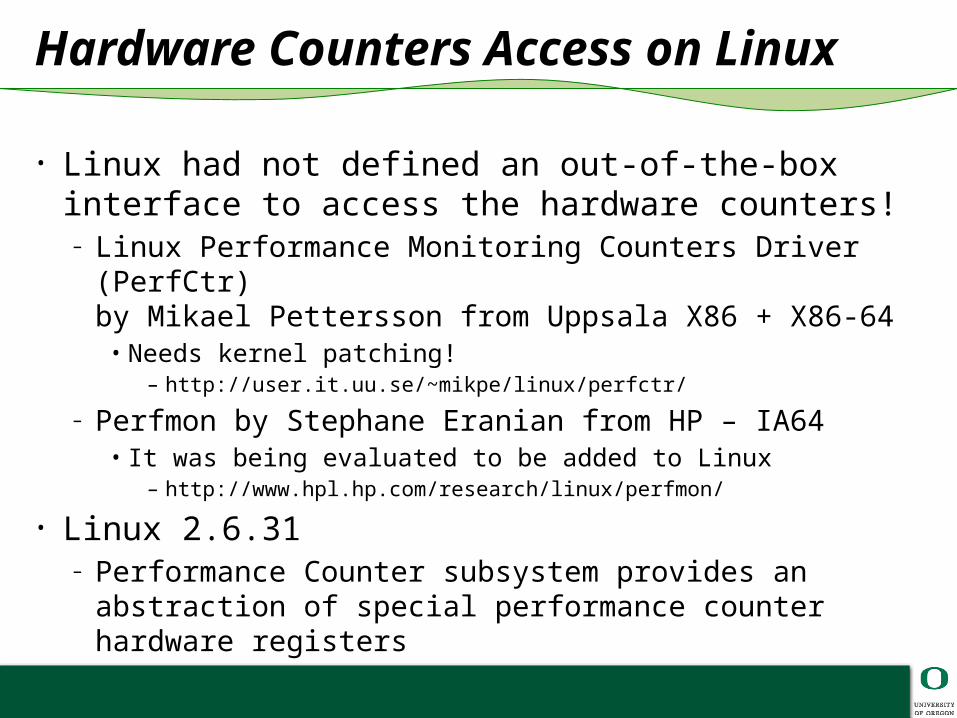
• Linux had not defined an out-of-the-box interface to access the hardware counters! – Linux Performance Monitoring Counters Driver (PerfCtr)
by Mikael Pettersson from Uppsala X86 + X86-64• Needs kernel patching!
– http://user.it.uu.se/~mikpe/linux/perfctr/
– Perfmon by Stephane Eranian from HP – IA64• It was being evaluated to be added to Linux
– http://www.hpl.hp.com/research/linux/perfmon/
• Linux 2.6.31– Performance Counter subsystem provides an abstraction of
special performance counter hardware registers
Utilities to Count Hardware Events
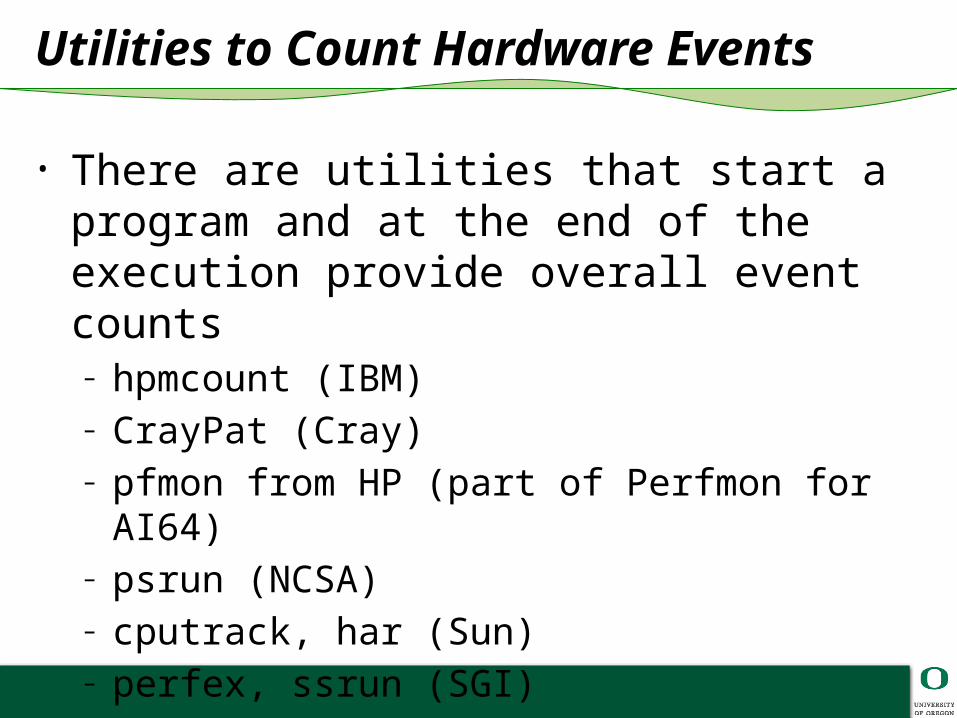
• There are utilities that start a program and at the end of the execution provide overall event counts – hpmcount (IBM)– CrayPat (Cray) – pfmon from HP (part of Perfmon for AI64)– psrun (NCSA)– cputrack, har (Sun)– perfex, ssrun (SGI)– perf (Linux 2.6.31)
PAPI – Performance API
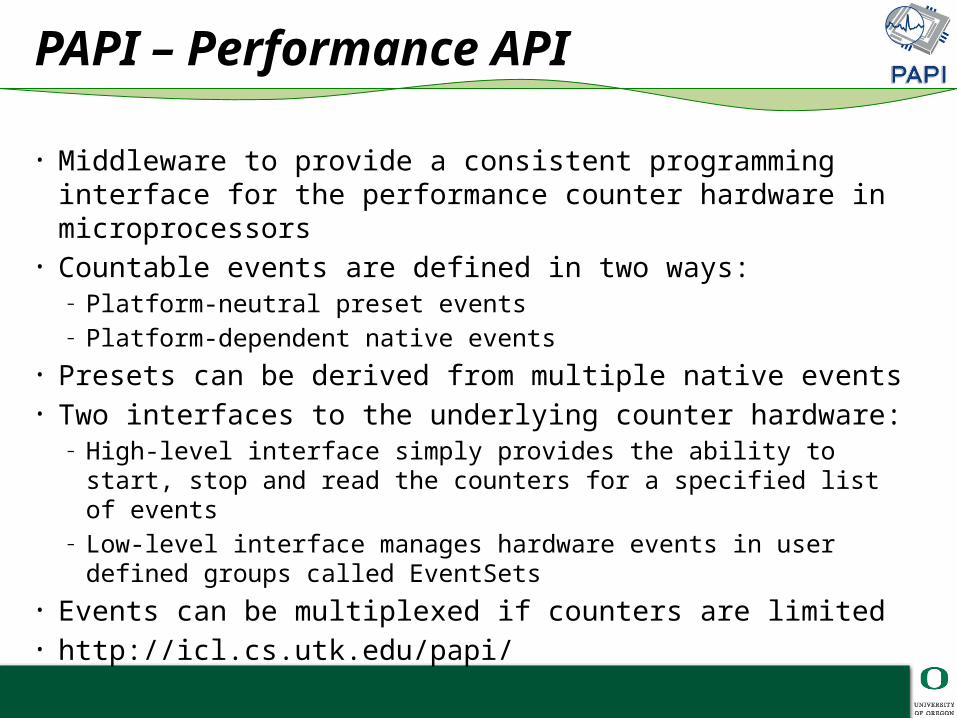
• Middleware to provide a consistent programming interface for the performance counter hardware in microprocessors
• Countable events are defined in two ways:– Platform-neutral preset events – Platform-dependent native events
• Presets can be derived from multiple native events• Two interfaces to the underlying counter hardware:
– High-level interface simply provides the ability to start, stop and read the counters for a specified list of events
– Low-level interface manages hardware events in user defined groups called EventSets
• Events can be multiplexed if counters are limited• http://icl.cs.utk.edu/papi/
II-17
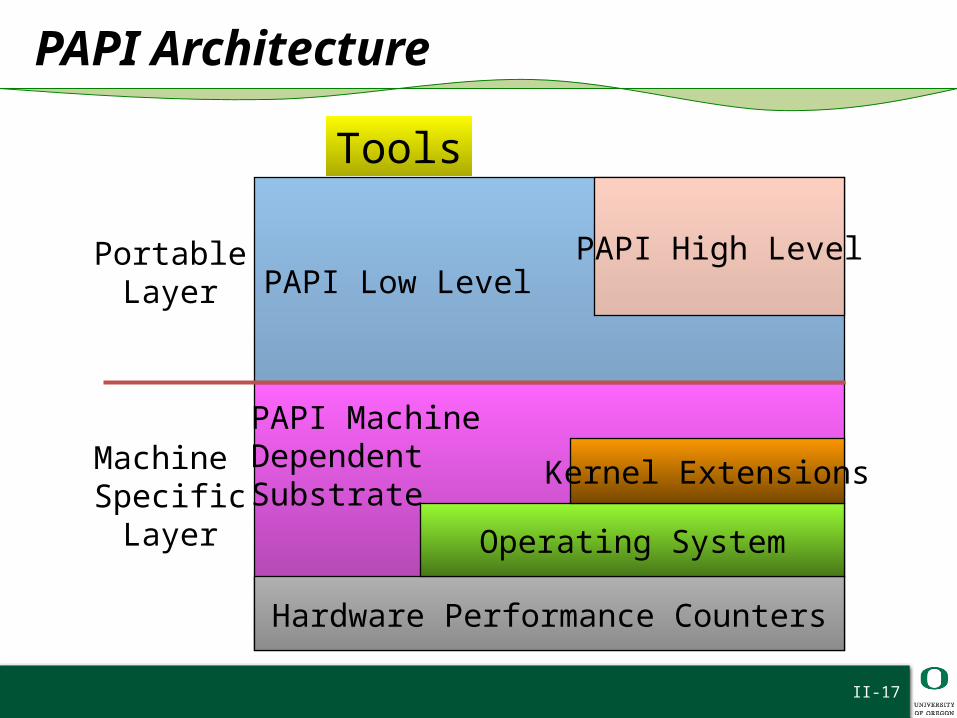
PAPI Architecture
PAPI MachineDependentSubstrate
PAPI Low LevelPortable
Layer
Tools
Hardware Performance Counters
Operating System
Kernel ExtensionsMachine SpecificLayer
PAPI High Level
PAPI Predefined Events
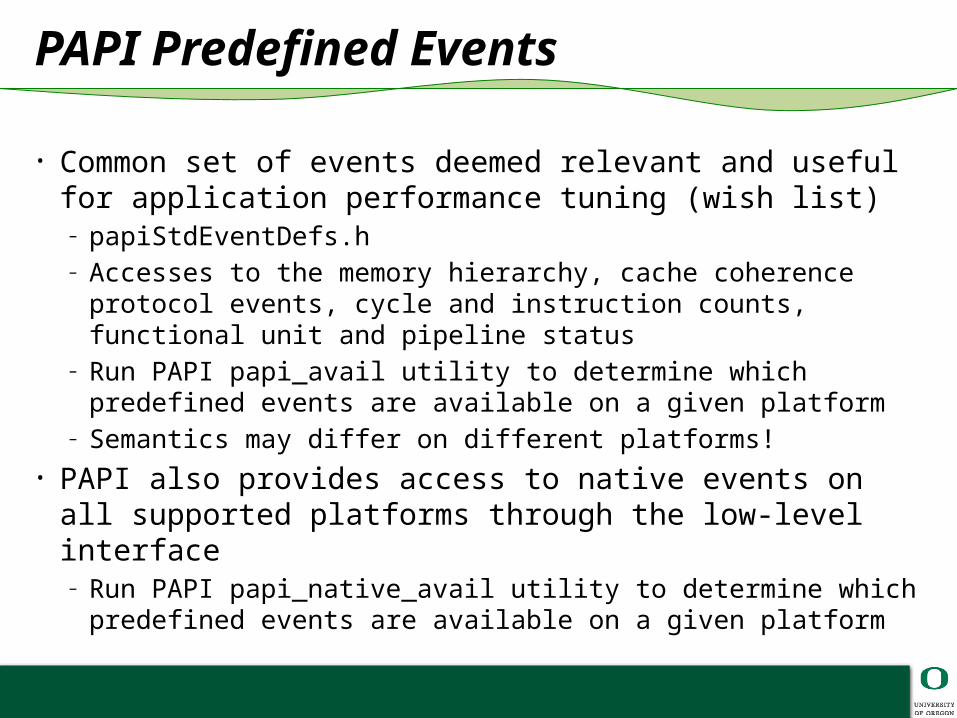
• Common set of events deemed relevant and usefulfor application performance tuning (wish list)– papiStdEventDefs.h– Accesses to the memory hierarchy, cache coherence protocol
events, cycle and instruction counts, functional unit and pipeline status
– Run PAPI papi_avail utility to determine which predefined events are available on a given platform
– Semantics may differ on different platforms!• PAPI also provides access to native events on all supported
platforms through the low-level interface– Run PAPI papi_native_avail utility to determine which predefined
events are available on a given platform
II-19
papi_avail Utility
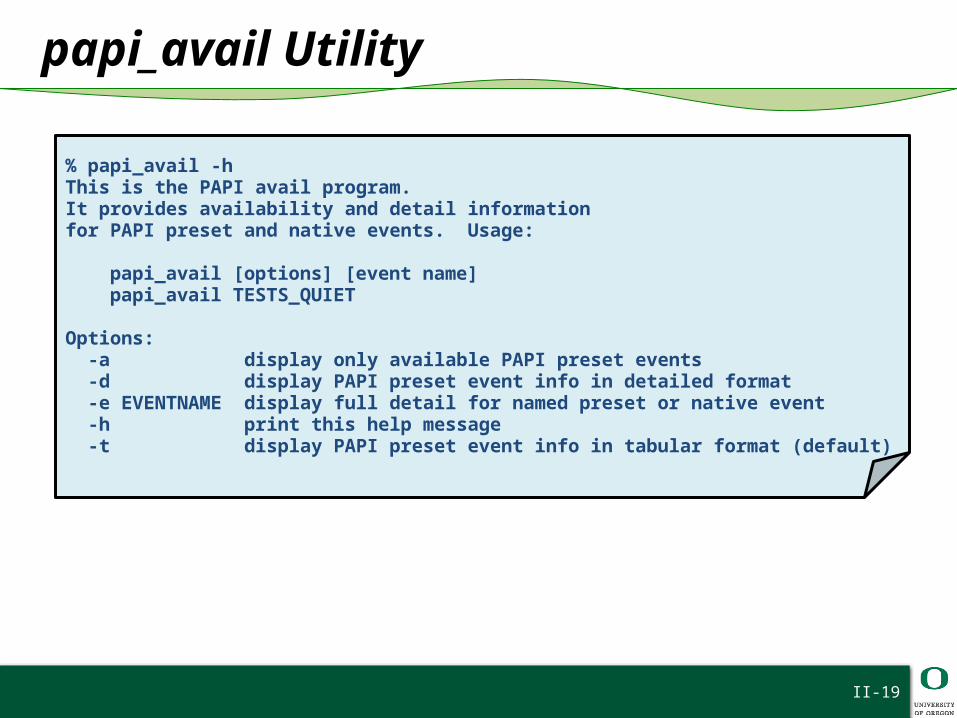
% papi_avail -hThis is the PAPI avail program.It provides availability and detail informationfor PAPI preset and native events. Usage:
papi_avail [options] [event name] papi_avail TESTS_QUIET
Options: -a display only available PAPI preset events -d display PAPI preset event info in detailed format -e EVENTNAME display full detail for named preset or native event -h print this help message -t display PAPI preset event info in tabular format (default)
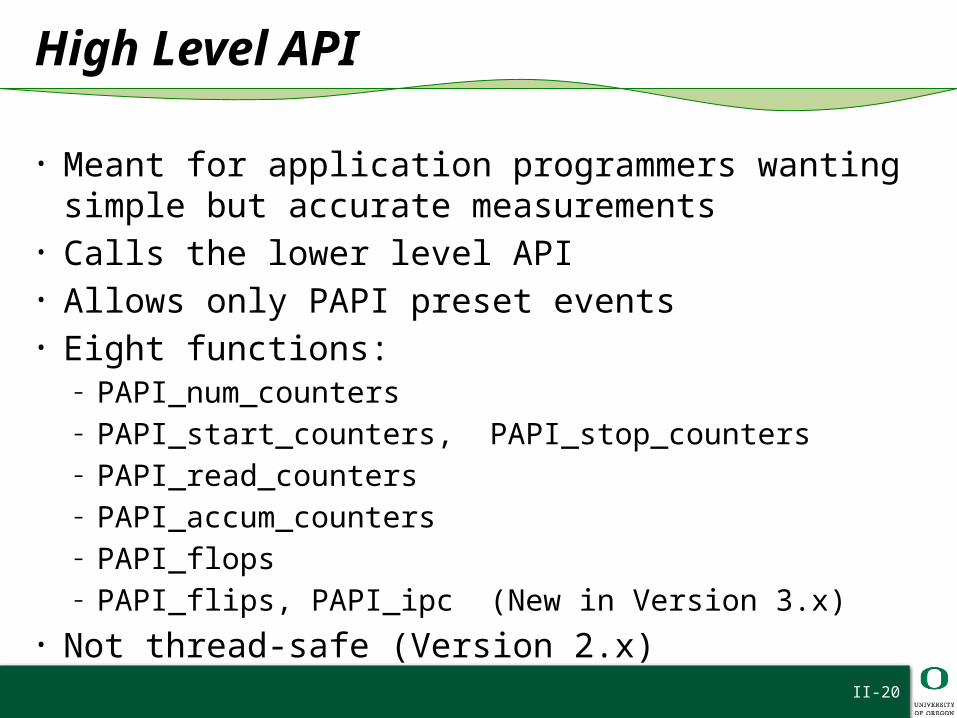
High Level API
• Meant for application programmers wantingsimple but accurate measurements
• Calls the lower level API• Allows only PAPI preset events• Eight functions:
– PAPI_num_counters– PAPI_start_counters, PAPI_stop_counters– PAPI_read_counters– PAPI_accum_counters– PAPI_flops– PAPI_flips, PAPI_ipc (New in Version 3.x)
• Not thread-safe (Version 2.x)II-20
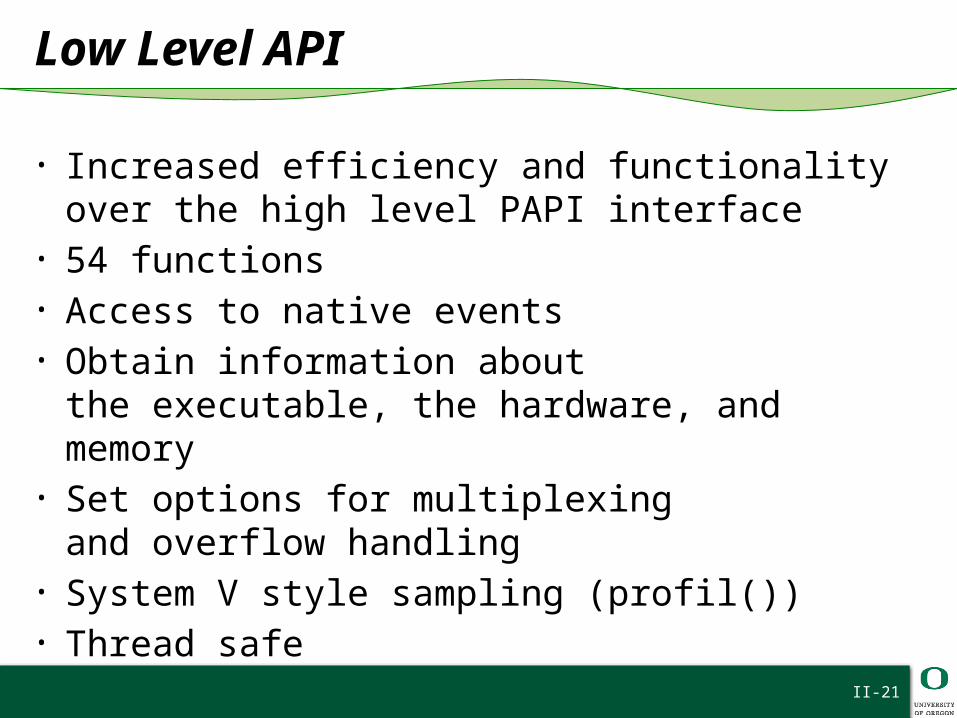
Low Level API
• Increased efficiency and functionalityover the high level PAPI interface
• 54 functions• Access to native events• Obtain information about
the executable, the hardware, and memory• Set options for multiplexing
and overflow handling• System V style sampling (profil())• Thread safe
II-21
22
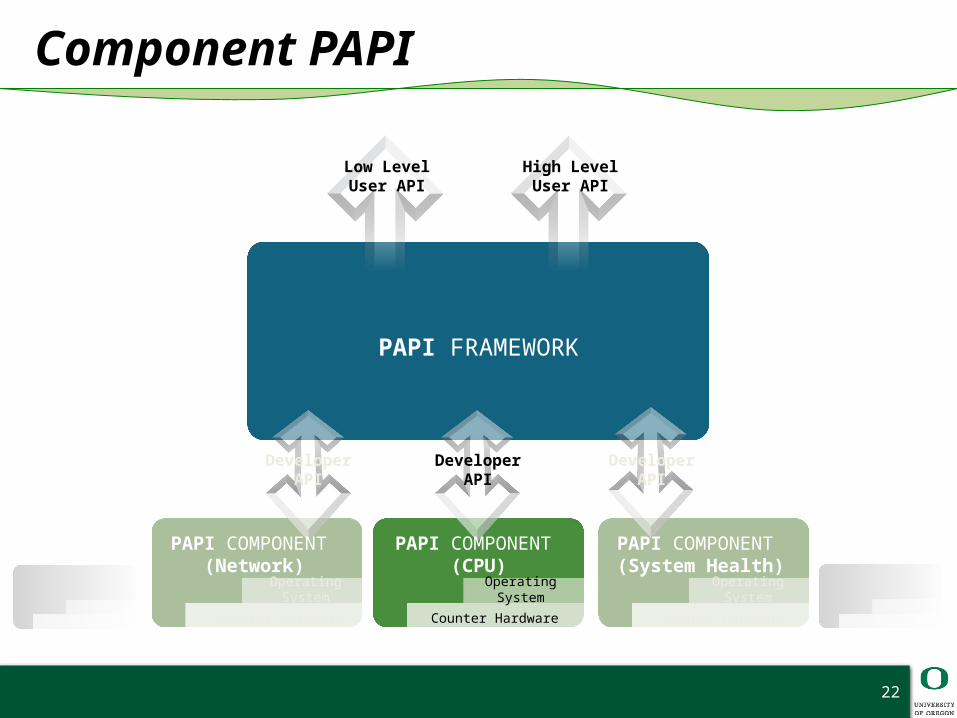
PAPI FRAMEWORK
Low LevelUser API
High LevelUser API
PAPI COMPONENT (CPU)
Operating System
Counter Hardware
Developer APIDeveloper API
PAPI COMPONENT (Network)
Operating System
Counter Hardware
PAPI COMPONENT (System Health)
Operating System
Counter Hardware
Developer API
Component PAPI
23
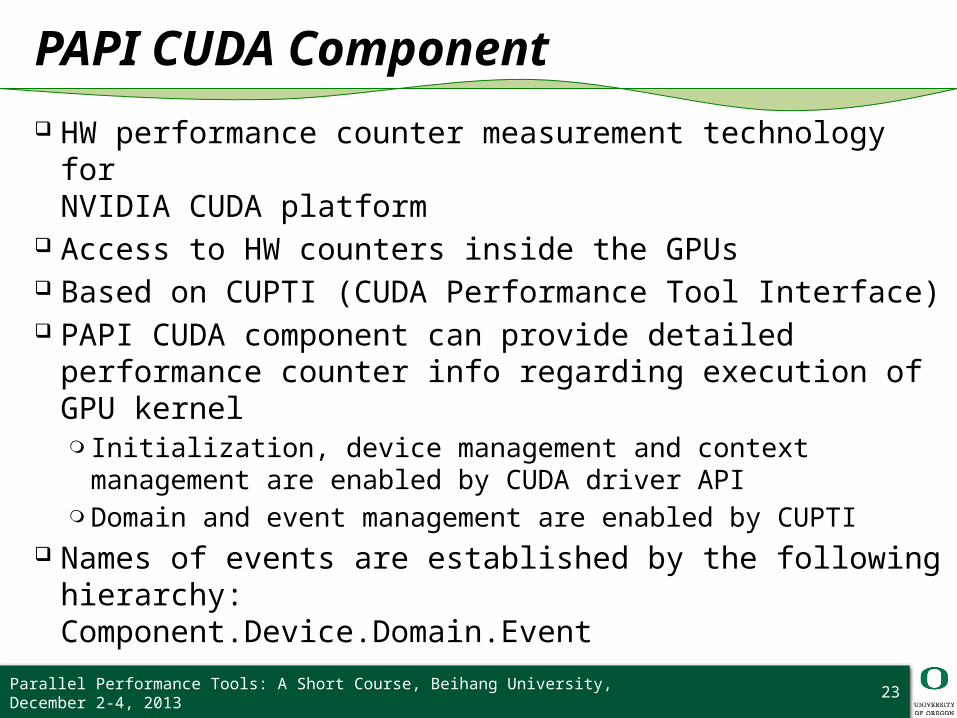
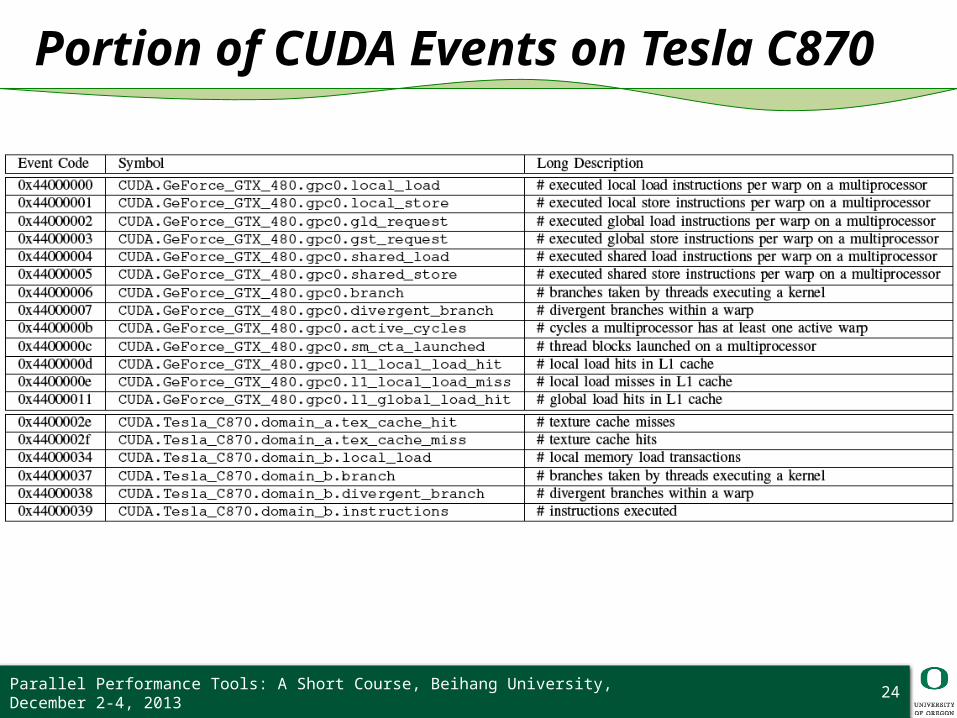
PAPI CUDA Component
HW performance counter measurement technology for NVIDIA CUDA platform
Access to HW counters inside the GPUs Based on CUPTI (CUDA Performance Tool Interface) PAPI CUDA component can provide detailed performance
counter info regarding execution of GPU kernel❍ Initialization, device management and context management are
enabled by CUDA driver API❍ Domain and event management are enabled by CUPTI
Names of events are established by the following hierarchy:Component.Device.Domain.Event
Parallel Performance Tools: A Short Course, Beihang University, December 2-4, 2013
Parallel Performance Tools: A Short Course, Beihang University, December 2-4, 2013 24
Portion of CUDA Events on Tesla C870
Source Instrumentation with Timers
Measuring performance using timers requires instrumentation❍ Have to uniquely identify code region (name)❍ Have to add code for timer start & stop❍ Have to compute delta and accumulate statistics
Hand-instrumenting becomes tedious very quickly, even for small software projects
Also a requirement for enabling instrumentation only when wanted❍ Avoids unnecessary overheads when not needed
Parallel Performance Tools: A Short Course, Beihang University, December 2-4, 2013 25
Program Database Toolkit (PDT)
University of Oregon, Research Center Juelich (FZJ Germany), Edison Design Group, Inc. (USA), LLNL (USA)
Automated instrumentation of C/C++, Fortran source code Source code parser(s) identify blocks such as function
boundaries, loop boundaries, generates a .PDB file for each source file
Instrumentor uses .PDB file to insert API calls into source code files at block enter/exit, outputs an instrumented code file
Instrumented source passed to compiler for compilation to object file
Linker links application with measurement library providing definitions for API calls
Free download: http://tau.uoregon.edu Parallel Performance Tools: A Short Course, Beihang University, December 2-4, 2013 26
PDT Architecture
Insert figure of PDT from TAU slides
Parallel Performance Tools: A Short Course, Beihang University, December 2-4, 2013 27
PMPI – MPI Standard Profiling Interface
The MPI (Message Passing Interface) standard defines a mechanism for instrumenting all API calls in an MPI implementation
Each MPI_* function call is actually a weakly defined interface that can be re-defined by performance tools
Each MPI_* function call eventually calls a corresponding PMPI_* function call which provides the expected MPI functionality
Performance tools can redefine MPI_* callsParallel Performance Tools: A Short Course, Beihang University, December 2-4, 2013 28
PMPI Example
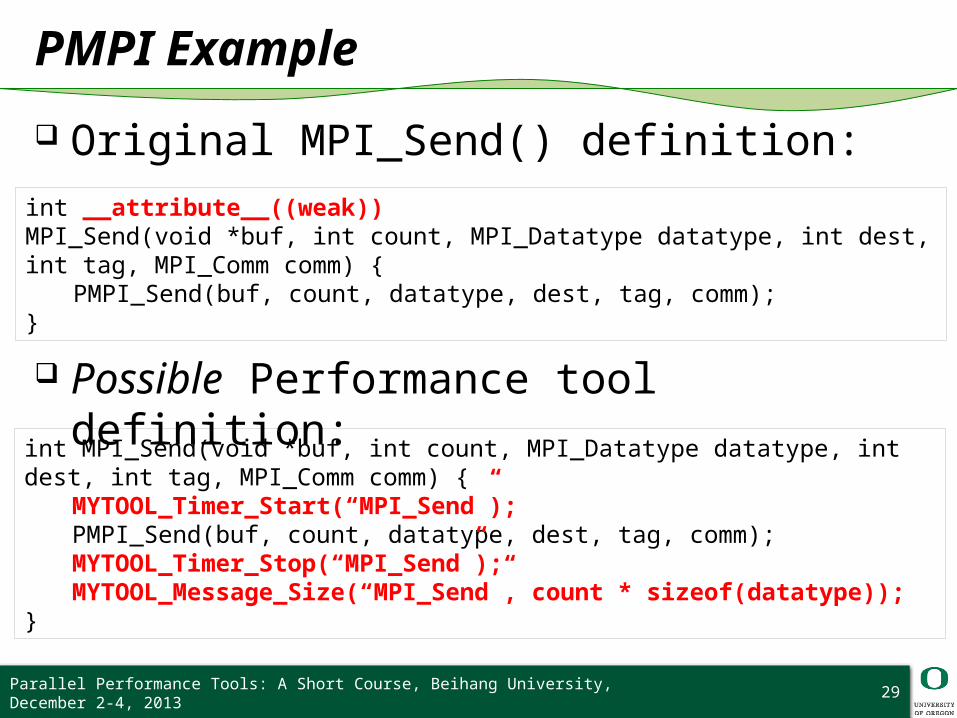
Original MPI_Send() definition:
Possible Performance tool definition:
Parallel Performance Tools: A Short Course, Beihang University, December 2-4, 2013 29
int __attribute__((weak))MPI_Send(void *buf, int count, MPI_Datatype datatype, int dest, int tag, MPI_Comm comm) {
PMPI_Send(buf, count, datatype, dest, tag, comm);}
int MPI_Send(void *buf, int count, MPI_Datatype datatype, int dest, int tag, MPI_Comm comm) {
MYTOOL_Timer_Start(“MPI_Send”);PMPI_Send(buf, count, datatype, dest, tag, comm);MYTOOL_Timer_Stop(“MPI_Send”);MYTOOL_Message_Size(“MPI_Send”, count *
sizeof(datatype));}
Compiler Instrumentation
Modern compilers provide the ability to instrument functions at compile time
Can exclude files, functions GCC example:
❍ -finstrument-functions parameter❍ Instruments function entry and exit(s)
void __cyg_profile_func_enter (void *this_fn, void *call_site);void __cyg_profile_func_exit (void *this_fn, void *call_site);
Parallel Performance Tools: A Short Course, Beihang University, December 2-4, 2013 30
Compiler Instrumentation – tool interface
Measurement libraries have to implement those two functions:
void __cyg_profile_func_enter (void *this_fn, void *call_site);void __cyg_profile_func_exit (void *this_fn, void *call_site);
The function and call site pointers are instruction addresses
How to resolve those addresses to source code locations?❍ Binutils (libbfd, libiberty)
Parallel Performance Tools: A Short Course, Beihang University, December 2-4, 2013 31
Binary Instrumentation
Source Instrumentation not possible in all cases❍ Exotic / Domain Specific Languages (no parser
support)❍ Pre-compiled system libraries❍ Utility libraries without source available
Binary instrumentation modifies the existing executable and all libraries, adding user-specified function entry/exit API calls
Can be done once, or as first step of execution
Parallel Performance Tools: A Short Course, Beihang University, December 2-4, 2013 32
Binary Instrumentation: Dyninst API
University of Wisconsin, University of Maryland Provides binary instrumentation for runtime code
patching:❍ Performance Measurement Tools❍ Correctness Debuggers (efficient data breakpoints)❍ Execution drive simulations❍ Computational Steering
http://www.dyninst.org
Parallel Performance Tools: A Short Course, Beihang University, December 2-4, 2013 33
Binary Instrumentation: PEBIL
San Diego Supercomputing Center / PMaC group Static binary instrumentation for x86_64 Linux
http://www.sdsc.edu/PMaC/projects/pebil.html
Parallel Performance Tools: A Short Course, Beihang University, December 2-4, 2013 34
Parallel Performance Tools: A Short Course, Beihang University, December 2-4, 2013 35
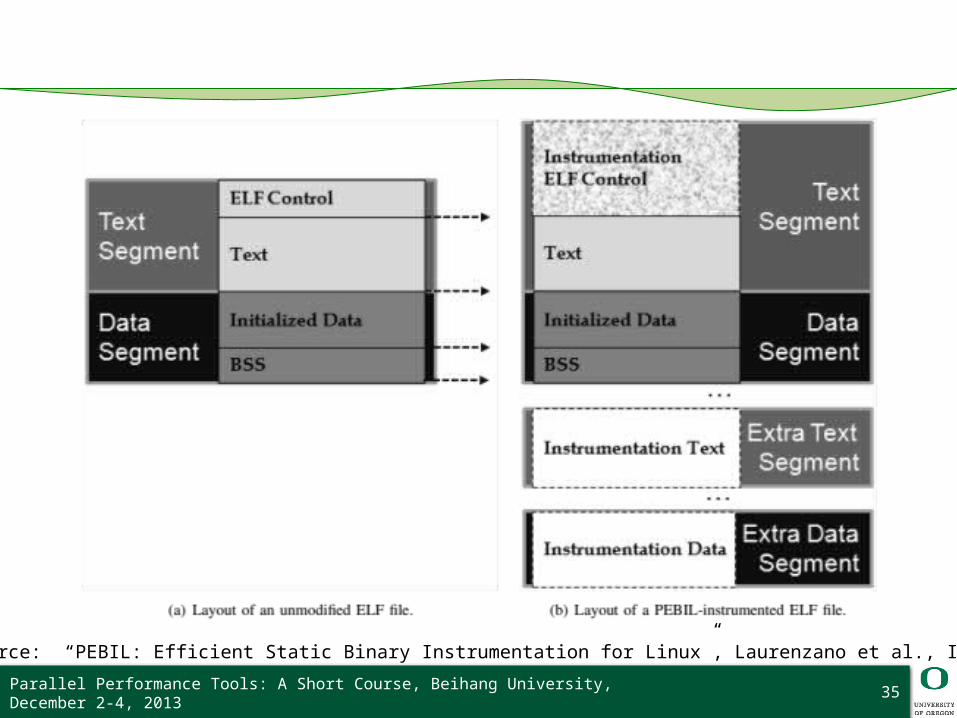
Image source: “PEBIL: Efficient Static Binary Instrumentation for Linux”, Laurenzano et al., ISPASS 2010
Binary Instrumentation: MAQAO
Modular Assembly Quality Analyzer and Optimizer
Tool for analyzing and optimizing binary code Intel64 and Xeon Phi architectures supported http://maqao.org
Parallel Performance Tools: A Short Course, Beihang University, December 2-4, 2013 36
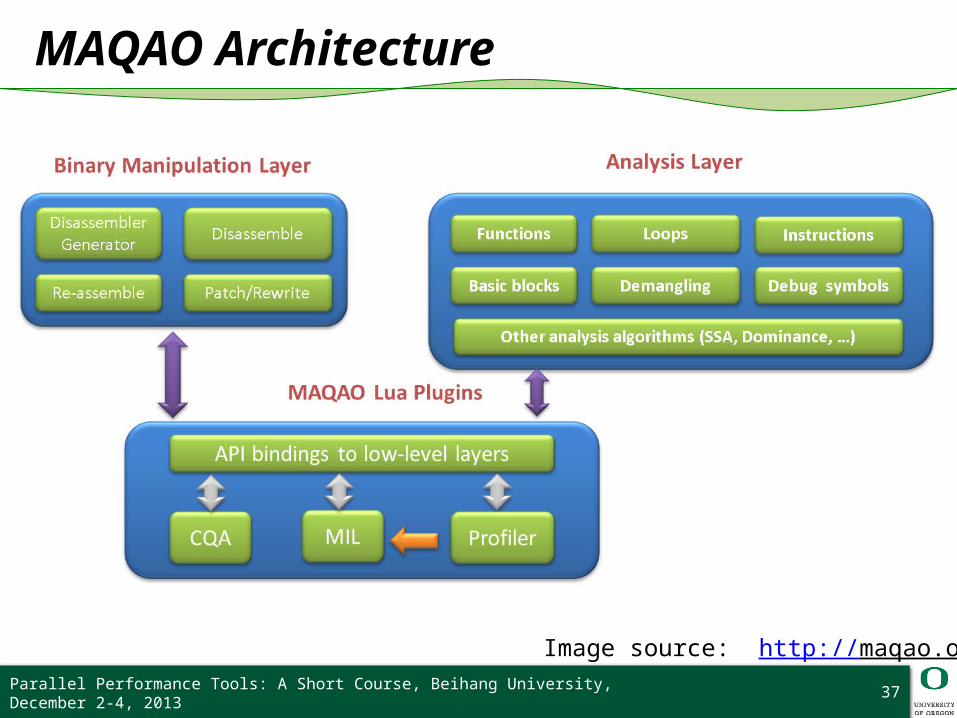
MAQAO Architecture
Parallel Performance Tools: A Short Course, Beihang University, December 2-4, 2013 37
Image source: http://maqao.org
Runtime Measurement Support
Some runtime systems provide callback mechanisms for function entry / exit or state transitions❍ Java JVM❍ Python❍ Some OpenUH runtimes (Collector API, OMPT)
◆Sun/Oracle, OpenUH, Intel (in development)
Measurement tools / libraries:❍ implement event handlers for callback functions❍ register with the runtime, are notified when events
happenParallel Performance Tools: A Short Course, Beihang University, December 2-4, 2013 38
Periodic Sampling – what is it?
The application is interrupted after a specified period of time
Interruption handler queries the program state The timer is reset and the process repeats until
program termination Either at termination or during handler, a statistical
profile is constructed Sampling theory states that the state (function)
sampled the most frequently is the most time consuming state (function)
Parallel Performance Tools: A Short Course, Beihang University, December 2-4, 2013 39
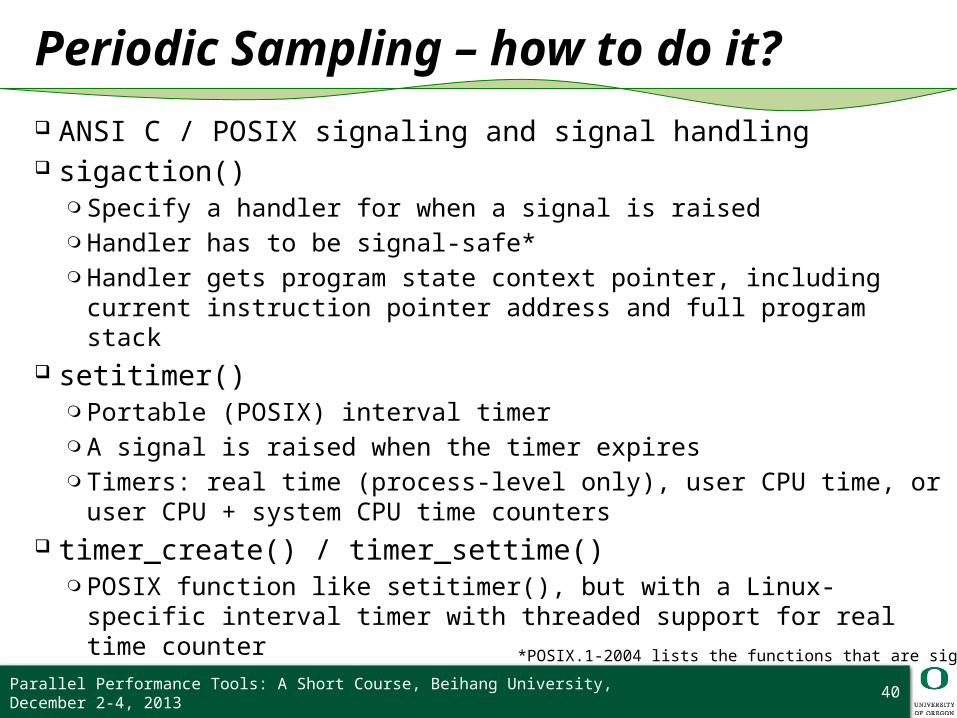
Periodic Sampling – how to do it?
ANSI C / POSIX signaling and signal handling sigaction()
❍ Specify a handler for when a signal is raised❍ Handler has to be signal-safe*❍ Handler gets program state context pointer, including current instruction
pointer address and full program stack setitimer()
❍ Portable (POSIX) interval timer❍ A signal is raised when the timer expires❍ Timers: real time (process-level only), user CPU time, or user CPU +
system CPU time counters timer_create() / timer_settime()
❍ POSIX function like setitimer(), but with a Linux-specific interval timer with threaded support for real time counter
Parallel Performance Tools: A Short Course, Beihang University, December 2-4, 2013 40
*POSIX.1-2004 lists the functions that are signal-safe
Address Resolution: GNU Binutils
Compiler instrumentation and signal handling deal with instruction pointer addresses
Binutils provides utilities and libraries for looking up addresses and getting function name, source code file and line number❍ Source info available if code compiled with –g
Iterates over executable and any shared object libraries (if applicable) to find address
Command line version:❍ addr2line –f –e <executable> <address_1> … <address_n>
http://www.gnu.org/software/binutils/ Parallel Performance Tools: A Short Course, Beihang University, December 2-4, 2013 41
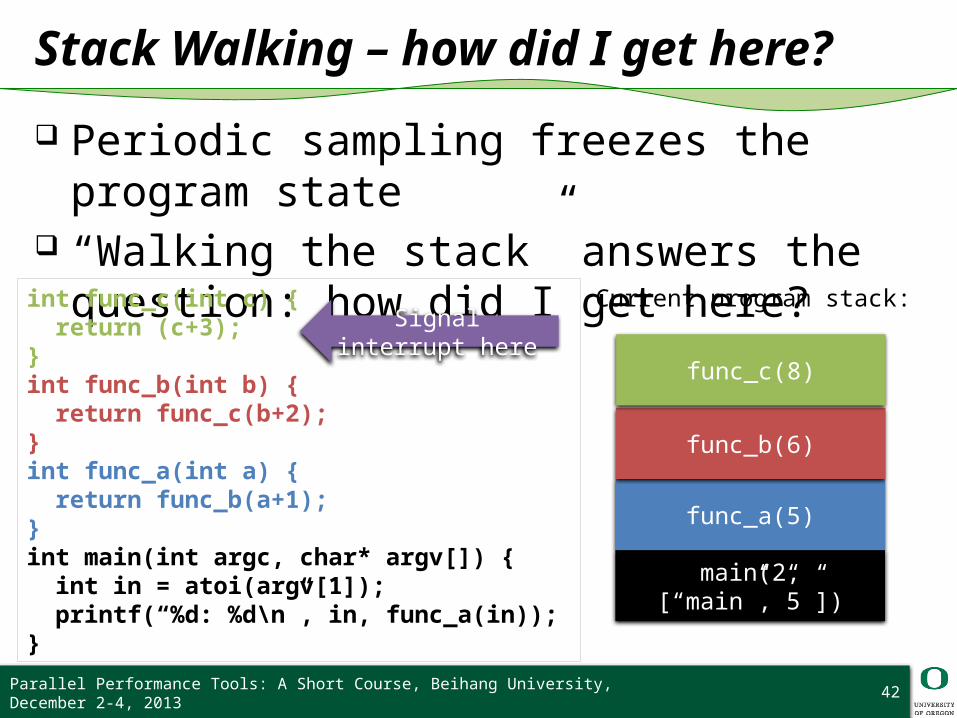
Stack Walking – how did I get here?
Periodic sampling freezes the program state “Walking the stack” answers the question: how did
I get here?
Parallel Performance Tools: A Short Course, Beihang University, December 2-4, 2013 42
int func_c(int c) { return (c+3);}int func_b(int b) { return func_c(b+2);}int func_a(int a) { return func_b(a+1);}int main(int argc, char* argv[]) { int in = atoi(argv[1]); printf(“%d: %d\n”, in, func_a(in));}
Signal interrupt here
main(2, [“main”,”5”])
func_a(5)
func_b(6)
func_c(8)
Current program stack:
Stack Walking: libunwind
Libunwind defines a portable and efficient C programming interface (API) to determine the call-chain of a program
Provides the means to manipulate the preserved (callee-saved) state of each call-frame and to resume execution at any point in the call-chain (non-local goto)
Supports both local (same-process) and remote (across-process) operation.
Developed and supported by the Free Software Foundation (FSF)
https://savannah.nongnu.org/projects/libunwind/ Parallel Performance Tools: A Short Course, Beihang University, December 2-4, 2013 43
Stack Walking: StackWalkerAPI
University of Wisconsin, University of Maryland An API that allows users to collect a call stack and
access information about its stack frames Support for Linux (x86_64, AMD-64, Power,
Power-64), BlueGene/L and BlueGene/P http://www.dyninst.org/stackwalker
Parallel Performance Tools: A Short Course, Beihang University, December 2-4, 2013 44