Embed Size (px)
DESCRIPTION
Lecture 3
Citation preview

User Traffic Modeling for Future Mobile Systems• The goal was to gain new knowledge and develop expertise about the fine
structure functionality of packet data traffic for the development of future mobiledata systems.
• To create a model, which adequately describes the characteristics of theindividual user’s connection over different time scales.
• A special interest in the lower levels of the time scale• Packet data traffic measurements for
- WWW service in laboratory LAN 1996 and 1999 and WLAN 1997.- WAP over GSM data and over GPRS from a test WAP-gateway 2000-2002
• The data was grouped by individual connections and analyzed based on theprotocols used.
• The statistics were modeled based on events of WWW session- Developed from the ETSI packet data model (referred Ch. 10.1)- measured distributions are fitted to some analytic distributions- aim is to get parameters for simulation model(s)- intended to developing radio link protocols and radio network planning

Wired vs. Mobile Data Traffic
• In fixed networks- bandwidth is large and rapidly growing and transmission errors are rare- most crucial elements are the centralized components like main trunks, routers
or servers- one of the main problems is the aggregate traffic of numerous users, which
overloads these relatively few "bottlenecks"=> the traffic should be measured from the "hot spots".
• In mobile networks- Bandwidth is quite limited and the probability of transmission errors is rather
high- Few active users can make use of most of the traffic capacity available in a
cell- The main "bottleneck" is the air interface at the edge of network
=> the traffic should be measured as close to the client as possible.
• In WCDMA BER/FER performance is optimized based on average Eb/N0
- The average Eb/N0 is not accurate if high bit rate packet users cause rapidchanges in interference.
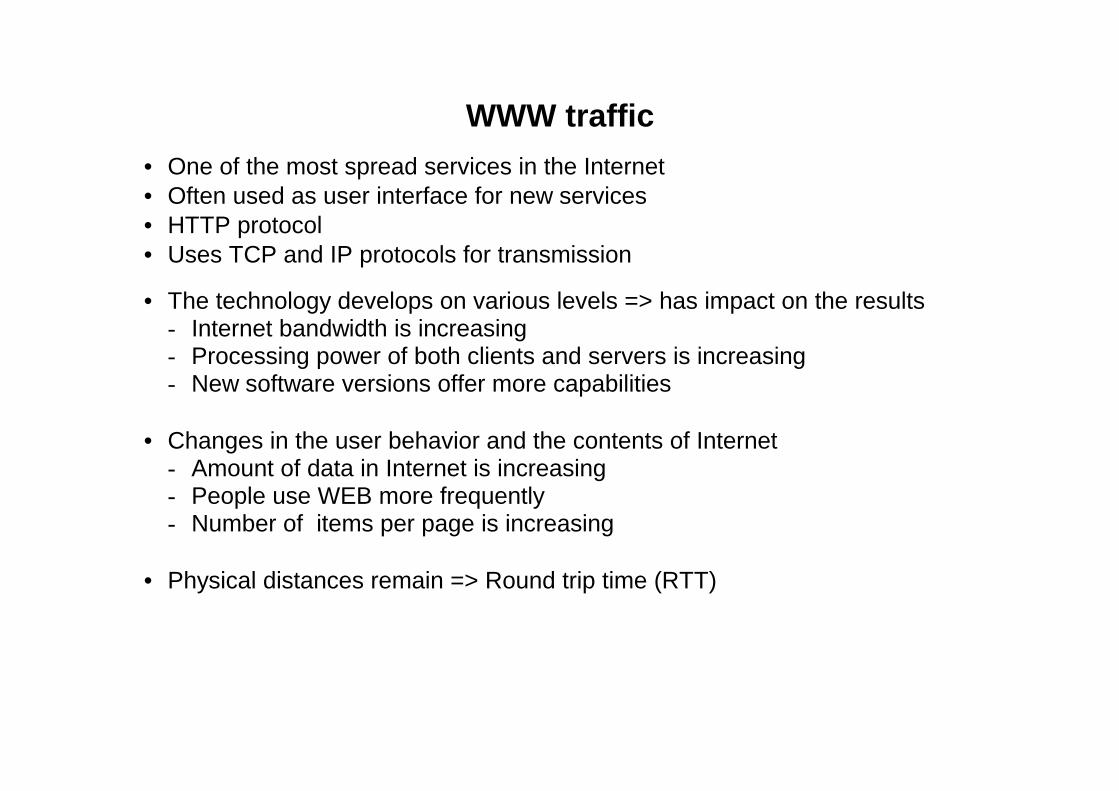
WWW traffic
• One of the most spread services in the Internet• Often used as user interface for new services• HTTP protocol• Uses TCP and IP protocols for transmission
• The technology develops on various levels => has impact on the results- Internet bandwidth is increasing- Processing power of both clients and servers is increasing- New software versions offer more capabilities
• Changes in the user behavior and the contents of Internet- Amount of data in Internet is increasing- People use WEB more frequently- Number of items per page is increasing
• Physical distances remain => Round trip time (RTT)
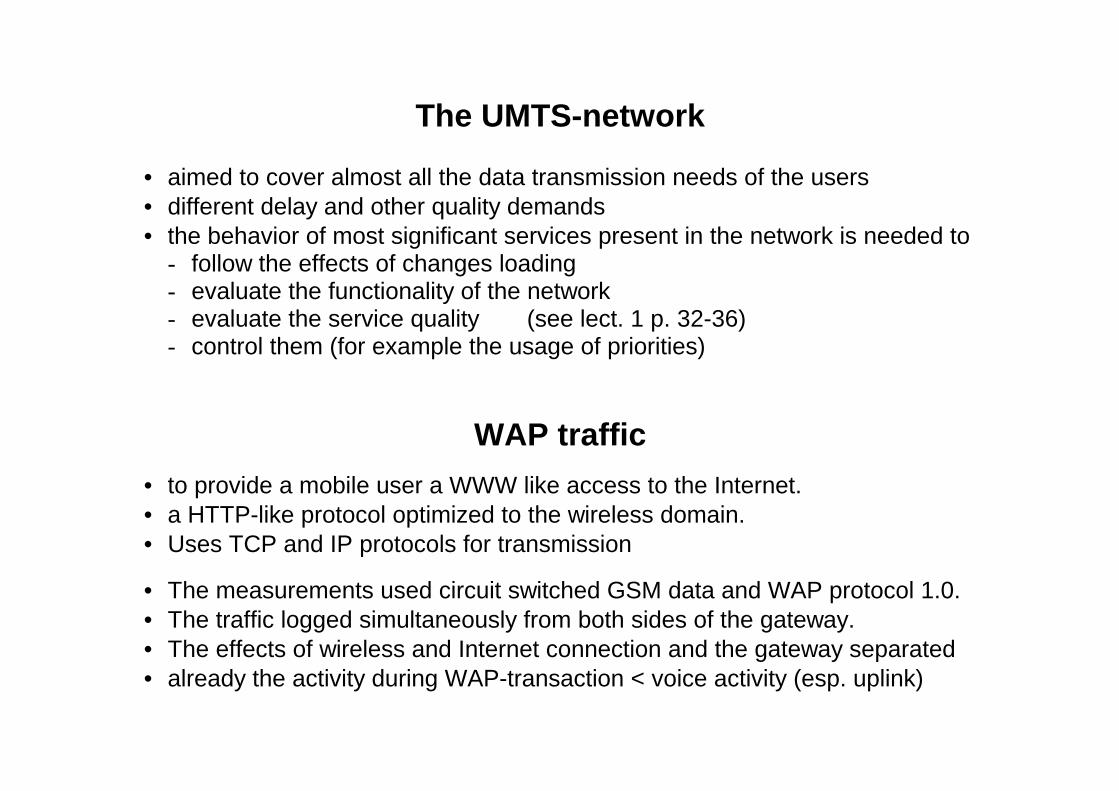
The UMTS-network
• aimed to cover almost all the data transmission needs of the users• different delay and other quality demands• the behavior of most significant services present in the network is needed to
- follow the effects of changes loading- evaluate the functionality of the network- evaluate the service quality (see lect. 1 p. 32-36)- control them (for example the usage of priorities)
WAP traffic
• to provide a mobile user a WWW like access to the Internet.• a HTTP-like protocol optimized to the wireless domain.• Uses TCP and IP protocols for transmission
• The measurements used circuit switched GSM data and WAP protocol 1.0.• The traffic logged simultaneously from both sides of the gateway.• The effects of wireless and Internet connection and the gateway separated• already the activity during WAP-transaction < voice activity (esp. uplink)
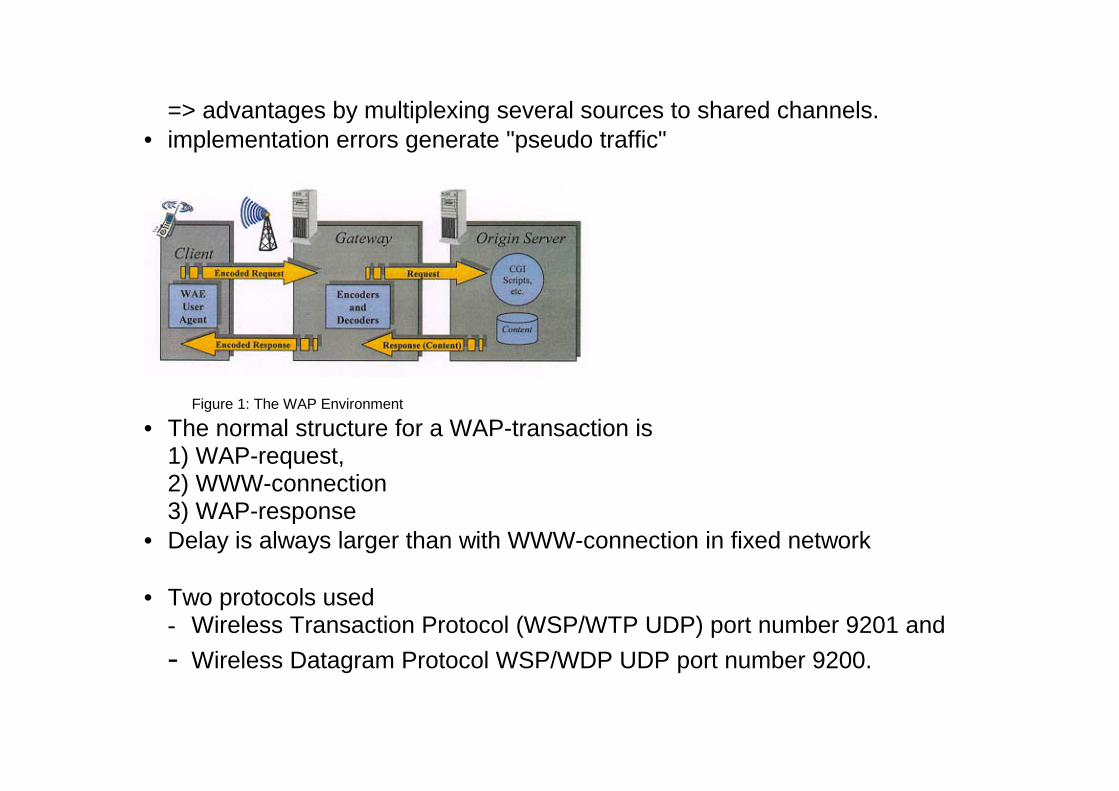
=> advantages by multiplexing several sources to shared channels.• implementation errors generate "pseudo traffic"
Figure 1: The WAP Environment
• The normal structure for a WAP-transaction is1) WAP-request,2) WWW-connection3) WAP-response
• Delay is always larger than with WWW-connection in fixed network
• Two protocols used- Wireless Transaction Protocol (WSP/WTP UDP) port number 9201 and
- Wireless Datagram Protocol WSP/WDP UDP port number 9200.
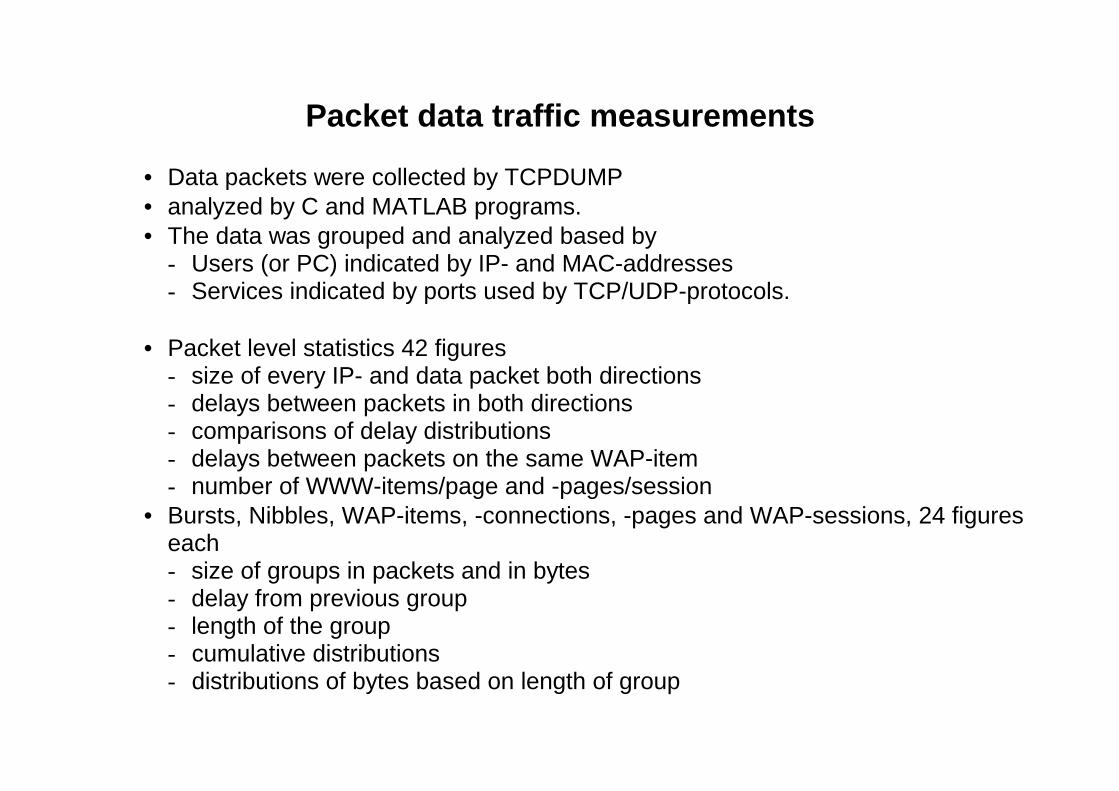
Packet data traffic measurements
• Data packets were collected by TCPDUMP• analyzed by C and MATLAB programs.• The data was grouped and analyzed based by
- Users (or PC) indicated by IP- and MAC-addresses- Services indicated by ports used by TCP/UDP-protocols.
• Packet level statistics 42 figures- size of every IP- and data packet both directions- delays between packets in both directions- comparisons of delay distributions- delays between packets on the same WAP-item- number of WWW-items/page and -pages/session
• Bursts, Nibbles, WAP-items, -connections, -pages and WAP-sessions, 24 figureseach- size of groups in packets and in bytes- delay from previous group- length of the group- cumulative distributions- distributions of bytes based on length of group

The used definitions
Packet IP-packet
Nibble Smallest burst of data, which UMTS would distinguish.group separated with idle > 10 ms.
Burst active transmission, group separated with idle > 2 s.
TCP/ WSP- A numbered connection/transaction between WWW-connection server and -client or WAP-gateway and -client.
One TCP-connection can carry tens of WWW-items.
WWW/WAP- A request/response pair transferring NEW payload data text,item picture etc., on same TCP/WSP-connection
WWW/WAP- WAP-items that forms one visual display unit. Separatedpage by a reading period, defined from 1 to 300 seconds.
WWW/WAP- A period when client is active. Separated by inactivity of nosession WWW/WAP-page during 5 minutes (= reading time > 5 min.)
Creating the model
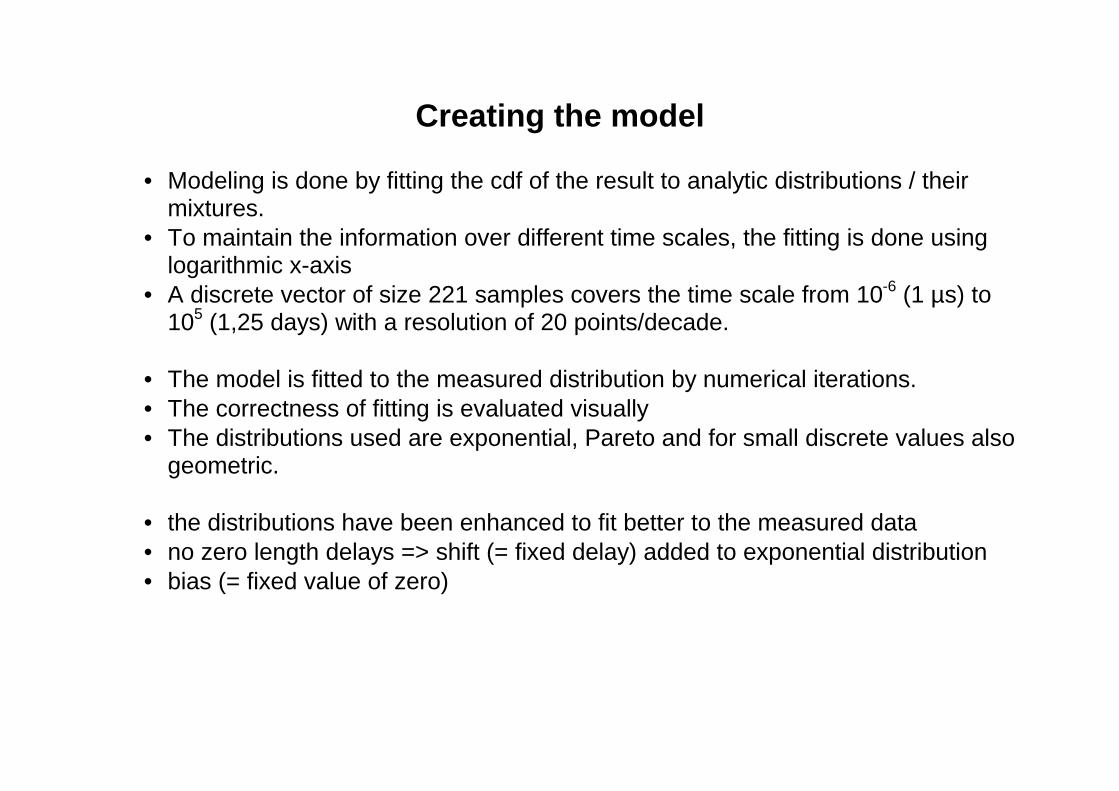
• Modeling is done by fitting the cdf of the result to analytic distributions / theirmixtures.
• To maintain the information over different time scales, the fitting is done usinglogarithmic x-axis
• A discrete vector of size 221 samples covers the time scale from 10-6 (1 µs) to105 (1,25 days) with a resolution of 20 points/decade.
• The model is fitted to the measured distribution by numerical iterations.• The correctness of fitting is evaluated visually• The distributions used are exponential, Pareto and for small discrete values also
geometric.
• the distributions have been enhanced to fit better to the measured data• no zero length delays => shift (= fixed delay) added to exponential distribution• bias (= fixed value of zero)

The Pareto distribution
• is defined by
1( ) ,x
kf x x k
x
α
αα
+
⋅= ≥ (0.1)
0 ,( )
1 ( ) ,x
k xF x k k xx
α
<= − ≤(0.2)
, 11
kαµ αα
= ≥− (0.3)
22 , 2
( 2) ( 1)
k ασ αα α
⋅= >− ⋅ − (0.4)
• when α < 2 the variance and when α < 1 also the mean become infinite• normally the Pareto distribution is limited to area 1 < α < 2
Truncating the Pareto distribution
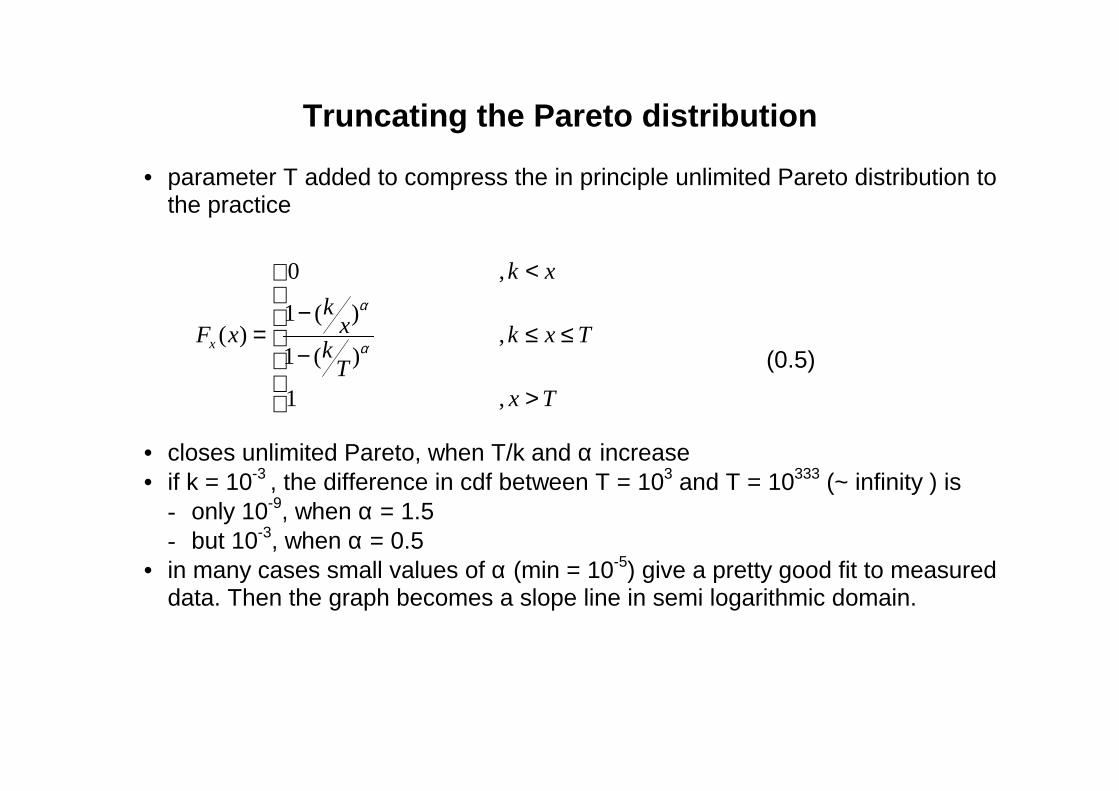
• parameter T added to compress the in principle unlimited Pareto distribution tothe practice
0 ,
1 ( )( ) ,
1 ( )
1 ,
x
k x
kxF x k x T
kT
x T
α
α
<
−= ≤ ≤
− >
(0.5)
• closes unlimited Pareto, when T/k and α increase• if k = 10-3 , the difference in cdf between T = 103 and T = 10333 (~ infinity ) is
- only 10-9, when α = 1.5- but 10-3, when α = 0.5
• in many cases small values of α (min = 10-5) give a pretty good fit to measureddata. Then the graph becomes a slope line in semi logarithmic domain.
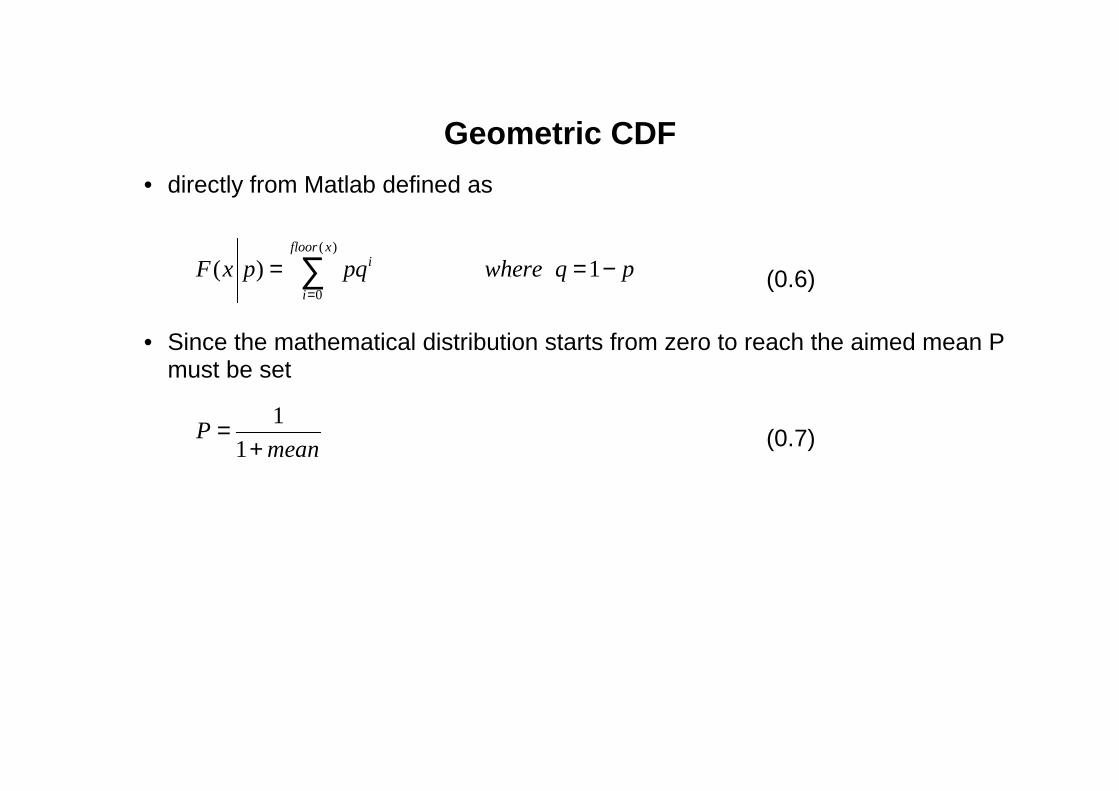
Geometric CDF
• directly from Matlab defined as
( )
0
( ) 1floor x
i
i
F x p pq where q p=
= = −∑ (0.6)
• Since the mathematical distribution starts from zero to reach the aimed mean Pmust be set
1
1P
mean=
+ (0.7)

The developed traffic data models
• The selected statistics were fitted to analytic distributions• simple model is one CDF and partial model is weighted sum of one exponential
and two truncated Pareto CDFs• models are a collection of several measurable distributions on different levels in
top-down order• the mean and variance for the measured data and the models• error value used as the measure in curve fitting
WWW-traffic data model
• model is a collection of eleven measurable distributions on three levels asdescribed in figure 3 in top-down order:
1. The WWW-session interarrival time Dwww2. The number of packet calls (pages) per WWW-session Npc3. The reading time between packet calls (WWW-pages) Dpc4. The number of items per WWW-page Ni.5. The time intervals between items belonging the same WWW-page Dpii

6. The number and size of packets belonging to an WWW-item are conductedabout the information about the TCP-protocols mechanisms and their influencesand the distributions of6.1. WWW-item sizes on Uplink Siu6.2. WWW-item sizes on Downlink Sid
7. The time intervals between packets belonging the same WWW-item are dividedin four subcategories to adapt to the different delay behavior depending on thedirection of transmission7.1. the time int. between two consecutive Uplink packets inside an item Diuu7.2. the time interval from Uplink to Downlink packet inside an item Diud7.3. the time int. between two cons. Downlink packets inside an item Didd7.4. the time interval from Downlink to Uplink packet inside an item Didu
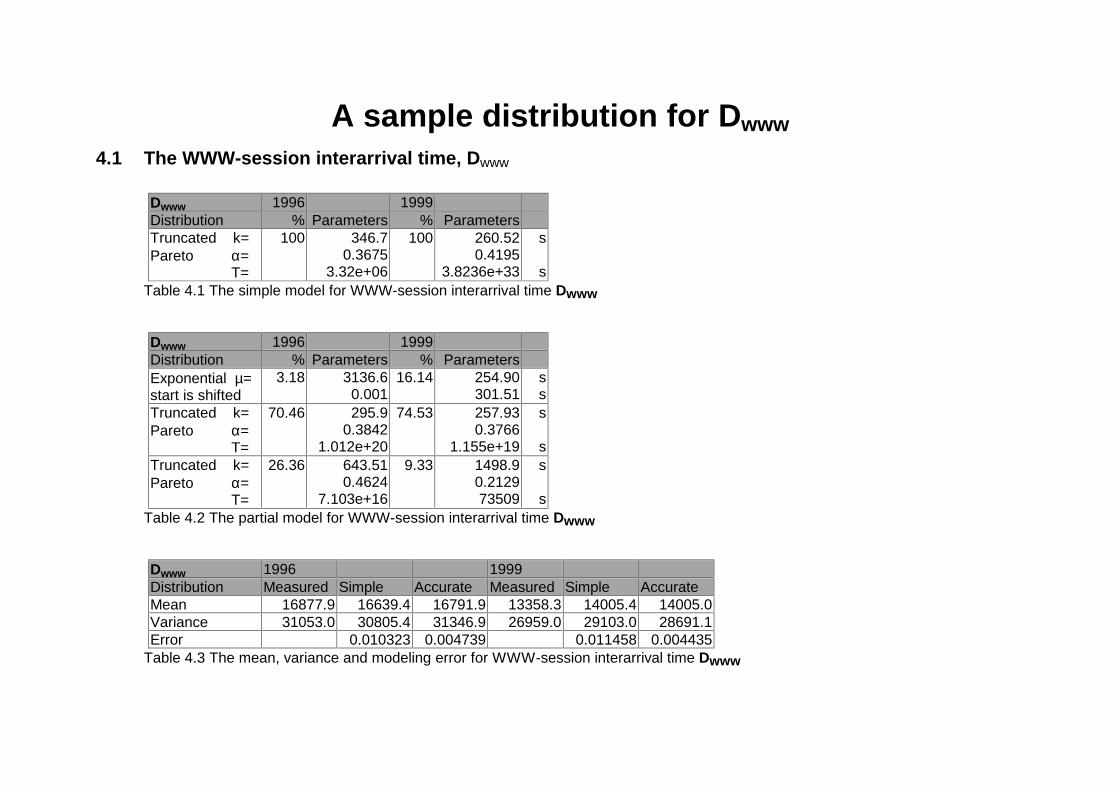
To make comparison easier each distribution for both models are presented in atable for both 1996 and 1999 measurements. In a third table there is a comparisonof the mean and variance for the measured data and the both models. There isalso the error value, which was used as the measure in numerical curve fitting andoptimization. It is the sum of squared error between the CDF vectors for measureddata and the model.
A sample distribution for Dwww
4.1 The WWW-session interarrival time, Dwww
Dwww 1996 1999Distribution % Parameters % ParametersTruncated k=Pareto α=
T=
100 346.70.3675
3.32e+06
100 260.520.4195
3.8236e+33
s
sTable 4.1 The simple model for WWW-session interarrival time Dwww
Dwww 1996 1999Distribution % Parameters % ParametersExponential µ=start is shifted
3.18 3136.60.001
16.14 254.90301.51
ss
Truncated k=Pareto α=
T=
70.46 295.90.3842
1.012e+20
74.53 257.930.3766
1.155e+19
s
sTruncated k=Pareto α=
T=
26.36 643.510.4624
7.103e+16
9.33 1498.90.212973509
s
sTable 4.2 The partial model for WWW-session interarrival time Dwww
Dwww 1996 1999Distribution Measured Simple Accurate Measured Simple AccurateMean 16877.9 16639.4 16791.9 13358.3 14005.4 14005.0Variance 31053.0 30805.4 31346.9 26959.0 29103.0 28691.1Error 0.010323 0.004739 0.011458 0.004435
Table 4.3 The mean, variance and modeling error for WWW-session interarrival time Dwww

WAP-traffic data model
• model is a collection of twelve measurable distributions on three levels asdescribed in figure 3 in top-down order:
1. The WAP-session interarrival time Dwap
2. The number of packet calls (pages) per WWW-session Npc
3. The reading time between packet calls (WAP-items) Dpc
4. The number and size of packets belonging to an WAP-item are conducted aboutthe information about the TCP-protocols mechanisms and their influences andthe distributions of- WAP-item sizes on Uplink Siu
- WAP-item sizes on Downlink Sid
5. The timing during a WAP-item is divided in five (WDP) or seven (WTP) parts tocorrespond to the model presented in figure 2- the transmission time of the Uplink packet (WAP-request, begin an item) Dwu
- the processing time of WAP-request Dpu
- the WWW-transaction waiting time Dwww
- the processing time of WAP-response Dpd
- the transmission time of the Downlink packet (WAP-response) Dwd
- the acknowledgement times on Uplink Dau and Downlink Dad
• Presently there are distributions for the WAP-item size and WAP-transactionsinternal timings
• With Dwap , Npc and Dpc the problem is that IP address often changes duringWAP-sessions, when GSM-data connection disconnects for idle periods. Afterthat there in no information about the original user.
• a “browser-session” does not model users on the higher levels.• 122 550 WAP/WWW-items are distributed to 11697 “browser-sessions” of which
~ 10 % do overlap and only ~60 % are separated by over 5 minute period.
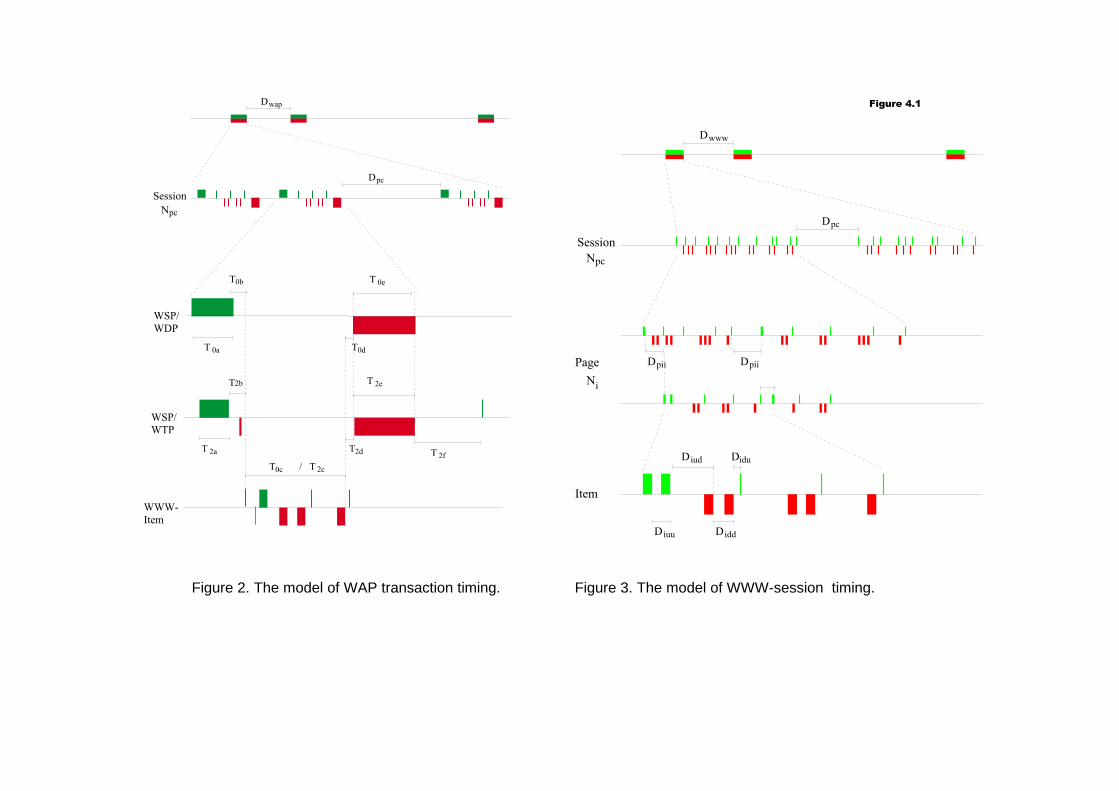
Figure 2. The model of WAP transaction timing. Figure 3. The model of WWW-session timing.
�
�
� � �
� �
� � �
� �
� �
� � � � � �
� �
� � �
�
� � � �
� � � � �� �
�� � � � � �
�
� �
� �
� � �
� �
� �
�� � � � �
� � �
�
�
� �
� �
� ���� ���
��� ���
��� ���
��
���
��
�
��
�
������
��
�
��������

The ETSI Non-Real Time Traffic Model
• Referred later as ETSI model. Presented in D-ETR SMG-50402 v0.9.3: 4/1997,Annex 2, and enhanced in Technical Report TR 101 112 V3.2.0 (1998-04) AnnexB, in both Paragraph 1.2.2. Traffic models / Non-real time services
t
A packet service session
First packet arrival to base station buffer
Last packet arrival to base station buffer
A packet call
The instans of packet arrivalsto base station buffer
Figure 1.0. Typical characteristic of a packet service session.

• Figure 1.0 depicts a typical WWW browsing session, which consists of asequence of packet calls.
• We only consider the packets from a source, which may be at either end of thelink but not simultaneously.
• The user initiates a packet call when requesting an information entity.• During a packet call several packets may be generated, which means that the
packet call constitutes of a bursty sequence of packets.• It is very important to take this phenomenon into account in the traffic model.• The burstyness during the packet call is a characteristic feature of packet
transmission in the fixed network.• A packet service session contains one or several packet calls depending on the
application. For example in a WWW browsing session a packet call correspondsthe downloading of a WWW document.
• After the document is entirely arrived to the terminal, the user is consumingcertain amount of time for studying the information. This time interval is calledreading time.
• It is also possible that the session contains only one packet call. In fact this is thecase for a file transfer (FTP). Hence, the following must be modeled in order tocatch the typical behavior described in Figure 1.0:

• Session arrival process Modeled as a Poisson process. Has nothing to do with call termination.• Number of packet calls per session, Npc N Geompc Npc∈ ( )µ .
• Reading time between packet calls, Dpc D Geompc Dpc∈ ( )µ
• Number of datagrams within a packet call, Nd N Geomd Nd∈ ( )µ .
• Inter arrival time between datagrams (within a packet call) Dd D Geomd Dd∈ ( )µ .
• Size of a datagram, Sd Pareto distribution is usedThe session length is modeled implicitly by the number of events during the session.
Table 1.1 Characteristics of connection-less information types (default mean values for the distributions of typicalwww service)
Packet basedinformation types
Average numberof packet calls
within a session
Average readingtime between
packet calls [s]
Average amount ofpackets within a
packet call []
Averageinterarrival
time betweenpackets [s]
1
Parameters forpacket sizedistribution
WWW surfingUDD 8 kbit/sUDD 32 kbit/sUDD 64 kbit/sUDD 144 kbit/sUDD 384 kbit/sUDD 2048 kbit/s(originallyUDD 8 kbit/s)
555555
5
412412412412412412
12
252525252525
15
0.50.125
0.06250.02770.0104
0.00195
0.96
k = 81.5α = 1.1
1 The different interarrival times correspond to average bit rates of 8, 32, 64, 144, 384 and 2048 kbit/s.
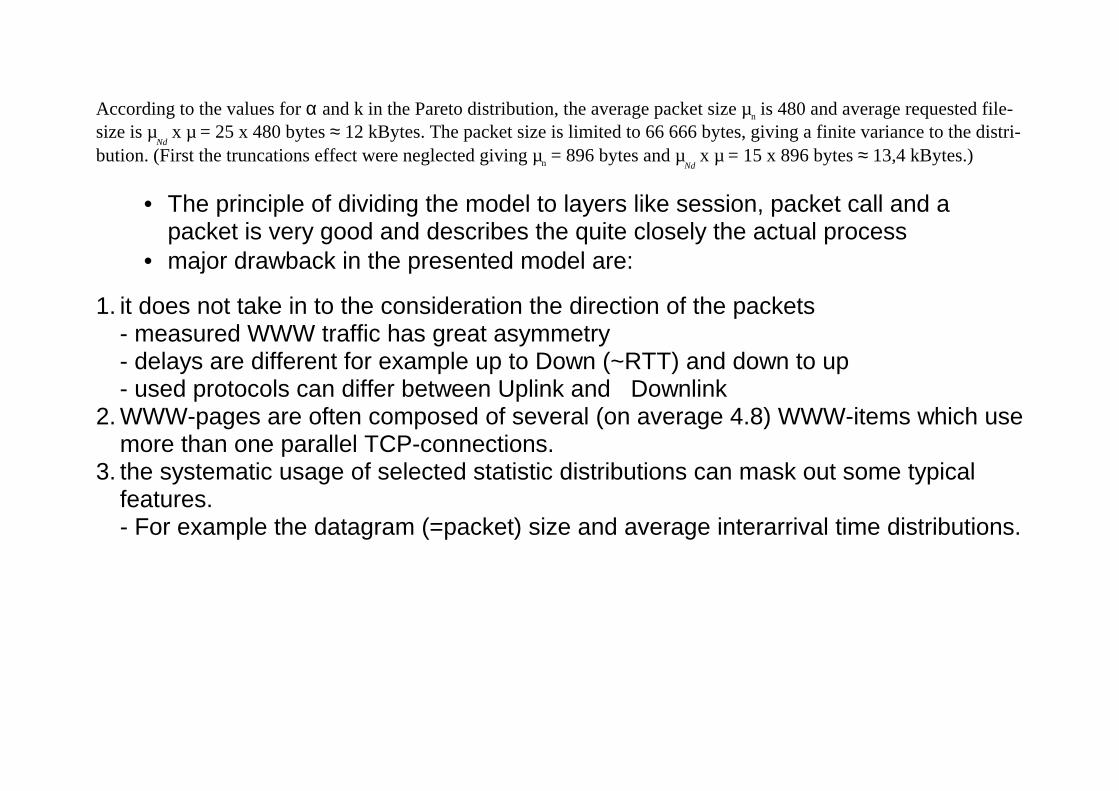
According to the values for α and k in the Pareto distribution, the average packet size µn is 480 and average requested file-size is µ
Nd x µ = 25 x 480 bytes ≈ 12 kBytes. The packet size is limited to 66 666 bytes, giving a finite variance to the distri-
bution. (First the truncations effect were neglected giving µn = 896 bytes and µNd
x µ = 15 x 896 bytes ≈ 13,4 kBytes.)
• The principle of dividing the model to layers like session, packet call and apacket is very good and describes the quite closely the actual process
• major drawback in the presented model are:
1. it does not take in to the consideration the direction of the packets- measured WWW traffic has great asymmetry- delays are different for example up to Down (~RTT) and down to up- used protocols can differ between Uplink and Downlink
2. WWW-pages are often composed of several (on average 4.8) WWW-items which usemore than one parallel TCP-connections.
3. the systematic usage of selected statistic distributions can mask out some typicalfeatures.- For example the datagram (=packet) size and average interarrival time distributions.
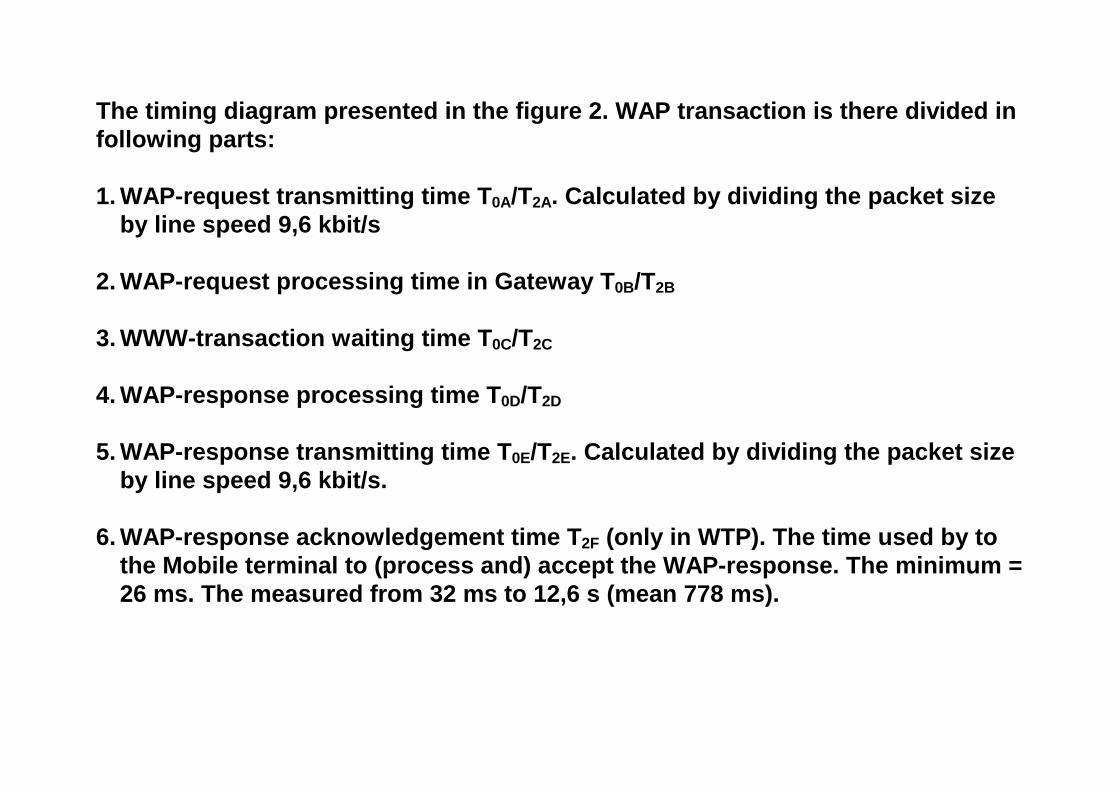
The timing diagram presented in the figure 2. WAP transaction is there divided infollowing parts:
1. WAP-request transmitting time T0A/T2A. Calculated by dividing the packet sizeby line speed 9,6 kbit/s
2. WAP-request processing time in Gateway T0B/T2B
3. WWW-transaction waiting time T0C/T2C
4. WAP-response processing time T0D/T2D
5. WAP-response transmitting time T0E/T2E. Calculated by dividing the packet sizeby line speed 9,6 kbit/s.
6. WAP-response acknowledgement time T2F (only in WTP). The time used by tothe Mobile terminal to (process and) accept the WAP-response. The minimum =26 ms. The measured from 32 ms to 12,6 s (mean 778 ms).
WSP/WDP(WAP0)
WAP1 ( =WAP2+rep)
WSP/WTP(WAP2)
WWW(WAP3)
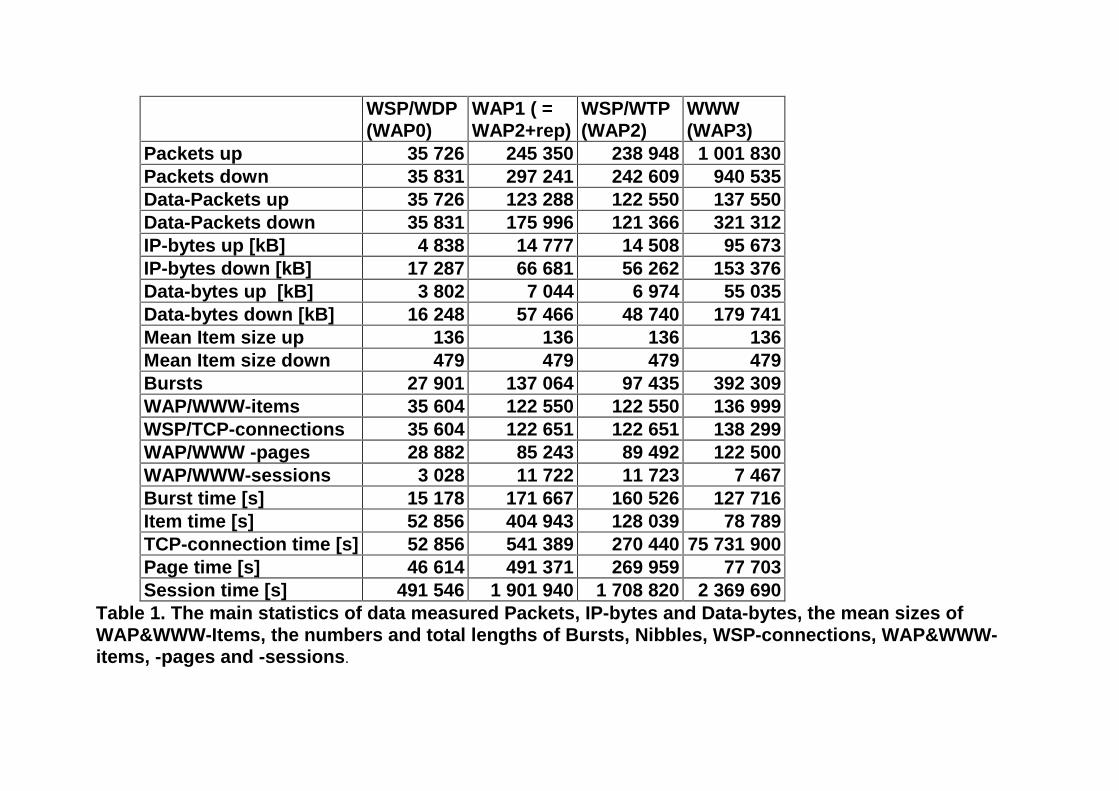
Packets up 35 726 245 350 238 948 1 001 830Packets down 35 831 297 241 242 609 940 535Data-Packets up 35 726 123 288 122 550 137 550Data-Packets down 35 831 175 996 121 366 321 312IP-bytes up [kB] 4 838 14 777 14 508 95 673IP-bytes down [kB] 17 287 66 681 56 262 153 376Data-bytes up [kB] 3 802 7 044 6 974 55 035Data-bytes down [kB] 16 248 57 466 48 740 179 741Mean Item size up 136 136 136 136Mean Item size down 479 479 479 479Bursts 27 901 137 064 97 435 392 309WAP/WWW-items 35 604 122 550 122 550 136 999WSP/TCP-connections 35 604 122 651 122 651 138 299WAP/WWW -pages 28 882 85 243 89 492 122 500WAP/WWW-sessions 3 028 11 722 11 723 7 467Burst time [s] 15 178 171 667 160 526 127 716Item time [s] 52 856 404 943 128 039 78 789TCP-connection time [s] 52 856 541 389 270 440 75 731 900Page time [s] 46 614 491 371 269 959 77 703Session time [s] 491 546 1 901 940 1 708 820 2 369 690
Table 1. The main statistics of data measured Packets, IP-bytes and Data-bytes, the mean sizes ofWAP&WWW-Items, the numbers and total lengths of Bursts, Nibbles, WSP-connections, WAP&WWW-items, -pages and -sessions.
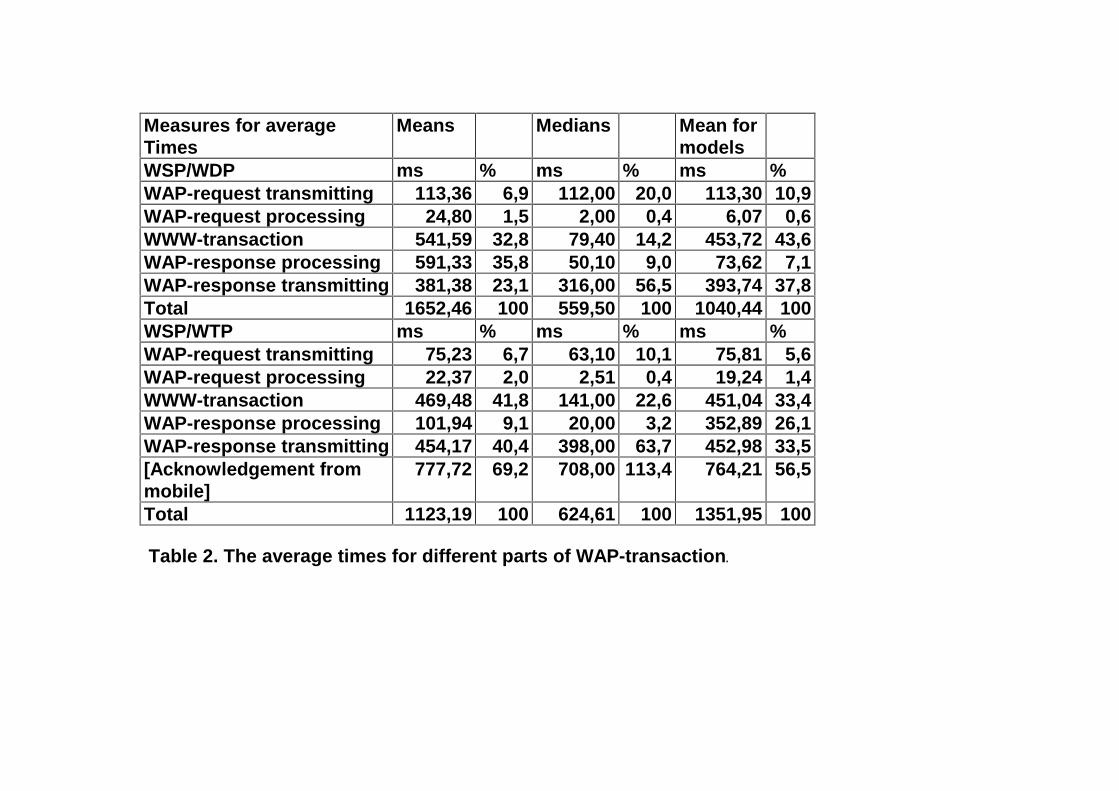
Measures for averageTimes
Means Medians Mean formodels
WSP/WDP ms % ms % ms %WAP-request transmitting 113,36 6,9 112,00 20,0 113,30 10,9WAP-request processing 24,80 1,5 2,00 0,4 6,07 0,6WWW-transaction 541,59 32,8 79,40 14,2 453,72 43,6WAP-response processing 591,33 35,8 50,10 9,0 73,62 7,1WAP-response transmitting 381,38 23,1 316,00 56,5 393,74 37,8Total 1652,46 100 559,50 100 1040,44 100WSP/WTP ms % ms % ms %WAP-request transmitting 75,23 6,7 63,10 10,1 75,81 5,6WAP-request processing 22,37 2,0 2,51 0,4 19,24 1,4WWW-transaction 469,48 41,8 141,00 22,6 451,04 33,4WAP-response processing 101,94 9,1 20,00 3,2 352,89 26,1WAP-response transmitting 454,17 40,4 398,00 63,7 452,98 33,5[Acknowledgement frommobile]
777,72 69,2 708,00 113,4 764,21 56,5
Total 1123,19 100 624,61 100 1351,95 100
Table 2. The average times for different parts of WAP-transaction.
Measures for average Times Means Medians Mean formodels
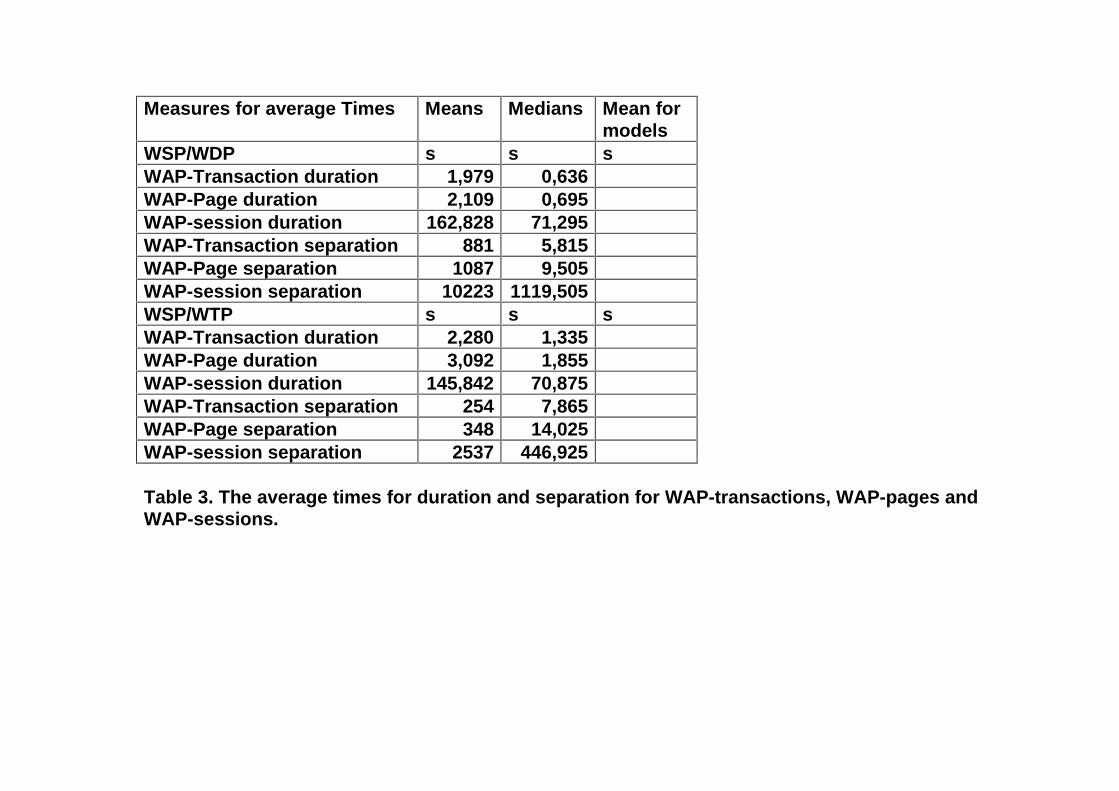
WSP/WDP s s sWAP-Transaction duration 1,979 0,636WAP-Page duration 2,109 0,695WAP-session duration 162,828 71,295WAP-Transaction separation 881 5,815WAP-Page separation 1087 9,505WAP-session separation 10223 1119,505WSP/WTP s s sWAP-Transaction duration 2,280 1,335WAP-Page duration 3,092 1,855WAP-session duration 145,842 70,875WAP-Transaction separation 254 7,865WAP-Page separation 348 14,025WAP-session separation 2537 446,925
Table 3. The average times for duration and separation for WAP-transactions, WAP-pages andWAP-sessions.

The activity during WAP-transactions and -sessionsThe activity we defined as the minimum time needed to transfer the measured IP-packets over the givenbandwidth
Activity duringTransactions
By mean By median By model
WDP-Transaction up 113,36 6,9 112,00 20,0 113,30 10,9WDP-Transaction down 381,38 23,1 316,00 56,5 393,74 37,8WDP-Transaction duration 1652,46 559,50 1040,44WTP-Transaction up 75,23 4,0 63,10 4,7 75,81 3,6WTP-Transaction down 454,17 23,9 398,00 29,9 452,98 21,4WTP-Transaction duration 1900,91 1332,61 2116,17Table 4. The Activity during WAP-transactions.
Activity during sessions By mean By median By modelWDP-Transaction duration 1,98 1,2 0,64 0,9WDP-Transaction number 10,76 10,76 10,76WDP-Transactions total 21,29 13,1 6,84 9,6WDP-session duration 162,83 71,29WTP-Transaction duration 2,28 1,6 1,34 1,9WTP-Transaction number 9,46 9,46 9,46WTP-Transactions total 21,58 14,8 12,63 17,8WTP-session duration 145,84 70,88Table 5. The Activity of WAP-transactions during WAP-sessions.

• The user activity during WAP-sessions will be a result from multiplication of- the activity factor inside WAP-transactions (Table 4) and- the part WAP-transactions take during the WAP-sessions (table 5).- WSP/WDP uses uplink 7- 20 % and WTP/WSP only 4-5 %.- WSP/WDP uses downlink 23- 57 % and WTP/WSP only 21-30 %.- The ratios between uplink and downlink are 1: 2,8-3,5 for WDP and about 1: 6
for WTP.- The relations between IP bytes transferred are 1: 3,6 for WDP and 1: 3,9 for
WSP (incl. opening and closing).
• In matched transactions the WAP has compressed the data on average to 20 -43 % compared to WWW
• The total relation of transferred bytes is 37 % with 92,9 Mb of WAP (WDP andWTP together) and 249 MB of WWW traffic.
• If an end-to-end WWW would be used the wireless link activity would increase168 % and the times in table 2 would increase 0,9 - 1,2 seconds
• The WWW-items created by WAP are smaller and time intervals betweenWWW-packets are mostly larger than with normal WWW-items. Most requestand responses fit to a single packet.
• Keep-alive packets should be excluded from all the statistics of WWW-items,pages and sessions.