Embed Size (px)
Citation preview
14.75 : Corruption Lecture 3
Ben Olken
Olken () Corruption Lecture 3 1 / 35
Outline
Do we care? Magnitude and effi ciency costs
The corrupt offi cial’s decision problem Balancing risks, rents, and incentives
Embedding corruption into larger structures The IO of corruption: embedding the decision problem into a market structure Corruption and politics Corruption’s general equilibrium effects on the economy
Olken () Corruption Lecture 3 2 / 35
" "
Shleifer and Vishny (1993): Key idea: think of bribe as a price, which is set endogenously to maximize profits Analogy is to a monopolist
Two types of corruption: Corruption without theft - bribes paid on top of offi cial fees 1
2
Corruption decreases effi ciency
Corruption with theft - bribes paid instead of fees Aligns the interests of briber and bribe payer and sustains corruption Effi ciency implications unclear
Olken () Corruption Lecture 3 3 / 35
Industrial Organization of CorruptionShleifer and Vishny (1993): "Corruption"
Corruption without theft
Images removed due to copyright restrictions. See: Shleifer, Andrei, and Robert W. Vishny. "Corruption." The Quarterly Journal of Economics 108 no. 3 (1993): 599-617. Figure 1a Corruption Without Theft Figure 1b Corruption with Theft
Olken () Corruption Lecture 3 4 / 35
Centralized vs. decentralized corruption
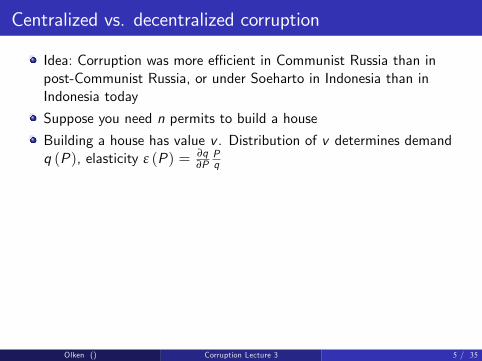
Idea: Corruption was more effi cient in Communist Russia than in post-Communist Russia, or under Soeharto in Indonesia than in Indonesia today Suppose you need n permits to build a house Building a house has value v . Distribution of v determines demand q (P), elasticity ε (P) = ∂
∂Pq Pq
Olken () Corruption Lecture 3 5 / 35
Note that q'(P )Pq(P ) is the elasticity of demand ε (P).
q P
Centralized vs. decentralized corruption
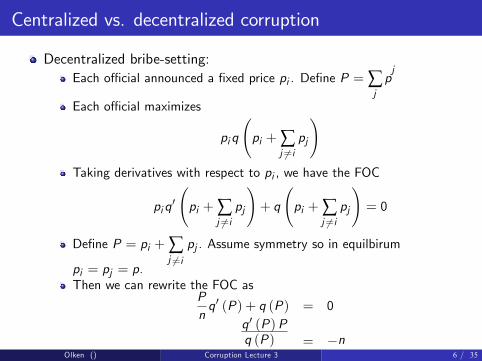
Decentralized bribe-setting: Each offi cial announced a fixed price pi . Define P = ∑ pj
j Each offi cial maximizes
pi q pi + ∑ pjHj =i
Taking derivatives with respect to pi , we have the FOC pi q
' ∑ pj + q pi + ∑ pj = 0pi +Hj =i =iHj
Define P = pi + ∑ Assume symmetry so in equilbirum pj . Hj =i
pi = pj = p. Then we can rewrite the FOC as
P n q' (P) + q (P) = 0
Olken ()
q' (P) P
Corruption Lecture 3 = −n
6 / 35
q (P)
Centralized vs. decentralized corruption
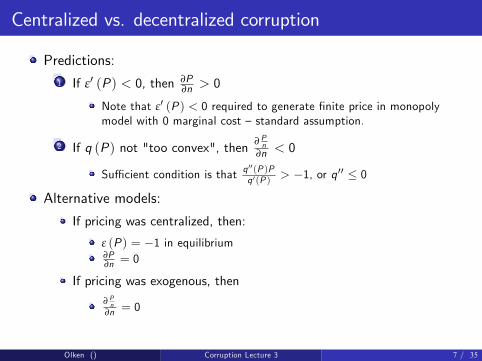
Predictions: 1 If ε ' (P) < 0, then ∂P > 0∂n
Note that ε ' (P ) < 0 required to generate finite price in monopoly model with 0 marginal cost — standard assumption.
n2 If q (P) not "too convex", then ∂ P < 0∂n
(P )P '' Suffi cient condition is that q '' > −1, or q ≤ 0' q (P )
Alternative models: If pricing was centralized, then:
ε (P ) = −1 in equilibrium ∂P = 0∂n
If pricing was exogenous, then ∂ P n = 0∂n
Olken () Corruption Lecture 3 7 / 35
Competition
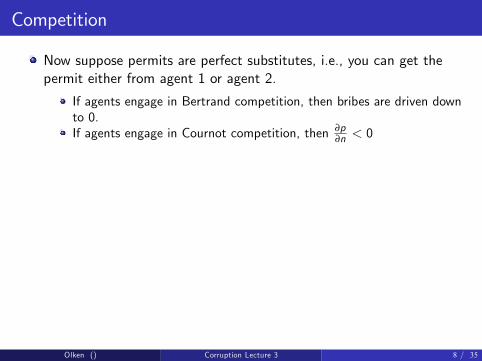
Now suppose permits are perfect substitutes, i.e., you can get the permit either from agent 1 or agent 2.
If agents engage in Bertrand competition, then bribes are driven down to 0. If agents engage in Cournot competition, then ∂p < 0∂n
Olken () Corruption Lecture 3 8 / 35
""
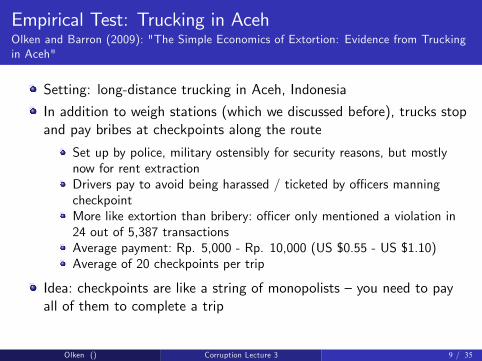
Setting: long-distance trucking in Aceh, Indonesia In addition to weigh stations (which we discussed before), trucks stop and pay bribes at checkpoints along the route
Set up by police, military ostensibly for security reasons, but mostly now for rent extraction Drivers pay to avoid being harassed / ticketed by offi cers manning checkpoint More like extortion than bribery: offi cer only mentioned a violation in 24 out of 5,387 transactions Average payment: Rp. 5,000 - Rp. 10,000 (US $0.55 - US $1.10) Average of 20 checkpoints per trip
Idea: checkpoints are like a string of monopolists — you need to pay all of them to complete a trip
Olken () Corruption Lecture 3 9 / 35
Empirical Test: Trucking in AcehOlken and Barron (2009): "The Simple Economics of Extortion: Evidence from Truckingin Aceh"
Map
Images removed due to copyright restrictions. See: Olken, Benjamin A., and Patrick Barron. "The Simple Economics of Extortion: Evidence from Trucking in Aceh." NBER Working Paper No. 13145 (2009).
Olken () Corruption Lecture 3 10 / 35
Empirical strategy: military withdrawal from Aceh
Thirty-year confiict between Indonesian government and Acehenese rebels (GAM)
Peace agreement signed in August 2005 to withdraw 30,000 police and military in 4 phases from September 2005 - January 2006 Data is from November 2005 - June 2006, and so encompasses the 3rd and 4th withdrawal phases, as well as post-period Most checkpoints in Aceh had already disappeared from Banda Aceh route by the time data, so focus on Meulaboh route
Trips passed through two provinces (Aceh and North Sumatra), but military withdrawals did not affect North Sumatra province Empirical strategy:
Withdrawal on troops from portion of Meulaboh-Medan route in Aceh province reduced number of checkpoints on the route (n) Assumption: no direct effect of withdrawal on checkpoints in North Sumatra province Therefore, can use changes in prices charged at checkpoints in North
nSumatra to identify ∂ P from the Shleifer-Vishny model ∂n
Olken () Corruption Lecture 3 11 / 35
Data
Direct observation of 304 trips across the two routes Locally-recruited enumerators accompanied drivers on their regular routes, writing down all payments Dressed as (and fulfilling role of) truck drivers’assistants Total of over 6,000 illegal payments
On average, extortion / bribes / protection payments are about 13% of cost of trip — more than drivers’salary Video
Olken () Corruption Lecture 3 12 / 35
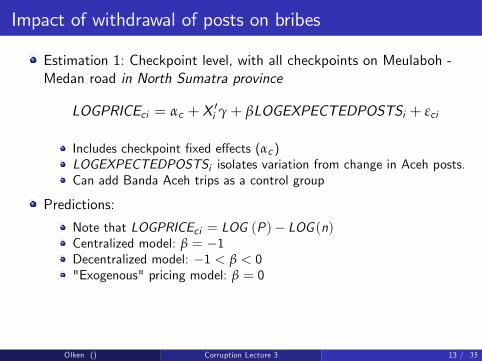
Impact of withdrawal of posts on bribes
Estimation 1: Checkpoint level, with all checkpoints on Meulaboh -Medan road in North Sumatra province
' LOGPRICEci = αc + Xi γ + βLOGEXPECTEDPOSTSi + εci
Includes checkpoint fixed effects (αc ) LOGEXPECTEDPOSTSi isolates variation from change in Aceh posts. Can add Banda Aceh trips as a control group
Predictions: Note that LOGPRICEci = LOG (P) − LOG (n) Centralized model: β = −1 Decentralized model: −1 < β < 0 "Exogenous" pricing model: β = 0
Olken () Corruption Lecture 3 13 / 35
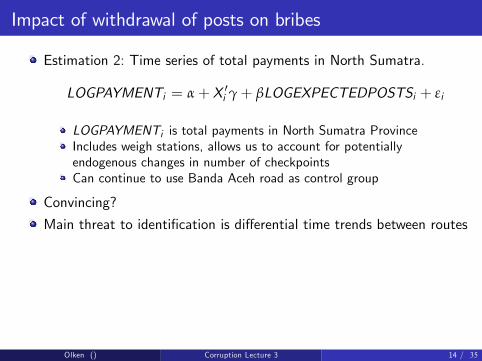
Impact of withdrawal of posts on bribes
Estimation 2: Time series of total payments in North Sumatra.
' LOGPAYMENTi = α + Xi γ + βLOGEXPECTEDPOSTSi + εi
LOGPAYMENTi is total payments in North Sumatra Province Includes weigh stations, allows us to account for potentially endogenous changes in number of checkpoints Can continue to use Banda Aceh road as control group
Convincing? Main threat to identification is differential time trends between routes
Olken () Corruption Lecture 3 14 / 35
Results
Images removed due to copyright restrictions. See: Olken, Benjamin A., and Patrick Barron. "The Simple Economics of Extortion: Evidence from Trucking in Aceh." NBER Working Paper No. 13145 (2009).
Olken () Corruption Lecture 3 15 / 35
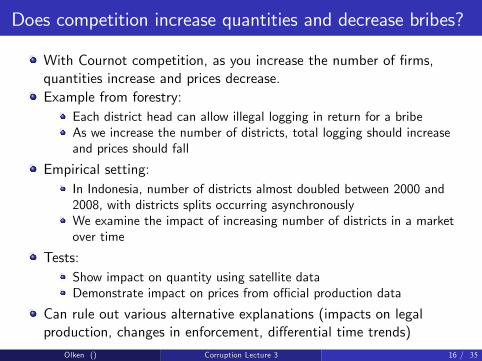
Does competition increase quantities and decrease bribes?
With Cournot competition, as you increase the number of firms, quantities increase and prices decrease. Example from forestry:
Each district head can allow illegal logging in return for a bribe As we increase the number of districts, total logging should increase and prices should fall
Empirical setting: In Indonesia, number of districts almost doubled between 2000 and 2008, with districts splits occurring asynchronously We examine the impact of increasing number of districts in a market over time
Tests: Show impact on quantity using satellite data Demonstrate impact on prices from offi cial production data
Can rule out various alternative explanations (impacts on legal production, changes in enforcement, differential time trends)
Olken () Corruption Lecture 3 16 / 35
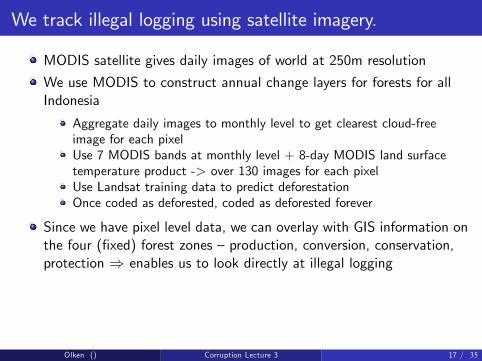
We track illegal logging using satellite imagery.
MODIS satellite gives daily images of world at 250m resolution We use MODIS to construct annual change layers for forests for all Indonesia
Aggregate daily images to monthly level to get clearest cloud-free image for each pixel Use 7 MODIS bands at monthly level + 8-day MODIS land surface temperature product -> over 130 images for each pixel Use Landsat training data to predict deforestation Once coded as deforested, coded as deforested forever
Since we have pixel level data, we can overlay with GIS information on the four (fixed) forest zones — production, conversion, conservation, protection ⇒ enables us to look directly at illegal logging
Olken () Corruption Lecture 3 17 / 35
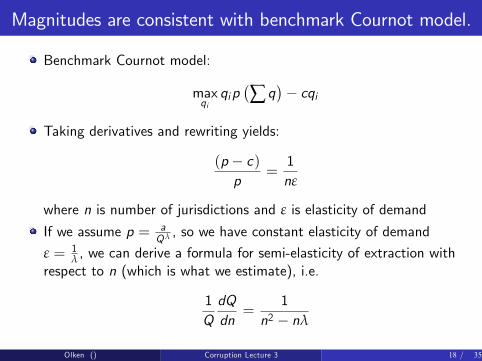
� � Magnitudes are consistent with benchmark Cournot model.
Benchmark Cournot model:
max qi p ∑ q − cqi qi
Taking derivatives and rewriting yields:
(p − c) 1 =
p nε
where n is number of jurisdictions and ε is elasticity of demand aIf we assume p = , so we have constant elasticity of demand Q λ
ε = 1 , we can derive a formula for semi-elasticity of extraction with λ respect to n (which is what we estimate), i.e.
1 dQ 1 =
Q dn n2 − nλ
Olken () Corruption Lecture 3 18 / 35
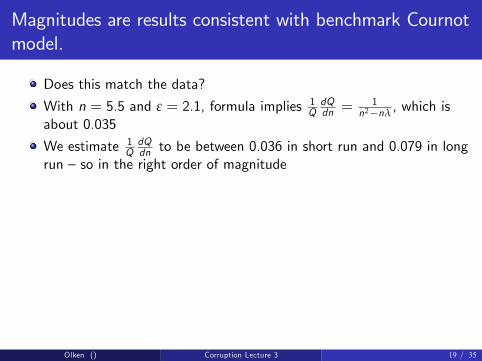
Magnitudes are results consistent with benchmark Cournot model.
Does this match the data? 1 dQ 1With n = 5.5 and ε = 2.1, formula implies = , which is Q dn n2 −nλ
about 0.035 1 dQ We estimate Q dn to be between 0.036 in short run and 0.079 in long
run — so in the right order of magnitude
Olken () Corruption Lecture 3 19 / 35
Transaction level IO issues
Analysis above was about "market-level" IO issues There are also several important "transaction-level" IO issues
Bargaining and hold-up Price discrimination Auction design
Olken () Corruption Lecture 3 20 / 35
Bargaining and hold-up
Model above had fixed prices, announced in advance Suppose instead there was ex-post bargaining between the offi cer guarding the checkpoint and the truck driver Assume offi cer’s bargaining weight α What happens at last checkpoint?
Offi cer receives α, driver keeps (1 − α)
What happens at previous checkpoint? Offi cer receives α (1 − α), driver keeps 1 − α (1 − α). Why? Intuition is that there is less surplus from agreement at "upstream" checkpoints, since some part of that surplus will be extracted at "downstream" checkpoints Analogy is to ex-post bargaining in chain of Leontief production technologies (e.g. Blanchard and Kremer 1997)
Olken () Corruption Lecture 3 21 / 35
Testing bargaining and hold-up
First question: is there any ex-post bargaining? Certain factors likely to increase bargaining power of offi cer manning the post
Is offi cer carrying a gun? How many offi cers are visible manning post?
We can test whether these factors: Increase amount paid at checkpoint Increase probability of negotiation over amount paid
Estimation:
LOGPRICEci = αi + αc + β1GUNci + β2NUMOFFICERSci + εci
Includes trip fixed effects (αi ) and checkpoint × month × direction of travel fixed effects (αc )
Olken () Corruption Lecture 3 22/ 35
Do prices increase along the route?
Prediction from model: if α > 0, so there is some ex-post bargaining, prices increase as you near the end of the trip To estimate this, take advantage of the fact that we have trips in both directions For each checkpoint × direction of travel:
Define MEANPERCENTILEci as the percentile in the trip where the checkpoint is on average encountered each month Each checkpoint will have two values of MEANPERCENTILEci each month, one going to Aceh and one coming from Aceh
Estimation:
LOGPRICEci = αi + αc + βMEANPERCENTILEci + εci
Includes trip fixed effects (αi ) and checkpoint × month fixed effects (αc )
Olken () Corruption Lecture 3 23 / 35

Do prices increase along the route?
Olken () Corruption Lecture 3 24 / 35
Images removed due to copyright restrictions. See: Olken, Benjamin A., and Patrick Barron. "The SimpleEconomics of Extortion: Evidence from Trucking in Aceh." NBER Working Paper No. 13145 (2009).
Do prices increase along the route?
Olken () Corruption Lecture 3 25 / 35
Images removed due to copyright restrictions. See: Olken, Benjamin A., and Patrick Barron. "The SimpleEconomics of Extortion: Evidence from Trucking in Aceh." NBER Working Paper No. 13145 (2009).
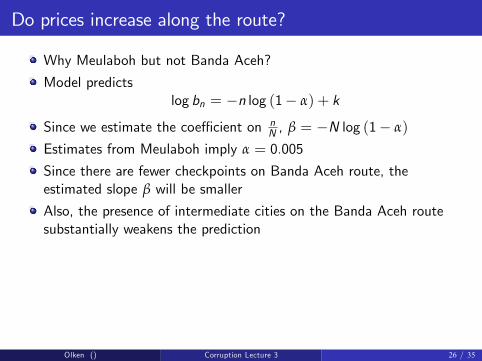
Do prices increase along the route?
Why Meulaboh but not Banda Aceh? Model predicts
log bn = −n log (1 − α) + k nSince we estimate the coeffi cient on N , β = −N log (1 − α)
Estimates from Meulaboh imply α = 0.005 Since there are fewer checkpoints on Banda Aceh route, the estimated slope β will be smaller Also, the presence of intermediate cities on the Banda Aceh route substantially weakens the prediction
Olken () Corruption Lecture 3 26 / 35
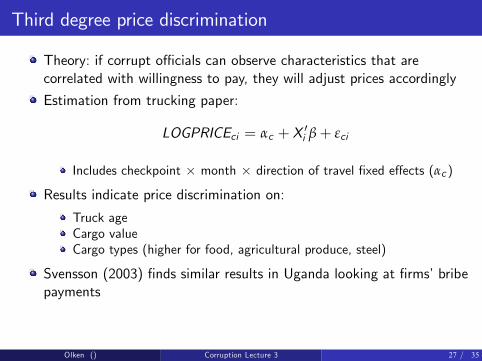
Third degree price discrimination
Theory: if corrupt offi cials can observe characteristics that are correlated with willingness to pay, they will adjust prices accordingly Estimation from trucking paper:
' LOGPRICEci = αc + Xi β + εci
Includes checkpoint × month × direction of travel fixed effects (αc )
Results indicate price discrimination on: Truck age Cargo value Cargo types (higher for food, agricultural produce, steel)
Svensson (2003) finds similar results in Uganda looking at firms’bribe payments
Olken () Corruption Lecture 3 27 / 35
Third degree price discrimination
Do trucks with observable characteristics correlated with higher willingness to pay in fact pay more?
Olken () Corruption Lecture 3 28 / 35
Images removed due to copyright restrictions. See: Olken, Benjamin A., and Patrick Barron. "The SimpleEconomics of Extortion: Evidence from Trucking in Aceh." NBER Working Paper No. 13145 (2009).
Second degree price discrimination
Another type of price-discrimination is screening — e.g., create different contracts and let people self-select Does this happen with corruption? Evidence
We saw evidence of this in the trucking paper at weigh stations What else? Does drivers’license paper speak to this?
Olken () Corruption Lecture 3 29 / 35
Procurement auctions
Much corruption takes place in government procurement of goods and services To mitigate corruption (and other problems), governments typically procure through procurement auctions, which restrict the discretion that procurement offi cials have Procurement is more complicated than auctions to sell a product, since the procurer cares about quality in addition to price There are therefore two main types of procurement regimes:
Best-price auction: conditional on meeting a minimum quality threshold, lowest price wins Best-value auctions: every bidder receives a quality score, and winner determined by a formula that combines quality and price
Do these auctions prevent corruption? Under what circumstances? What auction rules work best for mitigating corruption?
Olken () Corruption Lecture 3 30 / 35
-
Empirical tests Tran 2008: Can Procurement Auctions Reduce Corruption? Evidence from the Internal Records of a Bribe Paying Firm
Setting: Government procurement of electrical equipment in an Asian country Data: Tran obtained a firm’s secret records of every bribe they had paid in a procurement auction over the past 10 years, 562 total transactions
Bribes average about 15% of cost of the equipment This data allows him to observe not just hot auctions change total prices, but also how they change the share of rents that accrue to the corrupt offi cial
Olken () Corruption Lecture 3 31 / 35
Empirical strategy
Empirical strategy: diffs-in-diffs with changes in procurement rules First difference:
Prior to 2000, no auctions required whatsoever 2001 - 2004, best-value auctions required 2004 - present, best-price auctions required
Second difference: High-value contracts (above $14,540) require open auctions under both regimes (anyone can bid) Medium-value contracts ($7,270 - $14,540) require restricted auctions under both regimes (offi cer solicits bids) Low-value contracts do not require auctions
Estimate
Bribeit = BIGit + MEDit + BIGit × POST 2001t + BIGit × POST 2004t + MEDit × POST 2001t + MEDit × POST 2004t + αt + X + ε
Olken () Corruption Lecture 3 32 / 35
Endogenous contract values
Offi cials manipulate contract values to get around thresholds (e.g., including or excluding maintenance contracts, specifying cheaper brands, etc)
Image removed due to copyright restrictions. See: Tran, Anh. "Can Procurement Auctions Reduce Corruption? Evidence from the Internal Records of a Bribe-Paying Firm." November, 2008.
Solution: instrument using the power capacity of the equipment being purchased, which does not change
Olken () Corruption Lecture 3 33 / 35
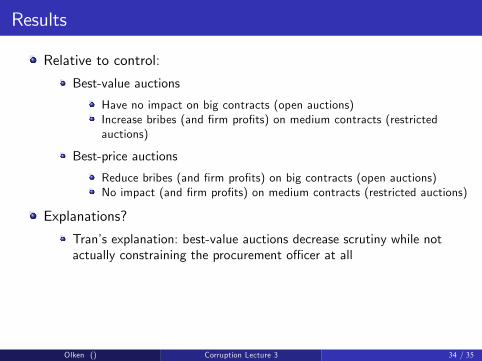
Results
Relative to control: Best-value auctions
Have no impact on big contracts (open auctions) Increase bribes (and firm profits) on medium contracts (restricted auctions)
Best-price auctions Reduce bribes (and firm profits) on big contracts (open auctions) No impact (and firm profits) on medium contracts (restricted auctions)
Explanations? Tran’s explanation: best-value auctions decrease scrutiny while not actually constraining the procurement offi cer at all
Olken () Corruption Lecture 3 34 / 35
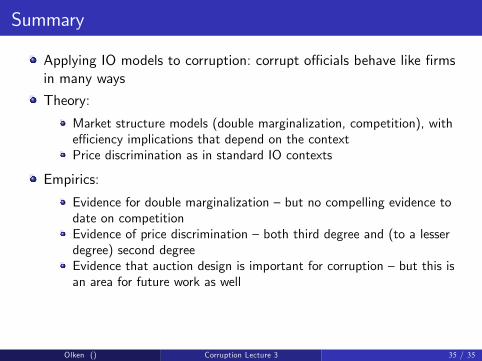
Summary
Applying IO models to corruption: corrupt offi cials behave like firms in many ways Theory:
Market structure models (double marginalization, competition), with effi ciency implications that depend on the context Price discrimination as in standard IO contexts
Empirics: Evidence for double marginalization — but no compelling evidence to date on competition Evidence of price discrimination — both third degree and (to a lesser degree) second degree Evidence that auction design is important for corruption — but this is an area for future work as well
Olken () Corruption Lecture 3 35 / 35
MIT OpenCourseWarehttp://ocw.mit.edu
14.75 Political Economy and Economic DevelopmentFall 2012
For information about citing these materials or our Terms of Use, visit: http://ocw.mit.edu/terms.