Embed Size (px)
Citation preview
Signals and Systems
1
California State University, Bakersfield
Hani Mehrpouyan1,
Department of Electrical and Computer Engineering,
California State University, Bakersfield
Lecture 21 (Error Probability)
February 22nd, 2013
1 Some of the lectures notes here reproduced are taken from course textbooks: “Digital Communications: Fundamentals and Applications” B. Sklar. “Communication Systems Engineering”, J. G. Proakis and M Salehi, and “Lecture Notes for Digital Communication, Queen’s University, Canada”, S. Yousefi.
Signals and Systems
2
California State University, Bakersfield
Outline
� Error Probability for QAM
� Comparison of 2-D Schemes
� Error Probability of M-ary Orthogonal Signal Sets
� Bit Error vs. Symbol Error Rate
� Gray Coding
Signals and Systems
3
California State University, Bakersfield
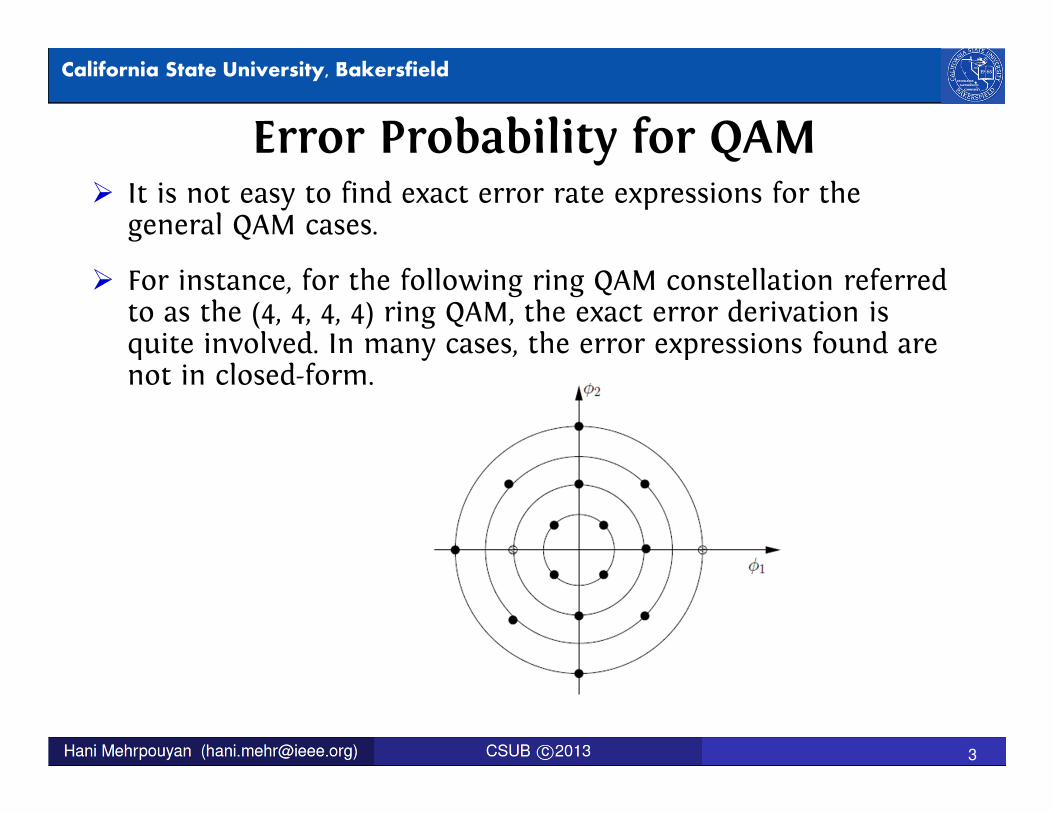
Error Probability for QAM� It is not easy to find exact error rate expressions for the
general QAM cases.
� For instance, for the following ring QAM constellation referred to as the (4, 4, 4, 4) ring QAM, the exact error derivation is quite involved. In many cases, the error expressions found are not in closed-form.
Signals and Systems
4
California State University, Bakersfield
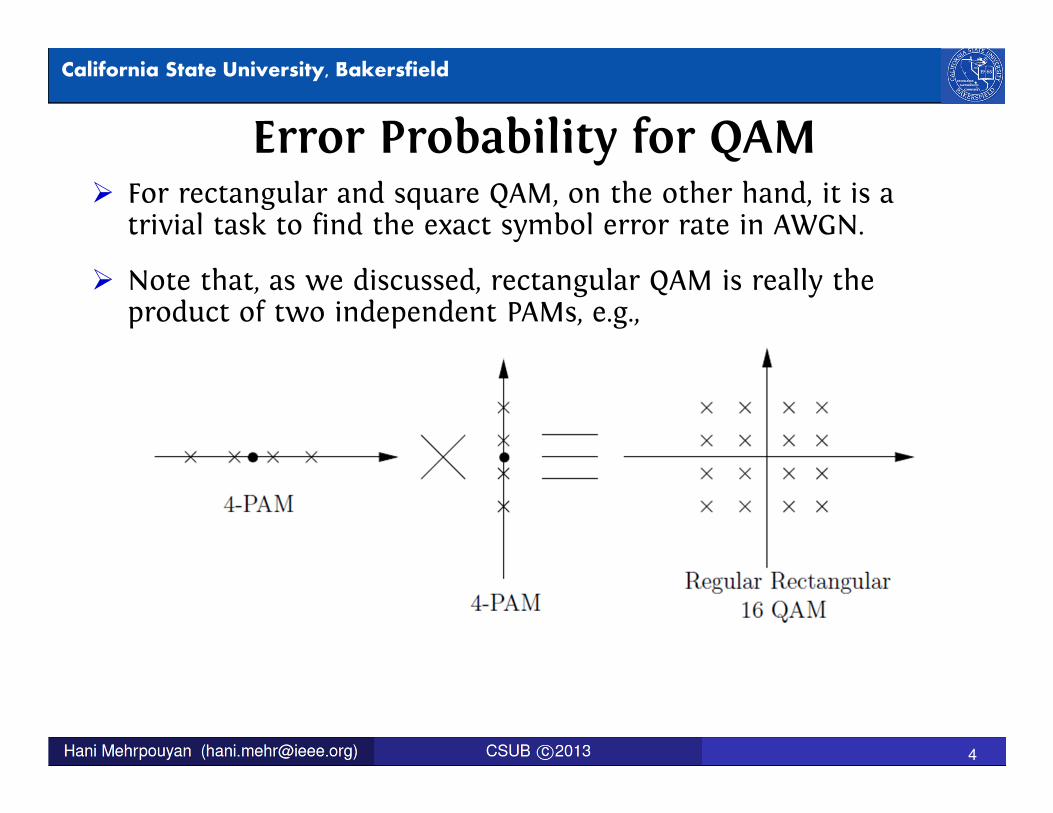
Error Probability for QAM� For rectangular and square QAM, on the other hand, it is a
trivial task to find the exact symbol error rate in AWGN.
� Note that, as we discussed, rectangular QAM is really the product of two independent PAMs, e.g.,
Signals and Systems
5
California State University, Bakersfield
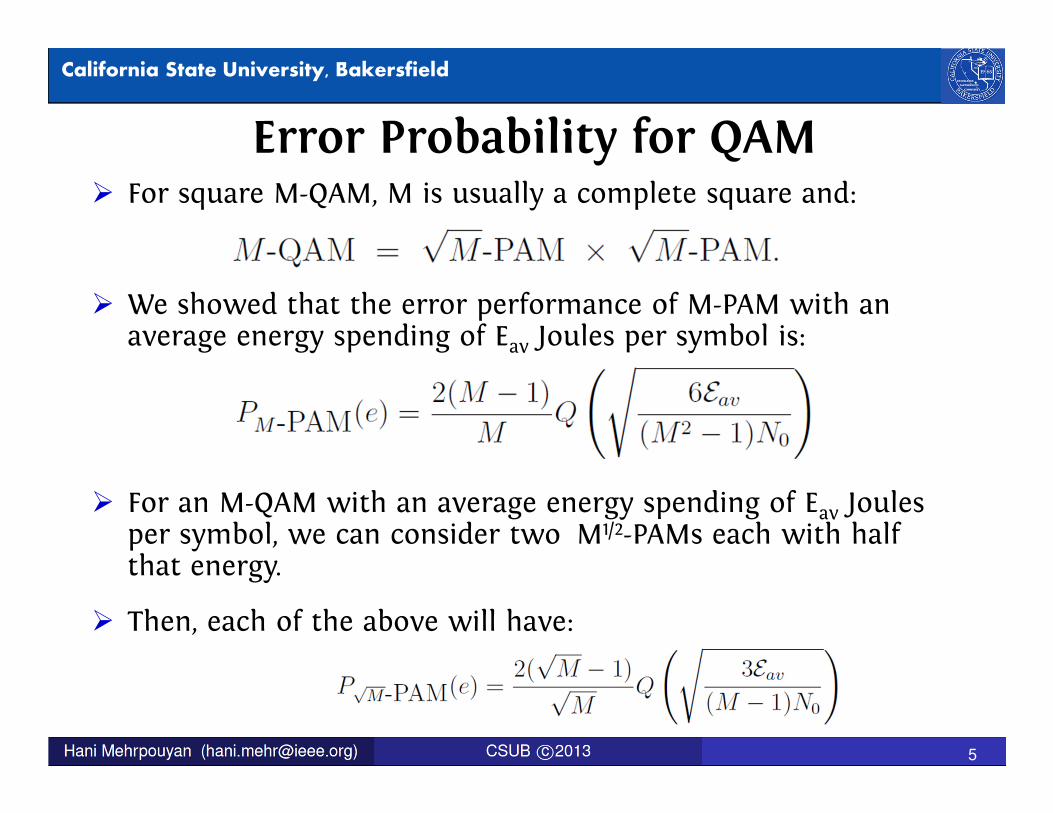
Error Probability for QAM� For square M-QAM, M is usually a complete square and:
� We showed that the error performance of M-PAM with an average energy spending of Eav Joules per symbol is:
� For an M-QAM with an average energy spending of Eav Joules per symbol, we can consider two √M1/2-PAMs each with half that energy.
� Then, each of the above will have:
Signals and Systems
6
California State University, Bakersfield
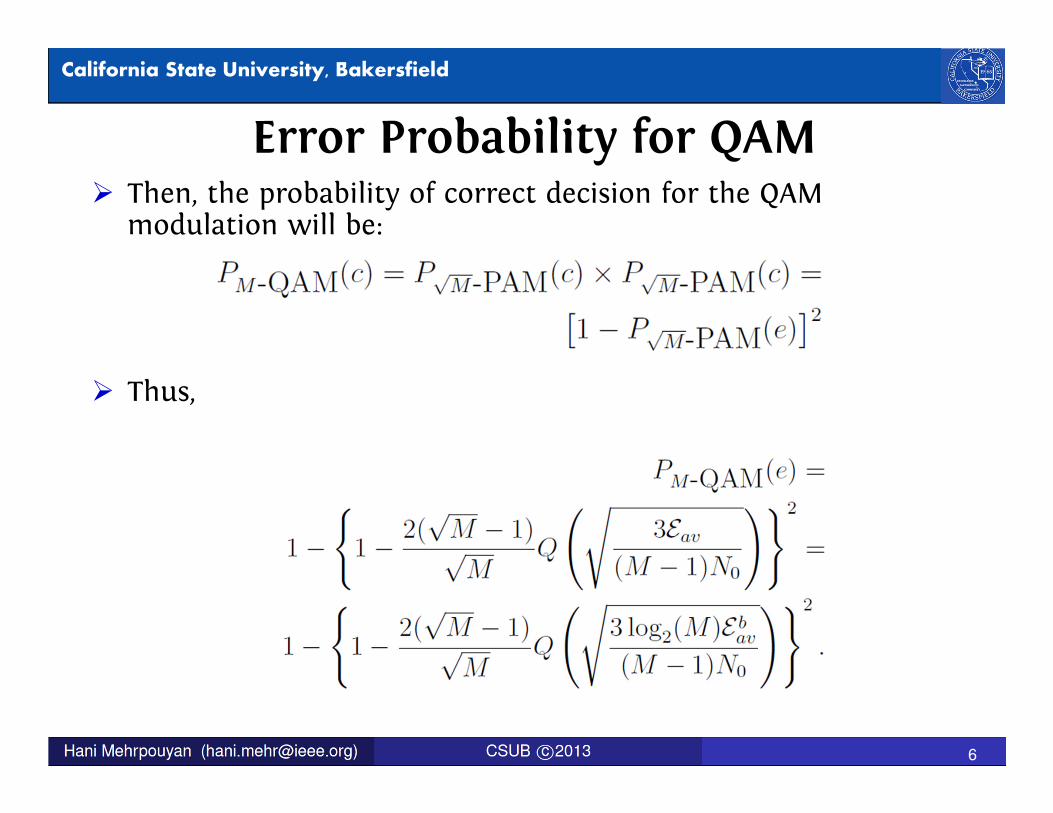
Error Probability for QAM� Then, the probability of correct decision for the QAM
modulation will be:
� Thus,
Signals and Systems
7
California State University, Bakersfield
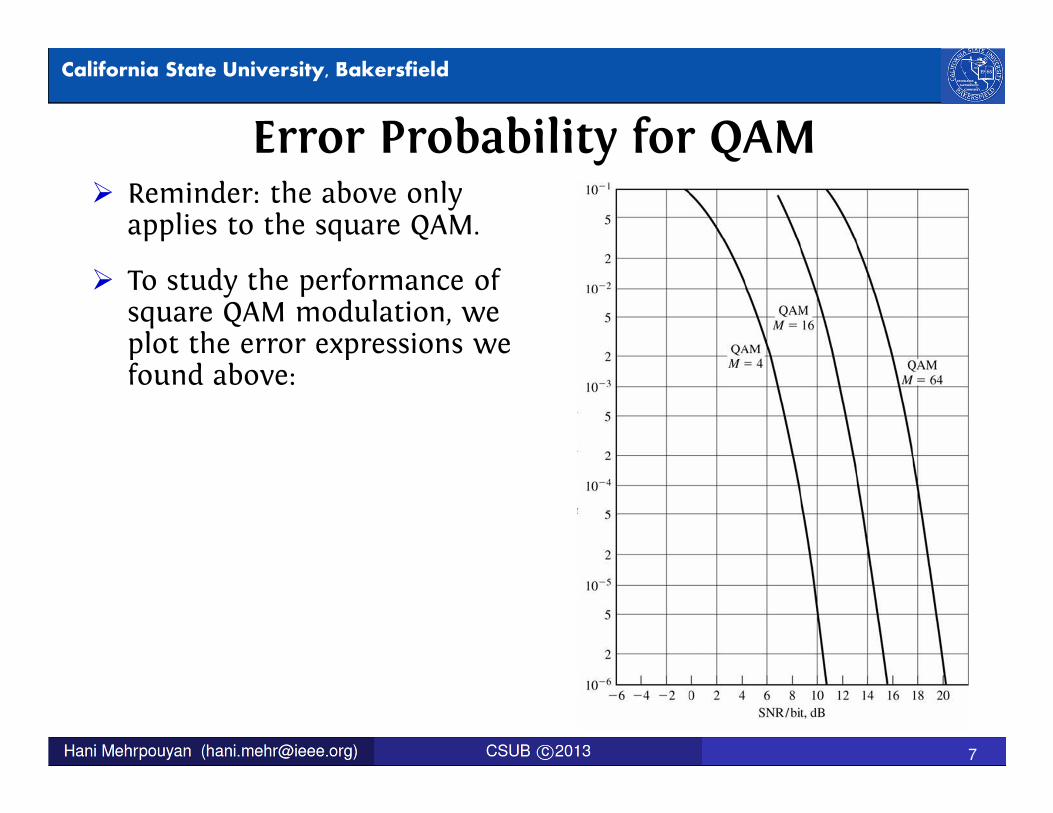
Error Probability for QAM� Reminder: the above only
applies to the square QAM.
� To study the performance of square QAM modulation, we plot the error expressions we found above:
Signals and Systems
8
California State University, Bakersfield
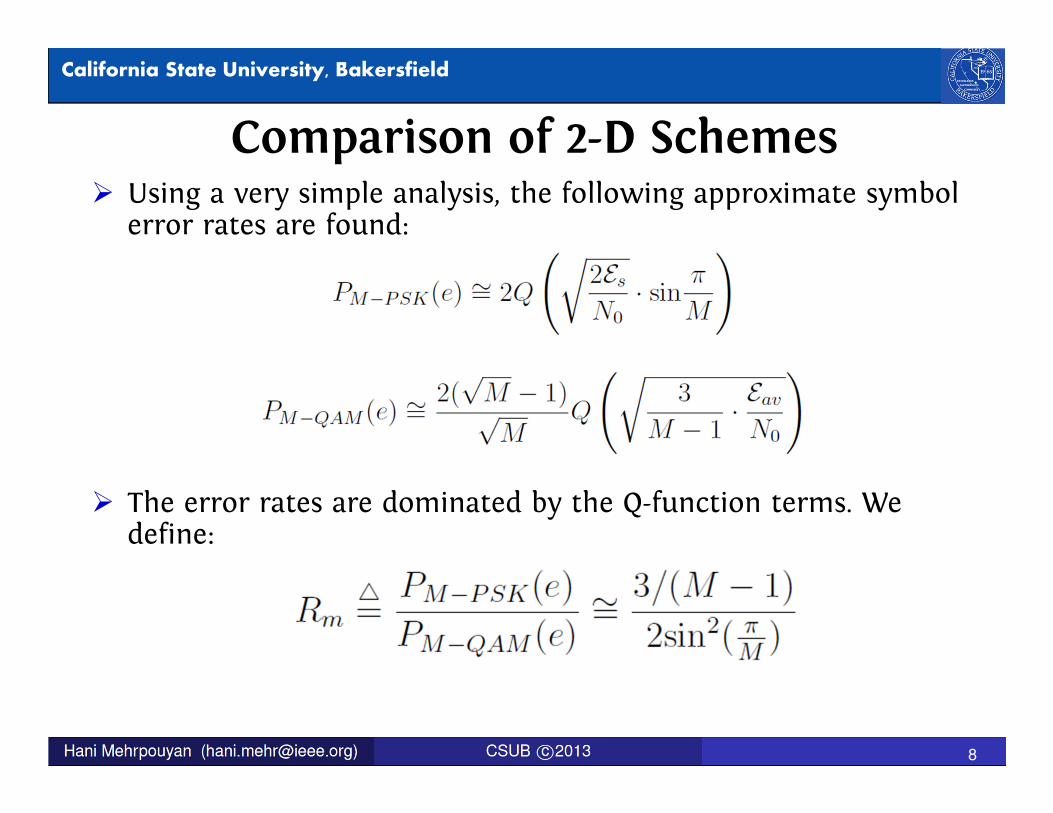
Comparison of 2-D Schemes� Using a very simple analysis, the following approximate symbol
error rates are found:
� The error rates are dominated by the Q-function terms. We define:
Signals and Systems
9
California State University, Bakersfield
Signals and Systems
10
California State University, Bakersfield
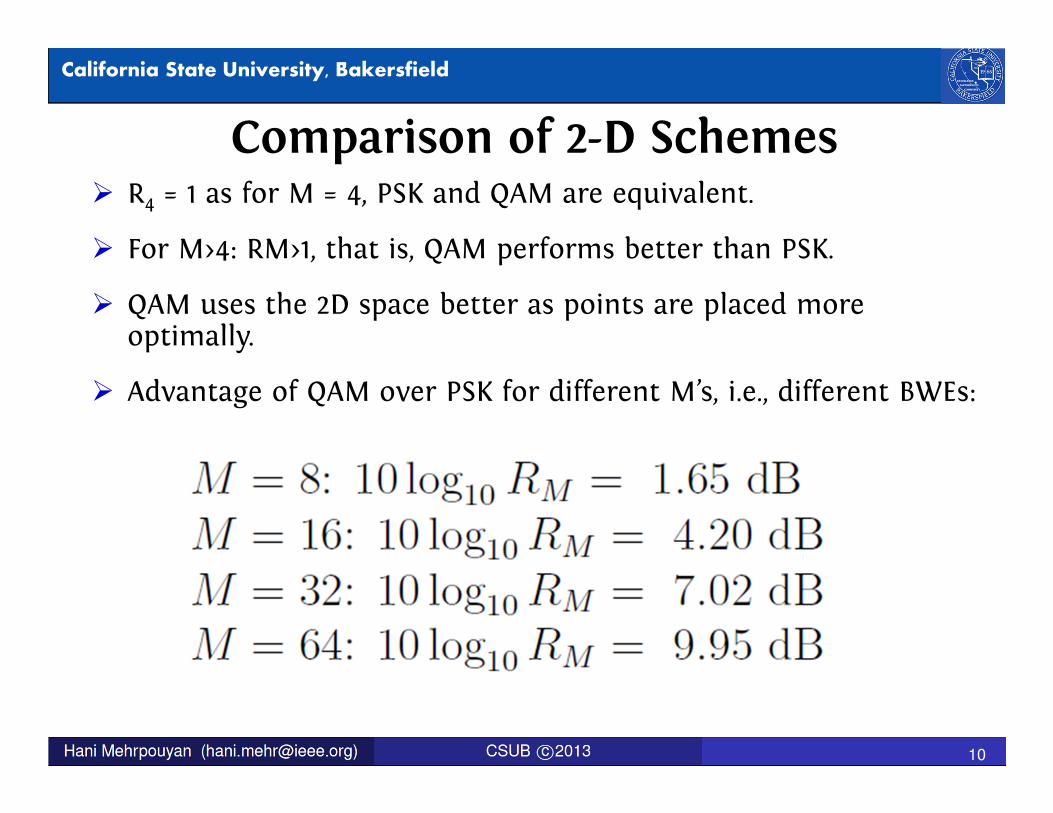
Comparison of 2-D Schemes� R4 = 1 as for M = 4, PSK and QAM are equivalent.
� For M>4: RM>1, that is, QAM performs better than PSK.
� QAM uses the 2D space better as points are placed more optimally.
� Advantage of QAM over PSK for different M’s, i.e., different BWEs:
Signals and Systems
11
California State University, Bakersfield
Error Probability of M-ary Orthogonal Signal Sets
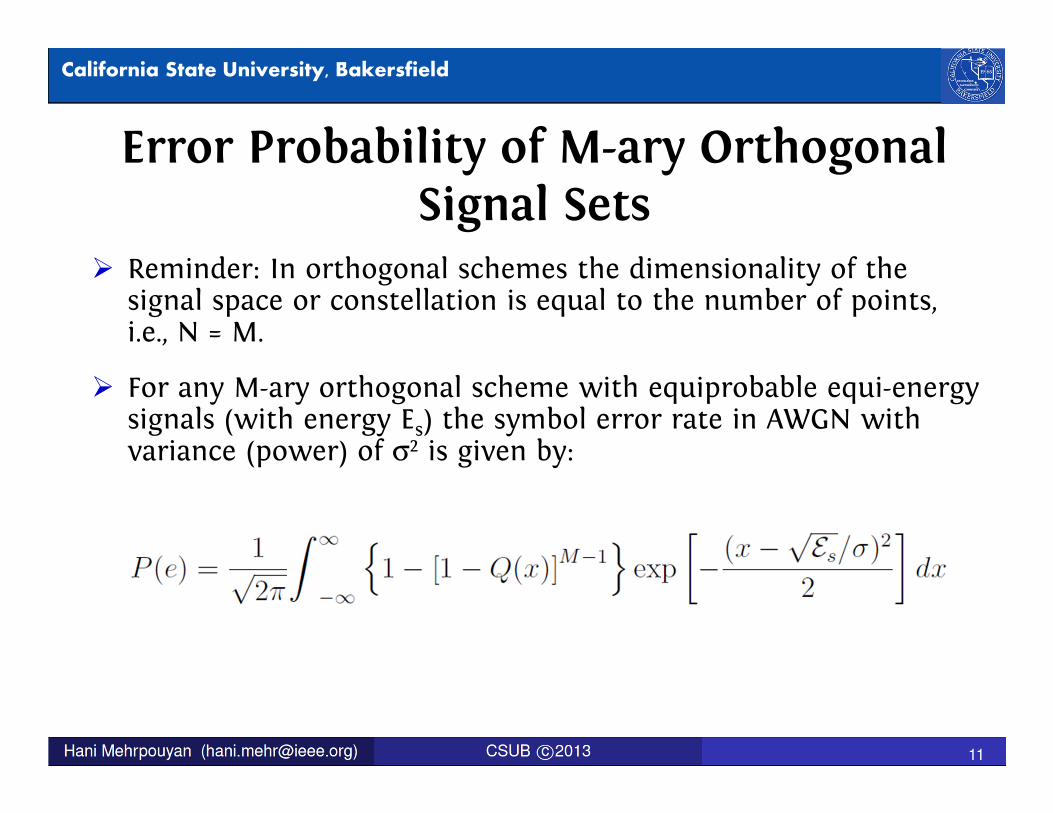
� Reminder: In orthogonal schemes the dimensionality of the signal space or constellation is equal to the number of points, i.e., N = M.
� For any M-ary orthogonal scheme with equiprobable equi-energy signals (with energy Es) the symbol error rate in AWGN with variance (power) of σ2 is given by:

Signals and Systems
12
California State University, Bakersfield
Signals and Systems
13
California State University, Bakersfield
Error Probability of M-ary Orthogonal Signal
Sets
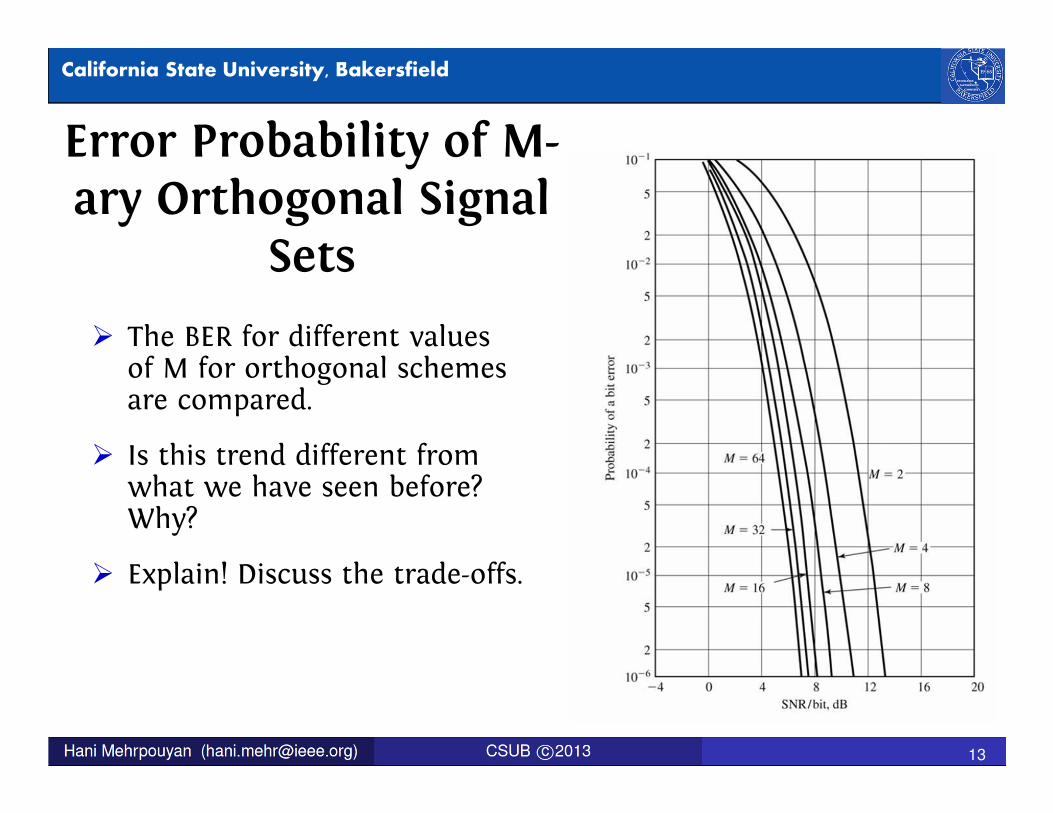
� The BER for different values of M for orthogonal schemes are compared.
� Is this trend different from what we have seen before? Why?
� Explain! Discuss the trade-offs.
Signals and Systems
14
California State University, Bakersfield
Bit Error vs. Symbol Error Rate� Thus far, we have derived the SER for some important
modulation schemes.
� In order to have a fair comparison (same footing), we would have to look at the bit SNR rather than the symbol SNR.
� Yet, we still compared the SERs rather than the BERs.
� Eventually, these are the information bits which are the object of transmission and not the signals or symbols, thus, BER must be optimized rather than the SER. The SER is intimately related to the BER.
� Let us transmit a signal sm(t) from a signal set. If the detector decides in favor of then we say we have an error (one symbol or signal error, i.e., we increment the symbol error count by one).
� How many bit errors does this translate to? If we can answer this problem the problem is solved.
Signals and Systems
15
California State University, Bakersfield
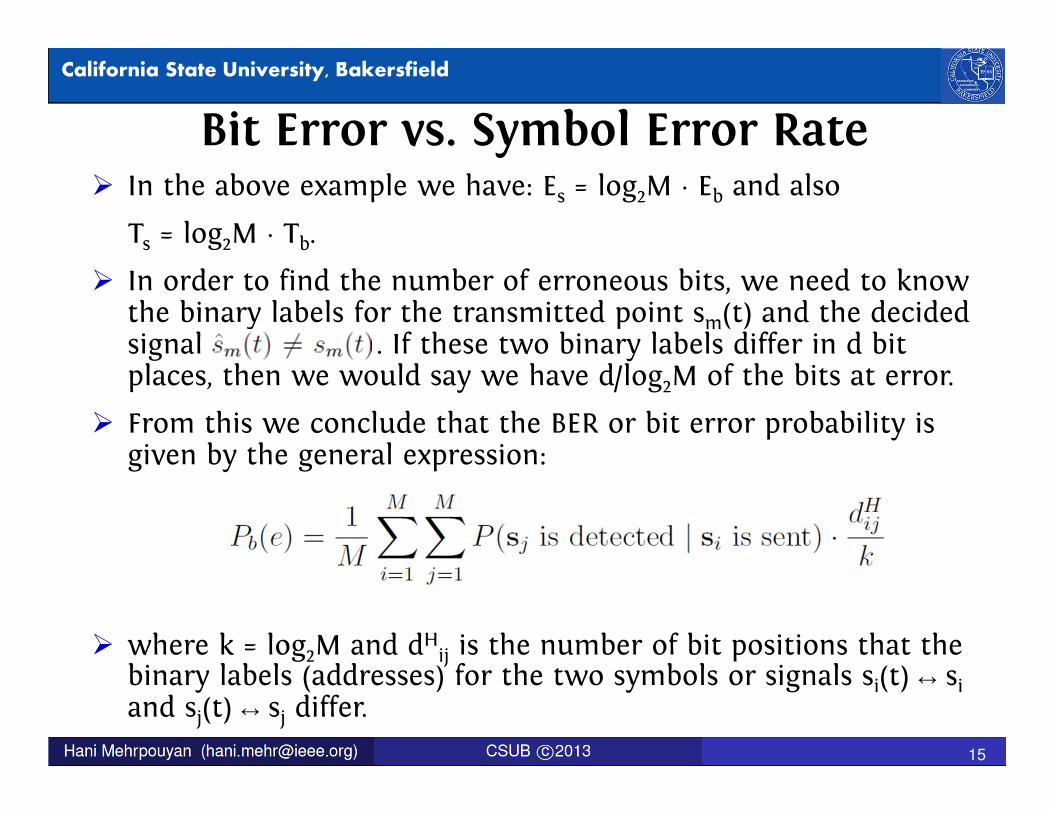
Bit Error vs. Symbol Error Rate� In the above example we have: Es = log2M · Eb and also
Ts = log2M · Tb.
� In order to find the number of erroneous bits, we need to know the binary labels for the transmitted point sm(t) and the decided signal . If these two binary labels differ in d bit places, then we would say we have d/log2M of the bits at error.
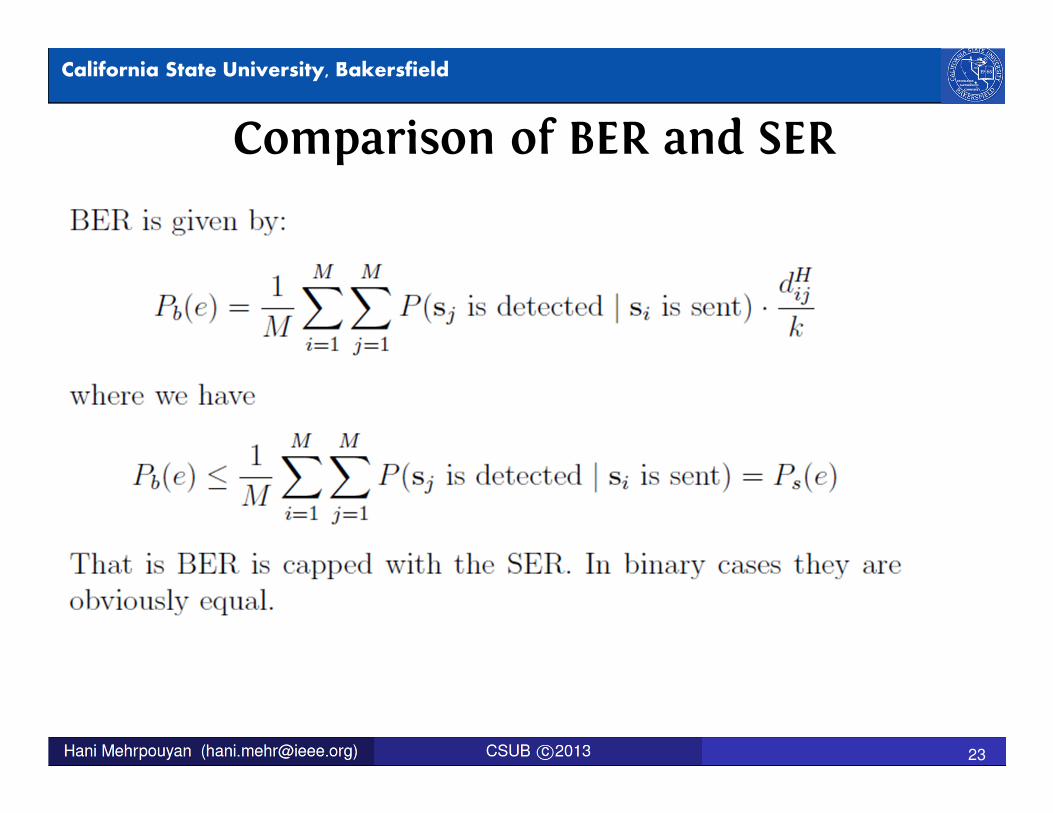
� From this we conclude that the BER or bit error probability is given by the general expression:
� where k = log2M and dHij is the number of bit positions that the binary labels (addresses) for the two symbols or signals si(t) ↔ siand sj(t) ↔ sj differ.
Signals and Systems
16
California State University, Bakersfield
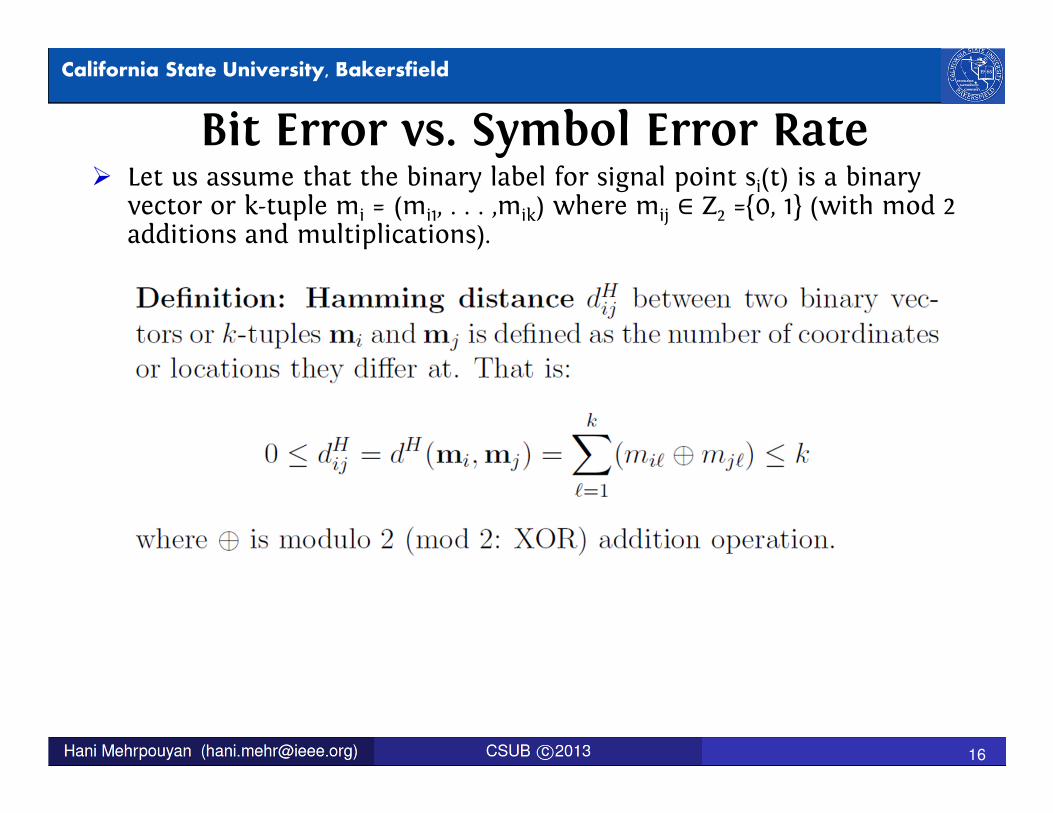
Bit Error vs. Symbol Error Rate� Let us assume that the binary label for signal point si(t) is a binary
vector or k-tuple mi = (mi1, . . . ,mik) where mij ∈ Z2 ={0, 1} (with mod 2 additions and multiplications).
Signals and Systems
17
California State University, Bakersfield
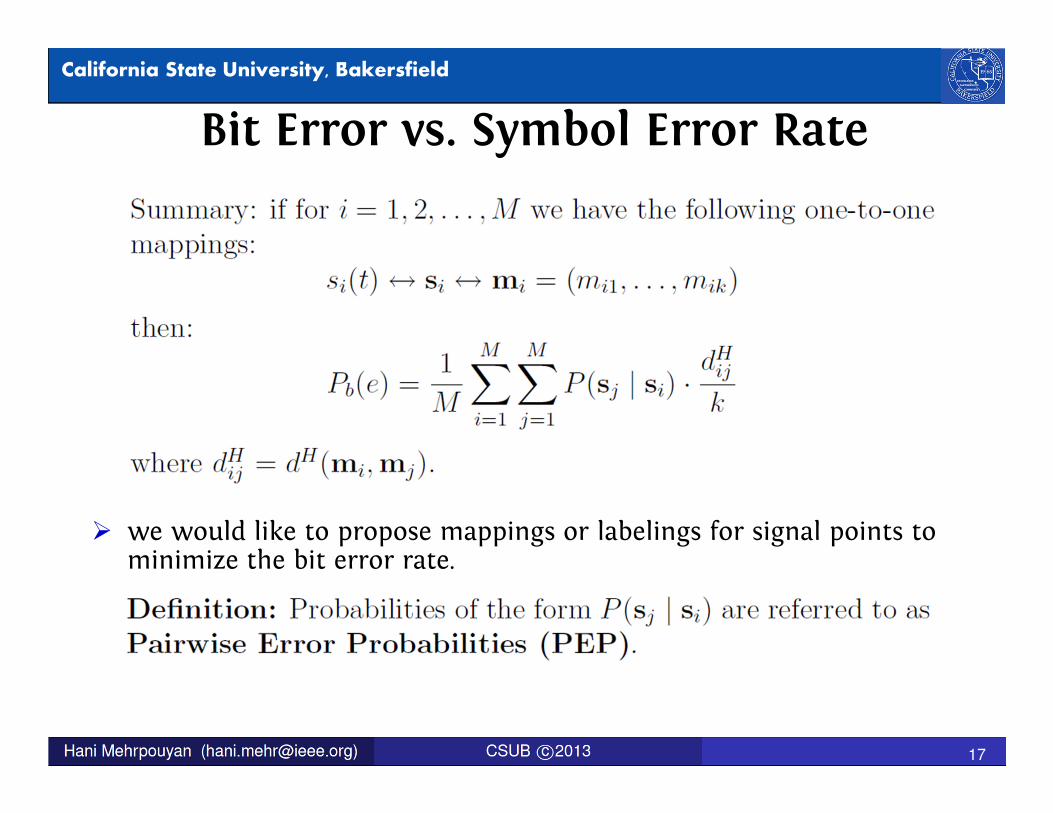
Bit Error vs. Symbol Error Rate
� we would like to propose mappings or labelings for signal points to minimize the bit error rate.
Signals and Systems
18
California State University, Bakersfield
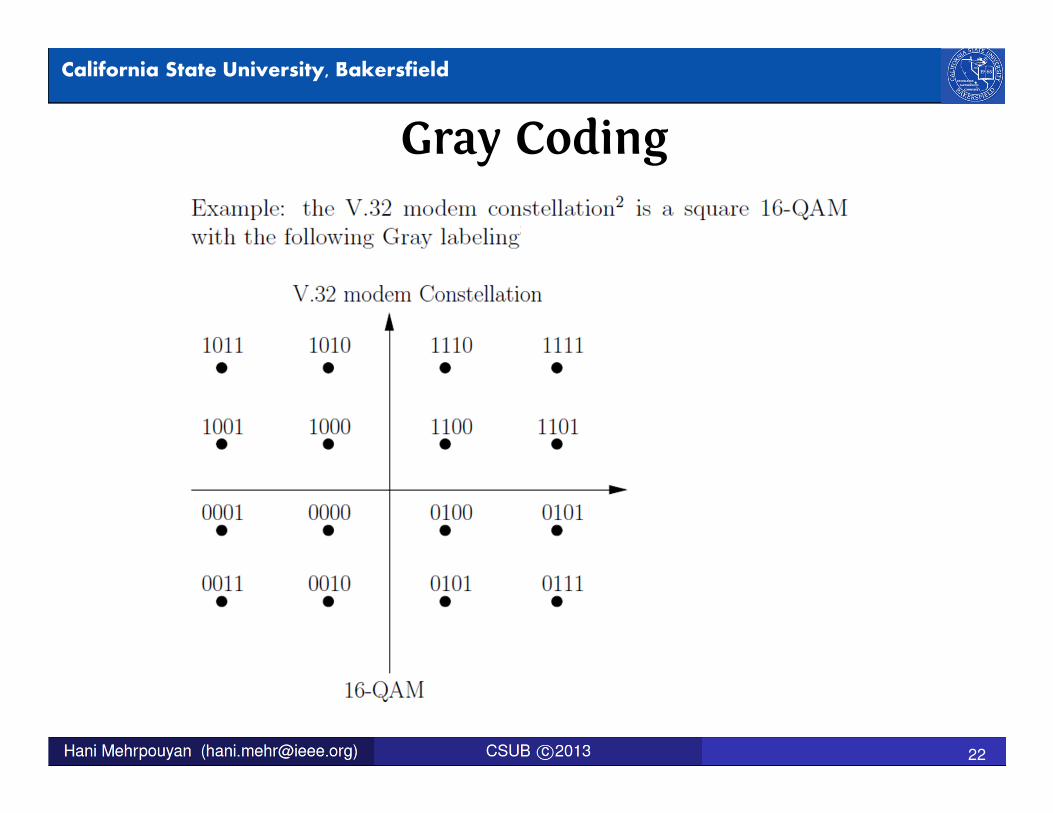
Gray Coding
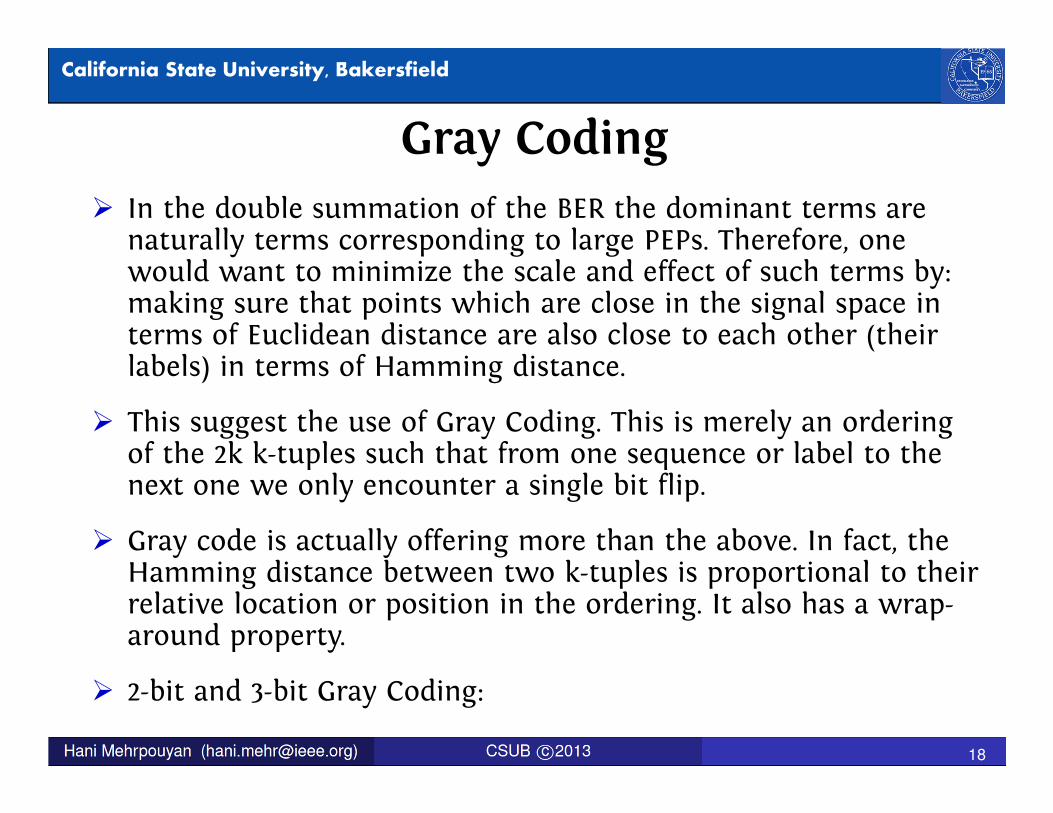
� In the double summation of the BER the dominant terms are naturally terms corresponding to large PEPs. Therefore, one would want to minimize the scale and effect of such terms by: making sure that points which are close in the signal space in terms of Euclidean distance are also close to each other (their labels) in terms of Hamming distance.
� This suggest the use of Gray Coding. This is merely an ordering of the 2k k-tuples such that from one sequence or label to the next one we only encounter a single bit flip.
� Gray code is actually offering more than the above. In fact, the Hamming distance between two k-tuples is proportional to their relative location or position in the ordering. It also has a wrap-around property.
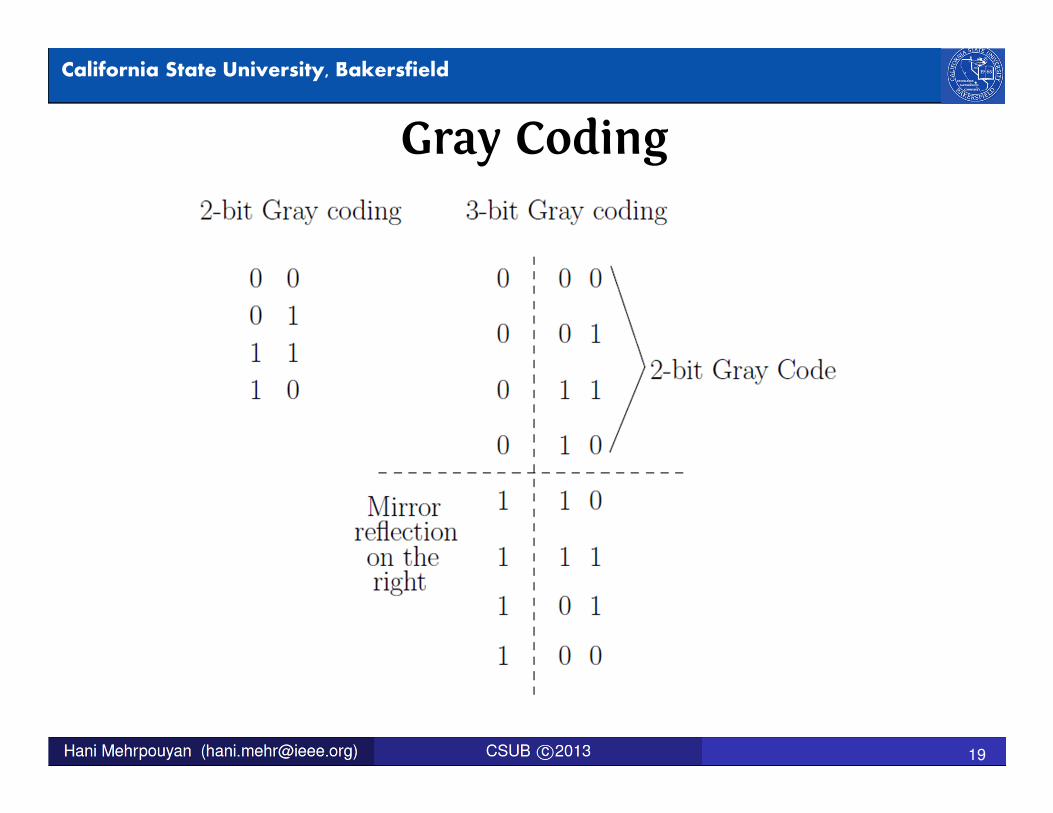
� 2-bit and 3-bit Gray Coding:
Signals and Systems
19
California State University, Bakersfield
Gray Coding
Signals and Systems
20
California State University, Bakersfield
Gray Coding� One only needs to remember the di-bit Gray code. There is a
simple recursive method to form higher length Gray codes (as shown above).
� To go from Gray code for k bits to (k + 1) bits, repeat the k-bit Gray labels using a mirror reflection (see previous slide) and then add a 0 in the MSB (most significant bit) for the upper half and a 1 for the lower half.
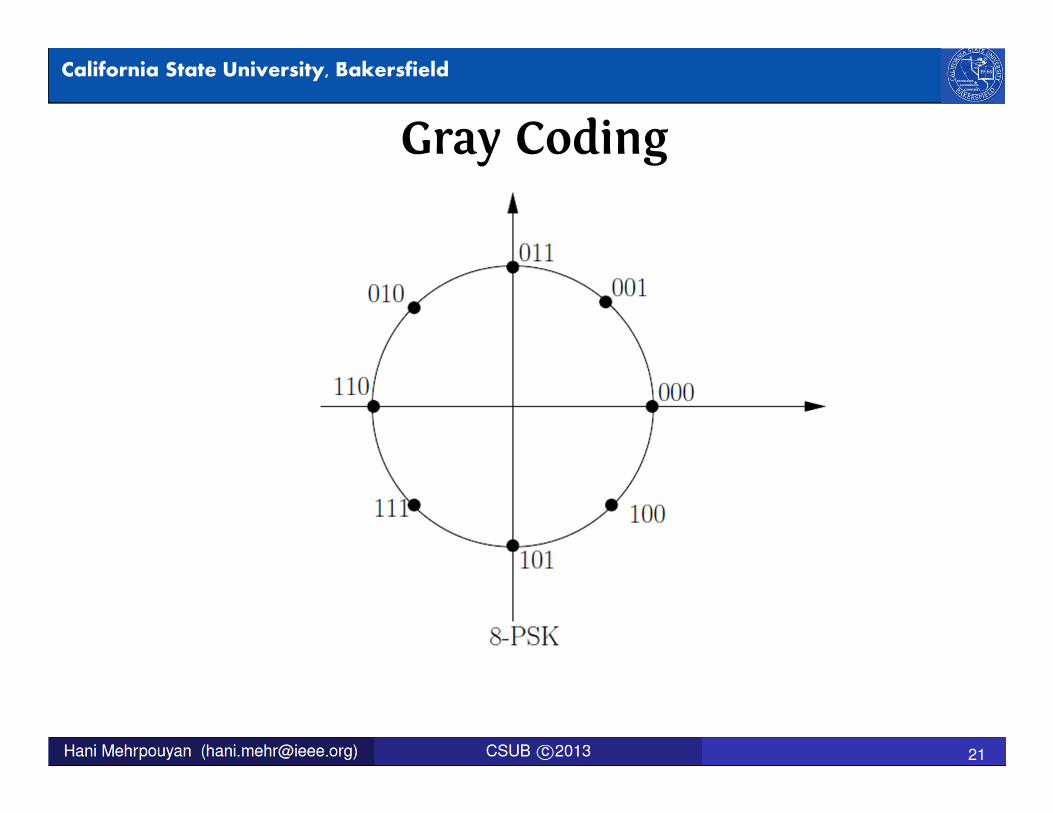
� We will use the Gray codes to label the points of the constellation keeping in mind that we are trying to label close points using closer and more similar labels.
Signals and Systems
21
California State University, Bakersfield
Gray Coding
Signals and Systems
22
California State University, Bakersfield
Gray Coding
Signals and Systems
23
California State University, Bakersfield
Comparison of BER and SER
Signals and Systems
24
California State University, Bakersfield
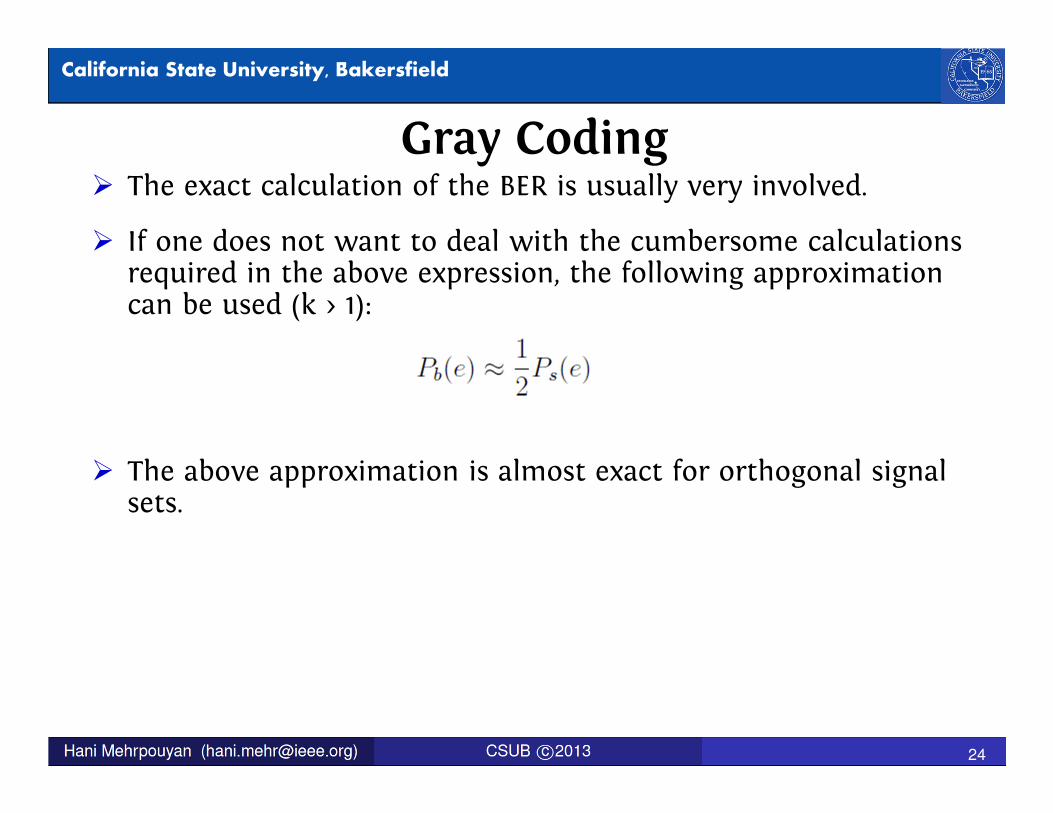
Gray Coding� The exact calculation of the BER is usually very involved.
� If one does not want to deal with the cumbersome calculations required in the above expression, the following approximation can be used (k > 1):
� The above approximation is almost exact for orthogonal signal sets.

Signals and Systems
25
California State University, Bakersfield