Embed Size (px)
Citation preview
LECTURE 2LECTURE 2TRANSFORMATIONS
OF THE EUROPEAN APPROACHES TO MANAGING INTERNATIONAL MIGRATION
(2 hrs.)
Determinants of the European migration system
Factors underlying national migration policies transformations
1. Determinants of the European migration system
Labour market internationalisation → shape regional and global migration systems.
Migration system includes two or more countries connected by migratory exchange.
Sustainability of migration ties within a migration system is determined by: - historic factors (colonial ties, political unions)- mutual interest in migratory exchange
Migration system include:- human mobility- financial flows- movement of goods & services
Modern migration systems: North American European Persian Gulf Asian-Pacific South American Eurasian
European migration system
from mass emigration to immigration region;
close economic, cultural, political, geographic ties between “core” countries;
diverse migratory flows;
new immigration and new sending countries;
changing geographic vectors of the European migration (from SOUTH-NORTH to EAST-WEST migration);
migrant attractive countries (West, North, South, Central European states).
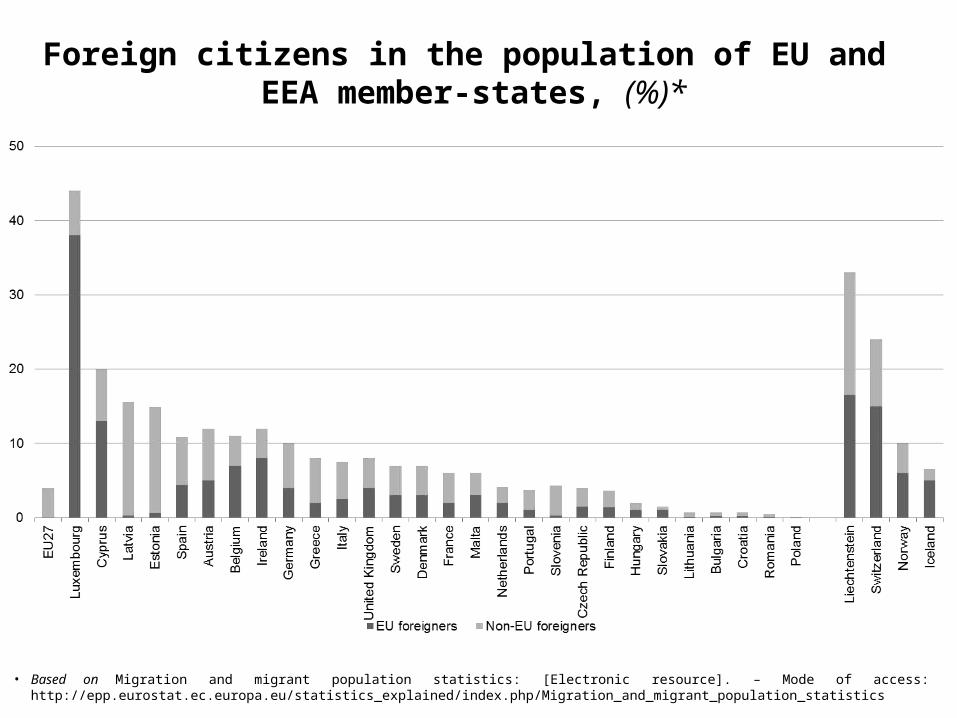
Foreign citizens in the population of EU and EEA member-states, (%)*
• Based on Migration and migrant population statistics: [Electronic resource]. – Mode of access: http://epp.eurostat.ec.europa.eu/statistics_explained/index.php/Migration_and_migrant_population_statistics
Around 3.4 million people immigrated to one of the EU-27 Member States, and at least 2.7 million emigrants were reported to have left an EU-27 Member State in 2012.
Those include:1.7 million immigrants from countries outside the EU-27+1.7 million people previously residing in an EU-27 Member State
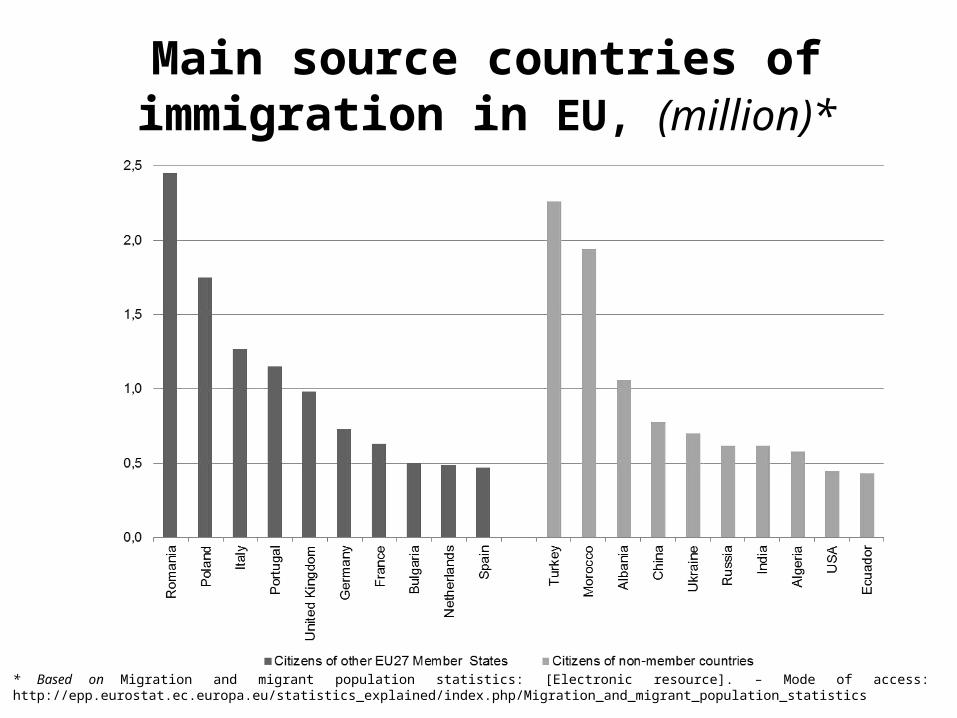
Main source countries of immigration in EU, (million)*
* Based on Migration and migrant population statistics: [Electronic resource]. – Mode of access: http://epp.eurostat.ec.europa.eu/statistics_explained/index.php/Migration_and_migrant_population_statistics
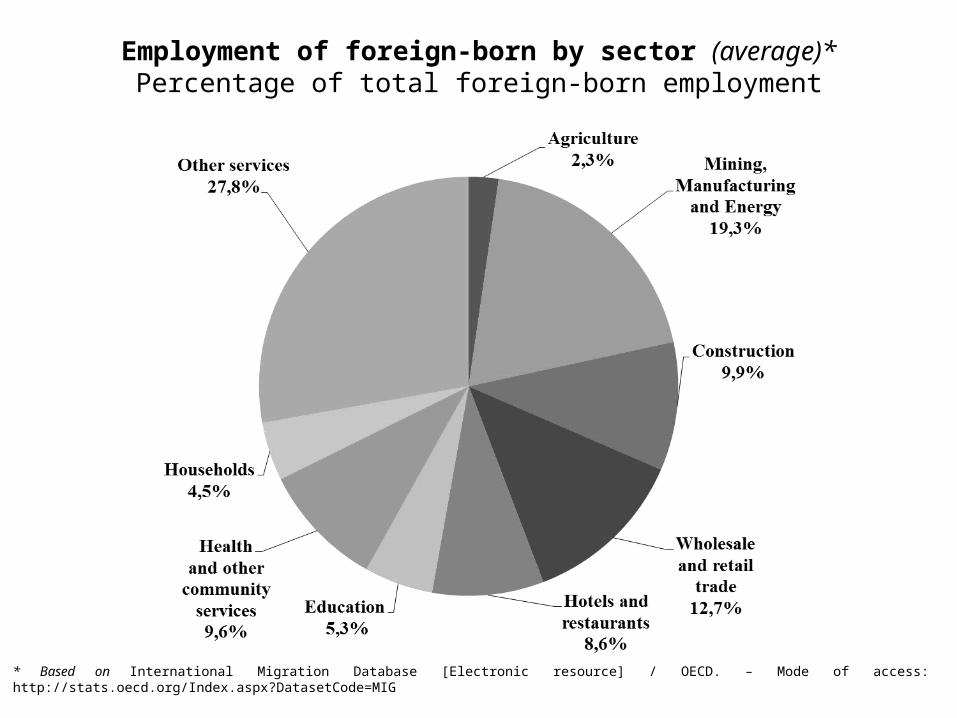
Employment of foreign-born by sector (average)*Percentage of total foreign-born employment
* Based on International Migration Database [Electronic resource] / OECD. – Mode of access: http://stats.oecd.org/Index.aspx?DatasetCode=MIG
European migration system attributes:
complicated & diversified structure;
several sub-systems (by regions, e.g. the UK, North European countries).
2. Factors underlying national migration policies transformations
Since 1990-s - the “new migration” era of European migration
“New” due to the scales of immigration (outnumbering the volumes of post-war immigration to Europe)
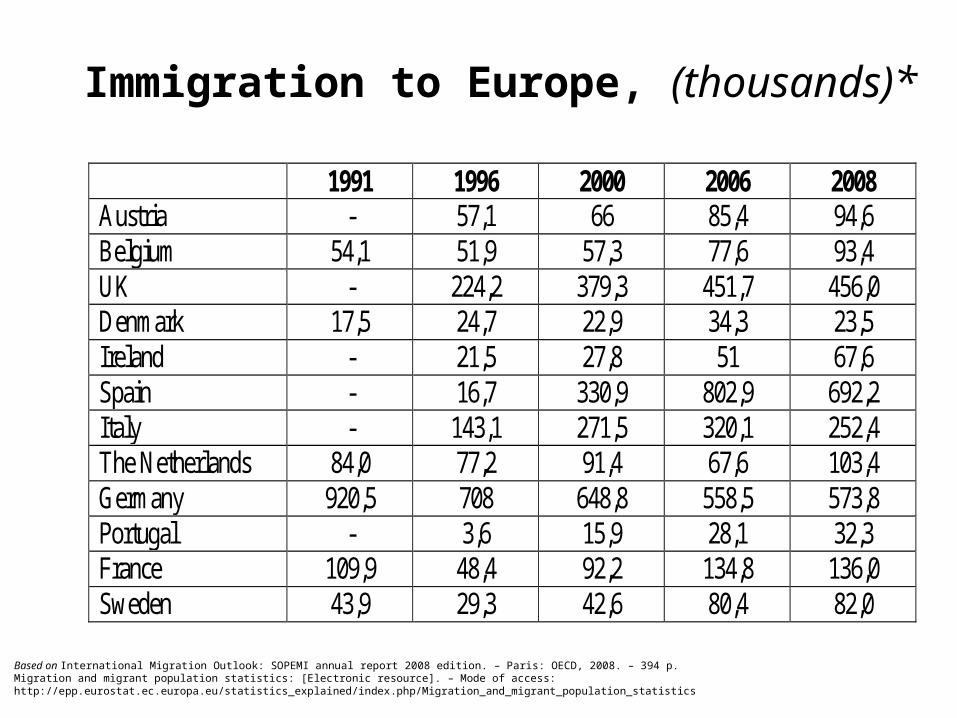
Immigration to Europe, (thousands)*
1991 1996 2000 2006 2008 Austria - 57,1 66 85,4 94,6 Belgium 54,1 51,9 57,3 77,6 93,4 UK - 224,2 379,3 451,7 456,0 Denmark 17,5 24,7 22,9 34,3 23,5 Ireland - 21,5 27,8 51 67,6 Spain - 16,7 330,9 802,9 692,2 Italy - 143,1 271,5 320,1 252,4 The Netherlands 84,0 77,2 91,4 67,6 103,4 Germany 920,5 708 648,8 558,5 573,8 Portugal - 3,6 15,9 28,1 32,3 France 109,9 48,4 92,2 134,8 136,0 Sweden 43,9 29,3 42,6 80,4 82,0
Based on International Migration Outlook: SOPEMI annual report 2008 edition. – Paris: OECD, 2008. – 394 p.Migration and migrant population statistics: [Electronic resource]. – Mode of access: http://epp.eurostat.ec.europa.eu/statistics_explained/index.php/Migration_and_migrant_population_statistics
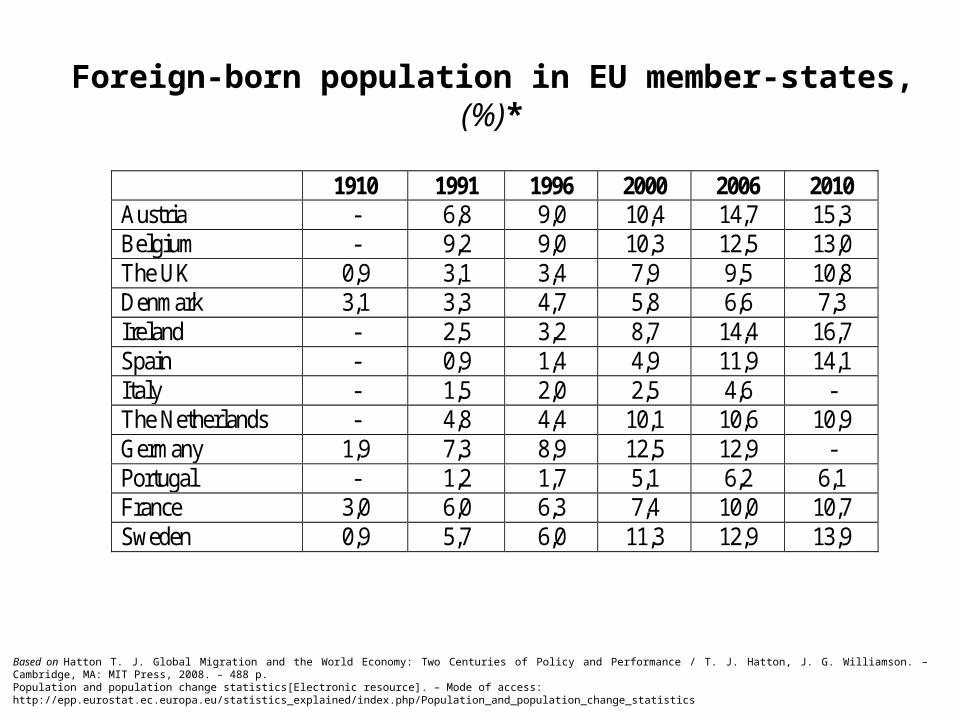
Foreign-born population in EU member-states, (%)*
1910 1991 1996 2000 2006 2010 Austria - 6,8 9,0 10,4 14,7 15,3 Belgium - 9,2 9,0 10,3 12,5 13,0 The UK 0,9 3,1 3,4 7,9 9,5 10,8 Denmark 3,1 3,3 4,7 5,8 6,6 7,3 Ireland - 2,5 3,2 8,7 14,4 16,7 Spain - 0,9 1,4 4,9 11,9 14,1 Italy - 1,5 2,0 2,5 4,6 - The Netherlands - 4,8 4,4 10,1 10,6 10,9 Germany 1,9 7,3 8,9 12,5 12,9 - Portugal - 1,2 1,7 5,1 6,2 6,1 France 3,0 6,0 6,3 7,4 10,0 10,7 Sweden 0,9 5,7 6,0 11,3 12,9 13,9
Based on Hatton T. J. Global Migration and the World Economy: Two Centuries of Policy and Performance / T. J. Hatton, J. G. Williamson. – Cambridge, MA: MIT Press, 2008. – 488 p.Population and population change statistics[Electronic resource]. – Mode of access: http://epp.eurostat.ec.europa.eu/statistics_explained/index.php/Population_and_population_change_statistics
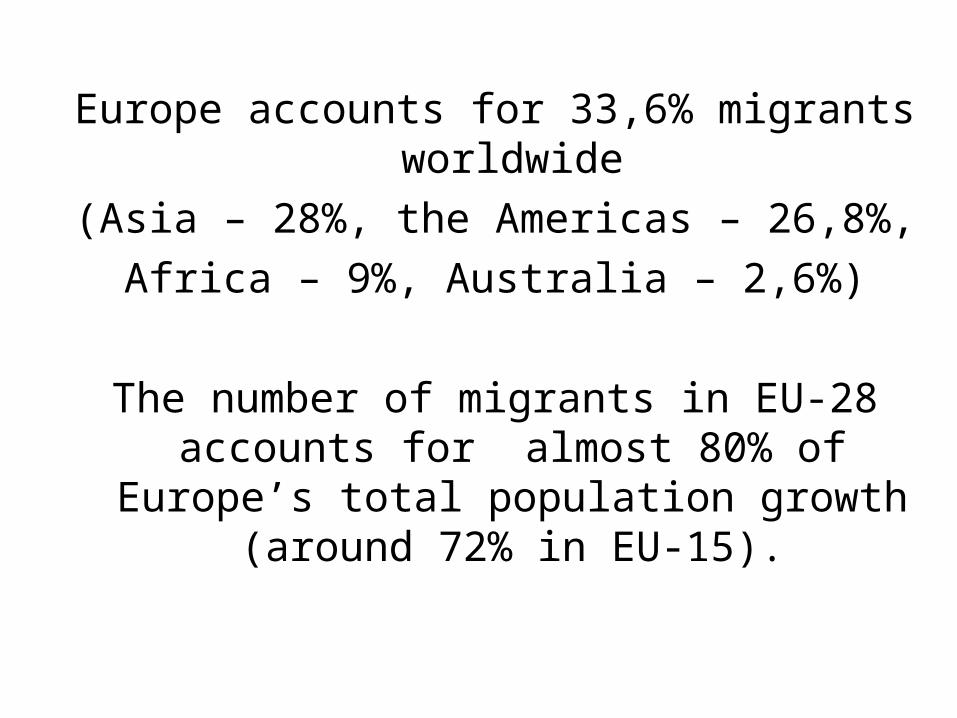
Europe accounts for 33,6% migrants worldwide
(Asia – 28%, the Americas – 26,8%,
Africa – 9%, Australia – 2,6%)
The number of migrants in EU-28 accounts for almost 80% of Europe’s total
population growth (around 72% in EU-15).
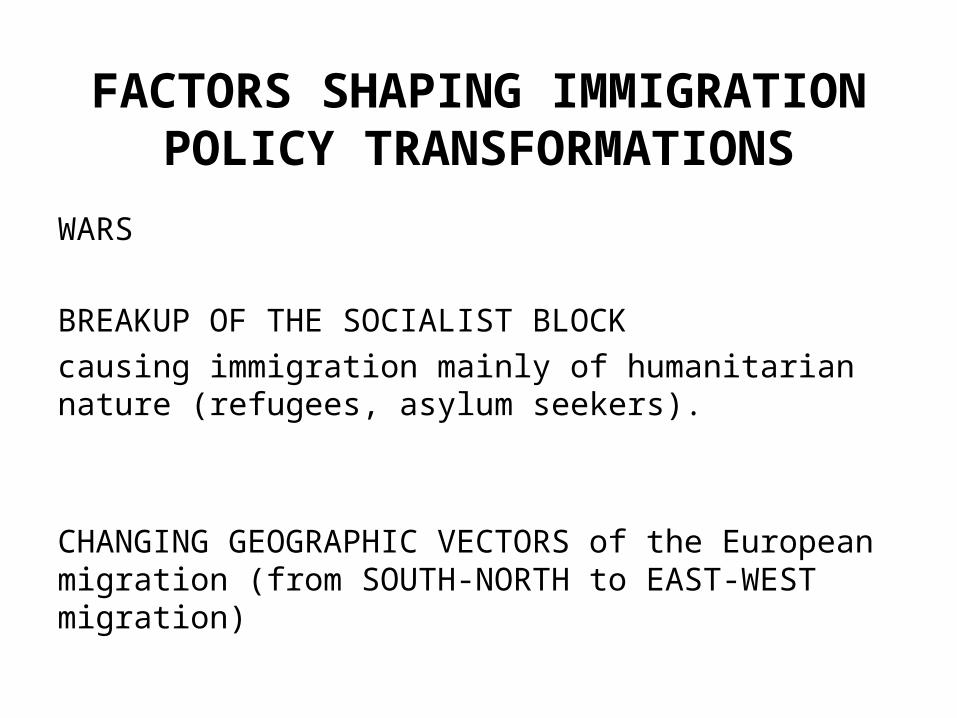
FACTORS SHAPING IMMIGRATION POLICY TRANSFORMATIONS
WARS
BREAKUP OF THE SOCIALIST BLOCK
causing immigration mainly of humanitarian nature (refugees, asylum seekers).
CHANGING GEOGRAPHIC VECTORS of the European migration (from SOUTH-NORTH to EAST-WEST migration)
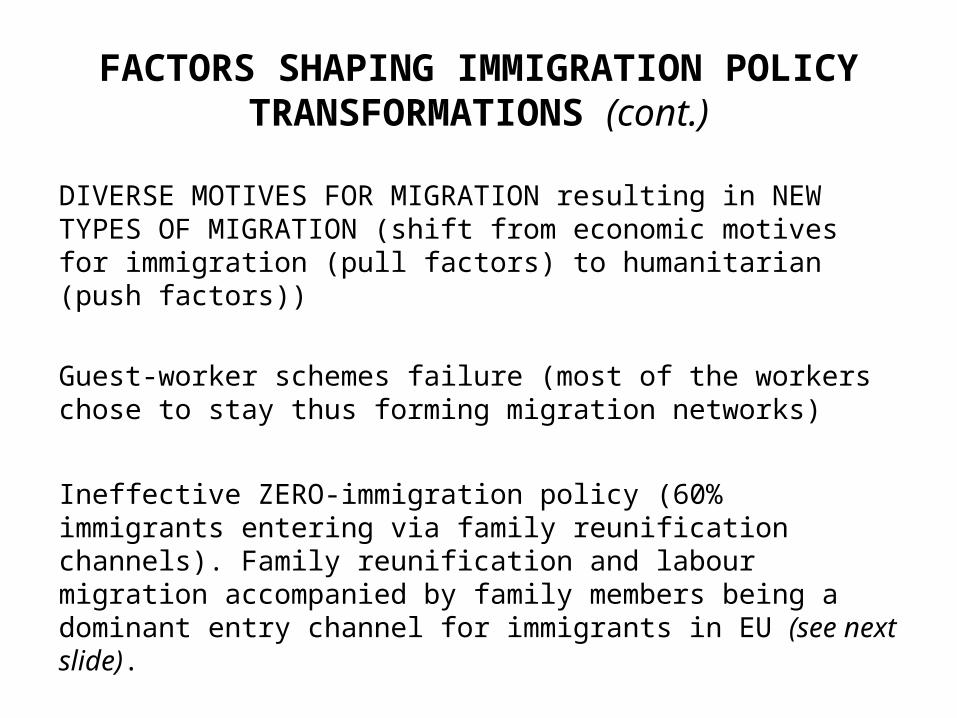
FACTORS SHAPING IMMIGRATION POLICY TRANSFORMATIONS (cont.)
DIVERSE MOTIVES FOR MIGRATION resulting in NEW TYPES OF MIGRATION (shift from economic motives for immigration (pull factors) to humanitarian (push factors))
Guest-worker schemes failure (most of the workers chose to stay thus forming migration networks)
Ineffective ZERO-immigration policy (60% immigrants entering via family reunification channels). Family reunification and labour migration accompanied by family members being a dominant entry channel for immigrants in EU (see next slide).
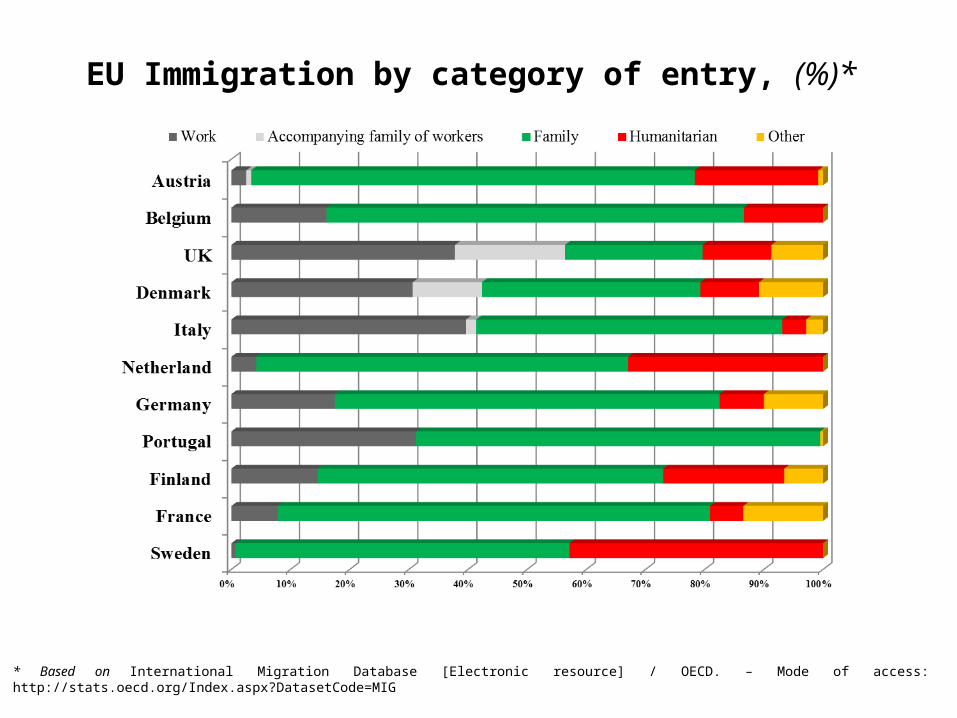
EU Immigration by category of entry, (%)*
* Based on International Migration Database [Electronic resource] / OECD. – Mode of access: http://stats.oecd.org/Index.aspx?DatasetCode=MIG
BOOSTING OVERALL EU COMPETITIVENESS by stimulating high-skilled immigration
The USA attract 54% of global amount of high-skilled migrants
with 84% low-skilled and only 5% high-skilled migrants heading to EU
FACTORS SHAPING IMMIGRATION POLICY TRANSFORMATIONS (cont.)
FACTORS SHAPING IMMIGRATION POLICY TRANSFORMATIONS (cont.)
Countries forming the core of EU have the least share of high-skilled immigrants in total population.
According to UN 67 Governments implement policies to raise immigration of highly skilled workers (Denmark, UK, Latvia, Lithuania, the Netherlands, Germany and France) (an increase from 22% in 2005 to 39% in 2011).
Others either maintain the existing levels or don’t intervene.
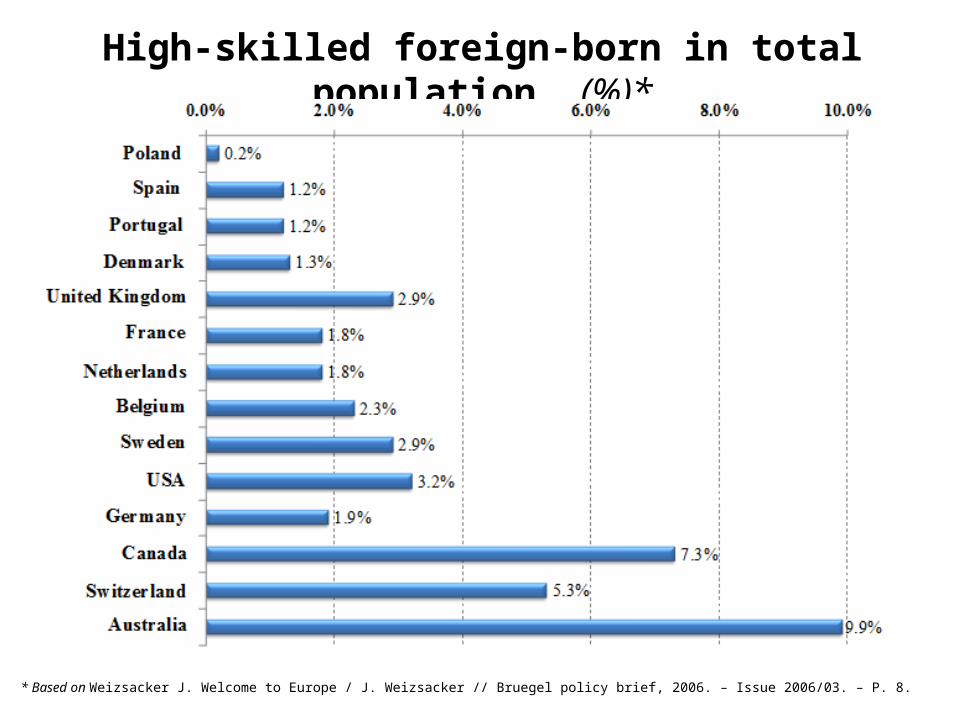
High-skilled foreign-born in total population, (%)*
* Based on Weizsacker J. Welcome to Europe / J. Weizsacker // Bruegel policy brief, 2006. – Issue 2006/03. – P. 8.
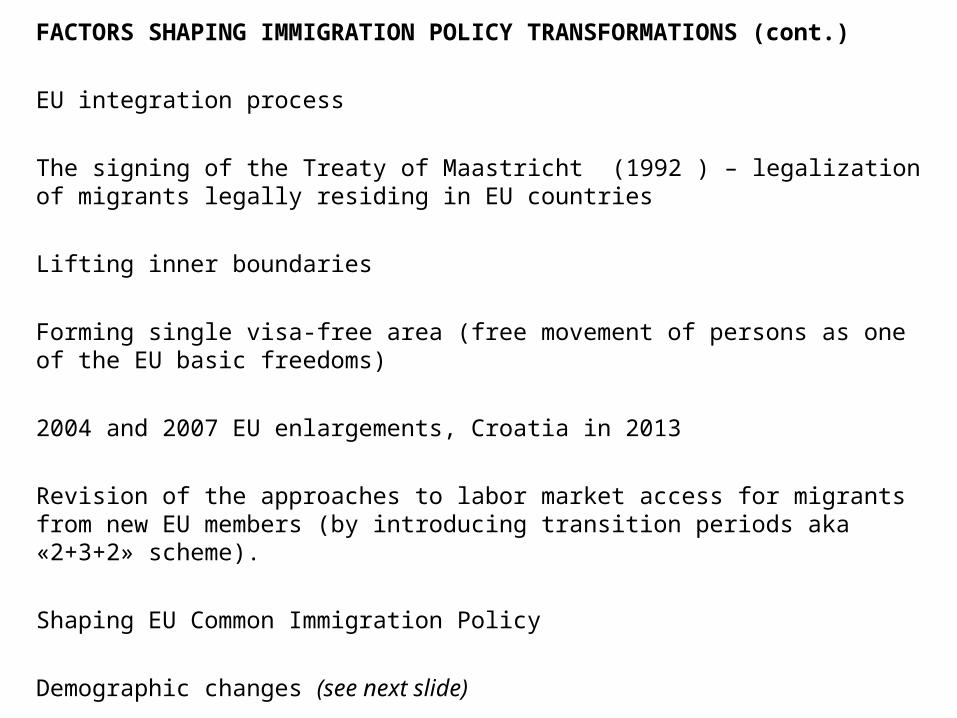
FACTORS SHAPING IMMIGRATION POLICY TRANSFORMATIONS (cont.)
EU integration process
The signing of the Treaty of Maastricht (1992 ) – legalization of migrants legally residing in EU countries
Lifting inner boundaries
Forming single visa-free area (free movement of persons as one of the EU basic freedoms)
2004 and 2007 EU enlargements, Croatia in 2013
Revision of the approaches to labor market access for migrants from new EU members (by introducing transition periods aka «2+3+2» scheme).
Shaping EU Common Immigration Policy
Demographic changes (see next slide)
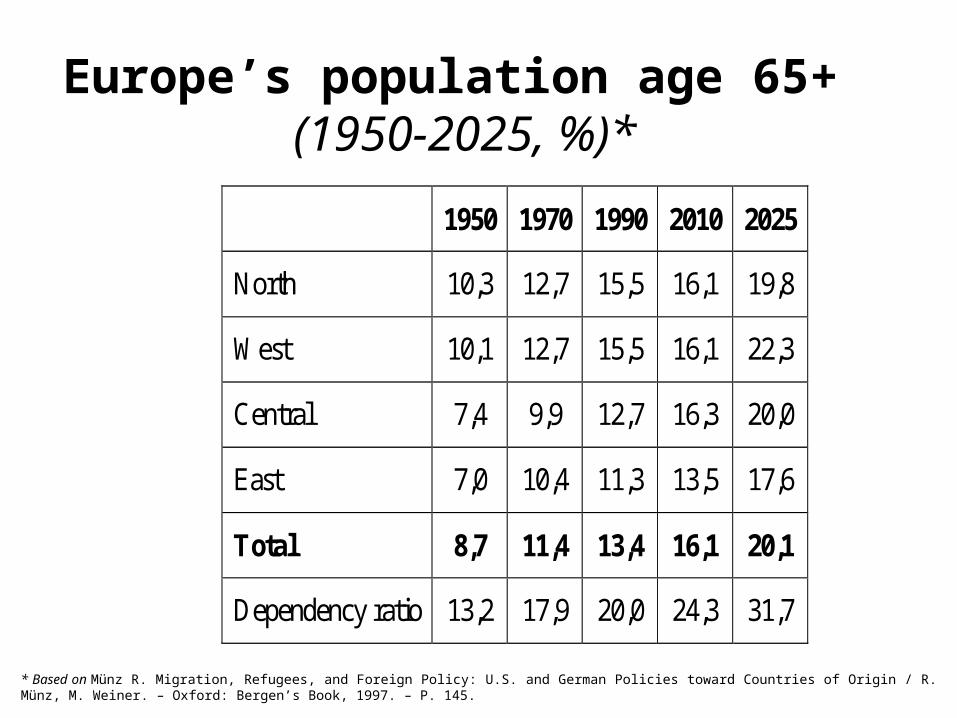
Europe’s population age 65+ (1950-2025, %)*
1950 1970 1990 2010 2025
North 10,3 12,7 15,5 16,1 19,8
West 10,1 12,7 15,5 16,1 22,3
Central 7,4 9,9 12,7 16,3 20,0
East 7,0 10,4 11,3 13,5 17,6
Total 8,7 11,4 13,4 16,1 20,1
Dependency ratio 13,2 17,9 20,0 24,3 31,7
* Based on Münz R. Migration, Refugees, and Foreign Policy: U.S. and German Policies toward Countries of Origin / R. Münz, M. Weiner. – Oxford: Bergen’s Book, 1997. – P. 145.
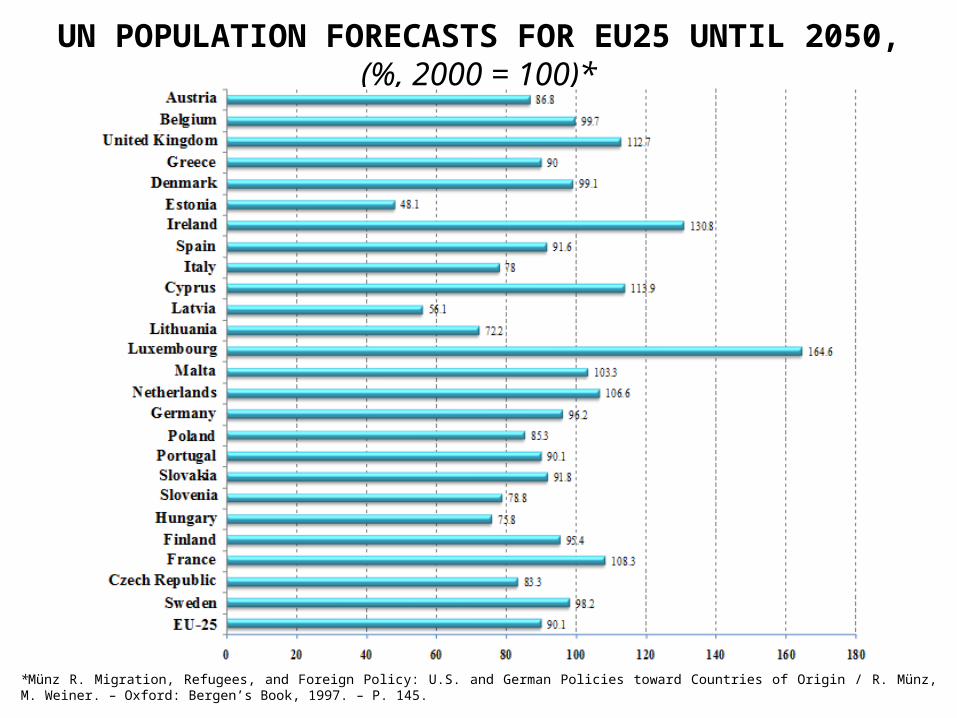
UN POPULATION FORECASTS FOR EU25 UNTIL 2050,(%, 2000 = 100)*
*Münz R. Migration, Refugees, and Foreign Policy: U.S. and German Policies toward Countries of Origin / R. Münz, M. Weiner. – Oxford: Bergen’s Book, 1997. – P. 145.
According to UN Forecasts between 2010-2050 Europe will need 1,6 million migrants annually.
Given 70% employment rate, the number of people employed per person aged 65 and over will decline from 2,7 in 2010 to 2,2 in 2020, 1,8 – 2030 and 1,5 in 2040
CONCLUDING REMARKS
•Increasing scales of immigration; •Rising share of immigrants in major receiving countries; •Shift in geographic vectors of European migration; •New motives and forms of migration;•Demographic challenges (ageing, low fertility rates);•EU competitiveness in global economy;•EU integration
Seminar 2. (2 hrs.)
1.The scale, dynamics and structure of the European migration.
2.Changes in the migration policy of the EU countries as a result of intensified global competition.
3.Demographic imbalances as a factor determining migration policy reform.
Individual assignments (6 hrs.)
1.Study the impacts of immigration motives diversification in the EU countries.
2.Define causes and consequences of the shift in geographic vectors of the European migration.
3.Argue the effects of European integration intensification on the nature of national migration policies.