Embed Size (px)
Citation preview

Lecture 2Hollywood Economics
John Sedgwick (London Metropolitan University)

Introduction
• In Hollywood Economics (2004), Arthur De Vany collected together a series of articles that he co-authored, principally with David Walls.
• These articles give analytical form to the industry.
• There are four key elements to their analysis.
Key analytical points1. Extreme statistics are associated with the statistical
distribution of film revenues - including the extremely small probability of any film, chosen randomly, generating sufficient box-office revenue for it to get into the top decile revenue group;
2. The pattern of film revenues repeats itself annually;
3. Positive information flows are critical if a film is to become a ‘hit’.
4. There are no formulas for guaranteeing ‘hit’ status - the ‘nobody knows’ principle.
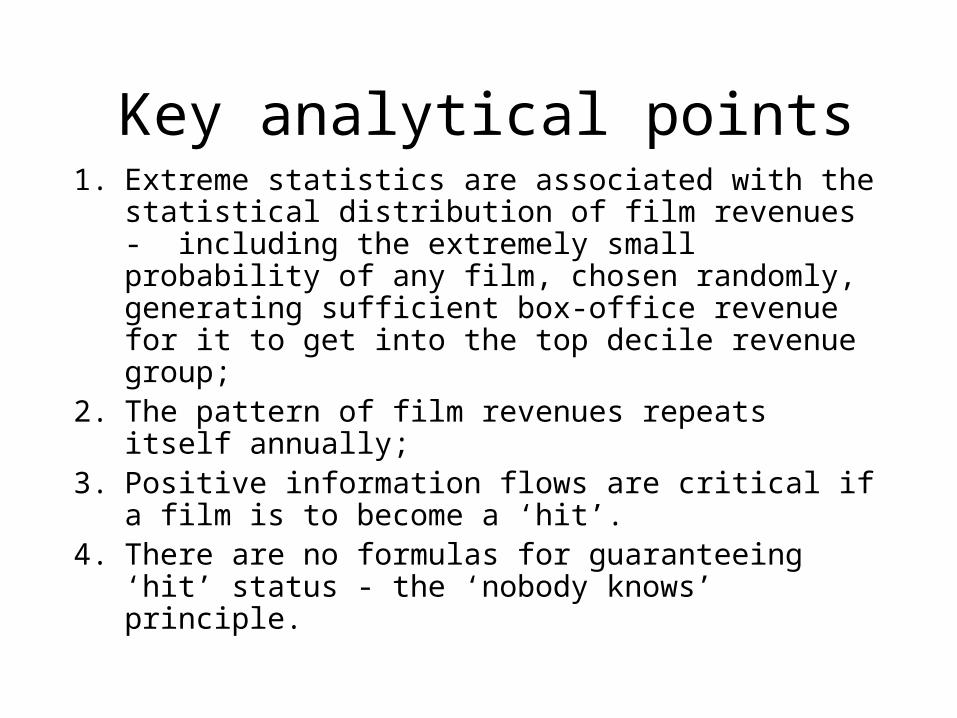
US Decile Box-Office Classification of Films released in 1998.
336
3613 12 6 4 6 2 1 2
0
50
100
150
200
250
300
350
400
21,61
7,522
43,23
4,833
64,85
2,144
86,46
9,455
108,0
86,76
6
129,7
04,07
7
151,3
21,38
8
172,9
38,69
9
194,5
56,01
0
216,1
73,32
1
End-points of US Box-Office Deciles
Fre
qu
enci
es

The industry is wild• The stable surface presented by the recurring
pattern of film revenues masks a turbulent competitive world, in which films compete head-to-head and, for the most part, enjoy extremely short life spans.
• Revenue distributions are governed by extreme events and exhibit high levels of kurtosis and skewness. Gini coefficients are close to 1.
• The mode, median and mean revenue of films released during any one season fall in the lowest decile band of the distribution.

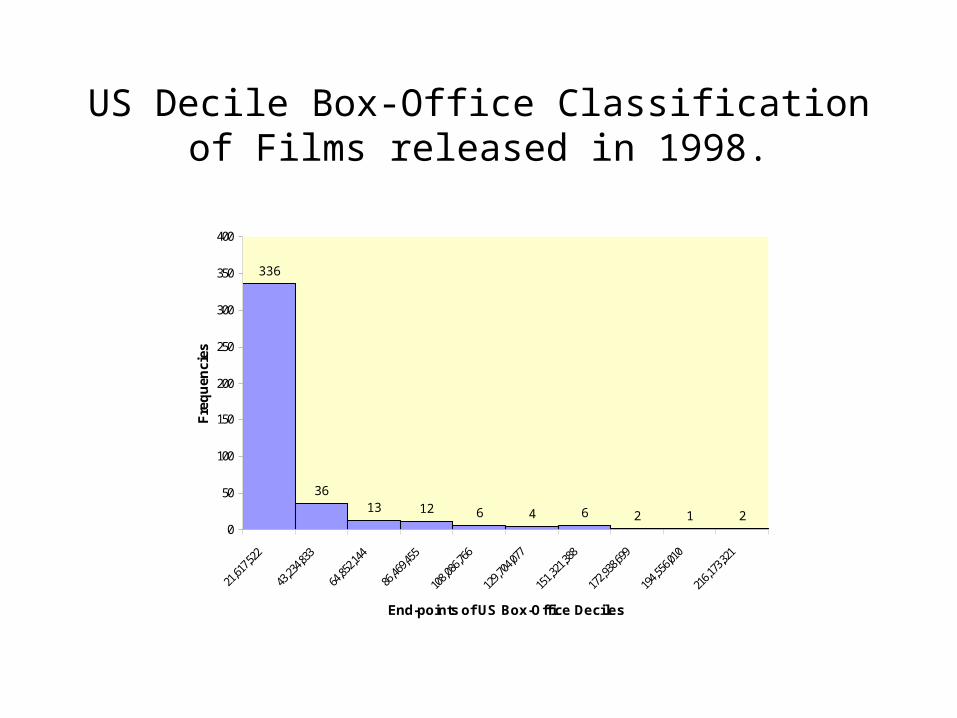
Market share volatility
• One manifestation of the short lives of films, is the rapidly changing configuration of market shares from week to week, as films drop out of the charts and new films enter.
• A near monopoly position enjoyed by a studio during one week is likely last only fleetingly.
Films and weeks at no.1, 1998
0
10,000,000
20,000,000
30,000,000
40,000,000
50,000,000
60,000,000
Titanic (13)
Lost in Space (1)C
ity of Angels (2)
The Big Hit(1)
He G
ot Gam
e (1)D
eep Impact (2)
Godzilla (2)
The Truman Show
(2)
The X Files: Fight the Future (1)D
octor Dolittle (1)
Armageddon (1)
Lethal Weapon 4 (1)
The Mask of Zorro (1)
Saving Private Ryan (3)
Blade (2)
There's Something A't M
ary (1)R
ounders (1)R
ush Hour (2)
Antz (2)
Practical Magic (1)
Pleasantville (1)Vam
pires (1)The W
aterboy (2)
The Rugrats M
ovie (1)A Bug's Life (2)
StarTrek: Insurrection (1)You've G
ot Mail (1)
Films and weeks at #1
Re
nta
l e
arn
ing
s (
$s
)

Industry Organisation
• The industry is organised to maximise revenue. To this end supply must adjust flexibly and rapidly to changing levels of demand.
• While nobody knows ex ante which films are going to generate an information bandwagon, exhibition does know how to exploit that bandwagon, once evident.

Radical uncertainty
• De Vany depicts an industry in which radical uncertainty prevails.
• What-is-more, in this turbulent environment most films make losses.
• So, why do capitalist organisations make films? Why not leave filmmaking to those committed enough to treat it as a quasi -hobby?
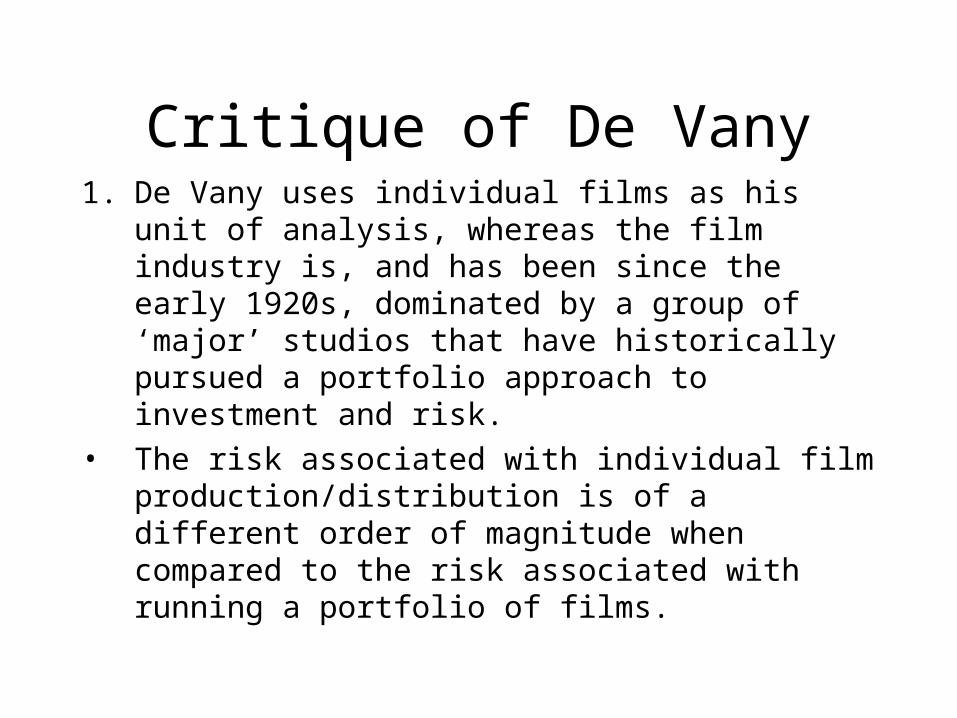
Critique of De Vany1. De Vany uses individual films as his unit of
analysis, whereas the film industry is, and has been since the early 1920s, dominated by a group of ‘major’ studios that have historically pursued a portfolio approach to investment and risk.
• The risk associated with individual film production/distribution is of a different order of magnitude when compared to the risk associated with running a portfolio of films.
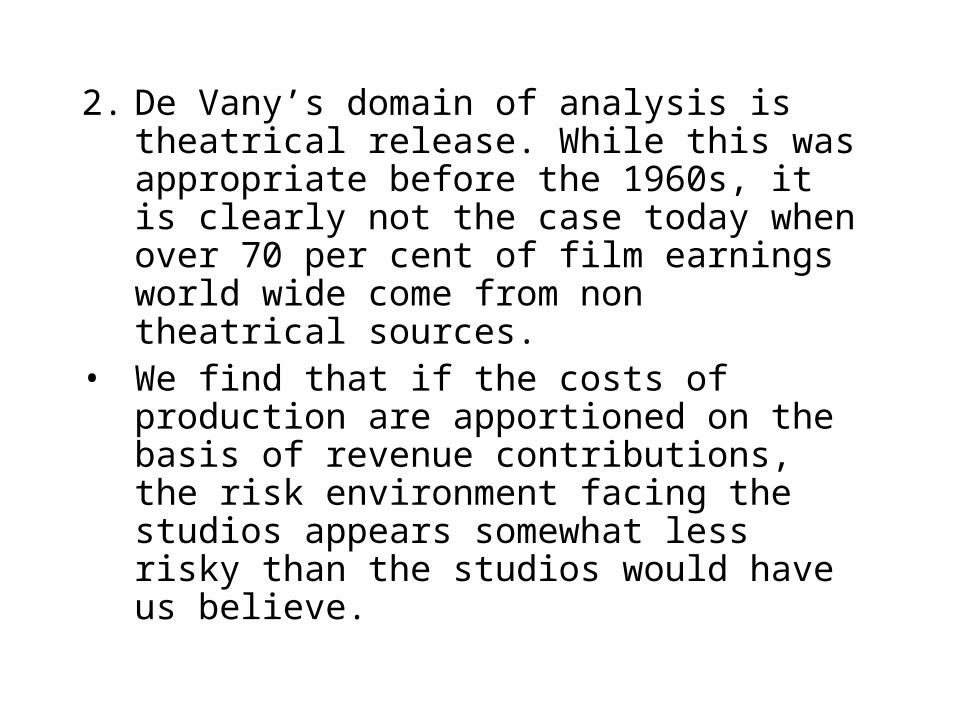
2. De Vany’s domain of analysis is theatrical release. While this was appropriate before the 1960s, it is clearly not the case today when over 70 per cent of film earnings world wide come from non theatrical sources.
• We find that if the costs of production are apportioned on the basis of revenue contributions, the risk environment facing the studios appears somewhat less risky than the studios would have us believe.
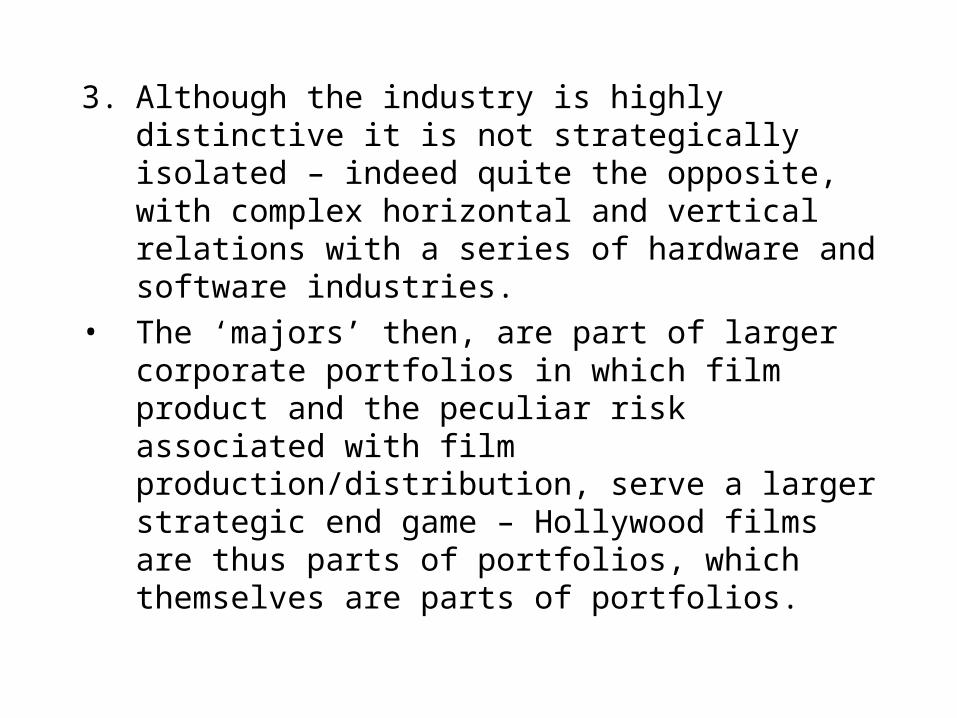
3. Although the industry is highly distinctive it is not strategically isolated – indeed quite the opposite, with complex horizontal and vertical relations with a series of hardware and software industries.
• The ‘majors’ then, are part of larger corporate portfolios in which film product and the peculiar risk associated with film production/distribution, serve a larger strategic end game – Hollywood films are thus parts of portfolios, which themselves are parts of portfolios.
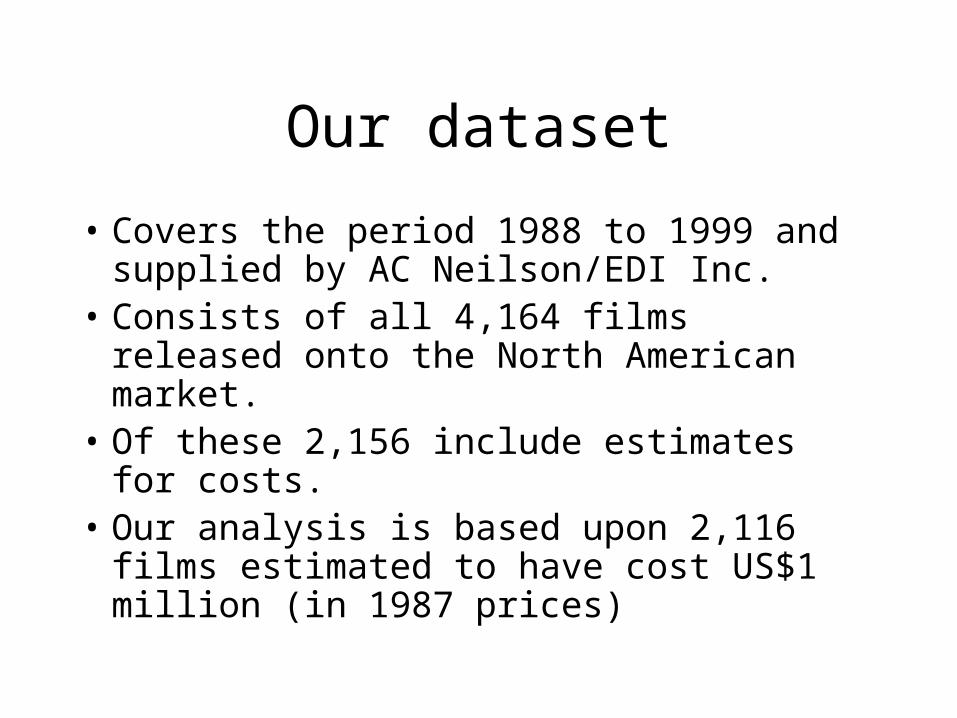
Our dataset
• Covers the period 1988 to 1999 and supplied by AC Neilson/EDI Inc.
• Consists of all 4,164 films released onto the North American market.
• Of these 2,156 include estimates for costs.• Our analysis is based upon 2,116 films
estimated to have cost US$1 million (in 1987 prices)
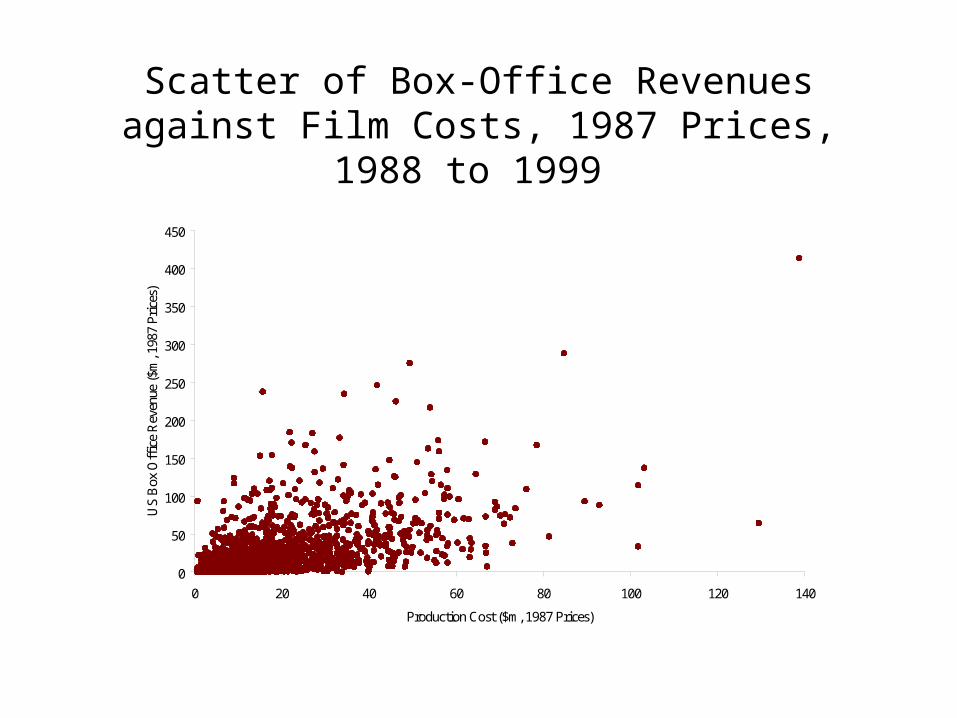
Scatter of Box-Office Revenues against Film Costs, 1987 Prices, 1988 to 1999
0
50
100
150
200
250
300
350
400
450
0 20 40 60 80 100 120 140
Production Cost ($m, 1987 Prices)
US
Box
Off
ice
Rev
enue
($m
, 198
7 Pr
ices
)
Comment
• Higher cost films tend to generate higher revenues, but higher cost films also exhibit considerable variability in their revenue performance – high production budgets do not guarantee high revenues. Hence, “nobody knows”.
Estimation of Profits
In estimating profits we adjust• rental incomes, expressing them as a proportion of
North American box-office revenues• production and distribution costs, scaling them
down to reflect a) the dataset is North American specific – with the exception of 514 films, it does not give information on foreign earnings, and b) ancillary revenue streams amount to 70% of film earnings.
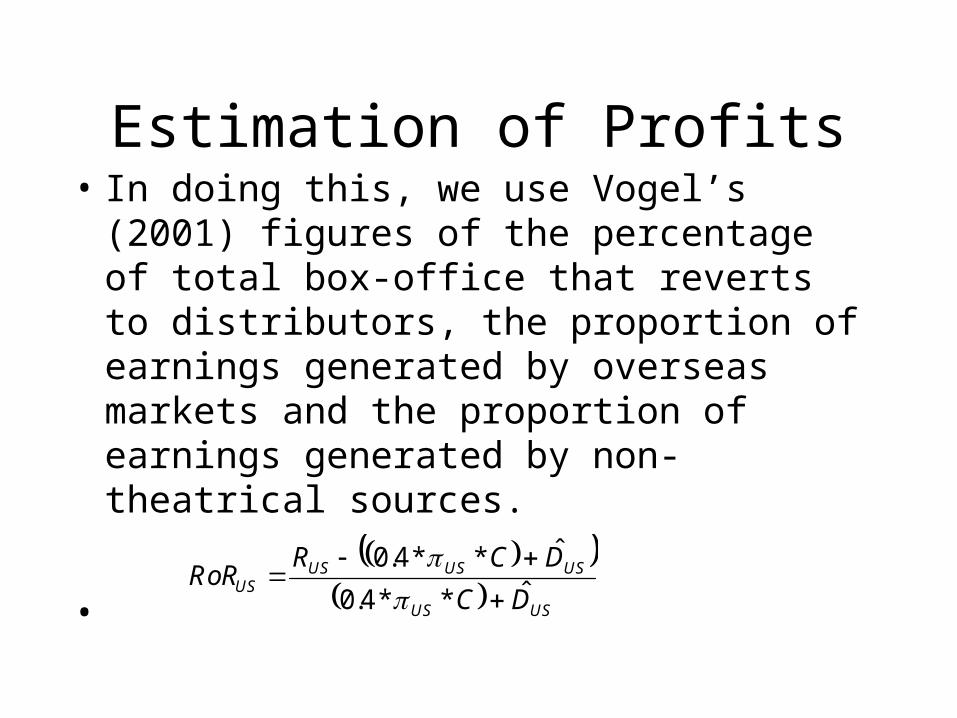
Estimation of Profits• In doing this, we use Vogel’s (2001) figures
of the percentage of total box-office that reverts to distributors, the proportion of earnings generated by overseas markets and the proportion of earnings generated by non- theatrical sources.
• USUS
USUSUSUS
DC
DCRRoR
ˆ**4.0
ˆ**4.0
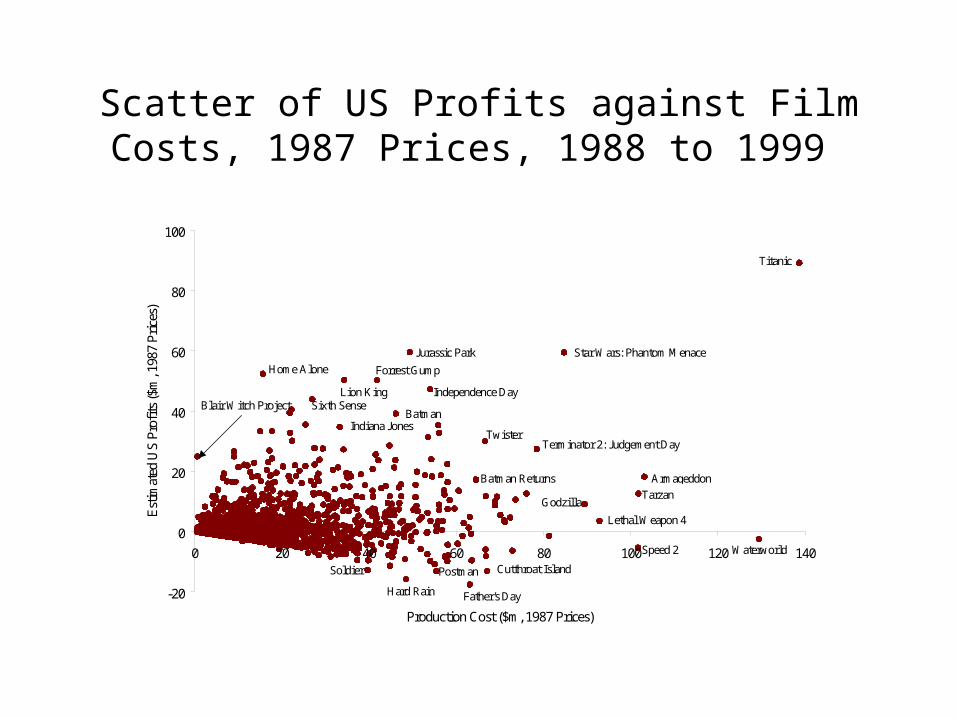
Scatter of US Profits against Film Costs, 1987 Prices, 1988 to 1999
-20
0
20
40
60
80
100
0 20 40 60 80 100 120 140
Production Cost ($m, 1987 Prices)
Est
imat
ed U
S P
rofi
ts (
$m, 1
987
Pri
ces)
Titanic
WaterworldSpeed 2
Armageddon
Tarzan
Terminator 2: Judgement Day
Star Wars: Phantom Menace
Godzilla
Lethal Weapon 4
Blair Witch Project
Jurassic Park
Home Alone
Independence DaySixth Sense
Forrest Gump
Indiana Jones
Lion King
Batman
Father's DayHard Rain
Cutthroat IslandSoldier Postman
Twister
Batman Returns
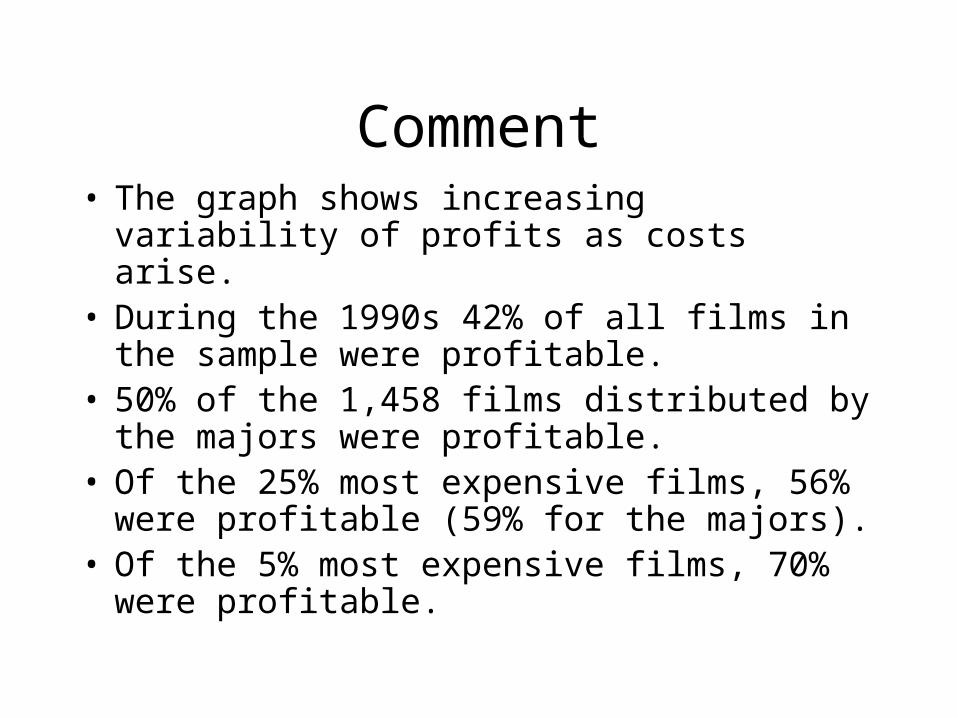
Comment• The graph shows increasing variability of profits
as costs arise.• During the 1990s 42% of all films in the sample
were profitable.• 50% of the 1,458 films distributed by the majors
were profitable.• Of the 25% most expensive films, 56% were
profitable (59% for the majors).• Of the 5% most expensive films, 70% were
profitable.
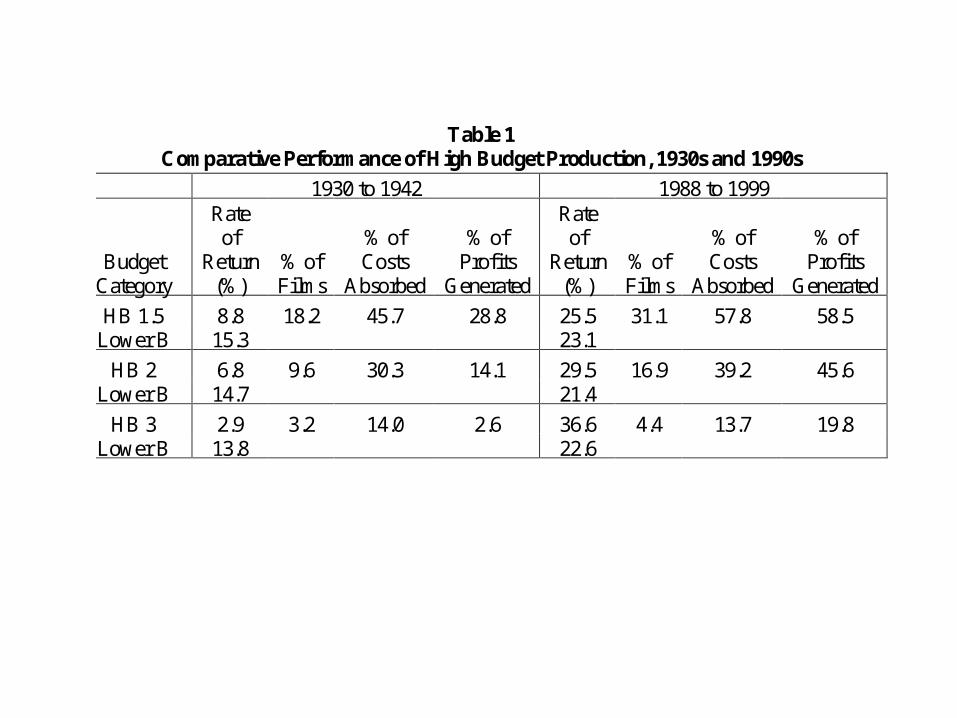
Table 1 Comparative Performance of High Budget Production, 1930s and 1990s
1930 to 1942 1988 to 1999
Budget Category
Rate of
Return (%)
% of Films
% of Costs
Absorbed
% of
Profits Generated
Rate of
Return (%)
% of Films
% of Costs
Absorbed
% of
Profits Generated
HB 1.5 8.8 18.2 45.7 28.8 25.5 31.1 57.8 58.5 Lower B 15.3 23.1
HB 2 6.8 9.6 30.3 14.1 29.5 16.9 39.2 45.6 Lower B 14.7 21.4
HB 3 2.9 3.2 14.0 2.6 36.6 4.4 13.7 19.8 Lower B 13.8 22.6
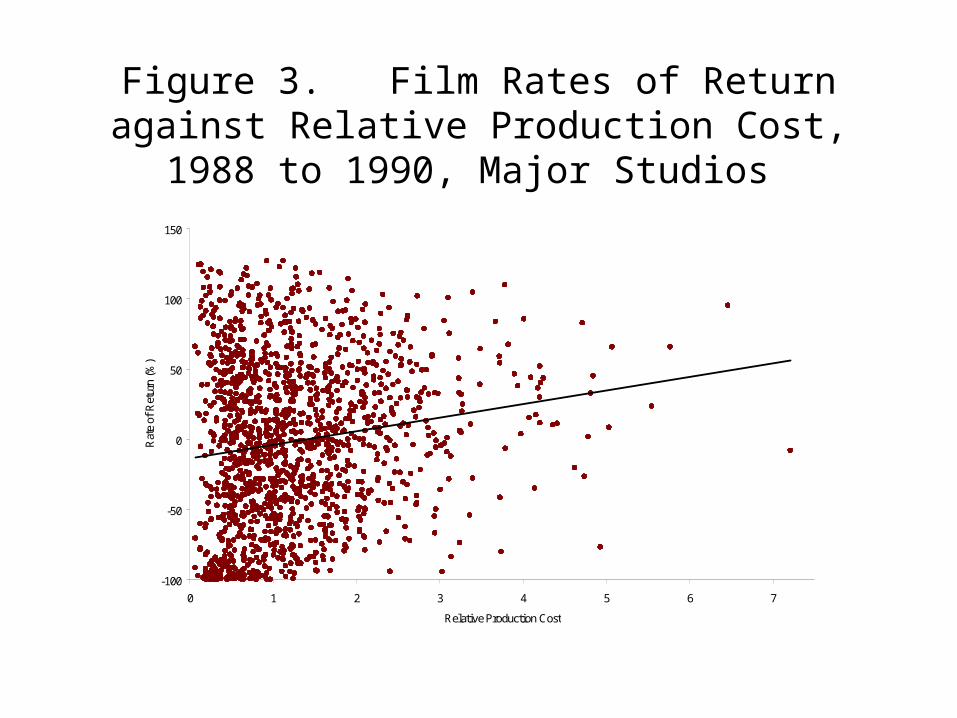
Figure 3. Film Rates of Return against Relative Production Cost, 1988 to 1990, Major Studios
-100
-50
0
50
100
150
0 1 2 3 4 5 6 7
Relative Production Cost
Rat
e of
Ret
urn
(%)
• In contrast to the Studio Period of the 1930s and 1940s, the major source of profits during the 1990s was high budget production, with lower budget production representing a much more uncertain alternative.
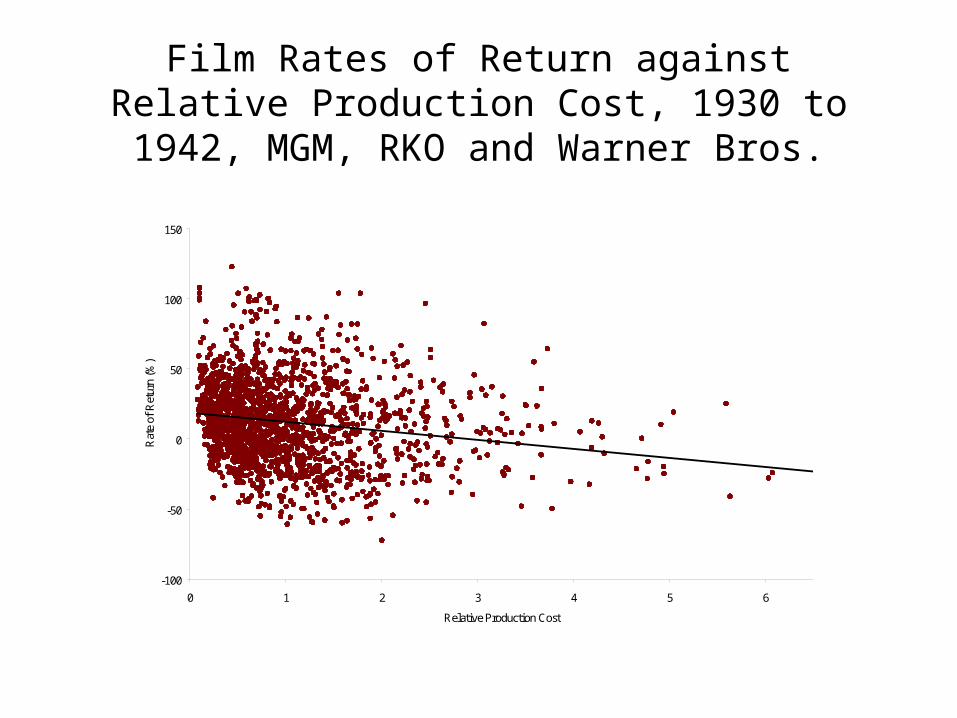
Film Rates of Return against Relative Production Cost, 1930 to 1942, MGM, RKO and Warner Bros.
-100
-50
0
50
100
150
0 1 2 3 4 5 6
Relative Production Cost
Rat
e of
Ret
urn
(%)
Conclusion
• Studios produce portfolios of films. In doing this they are able to balance risk, even though the returns to particular films vary enormously enormously. By adjusting costs downwards to reflect the fact that the North American market for films constitutes about 15 per cent of the average revenue earned by studio productions, the industry can be shown to be highly profitable.