Embed Size (px)
Citation preview

Lecture 14(ii) Announcements 1. Final Exam: Sat, Dec. 19, 6:30p.m.-8:30
Makeup final on Tues. Dec 22 9:00a.m.-11:00 a.m..
REGISTER for makeup [email protected] by Monday, Dec. 14, 4:30pm
Final OneStop Page (bottom of Moodle) 2. Platform Debate in discussion sections this week about immigration. (See link at Moodle for reading to do before the debate.)
Inequality
1. Determination of Wages 2. Increase in the skill premium and skill-biased technical change. 3. The economics of superstars 4. Henry Ford and unskilled-biased technical change
What has happened to Average Real Wages over time in the United States? (Real Wages means wages adjusted for inflation.) Before looking at the table, let’s define average Labor Productivity as Total Output in a year divided by Total Hours Worked Now look at the growth in average wages and the growth in average labor productivity
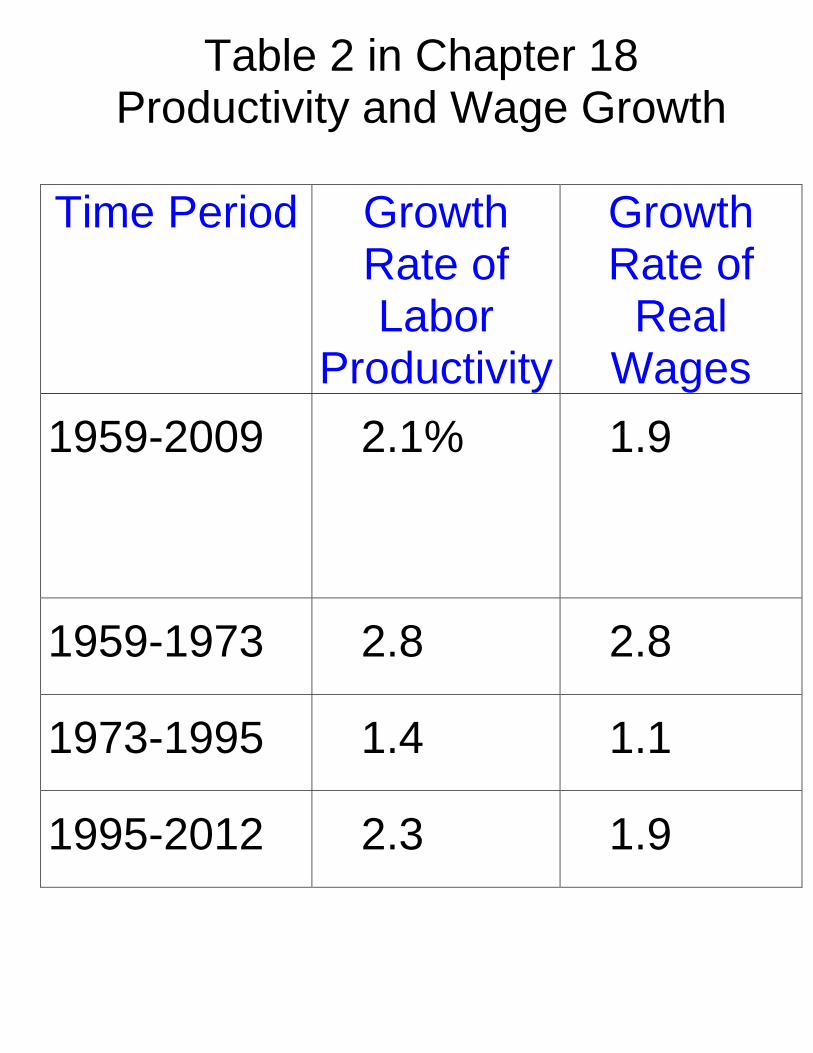
Table 2 in Chapter 18 Productivity and Wage Growth
Time Period Growth
Rate of Labor
Productivity
Growth Rate of
Real Wages
1959-2009
2.1% 1.9
1959-1973 2.8 2.8
1973-1995 1.4 1.1
1995-2012 2.3 1.9
Clear pattern here that wage growth is associated with productivity growth. What is the source of labor productivity growth? Main source: technological change. That is what is going on with average wages. Next, let’s discuss differences in wages across workers.
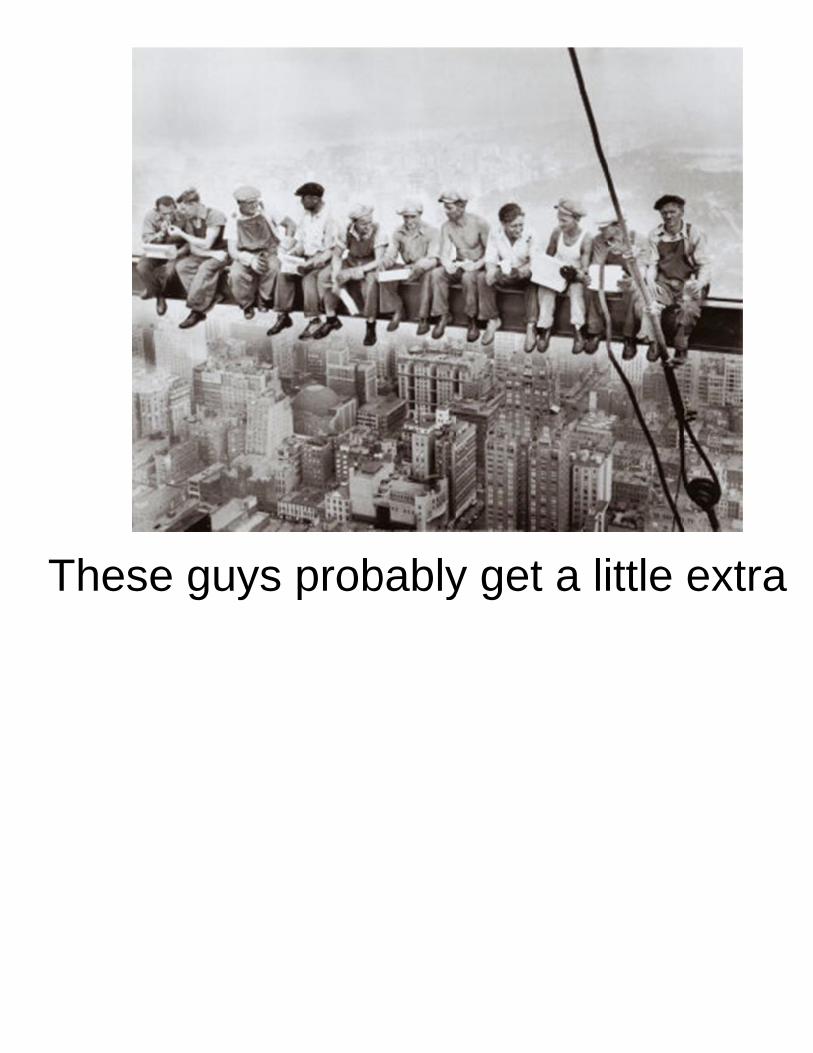
First factor Compensating Wage Differentials People with the same skills tend to get different pay if they work at jobs with different characteristics. More dangerous, unpleasant jobs tend to get higher pay (everything else the same.)
T
hesee guuys p
probbablyy gett a liittle extrra
Pay in North Dakota during the Bakken Oil Boom? $80k year to drive a truck? Why is this a compensating differential?
Second factor: Workers differ in the amount of human capital they have acquired (that is skills/education) Workers with more human capital tend to get higher wages. Next the skill premium: Define Skilled workers as college and above, unskilled as high school educated, we showed that the skill premium
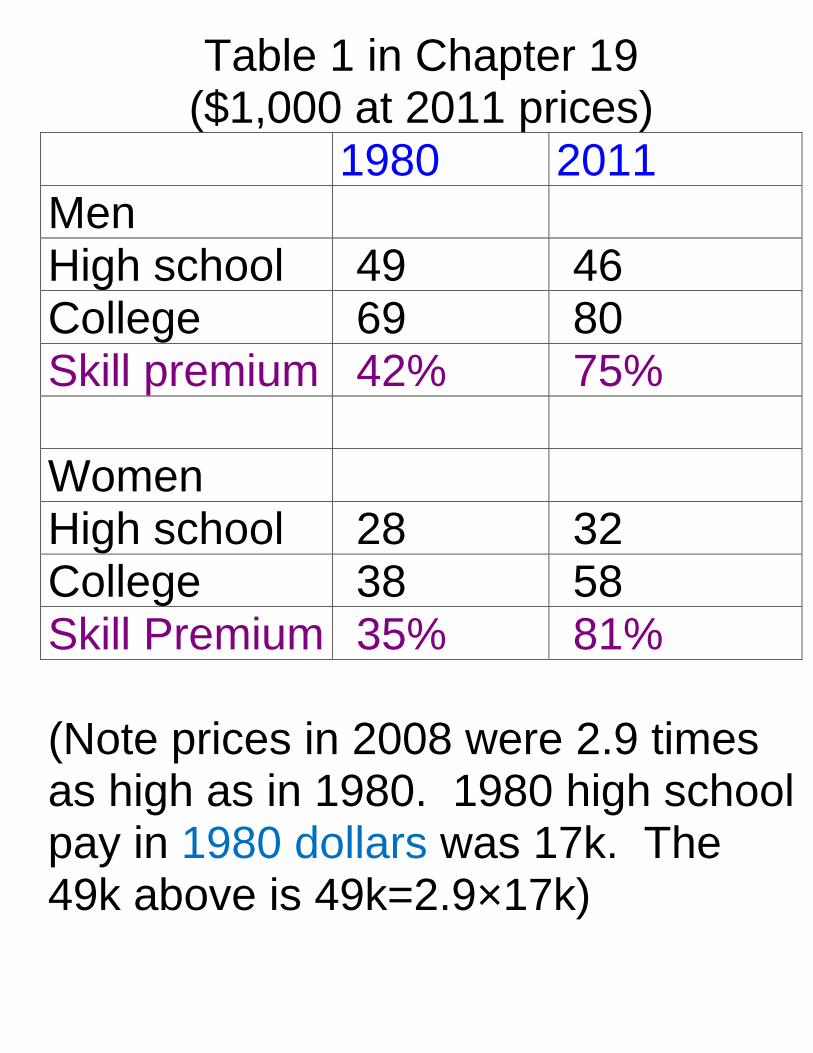
Table 1 in Chapter 19 ($1,000 at 2011 prices)
1980 2011 Men High school 49 46 College 69 80 Skill premium 42% 75% Women High school 28 32 College 38 58 Skill Premium 35% 81% (Note prices in 2008 were 2.9 times as high as in 1980. 1980 high school pay in 1980 dollars was 17k. The 49k above is 49k=2.9×17k)
Possible ways that demand for skill has gone up relative to demand for unskilled labor. Will go through two factors, 1) Skill-Biased Technical Change 2) globalization Both matter, but we won’t settle anything today about the relative importance of the different factors. Then dicuss an additional factor, decline in unions not based on shifts in demand and supply.
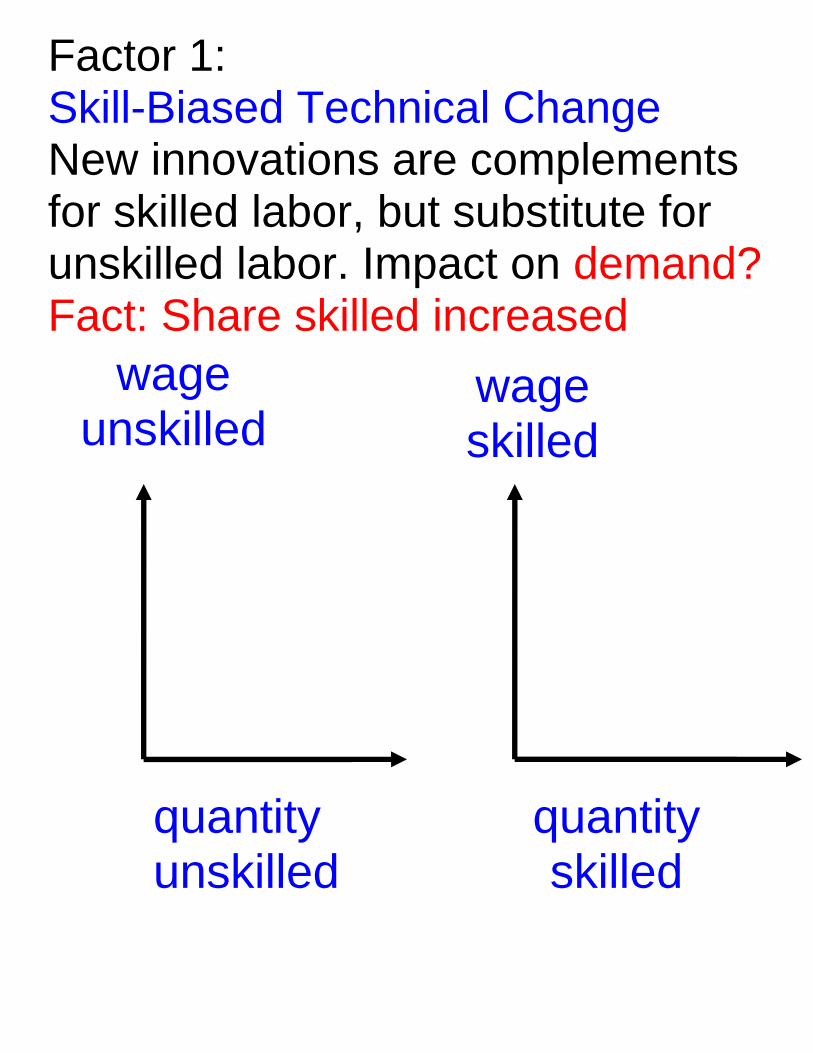
Factor 1: Skill-Biased Technical Change New innovations are complements for skilled labor, but substitute for unskilled labor. Impact on demand? Fact: Share skilled increased
quantity unskilled
quantity skilled
wage unskilled
wage skilled
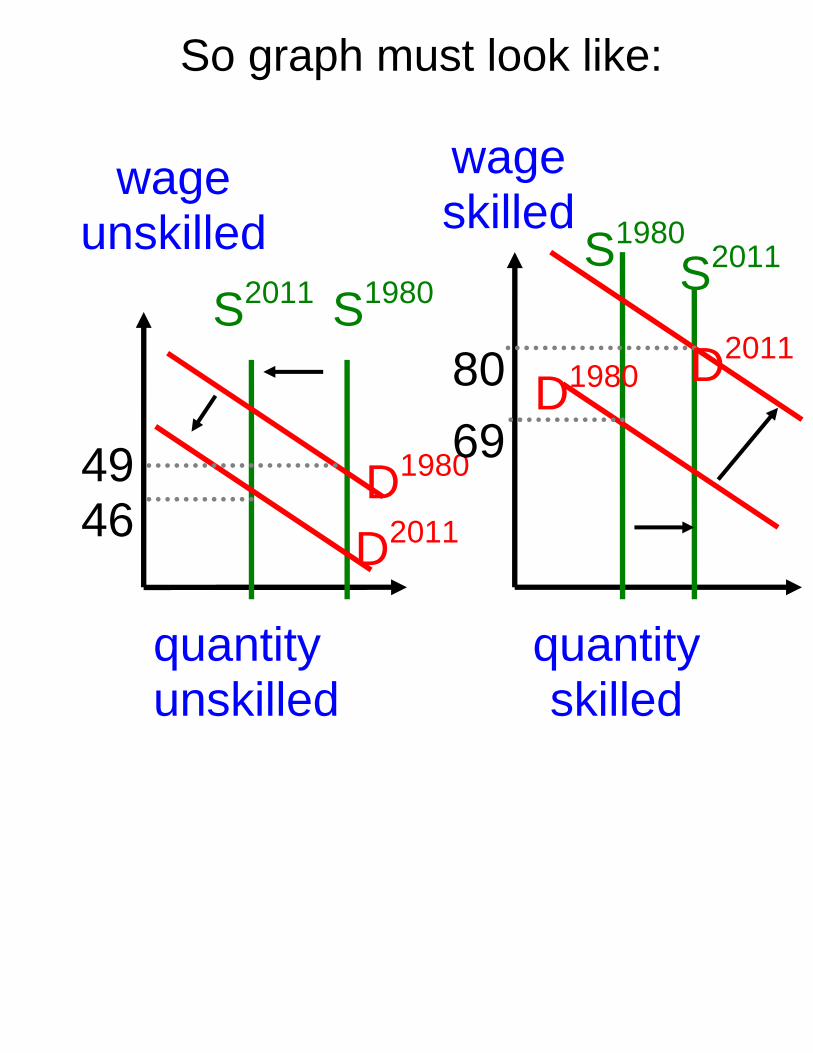
So graph must look like:
quantity unskilled
quantity skilled
wage unskilled
S1980S2011
49 46
S2011S1980
D1980
D2011
69
80 D1980
wage skilled
D2011
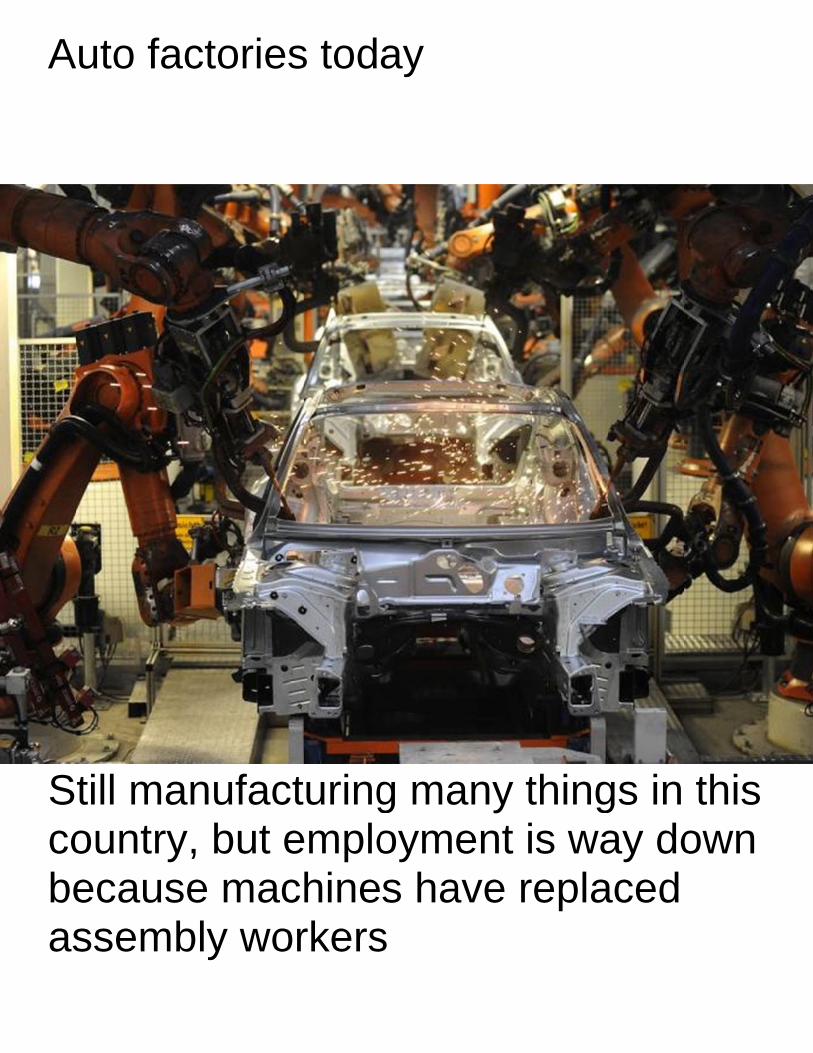
To understand skill-biased technical change, think about the invention of a robot that can spray paint a car or tighten a bolt on an automobile assembly line. (a) The robot is a substitute for the unskilled worker on the assembly line. (b) The robot does not do the creative work of designing the car. The skilled worker continues to do that job. The skilled worker designs the car and the robot builds it. In that way, the robot complements the skilled worker. As another example, think about the further development of web-based teaching. This complements the skill of Greg Mankiw (our textbook author) as he can now leverage up his skill to potentially teach tens of thousands of students in economics classes across the country.

In fact, let’s ask Professor Mankiw to teach our class for a minute. (Play clip from previous online version of the texbook. More on Mankiw getting cut out of current online version below) Mankiw explains how technological change is increasing salaries of the top basketball players. He could just as well have explained how this factor is increasing his own share of the pie. Online education is getting better and he gets a piece of the action.

The issue of how the internet (and communications technology more generally) impacts the return to being the best is called the
Economics of Superstars
Example: Suppose there is no internet, television or radio. If you want to hear someone sing, you have to hear them sing live. The very best singer in the world will be limited in how much he or she can earn: only what the best singer can charge from having people listen at a live concert. The 2nd best, the 3rd best, the 100th best singer probably won’t make much less than the 1st best, because the 1st best can’t really go around the world and give everyone a live concert.
But now think about what happens when new technologies (like recorded music) emerge that make it possible for the best singer to sell music to everyone. No one will be interested in listening to the 100th best anymore. Things move to a case where 1st best gets everything and 100th best nothing. (Winner take all.) We will talk about widening inequality even at the top of the income distribution (the “have mores” pulling away from the “haves” and the “Economics of Superstars” is one explanation.)
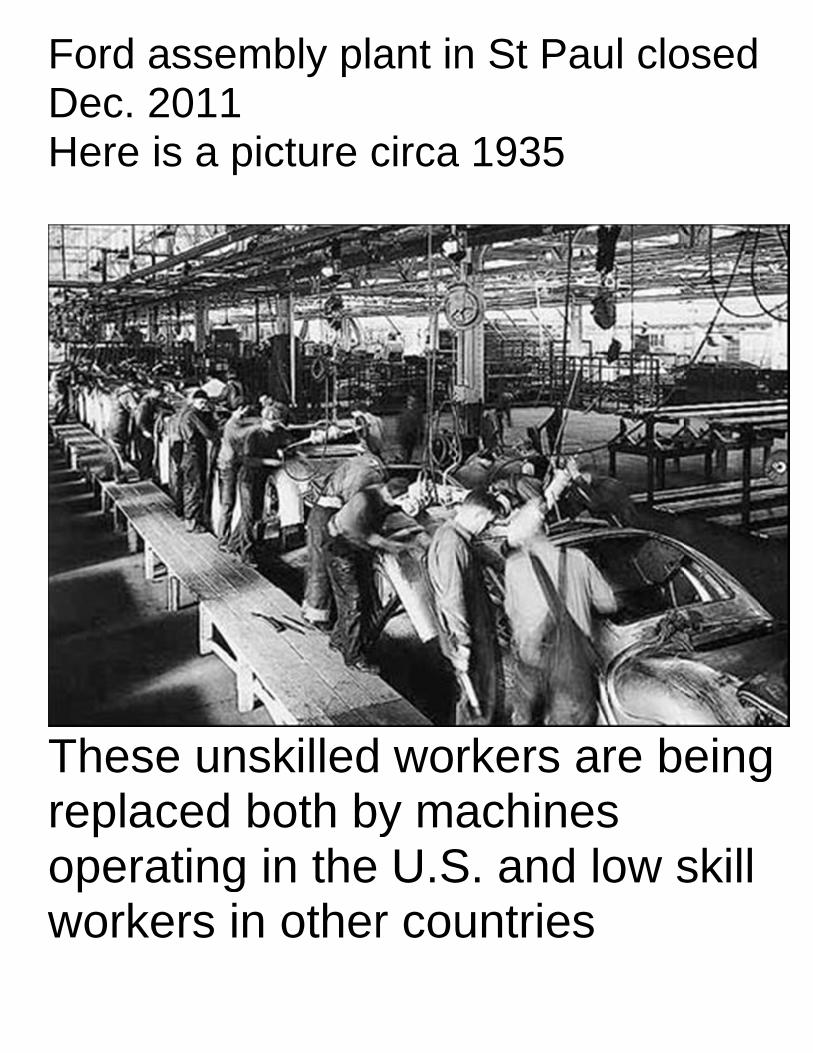
Interesting to contrast the recent trend of “Skill Biased Technical Change” with the trend earlier in the 20th century. Skilled worker at that time: include skilled craftsman who has learned a trade after a long apprenticeship. Unskilled worker: Hands and arms connected to a strong back. Technological change at time (Henry Ford’s assembly line) Take unskilled worker and put him on an assembly line. Up to speed in a few days. Here unskilled-biased technical change. In this period there was a decline in the skill premium.

Longer Term Trend (percent return per year of schooling) for
Can see in that in 1910, the return for an extra year of schooling was 15% and this fell to 8% in 1950.
The Skill Premium
0.06
0.07
0.08
0.09
0.1
0.11
0.12
0.13
0.14
0.15
0.16
1900 1920 1940 1960 1980 2000
FoDH
Treow
ord aDec. 2
ere
Theseplapera
worke
asse2011is a
se unacedatingers
embl1 pictu
nskid botg in in o
y pla
ure c
lledth bythe
other
ant in
circa
woy mU.S
r cou
n St
a 193
rkerach
S. anuntr
Pau
35
rs arinesnd lories
ul clo
re bs ow s
osed
eing
skill
g
A
Scobeas
Auto f
till mountecaussem
facto
manury, b
use mmbly
ories
ufactbut emachwor
s tod
uringemplohinerkers
ay
g maoymes ha
s
any tent i
ave r
things wa
repla
gs in ay doaced
thisown

The next frontier: computers replacing jobs formerly done by high skilled workers. (Artificial intelligence read law cases, x-rays.... or ....writing economics papers?
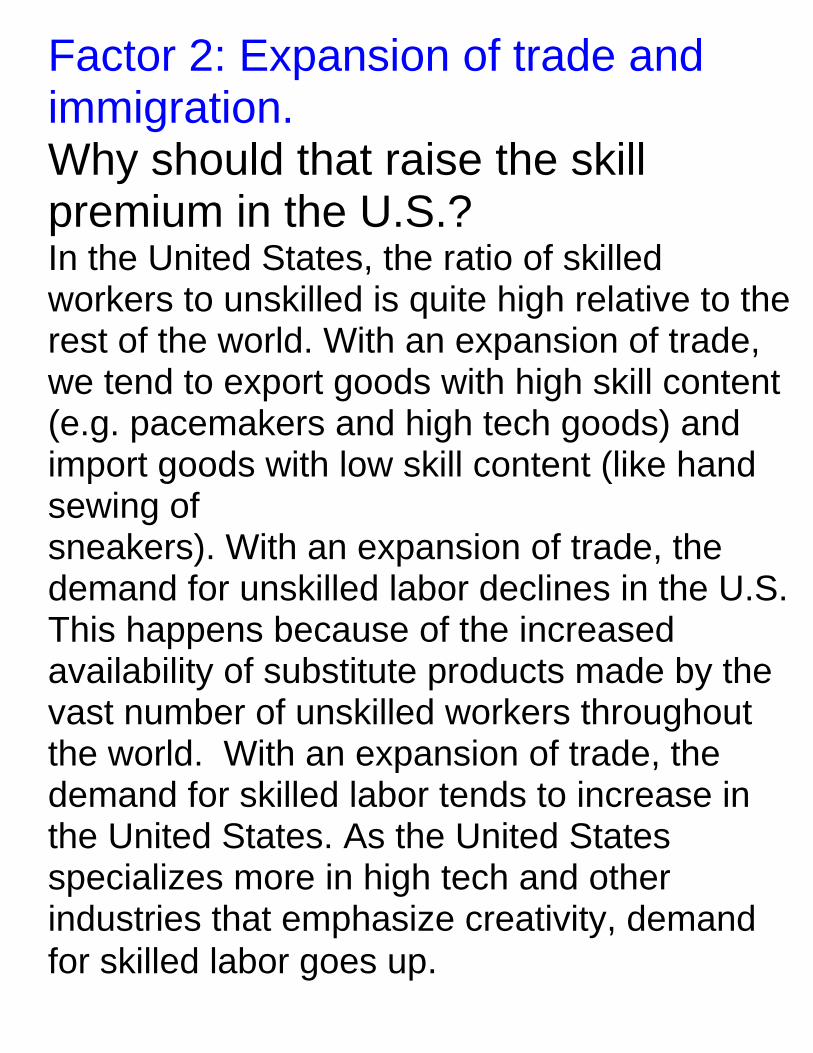
Factor 2: Expansion of trade and immigration. Why should that raise the skill premium in the U.S.? In the United States, the ratio of skilled workers to unskilled is quite high relative to the rest of the world. With an expansion of trade, we tend to export goods with high skill content (e.g. pacemakers and high tech goods) and import goods with low skill content (like hand sewing of sneakers). With an expansion of trade, the demand for unskilled labor declines in the U.S. This happens because of the increased availability of substitute products made by the vast number of unskilled workers throughout the world. With an expansion of trade, the demand for skilled labor tends to increase in the United States. As the United States specializes more in high tech and other industries that emphasize creativity, demand for skilled labor goes up.

Next: a contributing factor not based on shifts in demand and supply Decline of Unions Unions have declined significantly over the past 30 years. Production (or "blue collar") jobs are much more likely to be unionized than "white collar" jobs like management In the 1950s and 60s, when the skill premium was the lowest, the percent unionized was the highest.

What do unions do? Now watch clip of “Mike Brandl” “concept clip” of textbook, “Unions” who has replaced Mankiw on textbook clips. Not so great. Better stick with the classroom model for now.
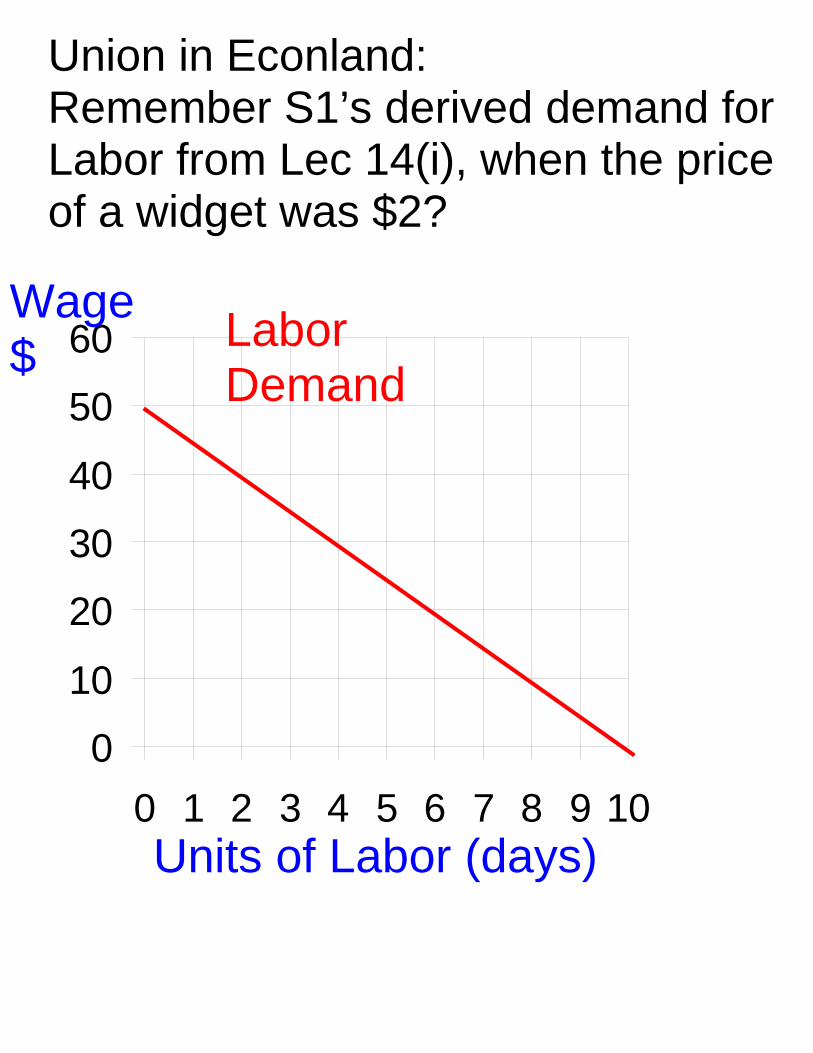
Union in Econland: Remember S1’s derived demand for Labor from Lec 14(i), when the price of a widget was $2?
0
10
20
30
40
50
60
0 1 2 3 4 5 6 7 8 9 10Units of Labor (days)
Wage $ Labor
Demand
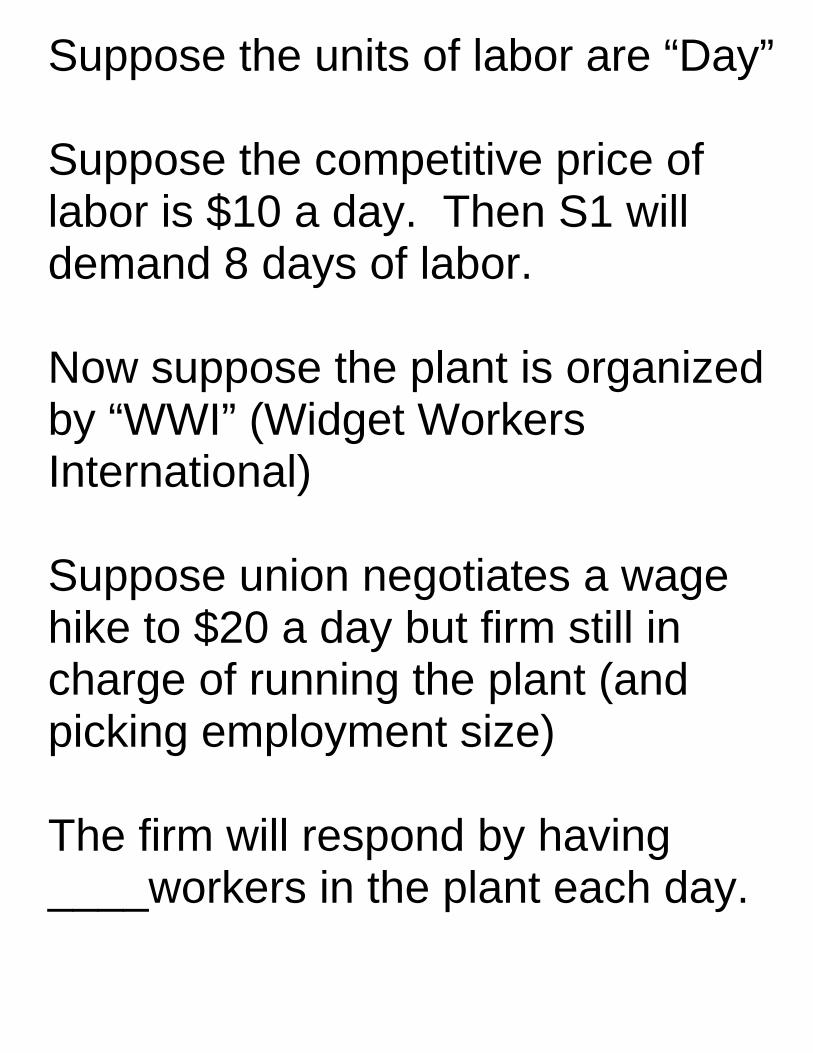
Suppose the units of labor are “Day” Suppose the competitive price of labor is $10 a day. Then S1 will demand 8 days of labor. Now suppose the plant is organized by “WWI” (Widget Workers International) Suppose union negotiates a wage hike to $20 a day but firm still in charge of running the plant (and picking employment size) The firm will respond by having ____workers in the plant each day.
Suppose the 8 workers initially in the plant share the reduced work. If they workers take off every one day out of very four days, there will be 6 workers in the plant every day, which is what the firm demands at a wage of $20. Average take-home pay: = (3/4)*$20 = $15 And one day off out of four!. Of course the widget workers love this!
Economic Effects 1) Quantity of Labor as with any monopoly, predict lower quantities (get get weight loss from too little output) 2. Inefficient Production “Featherbedding” work-rules to increase quantity of labor needed to do a job. (as unions have been squashed, currently much less featherbedding then before. 3. Transfer of surplus From firm owners to workers (Monopoly profit)