Embed Size (px)
Citation preview

Commodity Modeling Alexander Eydeland
Morgan Stanley
1Developed for educational use at MIT and for publication through MIT OpenCourseware.
No investment decisions should be made in reliance on this material.
Lecture 13

Commodity Modeling
• The views represented herein are the author’s own views and do not necessarily represent the views of Morgan Stanley or its affiliates, and are not a product of Morgan Stanley Research.
2Developed for educational use at MIT and for publication through MIT OpenCourseware.
No investment decisions should be made in reliance on this material.

Trader benefits from low prices First reported 03/11/2009
Dow Jones & Company Inc Trafigura: May Have Best Earnings Ever In
Fiscal 2009 • SINGAPORE -(Dow Jones)- International
commodities trading firm Trafigura Beheer B.V. is potentially on track to post its best results ever in fiscal 2009 on lower oil prices and contango markets, a company executive said Wednesday.
3Developed for educational use at MIT and for publication through MIT OpenCourseware.
No investment decisions should be made in reliance on this material.

WTI futures contracts: Jan. 15, 2009
Source: Bloomberg
4Developed for educational use at MIT and for publication through MIT OpenCourseware.
No investment decisions should be made in reliance on this material.

Trading in Contango Markets
FFeb’09 = 35 $/bbl FFeb’10 = 60 $/bbl
Strategy: On Jan. 15, 2009 – Borrow $35 Buy 1 bbl Store – Short Feb’10 futures contract (1 bbl) – Lock-in profit: $25 - Interest Payment
• Interest Payment = $35*r
• If r = 10%
Interest Payment = $3.5/bbl Profit = $21.5/bbl
5Developed for educational use at MIT and for publication through MIT OpenCourseware.
No investment decisions should be made in reliance on this material.

Summary: to generate profit
• Needed asset (storage) • Needed strategy:
– Long Feb’09 contract – Short Feb’10 contract – Or long Feb-Feb calendar spread
6Developed for educational use at MIT and for publication through MIT OpenCourseware.
No investment decisions should be made in reliance on this material.

What if you need to lease storage from Aug to Dec How much will you pay for this lease on Jan 1?
• FAug = 55 $/bbl FDec = 58 $/bbl
Source: Bloomberg
7Developed for educational use at MIT and for publication through MIT OpenCourseware.
No investment decisions should be made in reliance on this material.
This is what the trader will do
On Jan 1 • Buy Aug/Dec spread:
– Long Aug futures contract – Short Dec futures contract
• On Aug 1 – buy 1 bbl for $55/bbl and store it
• Wait till Dec and then sell 1bbl for $58 • Lock-in $3/bbl. Can pay for storage up to
$3/bbl
8Developed for educational use at MIT and for publication through MIT OpenCourseware.
No investment decisions should be made in reliance on this material.

This is what the quant will do
• On Jan 1 sell Aug/Dec spread option:
• Exercise date Jul 31 • Interest rates are ignored for simplicity
(should not be)
_ _ Dec AugPayout at exercise F F
9Developed for educational use at MIT and for publication through MIT OpenCourseware.
No investment decisions should be made in reliance on this material.

Why is this better? • The value of this calendar spread option
– V = 4.4677 $/bbl The value is always greater than the spread because the spread is its intrinsic value
1 2Dec AugV F N d F N d DiscFactor
21
2
2
2
1
12
2
1
2
2
log
TddTT
F
Fd
Aug
Dec
10Developed for educational use at MIT and for publication through MIT OpenCourseware.
No investment decisions should be made in reliance on this material.

The benefit: • Storage bid can be increased to $4.46/bbl increasing the
likelihood of winning the deal. We can also keep a greater profit.
• Is there the risk? What if on Jul 31 FAug = 65 $/bbl FDec = 80 $/bbl
and we owe $15/bbl to the option holder
• No worry: We have storage On Jul 31 Buy Aug crude for 65 $/bbl and simultaneously Sell Dec crude for 80 $/bbl using Dec futures contract Lock-in $15 $/bbl to repay option holder
11Developed for educational use at MIT and for publication through MIT OpenCourseware.
No investment decisions should be made in reliance on this material.

In reality …
• Sell portfolio of spread option • Satisfy a number of physical constraints
– Injection rates – Withdarawal rates – Do not inject more than max capacity – Do not withdraw from the empty tank – etc
12Developed for educational use at MIT and for publication through MIT OpenCourseware.
No investment decisions should be made in reliance on this material.

Storage optimization • Find
• - today’s futures prices for contracts expiring at times and
• - volumes committed today for injection at time , or withdrawal at
0,0,0,0
}{max ,,,,,,,
zyx
FzFyUSxVji ji i j
jjiijijijijizyx
ji FF ,
iT jT
ji zy ,
iT jT
13Developed for educational use at MIT and for publication through MIT OpenCourseware.
No investment decisions should be made in reliance on this material.

Storage Optimization
• - is the value of the option to inject at time and withdraw at time
• - is the value of the option to withdraw at time and inject at later time
• - option volumes sold against the storage today
-
jiU ,
0 ,max__ CostFFexerciseatPayout ji
jiS ,
0 ,max__ CostFFexerciseatPayout ij
jiji vx ,, ,
14Developed for educational use at MIT and for publication through MIT OpenCourseware.
No investment decisions should be made in reliance on this material.

Constraints • Let’s introduce Boolean “in-the-money at
exercise” variables
,,
1 if option expires in-the-money
0 otherwise
i jSi j
S
,,
1 if option U expires in-the-money
0 otherwise
i jUi j
15Developed for educational use at MIT and for publication through MIT OpenCourseware.
No investment decisions should be made in reliance on this material.

Constraints
• Injection constraints
• Withdrawal constraints
, , , , , , , , 1, ,S S U Ui j i j i i j i i j i j i j i i i
i j i i i j
x x v v y z I i N
, , , , , , , , 1, ,S S U Ui j i j i i j i i j i j i j i i i
i j i i i j
x x v v y z W i N
16Developed for educational use at MIT and for publication through MIT OpenCourseware.
No investment decisions should be made in reliance on this material.

Constraints
• Maximum capacity constraints
• Minimum capacity constraints
min0 , , , , 1, ,S U
k j k j k j k j k k ik i j i j i
C x v y z C i N
max0 , , , , 1, ,S U
k j k j k j k j k k ik i j i j i
C x v y z C i N
17Developed for educational use at MIT and for publication through MIT OpenCourseware.
No investment decisions should be made in reliance on this material.

Solution
• Approximation • Monte-Carlo simulation • Alternative approach: Stochastic control Rene Carmona & Michael Ludkovski, 2010. "Valuation of energy
storage: an optimal switching approach,"Quantitative Finance, Taylor and Francis Journals, vol. 10(4), pages 359-374.
18Developed for educational use at MIT and for publication through MIT OpenCourseware.
No investment decisions should be made in reliance on this material.

Additional complications
• There is no spread option market now: we cannot sell spread option directly
• We must design a strategy of replicating selling the spread option
• Similar to Black-Scholes delta-hedging strategy
19Developed for educational use at MIT and for publication through MIT OpenCourseware.
No investment decisions should be made in reliance on this material.

Power Plant
• Spark Spread Option • Merchant Power Plant
– Should be run if the market price of power is higher than the cost of fuel plus variable operating costs
Net Profit from this operating strategy is:
Operating a merchant power plant is financially equivalent to owning a portfolio of daily options on spreads between electricity and fuel (spark spread options)
0,_
1000
_max CostsVariablePrice
RateHeatPrice FuelPower
20Developed for educational use at MIT and for publication through MIT OpenCourseware.
No investment decisions should be made in reliance on this material.

Properties of energy prices
• Behavior of energy prices is unique Example 1: Fat Tails of distributions Source: Eydeland, Wolyniec
21Developed for educational use at MIT and for publication through MIT OpenCourseware.
No investment decisions should be made in reliance on this material.

Properties of energy prices Example 1: Fat Tails of distributions Source: Eydeland, Wolyniec
22Developed for educational use at MIT and for publication through MIT OpenCourseware.
No investment decisions should be made in reliance on this material.

Properties of energy prices Distribution Parameters (A. Werner, Risk Management
in the Electricity Market, 2003)
Annual. Volatility
Skewness Kurtosis
Nord Pool 182% 1.468 26.34
NP 6.p.m. 238% 2.079 76.82
DAX 23% 0.004 3.33
23Developed for educational use at MIT and for publication through MIT OpenCourseware.
No investment decisions should be made in reliance on this material.

Special properties of electricity prices: spikes, high volatility Source: Eydeland, Wolyniec ERCOT Prices
0.00
50.00
100.00
150.00
200.00
250.00
300.00
350.00
400.00
7/24/1998 12/6/1999 4/19/2001 9/1/2002 1/14/2004
Trade Date
Pri
ces (
$/
MW
h)
Series1
ERCOT Volatility
0
1
2
3
4
5
6
7
8
9
10
7/24/1998 12/6/1999 4/19/2001 9/1/2002 1/14/2004
Trade Date
Series1
24Developed for educational use at MIT and for publication through MIT OpenCourseware.
No investment decisions should be made in reliance on this material.

NEPOOL Prices
0.00
50.00
100.00
150.00
200.00
250.00
300.00
350.00
400.00
450.00
7/24/1998 12/6/1999 4/19/2001 9/1/2002 1/14/2004
Trade Date
Pri
ces (
$/
MW
h)
Series1
NEPOOL Volatility
0
1
2
3
4
5
6
7
8
9
10
7/24/1998 12/6/1999 4/19/2001 9/1/2002 1/14/2004
Trade Date
Series1
Special properties of electricity prices Source: Eydeland, Wolyniec
25Developed for educational use at MIT and for publication through MIT OpenCourseware.
No investment decisions should be made in reliance on this material.

Special properties of electricity prices Source: Eydeland, Wolyniec
PJM Prices
0.00
50.00
100.00
150.00
200.00
250.00
300.00
350.00
400.00
450.00
500.00
7/24/1998 12/6/1999 4/19/2001 9/1/2002 1/14/2004
Trade Date
Pri
ces
($/
MW
h)Series1
PJM Volatility
0
2
4
6
8
10
12
14
7/24/1998 12/6/1999 4/19/2001 9/1/2002 1/14/2004
Trade Date
Series1
26Developed for educational use at MIT and for publication through MIT OpenCourseware.
No investment decisions should be made in reliance on this material.

Behavior of power prices
• Mean reversion • spikes • high kurtosis • regime switching • lack of data • non-stationarity
27Developed for educational use at MIT and for publication through MIT OpenCourseware.
No investment decisions should be made in reliance on this material.

Joint distribution: power/NG correlation structure
Correlation between power and gas also has unique structure. If the model does not capture this structure, it may misprice spread options (tolling contracts, power plants, etc.)
Source: Eydeland, Wolyniec
28Developed for educational use at MIT and for publication through MIT OpenCourseware.
No investment decisions should be made in reliance on this material.

Models
t t t tdS S dt S dW
logt
t t
t
dSS dt dW
S
1t
t t t
t
dSk dt dW Y dq
S
log 1t
t t t t
t
dSk S dt dW Y dq
S
• Spot Processes • GBM
• GBM with mean reversion
• + jumps
• + jumps and mean reversion
29Developed for educational use at MIT and for publication through MIT OpenCourseware.
No investment decisions should be made in reliance on this material.

More complicated models
• Models with stochastic convenience yield • Models with stochastic volatility • Regime switching models • Models with multiple jump processes • Various term structure models
30Developed for educational use at MIT and for publication through MIT OpenCourseware.
No investment decisions should be made in reliance on this material.

Spot Precesses: Cons Difficult to use for power products due to non-storability:
• No no-arbitrage argument • How to price forward contracts and options?
– In the case of storable commodities (NG, CL) we need convenience yield.
– Calibration is difficult to implement due to overlapping data. – Cannot model the correlation structure between forward
contracts. – Cannot model complex volatility structures. – Spot processes without jumps or stochastic volatility generate
unrealistic power price distributions. – Cannot capture complex power/gas correlation structure.
31Developed for educational use at MIT and for publication through MIT OpenCourseware.
No investment decisions should be made in reliance on this material.

A different approach Hybrid Model: Stack Method
Price formation mechanism: Bid stack Generator 1. Price ($/MWh) 20 25 30 35 50 Volume (MWh) 50 100 200 400 600
Generator 2. Price ($/MWh) 18 40 100 Volume (MWh) 100 200 500 Source: Eydeland, Wolyniec
32Developed for educational use at MIT and for publication through MIT OpenCourseware.
No investment decisions should be made in reliance on this material.

Hybrid Models: Stack Method
Bid stack: Price ($/MWh) 18 20 25 30 35 40 50 100 Volume (MWh) 100 150 200 300 500 600 800 1100 Source: Eydeland, Wolyniec
Pt=Sbid(Dt)33
Developed for educational use at MIT and for publication through MIT OpenCourseware.
No investment decisions should be made in reliance on this material.
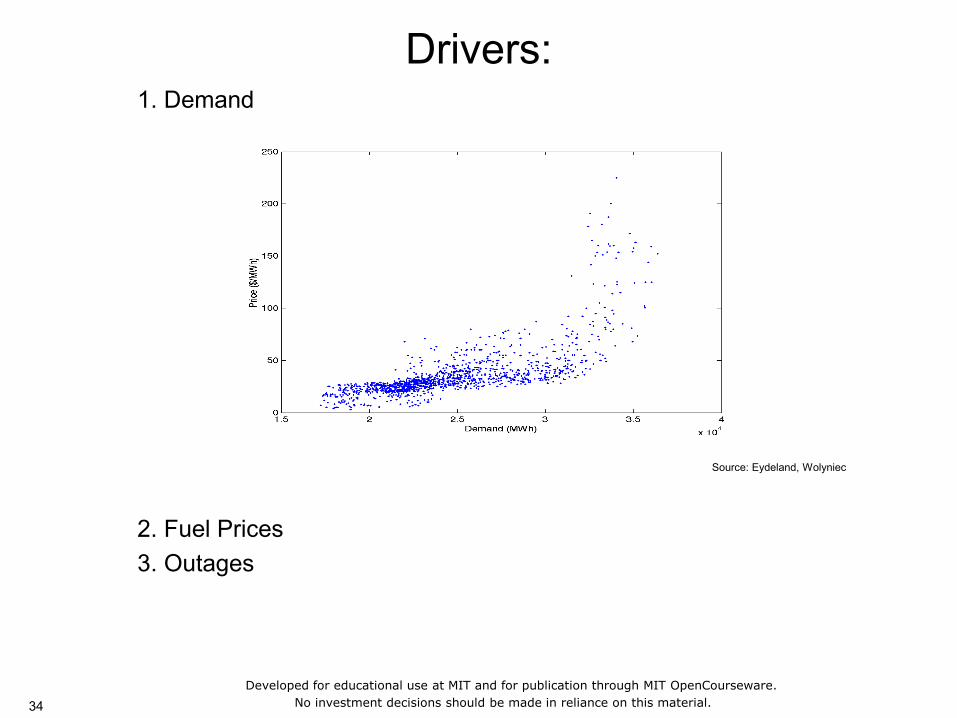
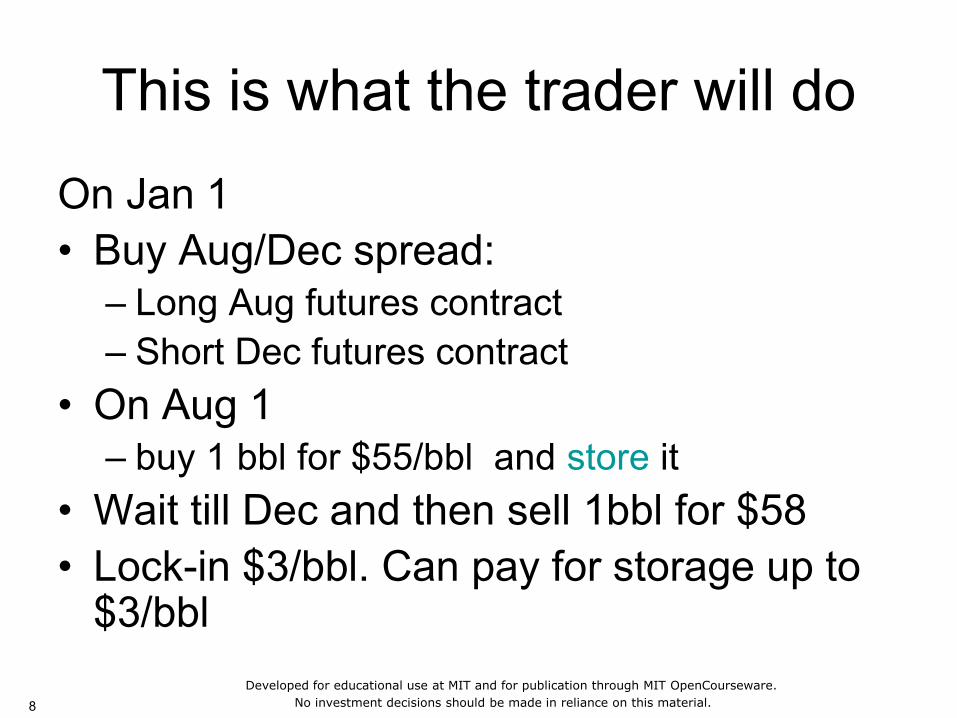
Drivers: 1. Demand Source: Eydeland, Wolyniec
2. Fuel Prices 3. Outages
34Developed for educational use at MIT and for publication through MIT OpenCourseware.
No investment decisions should be made in reliance on this material.

How to build the bid stack?
1. Fuel + Outages Generation Stack 2. Generation stack Bid Stack Transformation at step 2 matches market data and preserves higher moments of price distribution (skewness, kurtosis)
35Developed for educational use at MIT and for publication through MIT OpenCourseware.
No investment decisions should be made in reliance on this material.

Fuel Model Group 1 • Natural Gas • #2 Heating Oil • #6 Fuel Oil (with different sulfur
concentration) • Coal • Jet Fuel • Diesel • Methane • Liquefied Natural Gas (LNG) • Etc.
Group 2 • Nuclear • Hydro • Solar • Wind • Biomass • Etc.
Prices of Group 1 fuels are modeled using term structure models, matching forward prices, option prices and correlation structure
36Developed for educational use at MIT and for publication through MIT OpenCourseware.
No investment decisions should be made in reliance on this material.

Outage Model
Standard process (e.g., Poisson) utilizing EFOR (Equivalent Forced Outage Rate)
As a result for each time T we have an outage
vector T=(T,1, …, T,L )
T,i=1 if at time T the unit I is experiencing forced outages
T,i=0 otherwise
37Developed for educational use at MIT and for publication through MIT OpenCourseware.
No investment decisions should be made in reliance on this material.

Demand
Demand can be modeled as a function of temperature
Temperature evolution process: i. evolution of the principal modes ii. evolution of the daily perturbations
( , )t tD d t
38Developed for educational use at MIT and for publication through MIT OpenCourseware.
No investment decisions should be made in reliance on this material.

Power Prices
The constants chosen to match market data
1 2 3( ) ( ; , , , , , )bid gen
T T T T T T T T TP s D s D T U E VOM C
39Developed for educational use at MIT and for publication through MIT OpenCourseware.
No investment decisions should be made in reliance on this material.

Justification Source: Eydeland, Wolyniec
40Developed for educational use at MIT and for publication through MIT OpenCourseware.
No investment decisions should be made in reliance on this material.

Justification: PJM Prices - actual vs. model
Source: Eydeland, Wolyniec
41Developed for educational use at MIT and for publication through MIT OpenCourseware.
No investment decisions should be made in reliance on this material.

Justification
Skewness and kurtosis of PJM price distribution: model vs. empirical data
Skewness Kurtosis Model Empirical Model Empirical data data data data Summer 2000 3.58 3.17 4.77 4.89 Summer 2001 18.13 14.65 25.83 26.46 Winter 2000 .68 1.32 2.02 1.19 Winter 2001 .18 1.54 5.48 1.98 Source: Eydeland, Wolyniec
42Developed for educational use at MIT and for publication through MIT OpenCourseware.
No investment decisions should be made in reliance on this material.

Simulated correlation structure Source: Eydeland, Wolyniec
43Developed for educational use at MIT and for publication through MIT OpenCourseware.
No investment decisions should be made in reliance on this material.

vs actual correlation structure Source: Eydeland, Wolyniec
44Developed for educational use at MIT and for publication through MIT OpenCourseware.
No investment decisions should be made in reliance on this material.

References
• Eydeland, Alexander and Krzysztof Wolyniec, Energy and Power Risk Management: New
Developments in Modeling, Pricing and
Hedging, Wiley, 2002
• Eydeland, Alexander and Hélyette Geman. “Fundamentals of Electricity Derivatives.” Energy Modelling and the Management of
Uncertainty. RISK Books, 1999.
45Developed for educational use at MIT and for publication through MIT OpenCourseware.
No investment decisions should be made in reliance on this material.

Disclosures The information herein has been prepared solely for informational purposes and is not an offer to buy or sell or a solicitation of an offer to buy or sell any security or instrument or to participate in any trading strategy. Any such offer would be made only after a prospective participant had completed its own independent investigation of the securities, instruments or transactions and received all information it required to make its own investment decision, including, where applicable, a review of any offering circular or memorandum describing such security or instrument, which would contain material information not contained herein and to which prospective participants are referred. No representation or warranty can be given with respect to the accuracy or completeness of the information herein, or that any future offer of securities, instruments or transactions will conform to the terms hereof. Morgan Stanley and its affiliates disclaim any and all liability relating to this information. Morgan Stanley, its affiliates and others associated with it may have positions in, and may effect transactions in, securities and instruments of issuers mentioned herein and may also perform or seek to perform investment banking services for the issuers of such securities and instruments. The information herein may contain general, summary discussions of certain tax, regulatory, accounting and/or legal issues relevant to the proposed transaction. Any such discussion is necessarily generic and may not be applicable to, or complete for, any particular recipient's specific facts and circumstances. Morgan Stanley is not offering and does not purport to offer tax, regulatory, accounting or legal advice and this information should not be relied upon as such. Prior to entering into any proposed transaction, recipients should determine, in consultation with their own legal, tax, regulatory and accounting advisors, the economic risks and merits, as well as the legal, tax, regulatory and accounting characteristics and consequences, of the transaction. Notwithstanding any other express or implied agreement, arrangement, or understanding to the contrary, Morgan Stanley and each recipient hereof are deemed to agree that both Morgan Stanley and such recipient (and their respective employees, representatives, and other agents) may disclose to any and all persons, without limitation of any kind, the U.S. federal income tax treatment of the securities, instruments or transactions described herein and any fact relating to the structure of the securities, instruments or transactions that may be relevant to understanding such tax treatment, and all materials of any kind (including opinions or other tax analyses) that are provided to such person relating to such tax treatment and tax structure, except to the extent confidentiality is reasonably necessary to comply with securities laws (including, where applicable, confidentiality regarding the identity of an issuer of securities or its affiliates, agents and advisors). The projections or other estimates in these materials (if any), including estimates of returns or performance, are forward-looking statements based upon certain assumptions and are preliminary in nature. Any assumptions used in any such projection or estimate that were provided by a recipient are noted herein. Actual results are difficult to predict and may depend upon events outside the issuer’s or Morgan Stanley’s control. Actual events may differ from those assumed and changes to any assumptions may have a material impact on any projections or estimates. Other events not taken into account may occur and may significantly affect the analysis. Certain assumptions may have been made for modeling purposes only to simplify the presentation and/or calculation of any projections or estimates, and Morgan Stanley does not represent that any such assumptions will reflect actual future events. Accordingly, there can be no assurance that estimated returns or projections will be realized or that actual returns or performance results will not be materially different than those estimated herein. Any such estimated returns and projections should be viewed as hypothetical. Recipients should conduct their own analysis, using such assumptions as they deem appropriate, and should fully consider other available information in making a decision regarding these securities, instruments or transactions. Past performance is not necessarily indicative of future results. Price and availability are subject to change without notice. The offer or sale of securities, instruments or transactions may be restricted by law. Additionally, transfers of any such securities, instruments or transactions may be limited by law or the terms thereof. Unless specifically noted herein, neither Morgan Stanley nor any issuer of securities or instruments has taken or will take any action in any jurisdiction that would permit a public offering of securities or instruments, or possession or distribution of any offering material in relation thereto, in any country or jurisdiction where action for such purpose is required. Recipients are required to inform themselves of and comply with any legal or contractual restrictions on their purchase, holding, sale, exercise of rights or performance of obligations under any transaction. Morgan Stanley does not undertake or have any responsibility to notify you of any changes to the attached information. With respect to any recipient in the U.K., the information herein has been issued by Morgan Stanley & Co. International Limited, regulated by the U.K. Financial Services Authority. THIS COMMUNICATION IS DIRECTED IN THE UK TO THOSE PERSONS WHO ARE MARKET COUNTERPARTIES OR INTERMEDIATE CUSTOMERS (AS DEFINED IN THE UK FINANCIAL SERVICES AUTHORITY’S RULES). ADDITIONAL INFORMATION IS AVAILABLE UPON REQUEST.
46Developed for educational use at MIT and for publication through MIT OpenCourseware.
No investment decisions should be made in reliance on this material.

MIT OpenCourseWarehttp://ocw.mit.edu
18.S096 Topics in Mathematics with Applications in FinanceFall 2013
For information about citing these materials or our Terms of Use, visit: http://ocw.mit.edu/terms.