Embed Size (px)
Citation preview
1
Statistics 101-106 Lecture 12 (1 Dec 98) David Pollard
Lecture 12
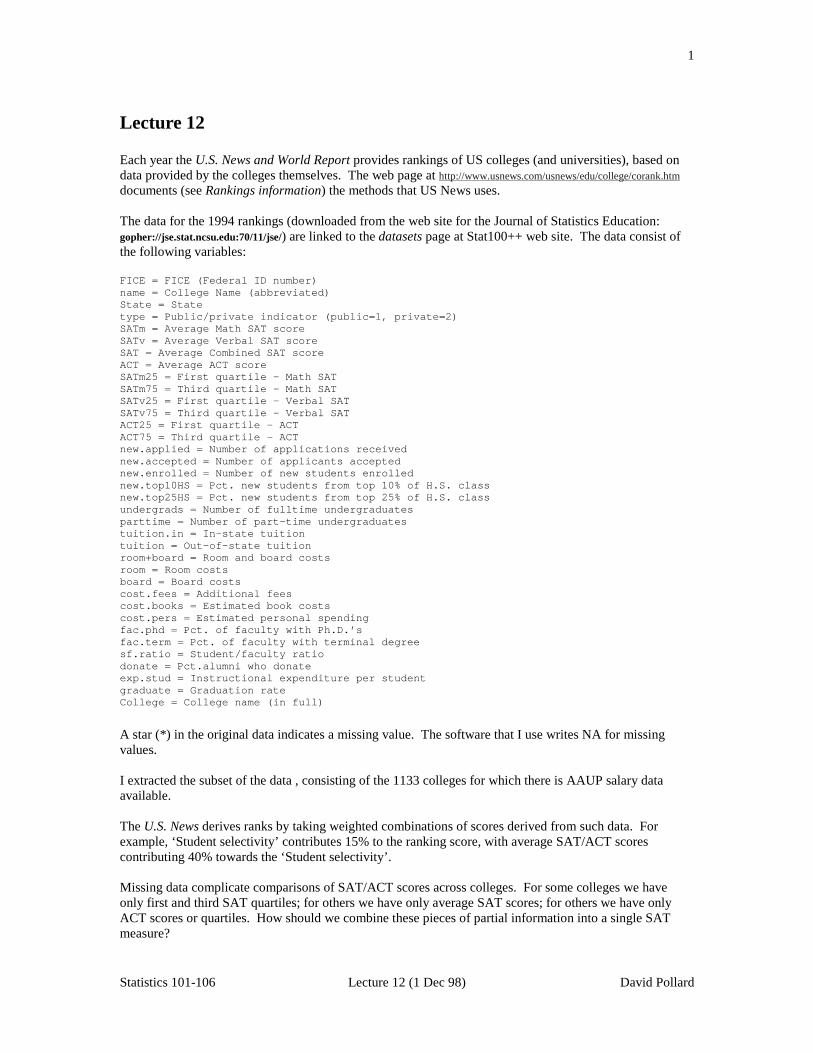
Each year the U.S. News and World Report provides rankings of US colleges (and universities), based ondata provided by the colleges themselves. The web page at http://www.usnews.com/usnews/edu/college/corank.htm
documents (see Rankings information) the methods that US News uses.
The data for the 1994 rankings (downloaded from the web site for the Journal of Statistics Education:gopher://jse.stat.ncsu.edu:70/11/jse/) are linked to the datasets page at Stat100++ web site. The data consist ofthe following variables:
FICE = FICE (Federal ID number)name = College Name (abbreviated)State = Statetype = Public/private indicator (public=1, private=2)SATm = Average Math SAT scoreSATv = Average Verbal SAT scoreSAT = Average Combined SAT scoreACT = Average ACT scoreSATm25 = First quartile - Math SATSATm75 = Third quartile - Math SATSATv25 = First quartile - Verbal SATSATv75 = Third quartile - Verbal SATACT25 = First quartile - ACTACT75 = Third quartile - ACTnew.applied = Number of applications receivednew.accepted = Number of applicants acceptednew.enrolled = Number of new students enrollednew.top10HS = Pct. new students from top 10% of H.S. classnew.top25HS = Pct. new students from top 25% of H.S. classundergrads = Number of fulltime undergraduatesparttime = Number of part-time undergraduatestuition.in = In-state tuitiontuition = Out-of-state tuitionroom+board = Room and board costsroom = Room costsboard = Board costscost.fees = Additional feescost.books = Estimated book costscost.pers = Estimated personal spendingfac.phd = Pct. of faculty with Ph.D.’sfac.term = Pct. of faculty with terminal degreesf.ratio = Student/faculty ratiodonate = Pct.alumni who donateexp.stud = Instructional expenditure per studentgraduate = Graduation rateCollege = College name (in full)
A star (*) in the original data indicates a missing value. The software that I use writes NA for missingvalues.
I extracted the subset of the data , consisting of the 1133 colleges for which there is AAUP salary dataavailable.
The U.S. News derives ranks by taking weighted combinations of scores derived from such data. Forexample, ‘Student selectivity’ contributes 15% to the ranking score, with average SAT/ACT scorescontributing 40% towards the ‘Student selectivity’.
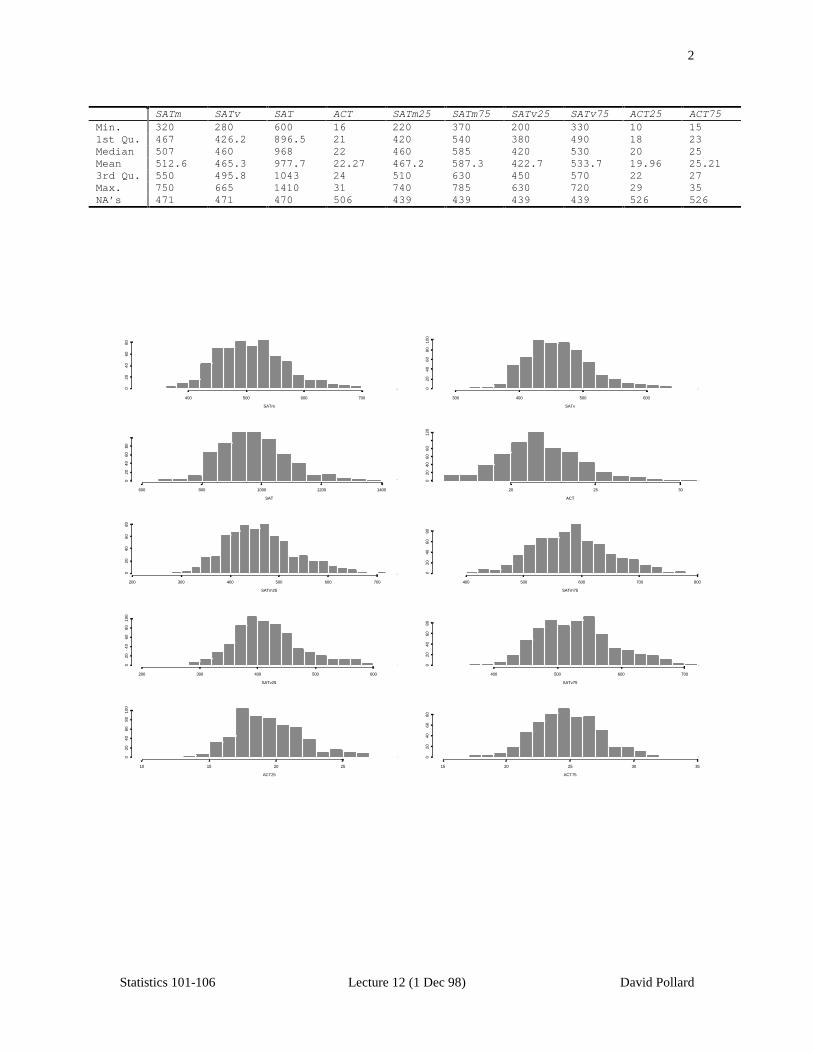
Missing data complicate comparisons of SAT/ACT scores across colleges. For some colleges we haveonly first and third SAT quartiles; for others we have only average SAT scores; for others we have onlyACT scores or quartiles. How should we combine these pieces of partial information into a single SATmeasure?
2
Statistics 101-106 Lecture 12 (1 Dec 98) David Pollard
400 500 600 700
020
4060
80
SATm
300 400 500 600
020
4060
8010
0
SATv
600 800 1000 1200 1400
020
4060
80
SAT
20 25 30
020
4060
8012
0
ACT
200 300 400 500 600 700
020
4060
80
SATm25
400 500 600 700 800
020
4060
80
SATm75
200 300 400 500 600
020
4060
8010
0
SATv25
400 500 600 700
020
4060
80
SATv75
10 15 20 25
020
4060
8010
0
ACT25
15 20 25 30 35
020
4060
80
ACT75
SATm SATv SAT ACT SATm25 SATm75 SATv25 SATv75 ACT25 ACT75Min. 320 280 600 16 220 370 200 330 10 151st Qu. 467 426.2 896.5 21 420 540 380 490 18 23Median 507 460 968 22 460 585 420 530 20 25Mean 512.6 465.3 977.7 22.27 467.2 587.3 422.7 533.7 19.96 25.213rd Qu. 550 495.8 1043 24 510 630 450 570 22 27Max. 750 665 1410 31 740 785 630 720 29 35NA’s 471 471 470 506 439 439 439 439 526 526
3
Statistics 101-106 Lecture 12 (1 Dec 98) David Pollard
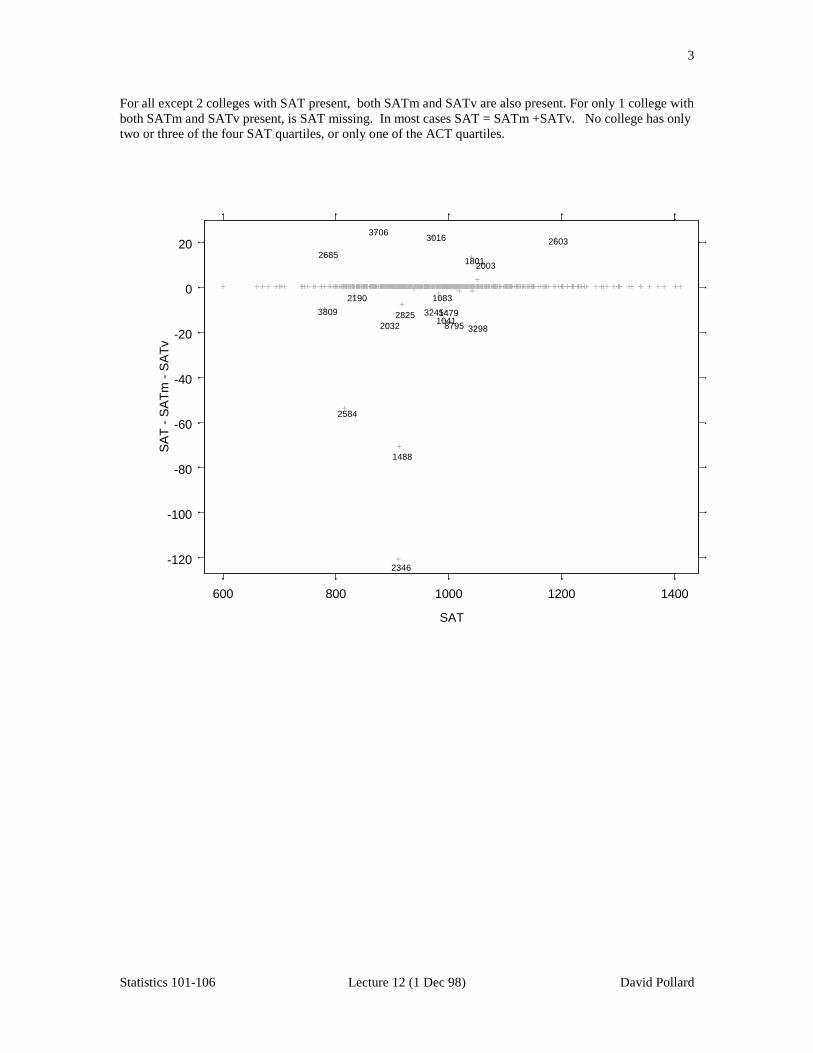
For all except 2 colleges with SAT present, both SATm and SATv are also present. For only 1 college withboth SATm and SATv present, is SAT missing. In most cases SAT = SATm +SATv. No college has onlytwo or three of the four SAT quartiles, or only one of the ACT quartiles.
+++ + +++
+
+ ++ ++ ++ +++
+ + ++++ ++ +++ ++ + ++ ++++ + +++ ++ ++++ ++ ++ ++ ++ +++ + +++ +++ ++ ++ ++ ++ ++++ + + ++ +++ +++ ++
+
+ +
+
+++++ ++++ + +++ + + +++ ++ ++++ + ++++ +++ ++ ++ + +++ + ++ ++ ++ ++ +++ +++ + + ++++
+
+ ++ +++ +++ ++ ++ ++ + ++ ++ ++ +++ ++ +
+
++ +
+
+++ ++++ + ++++++
+++ +++ ++ + ++ ++ +++ ++ + ++ +++ + + ++ ++++ +++ ++++ + +++ +++ +++ ++
+ +++++ +
+
+++ + + ++ ++ ++ ++ + + +++ +++ +++ ++++ + +++ ++ + + ++++ + + ++ ++ ++++ ++ + ++ ++ +++ +++ +++
+
+ +++ ++
+
+++ ++ ++ + ++ +++ +++ ++ + ++++
+
+ +++ +++ ++ + + +++ ++ + + +++ +++ + ++ ++ +++++
+
++ + ++++ + + +++ ++ ++ ++ ++ + +++ +
+
+ ++ + + ++ + + ++ ++ ++ +++ ++ + + +++ ++
+
+ + ++ ++ + + +++ ++ ++ ++ ++ +++ + ++ +++
+
+ ++ + +++++ + +++
++ ++
+
++++ + + + ++++++ + +++ ++ ++ +++ +++ + ++ ++ + ++ ++ ++ ++ ++ + ++ + ++ +++ + +++ ++++ + ++ +++ + + ++ ++ +++ +++ + + ++ ++++ + ++ ++ ++++ +++ ++ + ++++ +
+
++ ++ ++ +++ + + +++ ++ +++ ++ +++++ ++ ++ +++ ++ ++ +++ ++ +++ + +++ +
+
+ + ++ +++
1041
1083
1479
1488
18012003
2032
2190
2346
2584
2603
2685
2825
3016
8795
3245
3298
3706
3809
-120
-100
-80
-60
-40
-20
0
20
600 800 1000 1200 1400
SAT
SA
T -
SA
Tm
- S
AT
v
4
Statistics 101-106 Lecture 12 (1 Dec 98) David Pollard
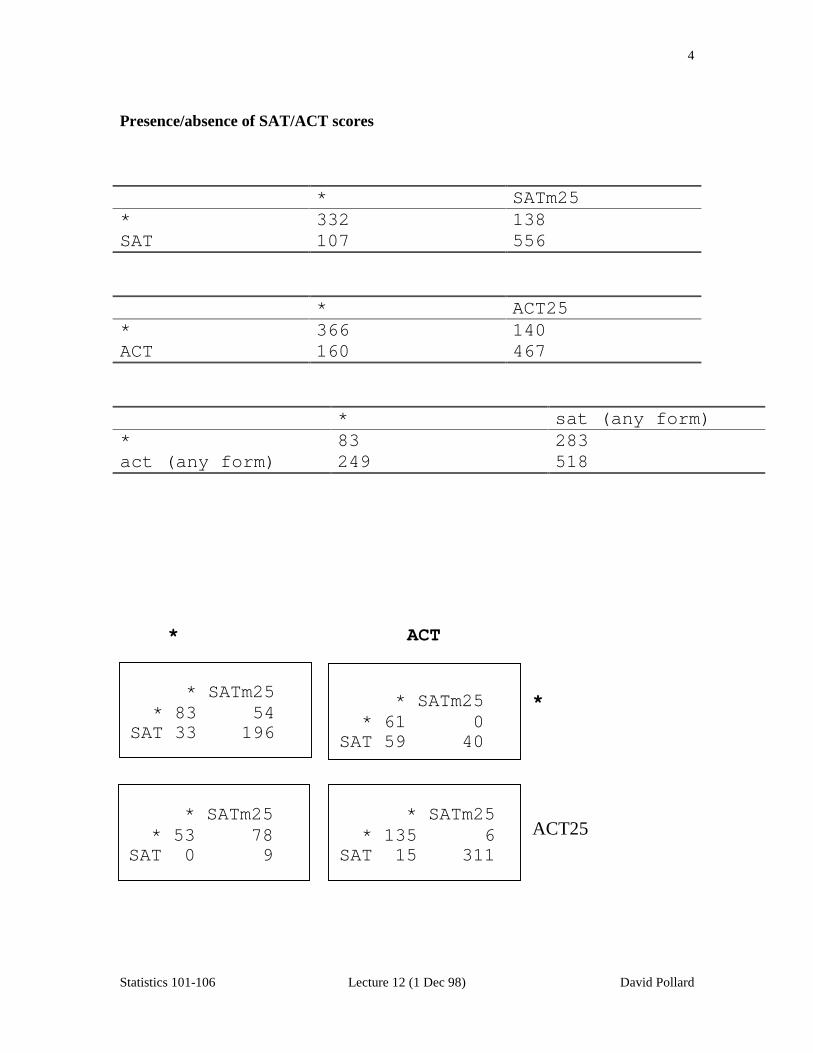
Presence/absence of SAT/ACT scores
* SATm25* 332 138SAT 107 556
* ACT25* 366 140ACT 160 467
* sat (any form)* 83 283act (any form) 249 518
* ACT
*
ACT25
* SATm25 * 61 0SAT 59 40
* SATm25 * 53 78SAT 0 9
* SATm25 * 135 6SAT 15 311
* SATm25 * 83 54SAT 33 196
5
Statistics 101-106 Lecture 12 (1 Dec 98) David Pollard
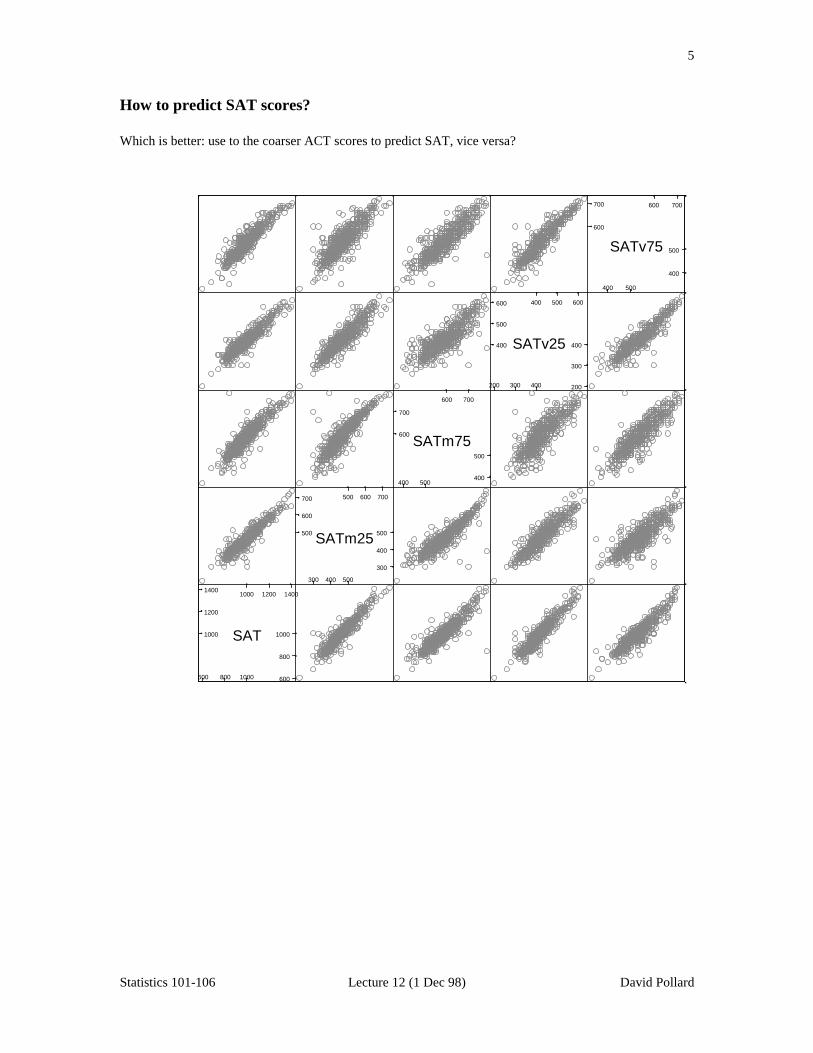
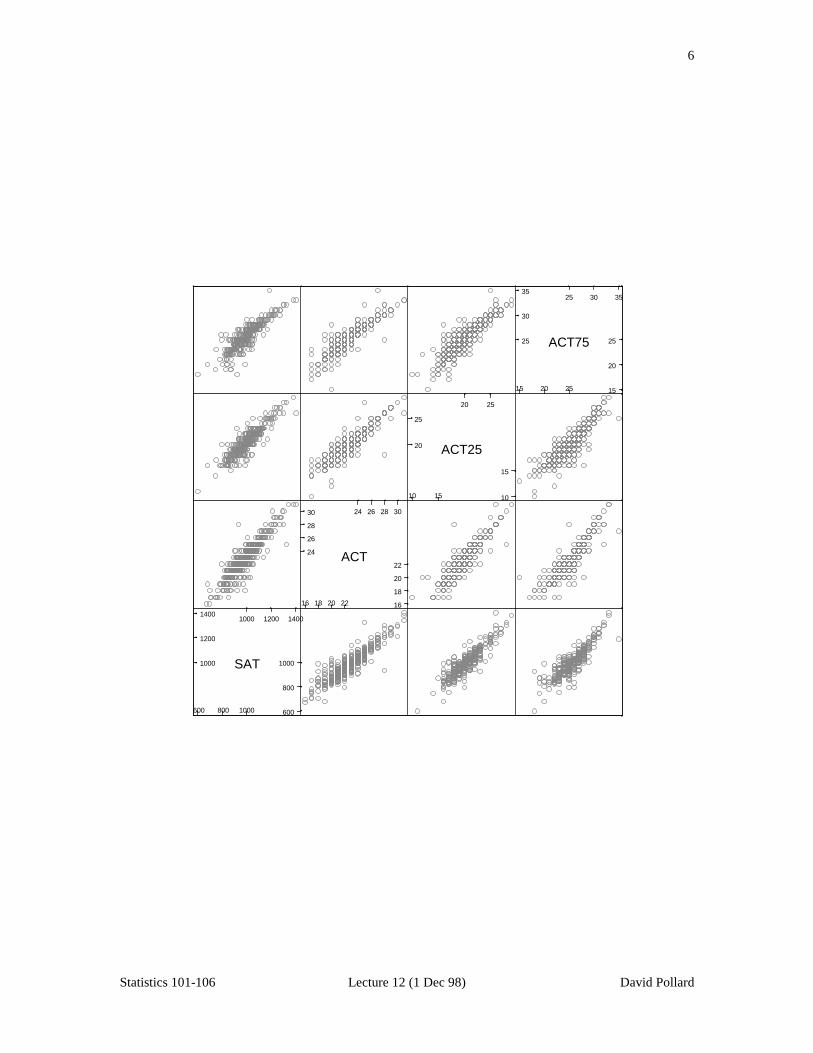
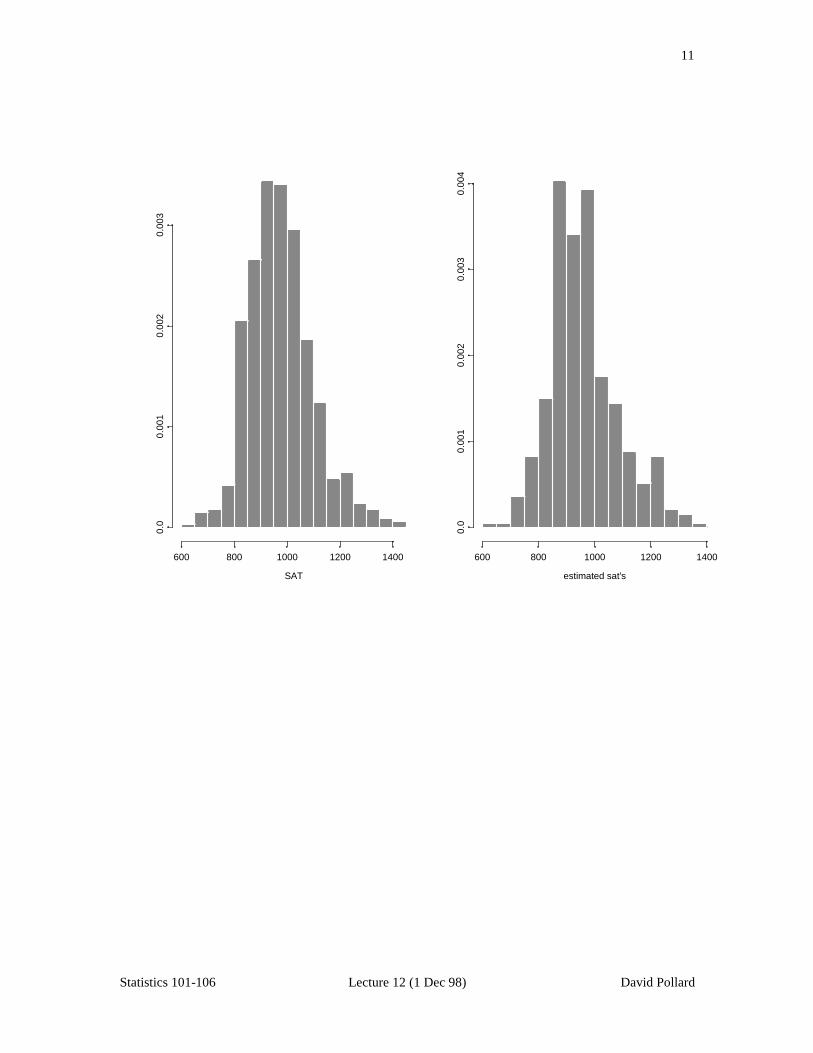
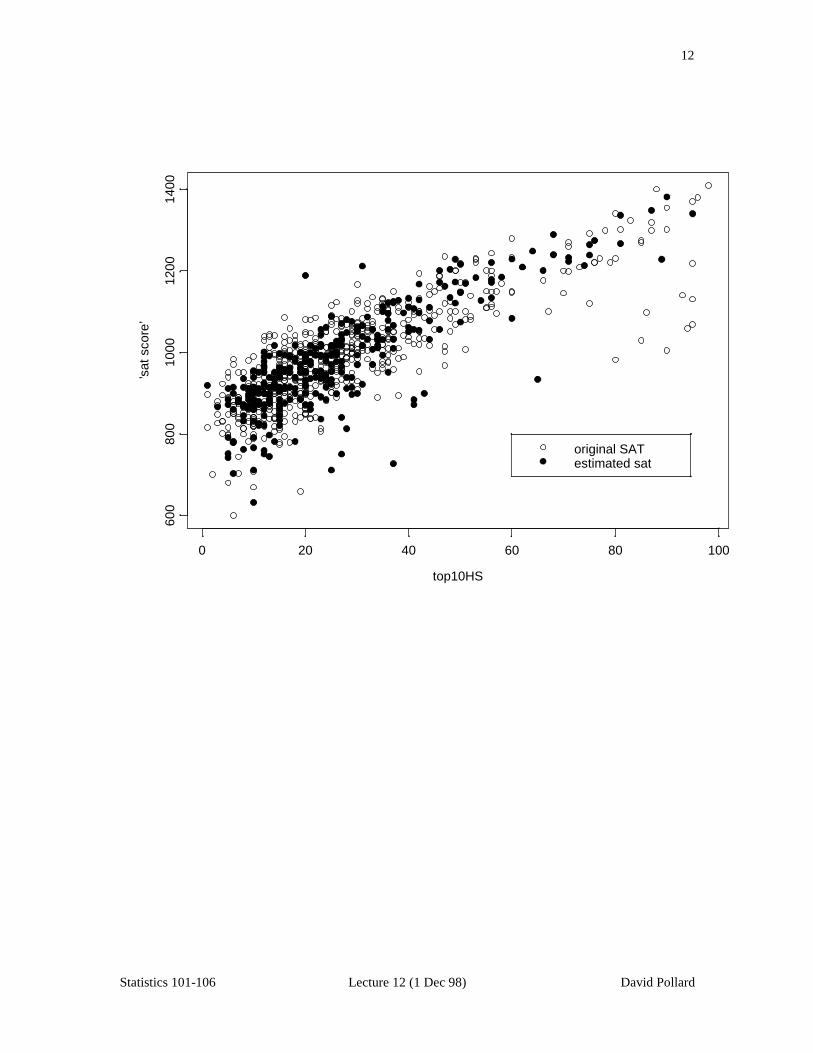
How to predict SAT scores?
Which is better: use to the coarser ACT scores to predict SAT, vice versa?
600 800 1000
1000 1200 1400
1000
1200
1400
600
800
1000SAT
300 400 500
500 600 700
500
600
700
300
400
500SATm25
400 500
600 700
600
700
400
500
SATm75
200 300 400
400 500 600
400
500
600
200
300
400SATv25
400 500
600 700
600
700
400
500SATv75
6
Statistics 101-106 Lecture 12 (1 Dec 98) David Pollard
600 800 1000
1000 1200 1400
1000
1200
1400
600
800
1000SAT
16 18 20 22
24 26 28 30
24
26
28
30
16
18
20
22ACT
10 15
20 25
20
25
10
15
ACT25
15 20 25
25 30 35
25
30
35
15
20
25ACT75
7
Statistics 101-106 Lecture 12 (1 Dec 98) David Pollard
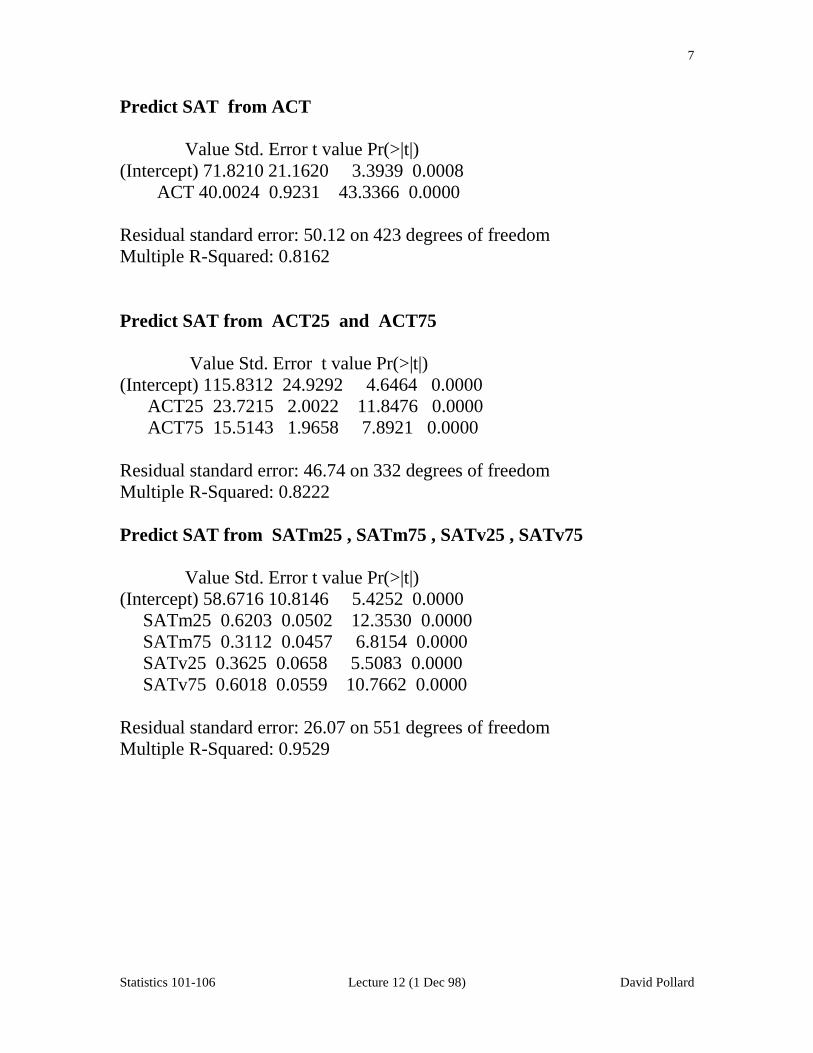
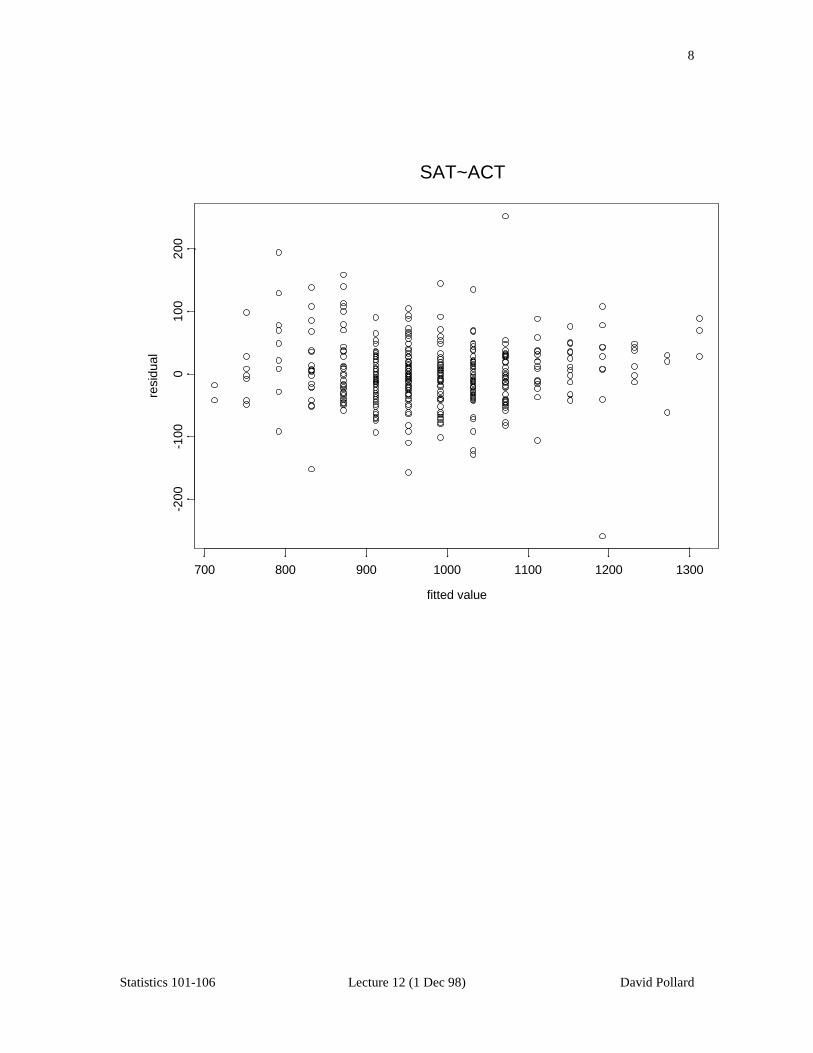
Predict SAT from ACT
Value Std. Error t value Pr(>|t|)(Intercept) 71.8210 21.1620 3.3939 0.0008 ACT 40.0024 0.9231 43.3366 0.0000
Residual standard error: 50.12 on 423 degrees of freedomMultiple R-Squared: 0.8162
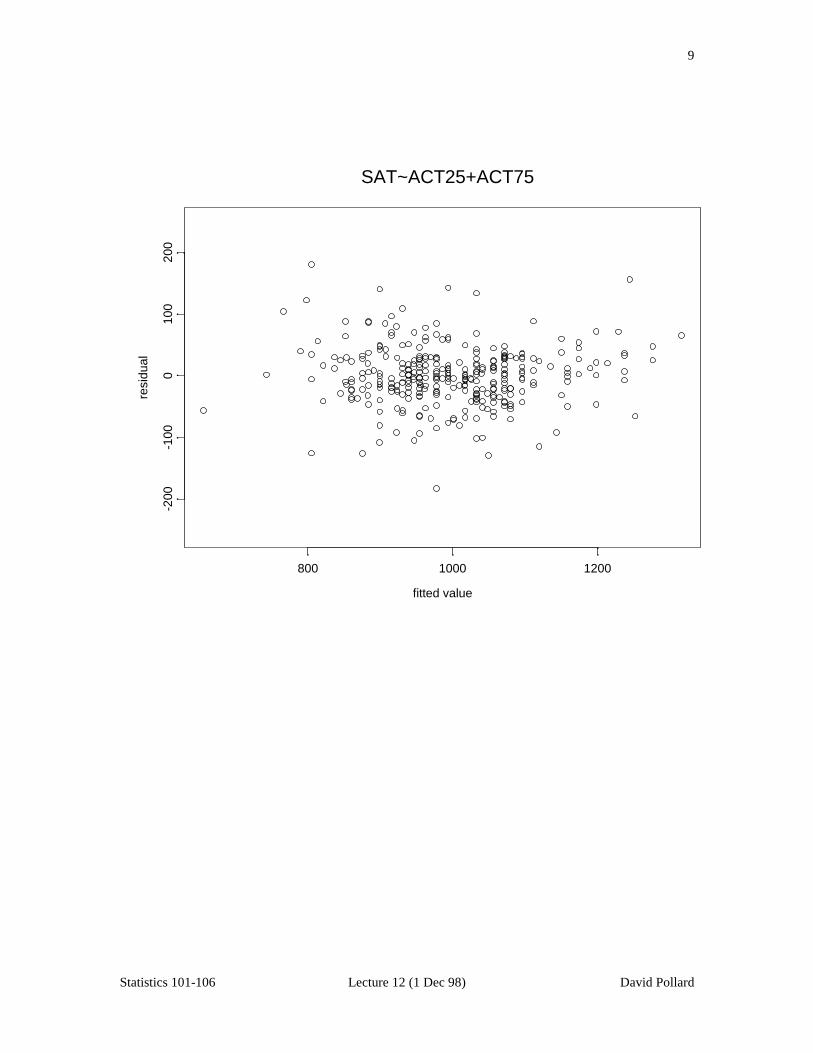
Predict SAT from ACT25 and ACT75
Value Std. Error t value Pr(>|t|)(Intercept) 115.8312 24.9292 4.6464 0.0000 ACT25 23.7215 2.0022 11.8476 0.0000 ACT75 15.5143 1.9658 7.8921 0.0000
Residual standard error: 46.74 on 332 degrees of freedomMultiple R-Squared: 0.8222
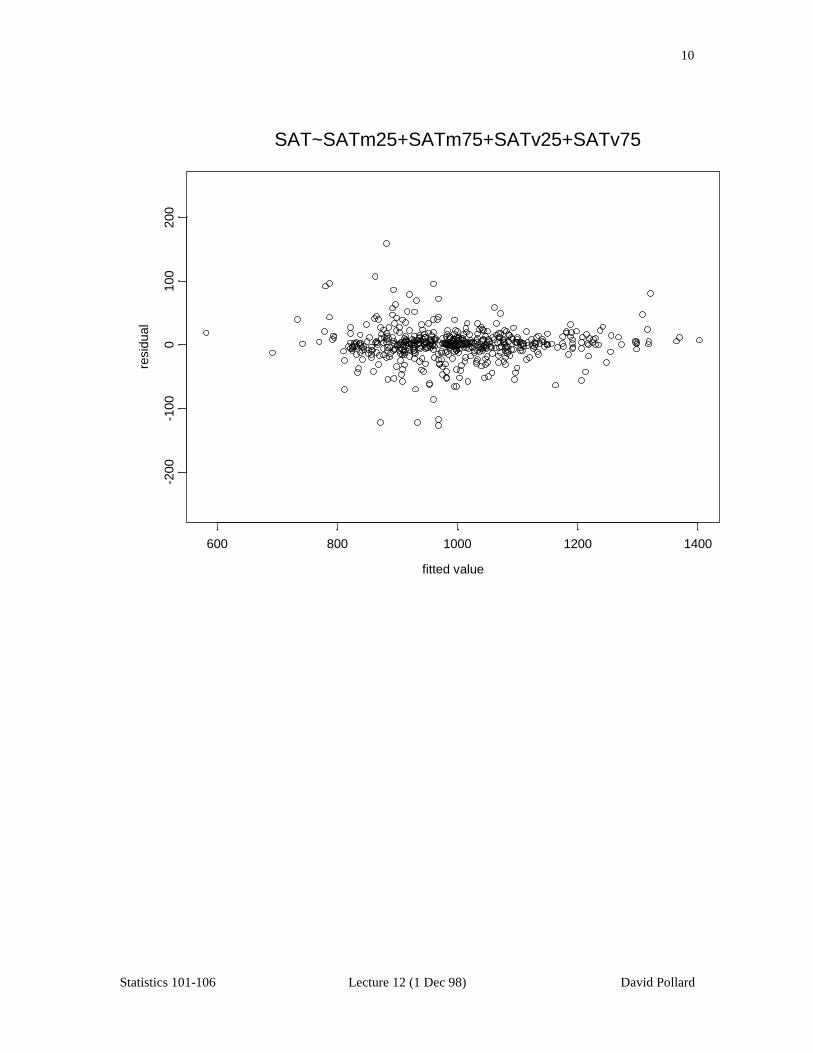
Predict SAT from SATm25 , SATm75 , SATv25 , SATv75
Value Std. Error t value Pr(>|t|)(Intercept) 58.6716 10.8146 5.4252 0.0000 SATm25 0.6203 0.0502 12.3530 0.0000 SATm75 0.3112 0.0457 6.8154 0.0000 SATv25 0.3625 0.0658 5.5083 0.0000 SATv75 0.6018 0.0559 10.7662 0.0000
Residual standard error: 26.07 on 551 degrees of freedomMultiple R-Squared: 0.9529
8
Statistics 101-106 Lecture 12 (1 Dec 98) David Pollard
fitted value
resi
dual
700 800 900 1000 1100 1200 1300
-200
-100
010
020
0SAT~ACT
9
Statistics 101-106 Lecture 12 (1 Dec 98) David Pollard
fitted value
resi
dual
800 1000 1200
-200
-100
010
020
0SAT~ACT25+ACT75
10
Statistics 101-106 Lecture 12 (1 Dec 98) David Pollard
fitted value
resi
dual
600 800 1000 1200 1400
-200
-100
010
020
0
SAT~SATm25+SATm75+SATv25+SATv75
11
Statistics 101-106 Lecture 12 (1 Dec 98) David Pollard
600 800 1000 1200 1400
0.0
0.00
10.
002
0.00
3
SAT
600 800 1000 1200 1400
0.0
0.00
10.
002
0.00
30.
004
estimated sat’s
12
Statistics 101-106 Lecture 12 (1 Dec 98) David Pollard
top10HS
’sat
sco
re’
0 20 40 60 80 100
600
800
1000
1200
1400
original SATestimated sat
13
Statistics 101-106 Lecture 12 (1 Dec 98) David Pollard
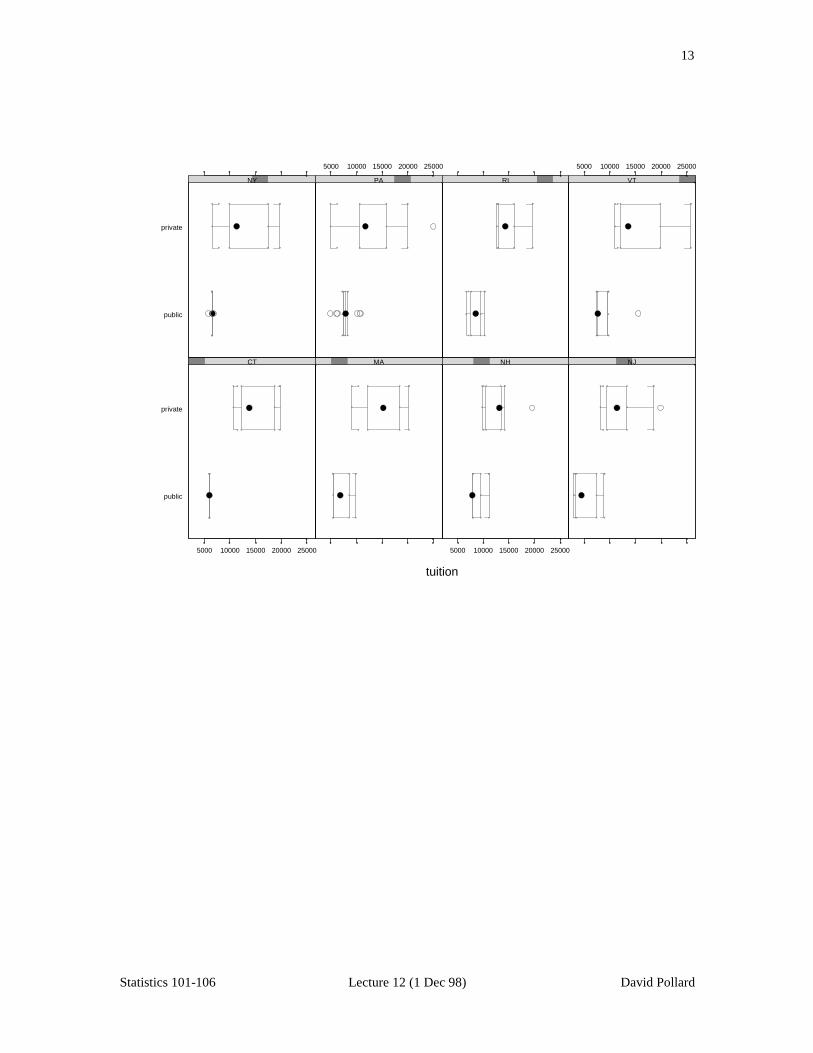
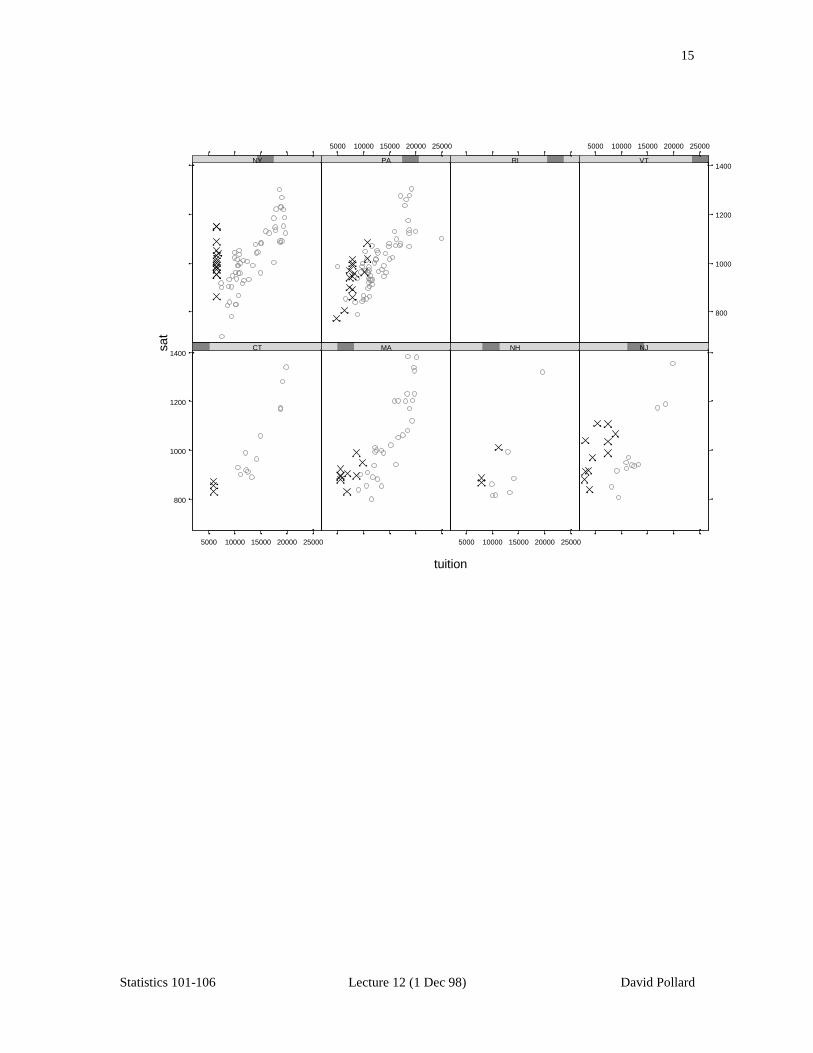
public
private
CT
5000 10000 15000 20000 25000
MA NH
5000 10000 15000 20000 25000
NJ
public
private
NY PA
5000 10000 15000 20000 25000
RI VT
5000 10000 15000 20000 25000
tuition
14
Statistics 101-106 Lecture 12 (1 Dec 98) David Pollard
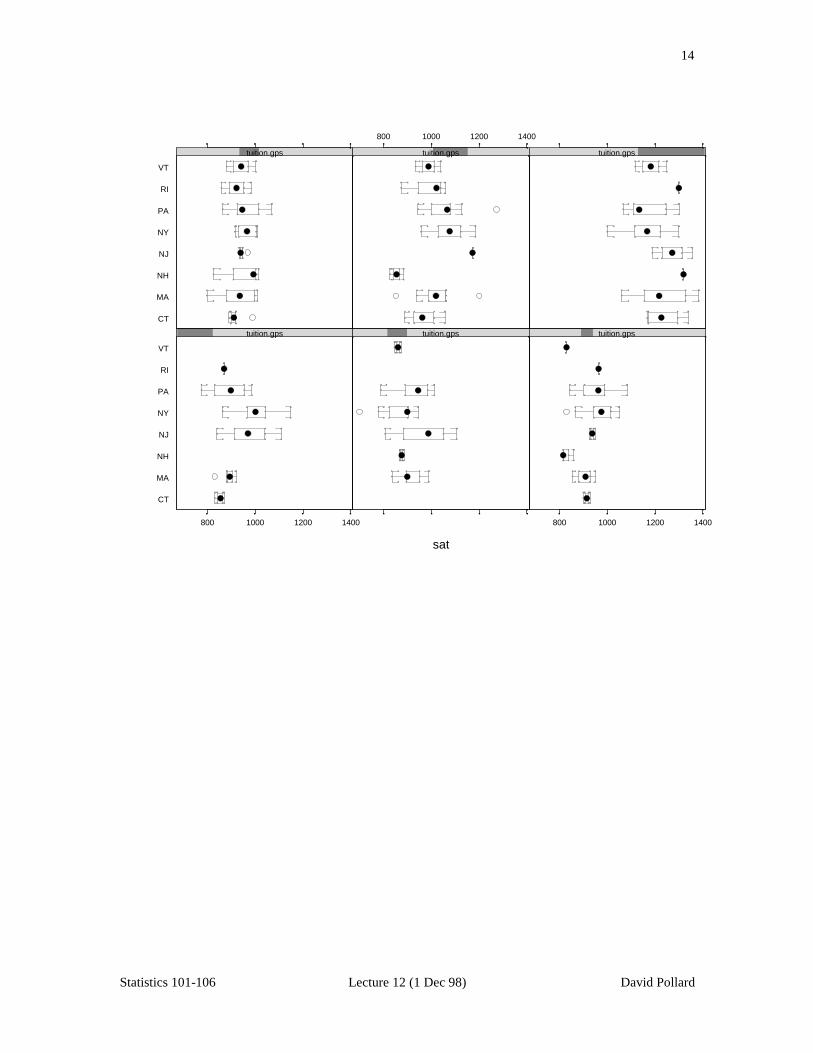
CT
MA
NH
NJ
NY
PA
RI
VT
tuition.gps
800 1000 1200 1400
tuition.gps tuition.gps
800 1000 1200 1400
CT
MA
NH
NJ
NY
PA
RI
VT
tuition.gps tuition.gps
800 1000 1200 1400
tuition.gps
sat
15
Statistics 101-106 Lecture 12 (1 Dec 98) David Pollard
800
1000
1200
1400CT
5000 10000 15000 20000 25000
MA NH
5000 10000 15000 20000 25000
NJ
NY PA
5000 10000 15000 20000 25000
RI
800
1000
1200
1400VT
5000 10000 15000 20000 25000
tuition
sat