Embed Size (px)
Citation preview

Definitions Perception Gray Levels Representations
Color and Color Images1
Lecture 12
See Section 1.3 inReinhard Klette: Concise Computer Vision
Springer-Verlag, London, 2014
1See last slide for copyright information.1 / 40

Definitions Perception Gray Levels Representations
Agenda
1 Color Definitions
2 Color Perception
3 Gray Levels
4 Color Representations
2 / 40

Definitions Perception Gray Levels Representations
Perceived Color
Not objectively defined
Varies for people
Depends on lighting
No light then no color
Human vision can discriminate a few dozens of gray-levels buthundreds to thousands of different colors
3 / 40

Definitions Perception Gray Levels Representations
Color Definitions in Visible Spectrum
1 nm = 1 nanometer = 10−9 m
1 Red (about 625 to 780 nm), Orange (about 590 to 625 nm),invisible spectrum continues with Infrared (IR)
2 Yellow (about 565 to 590 nm), Green (about 500 to 565 nm),Cyan (about 485 to 500 nm)
3 Blue (about 440 to 485 nm)
4 Violet (about 380 to 440 nm), invisible spectrum continueswith Ultraviolet (UV)
4 / 40

Definitions Perception Gray Levels Representations
Retina of the Human Eye
Photoreceptors: some 120 million rods for luminosity response, andsome 6 to 7 million cones, concentrated towards the fovea
Pupil Cornea
Lens
Iris
Retina
Choroid
Sclera
Opticnerve
Fovea
5 / 40

Definitions Perception Gray Levels Representations
Tristimulus Values and CIE
Experimental evidence: three types of color-sensitive cones, Red(about 64%), Green (about 32%), Blue (about 2%)
Visible color modeled by tristimulus values
CIE (Commission Internationale de l’Eclairage = InternationalCommission on Illumination) defines color standards since the1930s
Tristimulus values defined by weighting functions x y , and z
6 / 40

Definitions Perception Gray Levels Representations
Energy Distribution
Monochromatic energy distributions L(λ), 380 ≤ λ ≤ 780Chromatic is LR(λ), LG (λ), and LB(λ)
380 550 780 380 550 780
2.0
1.0
500 600 700
Sketch for an incandescent house lamp
CIE energy distribution functions x(λ) (blue), y(λ) (green), andz(λ) (red) for defining tristimulus values X , Y , and Z
7 / 40

Definitions Perception Gray Levels Representations
Weighting Functions
Cut-offs at both ends of functions x(λ) (blue), y(λ) (green), andz(λ) (red) do not correspond exactly to human-eye abilities toperceive shorter (down to 380 nm) or larger (up to 810 nm)wavelengths
Curves have also been scaled:∫ 700
400x(λ) dλ =
∫ 700
400y(λ) dλ =
∫ 700
400z(λ) dλ
Example: Curve y models the luminosity response of an “averagehuman eye”
8 / 40
Definitions Perception Gray Levels Representations
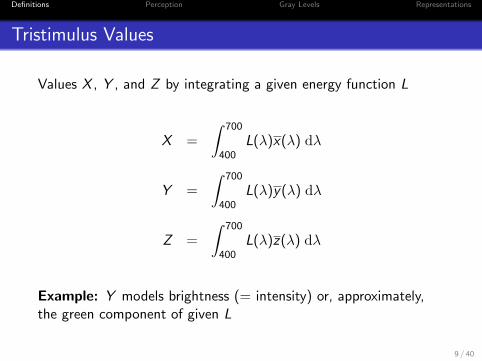
Tristimulus Values
Values X , Y , and Z by integrating a given energy function L
X =
∫ 700
400L(λ)x(λ) dλ
Y =
∫ 700
400L(λ)y(λ) dλ
Z =
∫ 700
400L(λ)z(λ) dλ
Example: Y models brightness (= intensity) or, approximately,the green component of given L
9 / 40

Definitions Perception Gray Levels Representations
Normalized CIE xy -Parameters
x =X
X + Y + Zand y =
Y
X + Y + Z
Assume: Y is given. Can derive X and Z from x and y
With z = Z/(X + Y + Z ) it is x + y + z = 1
The xy Color Space of the CIE.
Represents colors, not brightness
xy color space represented by a chromaticity diagram for0 ≤ x , y ≤ 1
10 / 40

Definitions Perception Gray Levels Representations
Chromaticity Diagram: The xy CIE Color Space
11 / 40
Definitions Perception Gray Levels Representations
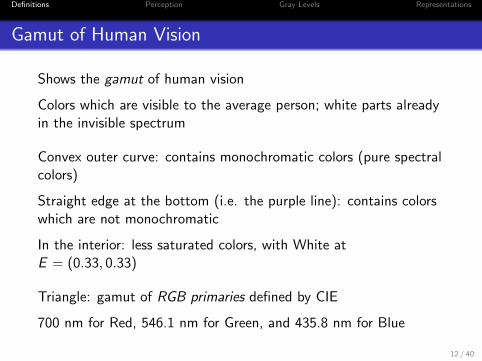
Gamut of Human Vision
Shows the gamut of human vision
Colors which are visible to the average person; white parts alreadyin the invisible spectrum
Convex outer curve: contains monochromatic colors (pure spectralcolors)
Straight edge at the bottom (i.e. the purple line): contains colorswhich are not monochromatic
In the interior: less saturated colors, with White atE = (0.33, 0.33)
Triangle: gamut of RGB primaries defined by CIE
700 nm for Red, 546.1 nm for Green, and 435.8 nm for Blue
12 / 40

Definitions Perception Gray Levels Representations
Different Gamuts of Media
Gamut: available color range (such as “perceivable”, “printable”,or “displayable”)
Depends on used medium
Example: warning of image-editing system:
Rule of thumb: transparent media have potentially larger gamutthan printed material
13 / 40

Definitions Perception Gray Levels Representations
Agenda
1 Color Definitions
2 Color Perception
3 Gray Levels
4 Color Representations
14 / 40

Definitions Perception Gray Levels Representations
Red-Green Color Blindness
Different energy distributions L1(λ) and L2(λ) for visible spectrum,human H may perceive both as identical colors
L1H= L2
Color blindness: some colors cannot be distinguished
About 99% of cases: red-green color blindness
For people of European origin: about 8% - 12% males, about 0.5%females
15 / 40
Definitions Perception Gray Levels Representations
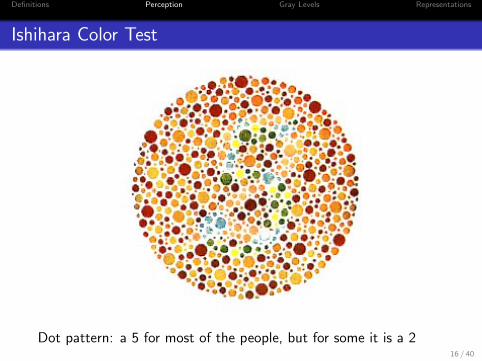
Ishihara Color Test
Dot pattern: a 5 for most of the people, but for some it is a 216 / 40

Definitions Perception Gray Levels Representations
A Rule for Graphics Design
When using red-green colors in a presentation then some of youraudience (e.g. the above-mentioned percentage with Europeanorigin) might not see what you are intending to show.
17 / 40

Definitions Perception Gray Levels Representations
Algebra of Color Vision
Adding two colors L and C : superimposing both light spectra L(λ)and C (λ)
Experimental evidence (for a test person H):
L1 + CH= L2 + C if L1
H= L2
aL1H= aL2 if L1
H= L2 and 0 ≤ a ≤ 1
Define an algebra of color perception, for linear combinationsaL + bC
Computer screen uses gamma correction, for γ > 0:
Color value u = k/2a (one channel) presented as uγ
γ < 1 defines gamma compression; γ > 1 defines gamma expansion18 / 40

Definitions Perception Gray Levels Representations
Color as a Purely Visual Sensation
Benham Disk: Benham was a nineteenth-century toymaker
Spinn under bright incandescent light or sunlight
Three types of cones in the eye, each type has a different latencytime .. (full explanation is more complicated)
19 / 40

Definitions Perception Gray Levels Representations
Four Primary Colors
There appears to be agreement that Yellow, Red, Green, and Bluedefine the four primary color perceptions
For avoiding green-red misperceptions, option is to use yellow, red,and blue as base colors in presentations
20 / 40

Definitions Perception Gray Levels Representations
Agenda
1 Color Definitions
2 Color Perception
3 Gray Levels
4 Color Representations
21 / 40
Definitions Perception Gray Levels Representations
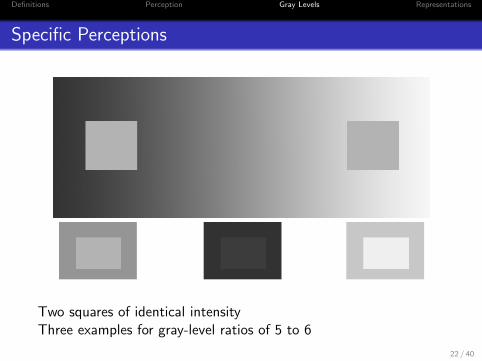
Specific Perceptions
Two squares of identical intensityThree examples for gray-level ratios of 5 to 6
22 / 40

Definitions Perception Gray Levels Representations
Gray-Levels
Gray-levels are not colors
Described by luminance (the physical intensity) or brightness (theperceived intensity)
Uniform scale of gray-levels or intensities is common:
uk = k/2a, for 0 ≤ k < 2a
Human vision perceives the ratio of intensities
Visually difficult to discriminate between slightly different very darkgray-levels
Human eye: better for noticing different bright gray-levels
See: build-in non-linear correction in digital cameras23 / 40

Definitions Perception Gray Levels Representations
Visual Illusions: Rotating Snake by A. Kitaoka
From motion, luminance or contrast, geometry, 3D space,cognitive effects, specialized imaginations, or from color
24 / 40

Definitions Perception Gray Levels Representations
Agenda
1 Color Definitions
2 Color Perception
3 Gray Levels
4 Color Representations
25 / 40
Definitions Perception Gray Levels Representations
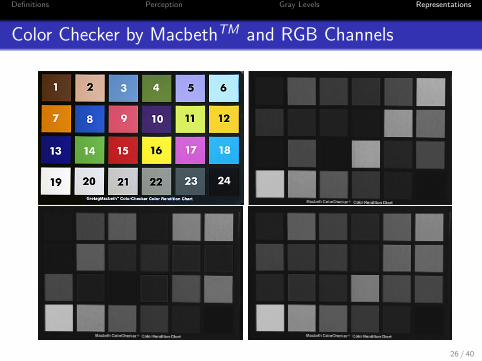
Color Checker by MacbethTM and RGB Channels
26 / 40

Definitions Perception Gray Levels Representations
RGB
RGB color representation model is additive: adding to a colorcontributes to going towards White
Color models used for printing are subtractive: adding to a colorcontributes to going towards Black
The RGB Space.
27 / 40

Definitions Perception Gray Levels Representations
RGB Comments
0 ≤ R,G ,B ≤ Gmax , image I with pixel values u = (R,G ,B)
If Gmax = 255 then 16,777,216 different colors
u = (255, 0, 0) for Red, u = (255, 255, 0) for Yellow, and so forth
Diagonal in cube:from White at (255, 255, 255) to Black at (0, 0, 0)
Gray-levels (u, u, u) are not colors
q = (R,G ,B) in RGB cube defines a color or a gray-level
Intensity:
M =R + G + B
3
28 / 40

Definitions Perception Gray Levels Representations
HSI
Assume: plane cuts RGB cube orthogonal to gray-level diagonal
δ
=[R,G,B]T
q = (R,G ,B) incident with plane but not on diagonal
Disc is an abstract representation of actually resulting polygons
29 / 40

Definitions Perception Gray Levels Representations
Hue, Saturation, Intensity
The intensity axis: along the gray-level diagonal in the RGB cube
Identify one color (here, Red) as reference color
Describe q by intensity, hue (angle with respect to reference color),and saturation (distance to the intensity axis)
30 / 40

Definitions Perception Gray Levels Representations
Formal HSI Definition
One of many options
H =
{δ, if B ≤ G2π − δ, if B > G
with
δ = arcos(R − G ) + (R − B)
2√
(R − G )2 + (R − B) (G − B)in [0, π)
S = 1− 3 · min{R,G ,B}R + G + B
Represent intensity by M to avoid confusion with I (image)
This defines a HSI color model; more options possible
31 / 40

Definitions Perception Gray Levels Representations
Actual Cuts Through the RGB Cube
Cuts through the RGB cube at u = 131RGB image I131 of the cutSaturation values for this cutHow do the hue values look like if shown as gray-level image?
32 / 40

Definitions Perception Gray Levels Representations
RGB and HSI Examples
Gray-level (u, u, u) with u 6= 0:M =??, S =??, and H undefined
Black (0, 0, 0):M =??; saturation and hue undefined
Transformation of other RGB values into HSI values is one-one
Red (Gmax , 0, 0):M =??, H =??, and S =??
Green (0,Gmax , 0):M =??, S =??, δ =??, H =??
Blue (0, 0,Gmax):δ =??, H =??
33 / 40

Definitions Perception Gray Levels Representations
A Visualization Effect
Map S and H linearly into {0, 1, . . . ,Gmax}
Visualize resulting images
Then: hue value of (Gmax , ε1, ε2) either black or white, just forminor changes in small reals ε1 and ε2
Why?
34 / 40

Definitions Perception Gray Levels Representations
Color Checker Again
Visualizing hue and saturation values by means of gray-levels
35 / 40

Definitions Perception Gray Levels Representations
Itten and Color Perception
Johannes Itten (1888 – 1967, Switzerland) wrote the influentialbook “The Art of Color”
How does a color affect a person’s psychology?
Red: resting matter, the color of gravity and opacity
Blue: eternal restless mind, relaxation and continuous motion
Yellow: fierce and aggressive, thinking, weightless
Orange: brilliant luminance, cheap and brash, energy and fun
Purple: ancient purple dye was more valuable than goldpower, believe, force, death and darkness, loneliness
Green: resting at the center, neither active nor passivenatural, live and spring, hope and trust, silence and relaxationhealthy, but also poisonous
36 / 40

Definitions Perception Gray Levels Representations
Geometric Shapes and Colors
Itten also assigned geometric shapes to colors
37 / 40

Definitions Perception Gray Levels Representations
Why do People Decide for a Particular Color?
38 / 40

Definitions Perception Gray Levels Representations
Leonardo on Color
Leonardo da Vinci (1452 – 1519) wrote “a lot” on colors in hisnotebooks
Note 273: The effect of colors in the camera obscura.
The edges of a color(ed object) transmitted through asmall hole are more conspicuous than the centralportions.
The edges of the images, of whatever color, which aretransmitted through a small aperture into a darkchamber will always be stronger than the middle portion.
conspicuous = standing out so as to be clearly visible
39 / 40

Definitions Perception Gray Levels Representations
Copyright Information
This slide show was prepared by Reinhard Klettewith kind permission from Springer Science+Business Media B.V.
The slide show can be used freely for presentations.However, all the material is copyrighted.
R. Klette. Concise Computer Vision.c©Springer-Verlag, London, 2014.
In case of citation: just cite the book, that’s fine.
40 / 40