Embed Size (px)
Citation preview

Lecture 11:

Agenda
• KUOW program yesterday– http://www.kuow.org/search.php?page=1&chSum
maries=1&txtKeyWordSearch=weight+loss• Open discussion

Definitions:• Obesity: Body Mass Index (BMI) of 30 or higher.
• Body Mass Index (BMI): A measure of an adult’s weight in relation to his or her height, specifically the adult’s weight in kilograms divided by the square of his or her height in meters.
Obesity Trends Among U.S. Adults
Between 1985 and 2010

Obesity Trends Among U.S. Adults Between 1985 and 2010
Source of the data:• The data shown in these maps were collected
through CDC’s Behavioral Risk Factor Surveillance System (BRFSS). Each year, state health departments use standard procedures to collect data through a series of telephone interviews with U.S. adults. Height and weight data are self-reported.
• Prevalence estimates generated for the maps may vary slightly from those generated for the states by BRFSS (http://aps.nccd.cdc.gov/brfss) as slightly different analytic methods are used.

• In 1990, among states participating in the Behavioral Risk Factor Surveillance System, 10 states had a prevalence of obesity less than 10% and no state had prevalence equal to or greater than 15%.
• By 2000, no state had a prevalence of obesity less than 10%, 23 states had a prevalence between 20–24%, and no state had prevalence equal to or greater than 25%.
• In 2010, no state had a prevalence of obesity less than 20%. Thirty-six states had a prevalence equal to or greater than 25%; 12 of these states (Alabama, Arkansas, Kentucky, Louisiana, Michigan, Mississippi, Missouri, Oklahoma, South Carolina, Tennessee, Texas, and West Virginia) had a prevalence equal to or greater than 30%.

Citations
• Mokdad AH, et al. The spread of the obesity epidemic in the United States, 1991–1998. JAMA 1999;282:16:1519–22.
• Mokdad AH, et al. The continuing epidemics of obesity and diabetes in the United States. JAMA 2001;286:10:1519–22.
• Mokdad AH, et al. Prevalence of obesity, diabetes, and obesity-related health risk factors, 2001. JAMA 2003;289:1:76–9.
• CDC. State-specific prevalence of obesity among adults — United States, 2005. MMWR 2006;55(36):985–8.
• CDC. State-specific prevalence of obesity among adults — United States, 2007. MMWR 2008;57(28):765–8.
• CDC. Vital signs: State-specific prevalence of obesity among adults — United States, 2009. MMWR 2010;59:1–5.

2000
Obesity Trends* Among U.S. AdultsBRFSS, 1990, 2000, 2010
(*BMI 30, or about 30 lbs. overweight for 5’4” person)
2010
1990
No Data <10% 10%–14% 15%–19% 20%–24% 25%–29% ≥30%

Obesity Trends* Among U.S. AdultsBRFSS, 1985
(*BMI ≥30, or ~ 30 lbs. overweight for 5’ 4” person)
No Data <10% 10%–14%

Obesity Trends* Among U.S. AdultsBRFSS, 1986
(*BMI ≥30, or ~ 30 lbs. overweight for 5’ 4” person)
No Data <10% 10%–14%

Obesity Trends* Among U.S. AdultsBRFSS, 1987
(*BMI ≥30, or ~ 30 lbs. overweight for 5’ 4” person)
No Data <10% 10%–14%

Obesity Trends* Among U.S. AdultsBRFSS, 1988
(*BMI ≥30, or ~ 30 lbs. overweight for 5’ 4” person)
No Data <10% 10%–14%

Obesity Trends* Among U.S. AdultsBRFSS, 1989
(*BMI ≥30, or ~ 30 lbs. overweight for 5’ 4” person)
No Data <10% 10%–14%

Obesity Trends* Among U.S. AdultsBRFSS, 1990
(*BMI ≥30, or ~ 30 lbs. overweight for 5’ 4” person)
No Data <10% 10%–14%

Obesity Trends* Among U.S. AdultsBRFSS, 1991
(*BMI ≥30, or ~ 30 lbs. overweight for 5’ 4” person)
No Data <10% 10%–14% 15%–19%
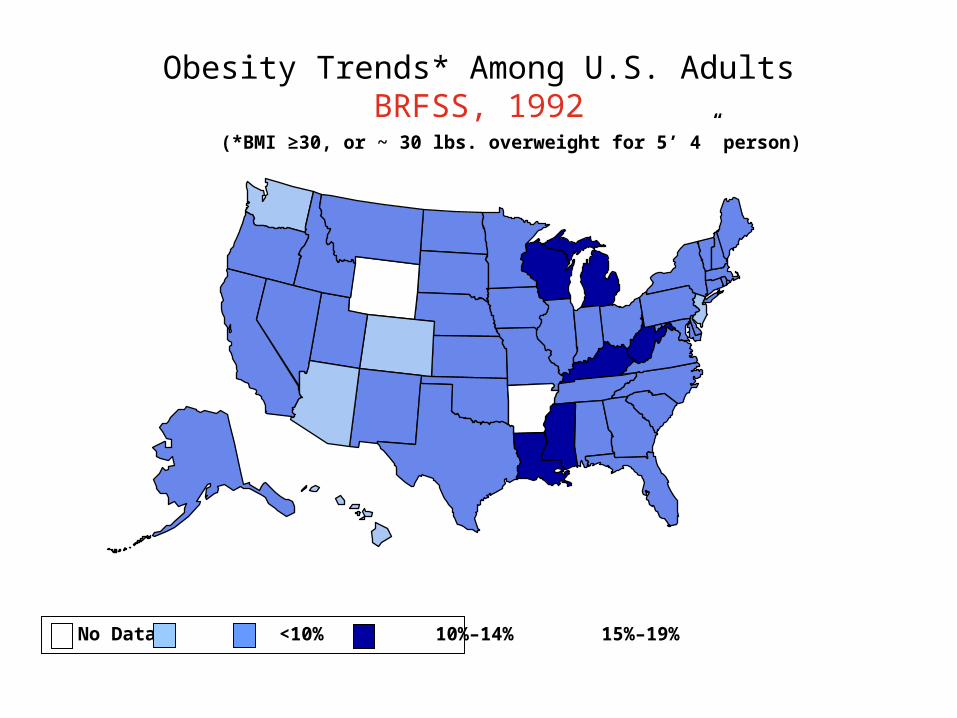
Obesity Trends* Among U.S. AdultsBRFSS, 1992
(*BMI ≥30, or ~ 30 lbs. overweight for 5’ 4” person)
No Data <10% 10%–14% 15%–19%

Obesity Trends* Among U.S. AdultsBRFSS, 1993
(*BMI ≥30, or ~ 30 lbs. overweight for 5’ 4” person)
No Data <10% 10%–14% 15%–19%

Obesity Trends* Among U.S. AdultsBRFSS, 1994
(*BMI ≥30, or ~ 30 lbs. overweight for 5’ 4” person)
No Data <10% 10%–14% 15%–19%

Obesity Trends* Among U.S. AdultsBRFSS, 1995
(*BMI ≥30, or ~ 30 lbs. overweight for 5’ 4” person)
No Data <10% 10%–14% 15%–19%

Obesity Trends* Among U.S. AdultsBRFSS, 1996
(*BMI ≥30, or ~ 30 lbs. overweight for 5’ 4” person)
No Data <10% 10%–14% 15%–19% >20%
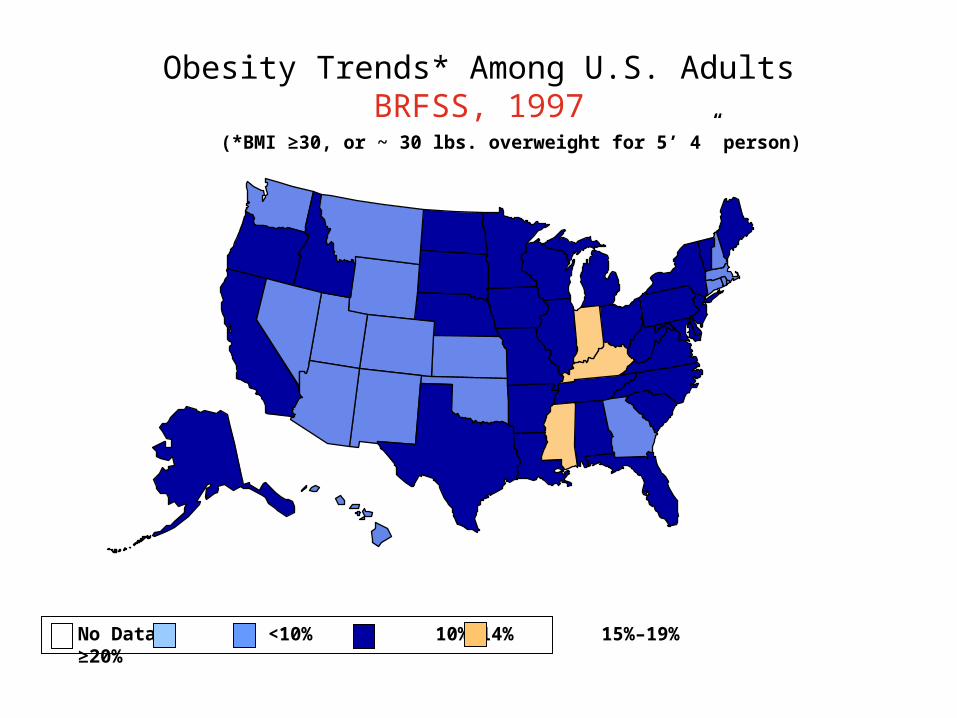
Obesity Trends* Among U.S. AdultsBRFSS, 1997
(*BMI ≥30, or ~ 30 lbs. overweight for 5’ 4” person)
No Data <10% 10%–14% 15%–19% ≥20%

Obesity Trends* Among U.S. AdultsBRFSS, 1998
(*BMI ≥30, or ~ 30 lbs. overweight for 5’ 4” person)
No Data <10% 10%–14% 15%–19% ≥20%

Obesity Trends* Among U.S. AdultsBRFSS, 1999
(*BMI ≥30, or ~ 30 lbs. overweight for 5’ 4” person)
No Data <10% 10%–14% 15%–19% ≥20%

Obesity Trends* Among U.S. AdultsBRFSS, 2000
(*BMI ≥30, or ~ 30 lbs. overweight for 5’ 4” person)
No Data <10% 10%–14% 15%–19% ≥20%

Obesity Trends* Among U.S. AdultsBRFSS, 2001
(*BMI ≥30, or ~ 30 lbs. overweight for 5’ 4” person)
No Data <10% 10%–14% 15%–19% 20%–24% ≥25%
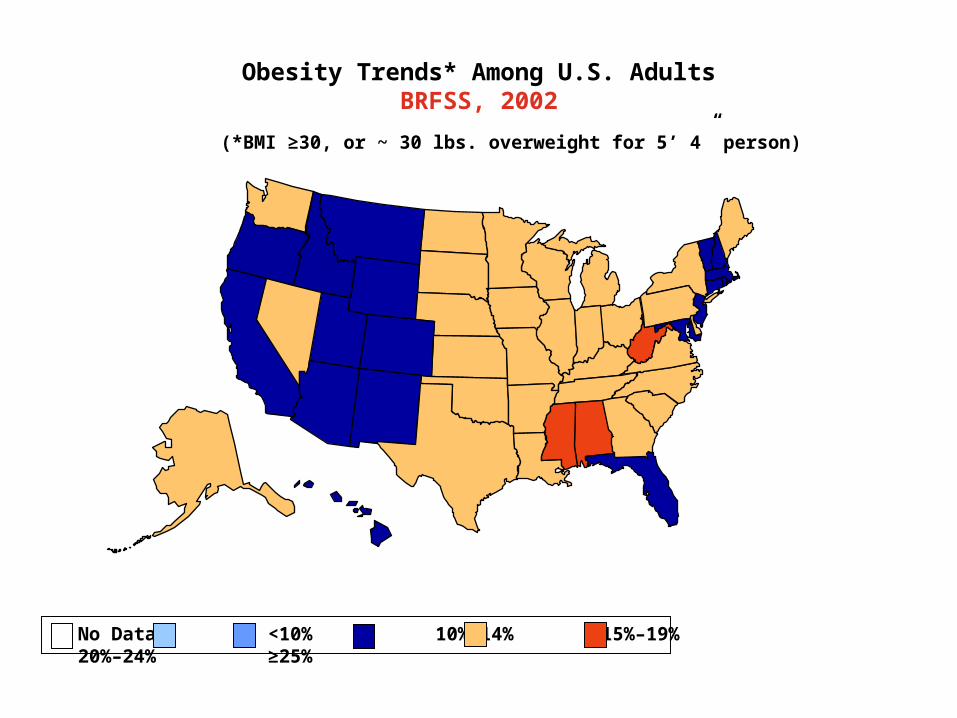
(*BMI ≥30, or ~ 30 lbs. overweight for 5’ 4” person)
Obesity Trends* Among U.S. AdultsBRFSS, 2002
No Data <10% 10%–14% 15%–19% 20%–24% ≥25%

Obesity Trends* Among U.S. AdultsBRFSS, 2003
(*BMI ≥30, or ~ 30 lbs. overweight for 5’ 4” person)
No Data <10% 10%–14% 15%–19% 20%–24% ≥25%

Obesity Trends* Among U.S. AdultsBRFSS, 2004
(*BMI ≥30, or ~ 30 lbs. overweight for 5’ 4” person)
No Data <10% 10%–14% 15%–19% 20%–24% ≥25%

Obesity Trends* Among U.S. AdultsBRFSS, 2005
(*BMI ≥30, or ~ 30 lbs. overweight for 5’ 4” person)
No Data <10% 10%–14% 15%–19% 20%–24% 25%–29% ≥30%
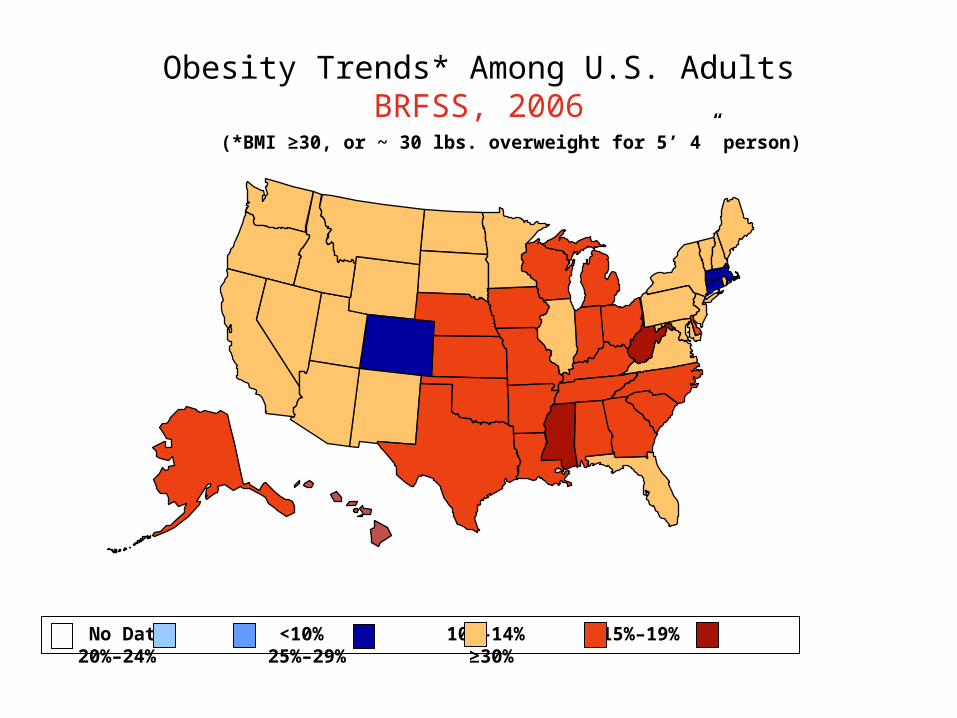
Obesity Trends* Among U.S. AdultsBRFSS, 2006
(*BMI ≥30, or ~ 30 lbs. overweight for 5’ 4” person)
No Data <10% 10%–14% 15%–19% 20%–24% 25%–29% ≥30%

Obesity Trends* Among U.S. AdultsBRFSS, 2007
(*BMI ≥30, or ~ 30 lbs. overweight for 5’ 4” person)
No Data <10% 10%–14% 15%–19% 20%–24% 25%–29% ≥30%

Obesity Trends* Among U.S. AdultsBRFSS, 2008
(*BMI ≥30, or ~ 30 lbs. overweight for 5’ 4” person)
No Data <10% 10%–14% 15%–19% 20%–24% 25%–29% ≥30%

Obesity Trends* Among U.S. AdultsBRFSS, 2009
(*BMI ≥30, or ~ 30 lbs. overweight for 5’ 4” person)
No Data <10% 10%–14% 15%–19% 20%–24% 25%–29% ≥30%
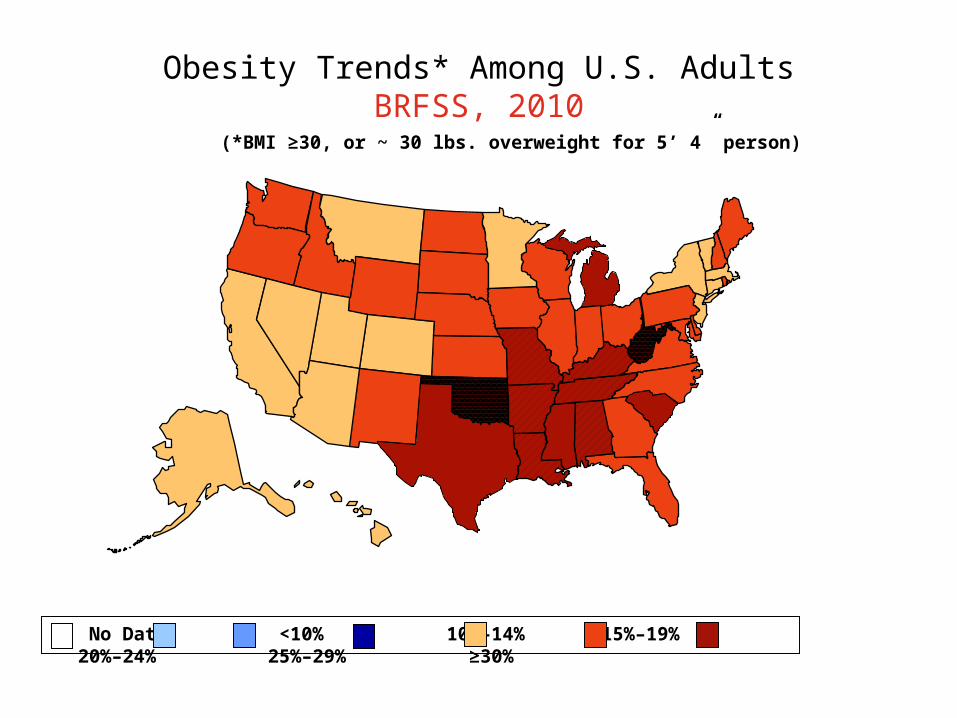
Obesity Trends* Among U.S. AdultsBRFSS, 2010
(*BMI ≥30, or ~ 30 lbs. overweight for 5’ 4” person)
No Data <10% 10%–14% 15%–19% 20%–24% 25%–29% ≥30%
Why do Americans struggle with weight?
• According to the CDC: The Caloric Balance Equation– Overweight and obesity result from an energy
imbalance. This involves eating too many calories and not getting enough physical activity.
– Body weight is the result of genes, metabolism, behavior, environment, culture, and socioeconomic status.
– Behavior and environment play a large role causing people to be overweight and obese. These are the greatest areas for prevention and treatment actions.
• This is the view supported by the book
The evil of carbohydrates
• http://www.kuow.org/search.php?page=1&chSummaries=1&txtKeyWordSearch=weight+loss
• Gary Taubes believes that carbs (primarily sugar) set of an imbalance in the body that results in high insulin
• High insulin results in higher cholesterol, higher fat deposits, etc.
• Promotes that it is not a “energy imbalance” but rather a fundamental flaw in what we eat

So it leads us to the following question…
• Is obesity a behavioral issue?• In reading your responses in the homework and the test,
most of you would believe it to be• What does your answer say about the way you view people
with weight problems?• Does it change your attitude when it is a child?• What about if it is an animal? Say a dog or a cat?• How much of your opinion is based on your personal
experience? How much on data?• Do you think that scientists play to the same faults as
everyone else?

Final Thoughts
• Personal belief: Humans have a tendency to be a little arrogant and self-centered.
• We also have a tendency to think that because we know something that that is everything there is to know about something.
• So, are we finding what we found simply because that is what we were looking for in the first place, or are paying attention to what is really going on?