Embed Size (px)
Citation preview

Lecture 10 – Technical Software Metrics
Efi Papatheocharous Visiting Lecturer [email protected] Office FST-B107, Tel. ext. 2740
EPL603 – Topics in Software Engineering

Topics covered
Quality assurance and software metrics
Process quality metrics
Product quality metrics
Static software product metrics Size metrics The CK object-oriented metrics suite
Challenges with software metrics
2 Lecture 10: Technical Software Metrics 06/11/2012

Quality assurance and software metrics
Quality assurance can be seen as an intrinsic part of the software process life-cycle.
The first step towards quality is to understand what it is and how to measure it.
Software measurement is concerned with deriving a numeric value for an attribute of a software product or process. This allows for objective comparisons between techniques and
processes.
3 Lecture 10: Technical Software Metrics 06/11/2012
software +
measures
What is Quality?
Source: H. van Vliet, Software Engineering: Principles and Practice, 3rd ed., John Wiley & Sons, 2008.

Quality assurance and software metrics
Approaches to quality: Quality of the product versus quality of the process. Check whether product or process conforms to certain norms. Improve quality by improving the product or process.
06/11/2012 Lecture 10: Technical Software Metrics 4
Conformance Improvement Product ISO 9126 ‘best practices’
Process ISO 9001 SQA
CMM SPICE
Bootstap
Source: H. van Vliet, Software Engineering: Principles and Practice, 3rd ed., John Wiley & Sons, 2008.

Quality assurance and software metrics
Product quality in particular is an amalgamation of different attributes such as: Correctness, reliability, maintainability, ease of use, etc.
Process quality is affected by the activities carried out during the software process and influences product quality.
Metrics are necessary to provide measurements of such qualities.
Metrics can also be used to gauge the size and complexity of software and hence are employed in project management and cost estimation.
5 Lecture 10: Technical Software Metrics 06/11/2012 Source: Pressman, R.S., Software Engineering: a Practitioner’s Approach, 5th Rev. Ed., McGraw-Hill, 2000.

Why software metrics?
Based on the IEEE Computer Society definition, Software Engineering is:
1) “The application of a systematic, disciplined, quantifiable approach to the development, operation, and maintenance of software; that is, the application of engineering to software.”
2) “The study of approaches as in (1).” [IEEE 610.12]
Measurement is fundamental to Software Engineering as a discipline.
“You cannot predict nor control what you cannot measure.” (DeMarco rule)
6 Lecture 10: Technical Software Metrics 06/11/2012
Source: Laird, L.M. and Brennan, M.C.: Software Measurement and Estimation: A Practical Approach (Quantitative Software Engineering Series), Wiley-IEEE Computer Society Pr, 2006.
Software measurement and metrics
With software measurement a system is assessed using a range of metrics and from these measurements a value of the system quality can be inferred.
06/11/2012 Lecture 10: Technical Software Metrics 7
Software metrics can be either control metrics or predictor metrics.
Metrics may be used to control the software process or to predict product attributes.
Source: Sommerville, I., Software Engineering, 9th ed., Addison Wesley, 2010.
Objectives of software measurement (1/2)
Gain control of the software engineering process.
Understand what is happening during development and maintenance.
In the future, improve processes and products.
8 Lecture 10: Technical Software Metrics 06/11/2012
Identify that a project is healthy. Assess the status of the project, products, processes and
resources. Document project trends.
Record characteristics of good and bad projects. Assess the magnitude of corrective action and resulting
changes.
Source: Fenton, N.E. & Pfleeger, S.L., Software Metrics: A rigorous and practical approach, 1997.

Objectives of software measurement (2/2)
Control the factors that affect software product quality.
9 Lecture 10: Technical Software Metrics 06/11/2012
Process quality:
Activities related to the production of software, tasks or milestones.
Product quality:
Explicit result of the software development activity, deliverables, products.
Resources
Source: Sommerville, I., Software Engineering, 9th ed., Addison Wesley, 2010.

Process quality metrics (1/2)
Process metrics are collected across all projects and over long periods of time.
They are used for making strategic decisions.
The intent is to provide a set of process indicators that lead to long-term software process improvement.
The only way to know how/where to improve any process is to: Measure specific attributes of the process. Develop a set of meaningful metrics based on these attributes. Use the metrics to provide indicators that will lead to a strategy
for improvement.
06/11/2012 Lecture 10: Technical Software Metrics 10 Source: Pressman, R.S., Software Engineering: a Practitioner’s Approach, 5th Rev. Ed., McGraw-Hill, 2000.

Process quality metrics (2/2)
The effectiveness of a process is measured by deriving a set of metrics based on outcomes of the process, such as: Errors uncovered before release of the software. Defects delivered to and reported by the end users. Work products delivered. Human effort expended (e.g., person-months). Calendar time expended. Conformance to the schedule. Time and effort to complete each generic activity.
Process guidelines such as CMM, ISO 9000, SPI and SPICE were suggested since the 90s to improving the process and ultimately the resulting products.
06/11/2012 Lecture 10: Technical Software Metrics 11 Source: Pressman, R.S., Software Engineering: a Practitioner’s Approach, 5th Rev. Ed., McGraw-Hill, 2000.

Product quality metrics (1/2)
Product metrics help software engineers to better understand the attributes of models and assess the quality of the software.
They help software engineers to gain insight into the design and construction of the software.
Focus on specific attributes of software engineering work products resulting from analysis, design, coding, and testing.
Provide a systematic way to assess quality based on a set of clearly defined rules.
Provide an “on-the-spot” rather than “after-the-fact” insight into the software development.
06/11/2012 Lecture 10: Technical Software Metrics 12 Source: Pressman, R.S., Software Engineering: a Practitioner’s Approach, 5th Rev. Ed., McGraw-Hill, 2000.

Product quality metrics (2/2)
Product metrics are used to assign a value to system quality attributes. By measuring the characteristics of system components, such as their
cyclomatic complexity, and then aggregating these measurements, you can assess system quality attributes, such as maintainability.
They are also used to identify the system components whose quality is sub-standard. Measurements can identify individual components with characteristics that
deviate from the norm. • For example, you can measure components to discover those with the
highest complexity. These are most likely to contain bugs because the complexity makes them harder to understand.
Also, you may measure components to identify which are reusable by design and avoid components that are complex and not reusable.
13 Lecture 10: Technical Software Metrics 06/11/2012 Source: Pressman, R.S., Software Engineering: a Practitioner’s Approach, 5th Rev. Ed., McGraw-Hill, 2000.

Software measurement for system components
System components can be analyzed separately using a range of metrics.
The values of these metrics may then compared for different components and, perhaps, with historical measurement data collected on previous projects.
Anomalous measurements, which deviate significantly from the norm, may imply that there are problems with the quality of these components.
A typical process that can be followed is shown below:
14 Lecture 10: Technical Software Metrics 06/11/2012
Source: Sommerville, I., Software Engineering, 9th ed., Addison Wesley, 2010.

Metrics assumptions
Measurement is essential if quality is aimed to be achieved. Even though many metrics are subjective, finding an objective
view can benefit both expert and novice.
Basic assumptions include that a software property *can* be measured.
The relationship exists between what we can measure and what we want to know.
We can only measure internal attributes but we are often more interested in external software attributes.
This relationship has not been ideally formalised and validated. It may be difficult to relate what can be measured to desirable
external quality attributes.
15 Lecture 10: Technical Software Metrics 06/11/2012 Source: Sommerville, I., Software Engineering, 9th ed., Addison Wesley, 2010.

Relationship between internal and external software
16 Lecture 10: Technical Software Metrics 06/11/2012
For this reason we often build models to relate the user’s external view to the developer’s internal view of the software.
Source: Sommerville, I., Software Engineering, 9th ed., Addison Wesley, 2010.
Product metrics
A quality metric should be a predictor of product quality.
Classes of product metrics: Dynamic metrics which are collected by measurements made of a
program in execution; Static metrics which are collected by measurements made of the
system representations;
Dynamic metrics help assess efficiency and reliability. Static metrics help assess complexity, understandability and
maintainability.
17 Lecture 10: Technical Software Metrics 06/11/2012 Source: Sommerville, I., Software Engineering, 9th ed., Addison Wesley, 2010.

Dynamic and static metrics
Dynamic metrics are closely related to software quality attributes It is relatively easy to measure the response time of a system
(performance attribute) or the number of failures (reliability attribute).
Static metrics have an indirect relationship with quality attributes You need to try and derive a relationship between these metrics and
properties such as complexity, understandability and maintainability.
18 Lecture 10: Technical Software Metrics 06/11/2012 Source: Sommerville, I., Software Engineering, 9th ed., Addison Wesley, 2010.

Static software product metrics (1/2)
Software metric Description Fan-in/Fan-out Fan-in is a measure of the number of functions or
methods that call another function or method (say X). Fan-out is the number of functions that are called by function X. A high value for fan-in means that X is tightly coupled to the rest of the design and changes to X will have extensive knock-on effects. A high value for fan-out suggests that the overall complexity of X may be high because of the complexity of the control logic needed to coordinate the called components.
Length of code This is a measure of the size of a program. Generally, the larger the size of the code of a component, the more complex and error-prone that component is likely to be. Length of code has been shown to be one of the most reliable metrics for predicting error-proneness in components.
19 Lecture 10: Technical Software Metrics 06/11/2012 Source: Sommerville, I., Software Engineering, 9th ed., Addison Wesley, 2010.

Static software product metrics (2/2)
Software metric Description Cyclomatic complexity
This is a measure of the control complexity of a program. This control complexity may be related to program understandability.
Length of identifiers This is a measure of the average length of identifiers (names for variables, classes, methods, etc.) in a program. The longer the identifiers, the more likely they are to be meaningful and hence the more understandable the program.
Depth of conditional nesting
This is a measure of the depth of nesting of if-statements in a program. Deeply nested if-statements are hard to understand and potentially error-prone.
Fog index This is a measure of the average length of words and sentences in documents. The higher the value of a document’s Fog index, the more difficult the document is to understand.
20 Lecture 10: Technical Software Metrics 06/11/2012 Source: Sommerville, I., Software Engineering, 9th ed., Addison Wesley, 2010.

Software size metrics (1/2)
Measure length of code using Number of Lines of Code (NLOC or LOC) or Thousands of Delivered Source Instructions (KDSI)
Assess software quality through defects/bugs per LOC or KDSI. Many definitions exist, such as the one by Conte (1986)
“A line of code is any line of program text that is not a comment or a blank line, regardless of the number of statements or fragments of statements on the line. This specifically includes all lines containing program headers, declarations, and executable and non-executable statements.”
LOC are not universally accepted measurements because: Are dependent on the programming language and programmer. Penalize well-designed but short programs. Cannot easily accommodate nonprocedural languages. Source code creation is only a small part of the total development
effort. It is often unclear how to count lines of code. Not all code implemented is delivered to the client. It is known only when the product is completely finished.
06/11/2012 Lecture 10: Technical Software Metrics 21
Sources: Fenton, N.E. & Pfleeger, S.L., Software Metrics: A rigorous and practical approach, 1997. Schach, S.R., Object-Oriented and Classical Software Engineering, 7th ed., WCB/McGraw-Hill, 2007.

Software size metrics (2/2)
Function Points (FP) measure software size by quantifying the functionality provided to the user based solely on logical design and functional specifications.
Have gained acceptance in terms of productivity (for example FP/year) and quality (defects/FP).
The IFPUG counting practices committee (http://www.ifpug.org ) is the de facto standard for counting methods.
The count is derived using empirical relationships based on countable (direct) measures of the software system (domain and requirements).
06/11/2012 Lecture 10: Technical Software Metrics 22 Source: Fenton, N.E. & Pfleeger, S.L., Software Metrics: A rigorous and practical approach, 1997.

Superiority of FP over LOC
Assembler version Ada version
Source code size 70 KDSI 25 KDSI
Development costs $1,043,000 $590,000
KDSI per person-month 0.335 0.211
Cost per source statement $14.90 $23.60
FP per person-month 1.65 2.92
Cost per FP $3,023 $1,170
06/11/2012 Lecture 10: Technical Software Metrics 23
The superiority of Ada over Assmbler is reflected clearly when FP per person-month is taken as the metric of programming efficiency.
The study indicates metrics over the same product coded in Assembler and in Ada.
Coding in Assembler is 60% more productive than coding in Ada (3GL) FALSE
If it is used as a measure of efficiency, again it implies it is more efficient to code in Assembler than in Ada FALSE
Source: Jones, C. Letter to the Editor, IEEE Computer 20 (1987), p.4.

Counting Function Points
Typically the system’s functionality is decomposed into 5 basic elements:
06/11/2012 Lecture 10: Technical Software Metrics 24
Element Description
EI: External Inputs The number of user inputs, i.e., distinct/direct inputs from the user.
EO: External Outputs The number of user outputs; relates with reports, screens, error messages, etc.
EQ: External Inquiries The number of user inquiries; such as online input that generates some result.
ILF: Internal Logic Files The number of logical files used by the system (e.g., database).
EIF: External Interface Files The number of external interfaces, i.e., data files/connections as interface to other systems.
Source: ISO/IEC 20926:2009 Software and systems engineering - Software measurement - IFPUG functional size measurement method

Counting Function Points
The 7 basic steps to count Function Points: 1. Determine the type of count. 2. Identify Counting Scope and Application Boundary. 3. Count Data Functions. 4. Count Transactional Functions. 5. Determine Unadjusted Function Point Count. 6. Determine Value Adjustment Factor. 7. Calculate Adjusted Function Point Count.
06/11/2012 Lecture 10: Technical Software Metrics 25
Source: Parthasarathy, M. A. Practical Software Estimation: Function Point Methods for Insourced and Outsourced Projects. 1st ed. Addison-Wesley Professional, 2007.

Step 1: Type of Count
Identify the type of count that occurs depending on the purpose and the circumstances under which the count is being done.
Development Enhancement Application
Final set of functions the developers provide. Functions to update an existing software (count only
enhancements, i.e., Create, Update, Delete). Functions to use and maintain software.
06/11/2012 Lecture 10: Technical Software Metrics 26
Source: Parthasarathy, M. A. Practical Software Estimation: Function Point Methods for Insourced and Outsourced Projects. 1st ed. Addison-Wesley Professional, 2007.

Step 2: Counting Scope and Application Boundary
The scope of the project encompasses the complete set of functionality being delivered by the application, as expected by the user.
Scope defines the functions that need to be included during the count. The boundary of an application is well within the overall scope of the
application.
06/11/2012 Lecture 10: Technical Software Metrics 27
Source: Parthasarathy, M. A. Practical Software Estimation: Function Point Methods for Insourced and Outsourced Projects. 1st ed. Addison-Wesley Professional, 2007.

Step 3: Count Data Functions
Data Functions - Internal Logical Files (ILFs) e.g. Logical groupings of data in a system, maintained by an
end user, (e.g., Employee file). Data Functions - External Interface Files (EIFs)
It is also related to logical groupings of data, but in this case the user is not responsible for maintaining the data.
The data resides in another system and is maintained by another user (not the end user) or system.
The user of the system being counted requires this data for reference purposes only (e.g., Global state table).
06/11/2012 Lecture 10: Technical Software Metrics 28 Source: ISO/IEC 20926:2009 Software and systems engineering - Software measurement - IFPUG functional size measurement method

Step 4: Count Transaction Functions
Transaction Functions - External Inputs (EI's) Allows a user to maintain Internal Logical Files (ILFs) through the ability
to add, change and delete the data, or passes control to the application. Transaction Functions - External Outputs (EO's)
Give the user the ability to produce outputs (reports). The results displayed are derived using data that is maintained and data
that is referenced. Formatted data is derived from the application with an added value
(e.g. ,calculated/derived totals). Transaction Functions - External Inquiries (EQ's)
A user inputs selection information that is used to retrieve data that meets the specific criteria.
In this situation there is no manipulation of the data. It is a direct retrieval of information contained on the files.
Formatted data is derived from the application without any added value.
06/11/2012 Lecture 10: Technical Software Metrics 29 Source: ISO/IEC 20926:2009 Software and systems engineering - Software measurement - IFPUG functional size measurement method

Step 5: Determine Unadjusted Function Point Count
A complexity rating is given to each data and transaction function based on its type and difficulty.
06/11/2012 Lecture 10: Technical Software Metrics 30
Component Simple Average Complex ILF x 7 x 10 x 15 EIF x 5 x 7 x 10 EI x 3 x 4 x 6 EO x 4 x 5 x 7 EQ x 3 x 4 x 6
It represents the relative implementation effort. For example, from the FPA viewpoint, an average interface to an external file is harder to implement than an average inquiry; hence the weighting for the average EIF is 7 versus 4 for the average EQ.
Source: ISO/IEC 20926:2009 Software and systems engineering - Software measurement - IFPUG functional size measurement method
x 7
x 4

Determine Functional Complexity
Data Element Type (DET) A DET is a unique, user recognizable, non-repeated field. This definition
applies to both analyses of data functions and transactional functions. Record Element Type (RET)
A record element type is a user recognizable subgroup of data elements within an Internal Logical File (ILF) or External Interface File (EIF).
File Type Referenced (FTR) A FTR is a file type referenced by a transaction. An FTR must also be an
Internal Logical File (ILF) or External Interface File (EIF).
06/11/2012 Lecture 10: Technical Software Metrics 31
DET RET 1-19 20-50 51+
1 Simple Simple Average 2 to 5 Simple Average Complex
6 or more Average Complex Complex Source: ISO/IEC 20926:2009 Software and systems engineering - Software measurement - IFPUG functional size measurement method

Step 6: Determine Value Adjustment Factor (1/2)
Additional adjustment based on the sum of 14 General Systems Characteristics (GCS), each of which is rated on a scale of 0 to 5*:
06/11/2012 Lecture 10: Technical Software Metrics 32
GSC Description
Data communications How many communication facilities are there to aid in the transfer
or exchange of information with the application or system?
Distributed data/processing How are distributed data and processing functions handled?
Performance objectives Are response time or throughput performance critical?
Heavily used configuration How heavily used is the current hardware platform where the
application will be executed?
Transaction rate Is the transaction rate high?
Online data entry What percentage of the information is entered online?
End-user efficiency Is the application designed for end-user efficiency?
*0=non important; 5=critical Source: Laird, L.M. and Brennan, M.C.: Software Measurement and Estimation: A Practical Approach Wiley-IEEE Computer Society Pr, 2006.
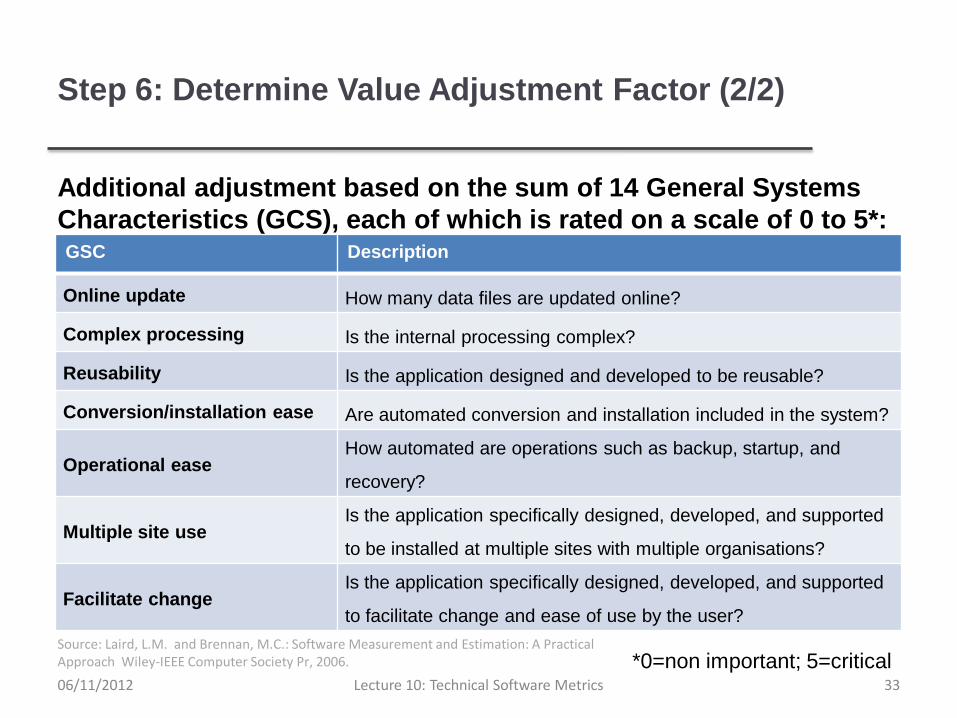
Step 6: Determine Value Adjustment Factor (2/2)
Additional adjustment based on the sum of 14 General Systems Characteristics (GCS), each of which is rated on a scale of 0 to 5*:
06/11/2012 Lecture 10: Technical Software Metrics 33
GSC Description
Online update How many data files are updated online?
Complex processing Is the internal processing complex?
Reusability Is the application designed and developed to be reusable?
Conversion/installation ease Are automated conversion and installation included in the system?
Operational ease How automated are operations such as backup, startup, and
recovery?
Multiple site use Is the application specifically designed, developed, and supported
to be installed at multiple sites with multiple organisations?
Facilitate change Is the application specifically designed, developed, and supported
to facilitate change and ease of use by the user?
*0=non important; 5=critical Source: Laird, L.M. and Brennan, M.C.: Software Measurement and Estimation: A Practical Approach Wiley-IEEE Computer Society Pr, 2006.

Step 7: Calculate Adjusted Function Point Count
The formula for the adjusted function points is: AFP = UFP * (0.65 + 0.01 * VAF)
Thus, the VAF can adjust the FP count by ±35% (if all the GSCs are five or all zero).
06/11/2012 Lecture 10: Technical Software Metrics 34

Counting Function Points example
AFP = UFP * [0.65 + 0.01 * VAF]
AFP = UFP * [0.65 + 0.01 * sum(Fi)]
AFP = 50 * [0.65 + (0.01 * 46)]
AFP = 55.5 (rounded up to 56)
06/11/2012 Lecture 10: Technical Software Metrics 35
Information Weighting Factor Domain Value Count Simple Average Complex External Inputs 3 x 3 4 6 = 9 External Outputs 2 x 4 5 7 = 8 External Inquiries 2 x 3 4 6 = 6 Internal Logical Files 1 x 7 10 15 = 7 External Interface Files 4 x 5 7 10 = 20 Count total 50
Source: Pressman, R.S., Software Engineering: a Practitioner’s Approach, 5th Rev. Ed., McGraw-Hill, 2000.

Another Function Point Analysis example (1/2)
Imagine storing information contained on a music CD using a small program. The music CD contains the following layout: Singer, Group, Producer, Label, Date, and Songs. Naturally, there are multiple songs on each CD. For each song, the name of the song, author, and length of song is included. The program produces two reports: for the CDs and songs.
What is the Adjusted Function Point Count of this program?
06/11/2012 Lecture 10: Technical Software Metrics 36
RET = 2 (CD information & Song information) DET for the CD = 5 (Singer, Group, Producer, Label &
Date) DET for Songs = 3 (Song, Author & Length) Hence, functional complexity is simple.
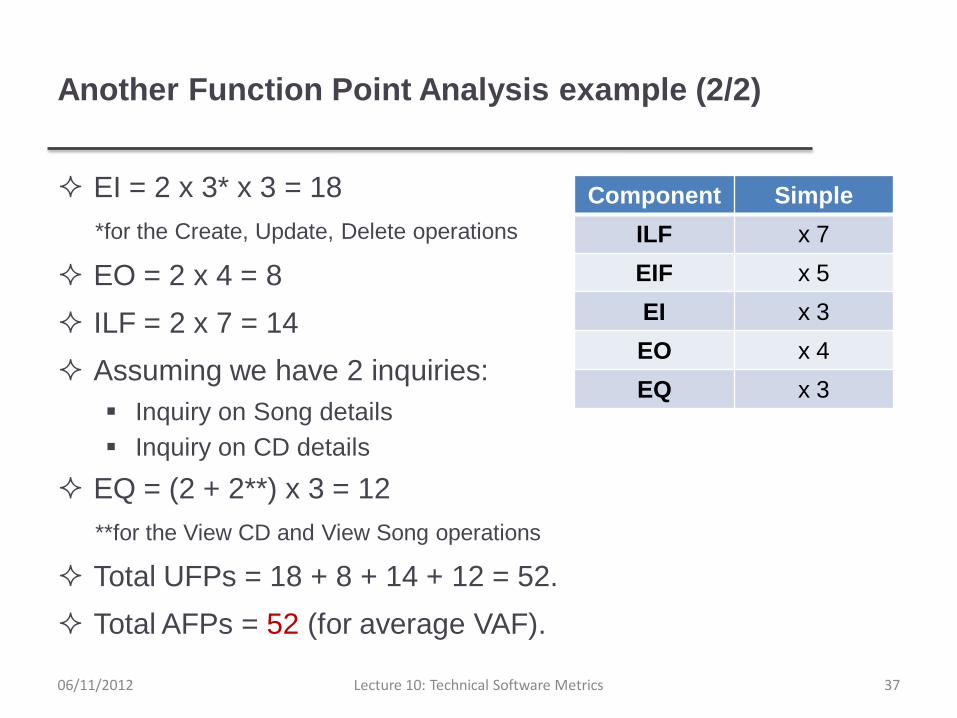
Another Function Point Analysis example (2/2)
EI = 2 x 3* x 3 = 18 *for the Create, Update, Delete operations
EO = 2 x 4 = 8 ILF = 2 x 7 = 14 Assuming we have 2 inquiries:
Inquiry on Song details Inquiry on CD details
EQ = (2 + 2**) x 3 = 12 **for the View CD and View Song operations
Total UFPs = 18 + 8 + 14 + 12 = 52. Total AFPs = 52 (for average VAF).
06/11/2012 Lecture 10: Technical Software Metrics 37
Component Simple ILF x 7 EIF x 5 EI x 3 EO x 4 EQ x 3

FP uses and benefits
Today, at least 40 variants of the original Function Points have been proposed, such as: COSMIC FP MkII FP Object Points Use Case Points ... all of which refer to FP as a base.
Because FP are technology independent, they can be effectively used and reused for sizing a wide variety of software applications.
FP allow for better project schedule evaluation.
Scope creep (increase in scope) during project execution is better measured and trapped using FP as a sizing tool.
Converting FP count into total effort is relatively simple, based on the productivity of the project team and on the technology platform.
06/11/2012 Lecture 10: Technical Software Metrics 38
Source: Parthasarathy, M. A. Practical Software Estimation: Function Point Methods for Insourced and Outsourced Projects. 1st ed. Addison-Wesley Professional, 2007.
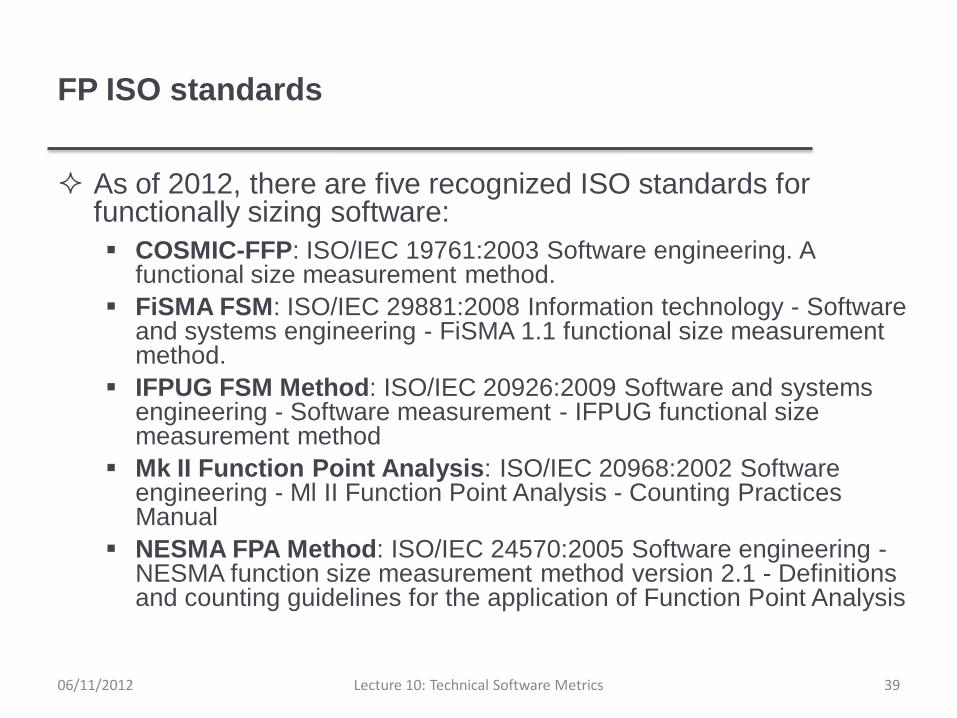
FP ISO standards
As of 2012, there are five recognized ISO standards for functionally sizing software: COSMIC-FFP: ISO/IEC 19761:2003 Software engineering. A
functional size measurement method. FiSMA FSM: ISO/IEC 29881:2008 Information technology - Software
and systems engineering - FiSMA 1.1 functional size measurement method.
IFPUG FSM Method: ISO/IEC 20926:2009 Software and systems engineering - Software measurement - IFPUG functional size measurement method
Mk II Function Point Analysis: ISO/IEC 20968:2002 Software engineering - Ml II Function Point Analysis - Counting Practices Manual
NESMA FPA Method: ISO/IEC 24570:2005 Software engineering - NESMA function size measurement method version 2.1 - Definitions and counting guidelines for the application of Function Point Analysis
06/11/2012 Lecture 10: Technical Software Metrics 39

Complexity metrics
McCabe’s Cyclomatic Complexity A graph theory metric, a software module can be described by a
Control Flow Graph (CFG) where: • Each node corresponds to a block of sequential code. • Each edge corresponds to a path created by a decision. • A region is an area bounded by a set of edges and nodes.
06/11/2012 Lecture 10: Technical Software Metrics 40
1-2+2=1 straight line code
4-4+2=2 if-then-else
3-3+2=2 while-do
Can be counted in two ways: Number of
independent test paths = edges – nodes + 2
Number of independent test paths = regions + 1

Control flow graph notation
A circle in a graph represents a node, which stands for a sequence of one or more procedural statements.
A node containing a simple conditional expression is referred to as a predicate node. Each compound condition in a conditional expression
containing one or more Boolean operators (e.g., and, or) is represented by a separate predicate node
A predicate node has two edges leading out from it (True and False)
An edge, or a link, is a an arrow representing flow of control in a specific direction. An edge must start and terminate at a node. An edge does not intersect or cross over another edge.
06/11/2012 Lecture 10: Technical Software Metrics 41

Complexity metrics example
Compute the McCabe’s Cyclomatic Complexity for the following code:
06/11/2012 Lecture 10: Technical Software Metrics 42
public class test1 { public void methodA(int x, int y, int z) { int other = 0; x = x + 1; y = y + z; if (x < y) other = x / y; else other = x * y; } }
Start
End
Readx , y , z
int other = 0x = x + 1; y = y + z;
x + 1 < y + z
other = (x + 1) * (y + z) other = (x + 1) / (y + z)
False True
6
9
8
1 2 3 4 5 6 7 8 9 10 11 12 13
5
4
11
5-6+2

Control flow graphs
Control Flow Chart
Control Flow Graph
06/11/2012 Lecture 10: Technical Software Metrics 43
1
2
0
3
4
5
6
7 8
9
10 11
1
2
3
4 6
7 8 5
9
10
11
R1 R2
R3
0

Independent program paths
An independent program path is defined as a path through the program from the start node until the end node that introduces at least one new set of processing statements or a new condition (i.e., new nodes).
Must move along at least one edge that has not been traversed before by a previous path.
Basis set for flow graph on previous slide Path 1: 0-1-11 Path 2: 0-1-2-3-4-5-10-1-11 Path 3: 0-1-2-3-6-8-9-10-1-11 Path 4: 0-1-2-3-6-7-9-10-1-11
The number of paths in the basis set is determined by the cyclomatic complexity.
06/11/2012 Lecture 10: Technical Software Metrics 44

The CK object-oriented metrics suite (1/2)
Object-oriented metric
Description
Weighted methods per class (WMC)
This is the number of methods in each class, weighted by the complexity of each method. Therefore, a simple method may have a complexity of 1, and a large and complex method a much higher value. The larger the value for this metric, the more complex the object class. Complex objects are more likely to be difficult to understand. They may not be logically cohesive, so cannot be reused effectively as superclasses in an inheritance tree.
Depth of inheritance tree (DIT)
This represents the number of discrete levels in the inheritance tree where subclasses inherit attributes and operations (methods) from superclasses. It is the maximum length from the node to the root of the tree. The deeper the inheritance tree, the more complex the design. Many object classes may have to be understood to understand the object classes at the leaves of the tree. As DIT grows, it becomes difficult to predict the behavior of a class, but at the same time many methods may be reused.
Number of children (NOC)
This is a measure of the number of immediate subclasses in a class. It measures the breadth of a class hierarchy, whereas DIT measures its depth. A high value for NOC may indicate greater reuse. It may mean that more effort should be made in validating base classes because of the number of subclasses that depend on them. Also, as NOC grows, abstraction is diluted.
45 Lecture 10: Technical Software Metrics 06/11/2012

The CK object-oriented metrics suite (2/2)
Object-oriented metric Description Coupling between object classes (CBO)
Classes are coupled when methods in one class use methods or instance variables defined in a different class. CBO is a measure of how much coupling exists. A high value for CBO means that classes are highly dependent, and therefore it is more likely that changing one class will affect other classes in the program. As CBO increases, the reusability of the class decreases. CBO should be kept as low as possible since it complicates modifications.
Response for a class (RFC)
RFC is a measure of the number of methods that could potentially be executed in response to a message received by an object of that class. Again, RFC is related to complexity. The higher the value for RFC, the more complex a class and hence the more likely it is that it will include errors. As RFC increases testing effort increases.
Lack of cohesion in methods (LCOM)
LCOM is calculated by considering pairs of methods in a class. LCOM is the difference between the number of method pairs without shared attributes and the number of method pairs with shared attributes. The value of this metric has been widely debated and it exists in several variations. It is not clear if it really adds any additional, useful information over and above that provided by other metrics. In case no methods access the same attributes, LCOM is equal to 0. As LCOM increases, coupling between methods (via attributes) increases and thus class complexity increases. 46 Lecture 10: Technical Software Metrics 06/11/2012

Other metrics for Object-Oriented design (1/3)
Size: defined in terms of four views: Population: static count of OO entities, such as classes or
operations. Volume: identical to population measure but taken dynamically at a
given instant in time. Length: measure of a chain of interconnected design elements
(e.g., the depth of an inheritance tree is a measure of length). Functionality: indirect indication of the value delivered to the
customer by an OO application. Complexity
Viewed in terms of structural characteristics by examining how classes are related to one another.
Coupling The physical connections between elements (e.g. the number of
messages passed between objects).
47 Lecture 10: Technical Software Metrics 06/11/2012 Source: Pressman, R.S., Software Engineering: a Practitioner’s Approach, 5th Rev. Ed., McGraw-Hill, 2000.

Other metrics for Object-Oriented design (2/3)
Cohesion The degree to which the OO properties are part of the problem
or design domain. Sufficiency
The degree to which a design component fully reflects all properties of the application object it is modeling.
Completeness Like sufficiency, but the abstraction is considered from multiple
points of view, rather than simply the current application. Cluster Size
The overall size of a class can be determined using the following:
• The total number of operations (both inherited and private instance operations) that are encapsulated within the class.
• The number of attributes (both inherited and private instance attributes) that are encapsulated by the class.
48 Lecture 10: Technical Software Metrics 06/11/2012
Source: Pressman, R.S., Software Engineering: a Practitioner’s Approach, 5th Rev. Ed., McGraw-Hill, 2000.

Other metrics for Object-Oriented design (3/3)
Primitiveness Applied to both operations and classes, the degree to which an
operation is atomic (similar to simplicity), that is, the operation cannot be constructed out of a sequence of other operations contained within a class.
Similarity The degree to which multiple classes are similar in terms of structure,
function, behavior, or purpose.
Volatility A measure of the likelihood that a change in design will occur when
requirements are modified or when modifications occur in other parts if an application, resulting in mandatory adaptation of the design component in question.
49 Lecture 10: Technical Software Metrics 06/11/2012 Source: Pressman, R.S., Software Engineering: a Practitioner’s Approach, 5th Rev. Ed., McGraw-Hill, 2000.

Product metrics challenges
It is impossible to quantify the return on investment of introducing an organizational metrics program.
There are no standards for software metrics or standardized processes for measurement and analysis used by every single organization.
In many companies, software processes are not standardized and are poorly defined and controlled.
Most work on software measurement has focused on code-based metrics and plan-driven development processes. However, more and more software is now developed by configuring ERP systems or COTS.
Introducing measurement adds additional overhead to processes.
06/11/2012 Lecture 10: Technical Software Metrics 50

Measurement surprises
Reducing the number of faults in a program leads to an increased number of help desk calls The program is now thought of as more reliable and so has a
wider more diverse market. The percentage of users who call the help desk may have decreased but the total may increase;
A more reliable system is used in a different way from a system where users work around the faults. This leads to more help desk calls.
51 Lecture 10: Technical Software Metrics 06/11/2012

Key points
“Measure what is measurable, and what is not measurable, make measurable.” (Galileo)
Software measurement can be used to gather data about software and software processes.
Product quality metrics are particularly useful for highlighting anomalous components that may have quality problems.
Metrics can provide insights into structural data and system complexity associated with architectural design.
The process of Function Points Analysis process is one of the most popular estimation method of software size and complexity among software professionals.
Metrics may be used to assess design quality, reusability, complexity and other important views of the product and process. 52 Lecture 10: Technical Software Metrics 06/11/2012

Readings
Chapter 19 & 24, Pressman, R.S., Software Engineering: a Practitioner’s Approach, 5th Rev. Ed., McGraw-Hill, 2000.
Chapter 24, Sommerville, I., Software Engineering, 9th ed., Addison Wesley, 2010.
Chapter 7-9, Fenton, N.E. & Pfleeger, S.L., Software Metrics: A rigorous and practical approach, 1997.
Chapter 6 & 7, H. van Vliet, Software Engineering: Principles and Practice, 3rd rd., John Wiley & Sons, 2008.
06/11/2012 Lecture 10: Technical Software Metrics 53
Credits
Slides adapted from Ian Sommerville Software Engineering, 9/E (http://www.cs.st-andrews.ac.uk/~ifs/Books/SE9/).