Embed Size (px)
Citation preview
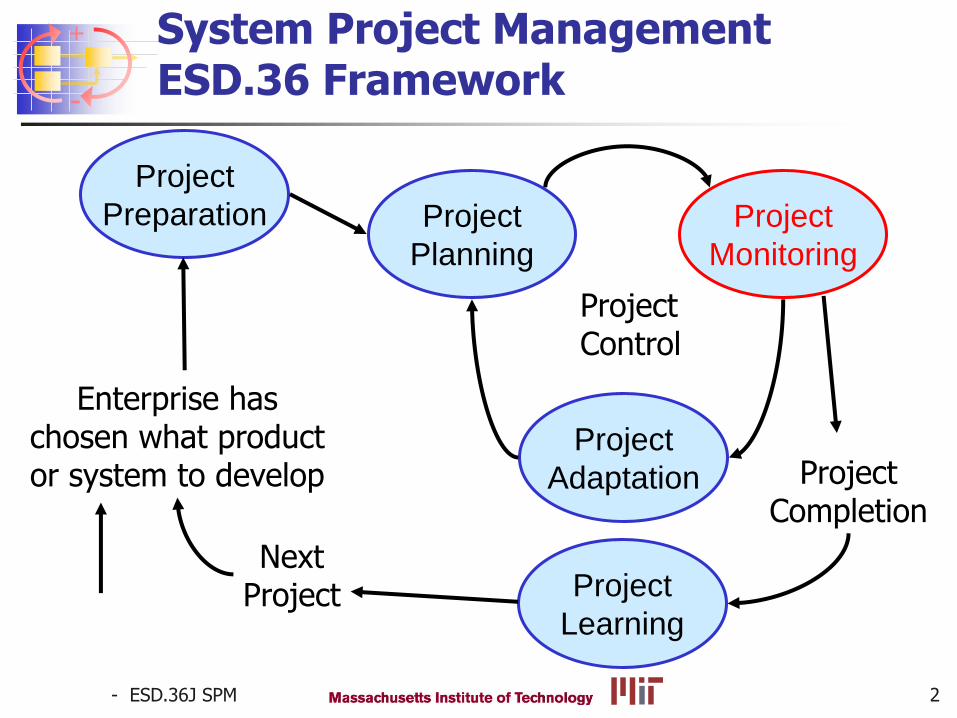
ESD.36 System Project Management
Instructor(s)
+
-
Oct. 11, 2012
L10: Budgeting and Cost Control
Olivier de Weck
Lecture 10
- ESD.36J SPM
+
-
2
System Project Management ESD.36 Framework
Project
Preparation Project
Planning
Project
Adaptation
Project
Monitoring
Enterprise has chosen what product or system to develop
Project
Learning
Project Completion
Next Project
Project Control
- ESD.36J SPM
+
-
3
Outline
Tracking of Resource Consumption and Progress
Creating Measurable Plans
Schedule, Cost Tracking – “easy”
Scope/Progress Tracking – “hard”
Risk Tracking - how? (dedicated lecture to risk management)
Industrial Practice
“Earned Value Management” (EVM)
Role of Metrics in Project Management
Process-related metrics
Product-related metrics

- ESD.36J SPM
+
-
4
Discussion Point
What should we track on projects and why should we track it?
- ESD.36J SPM
+
-
5
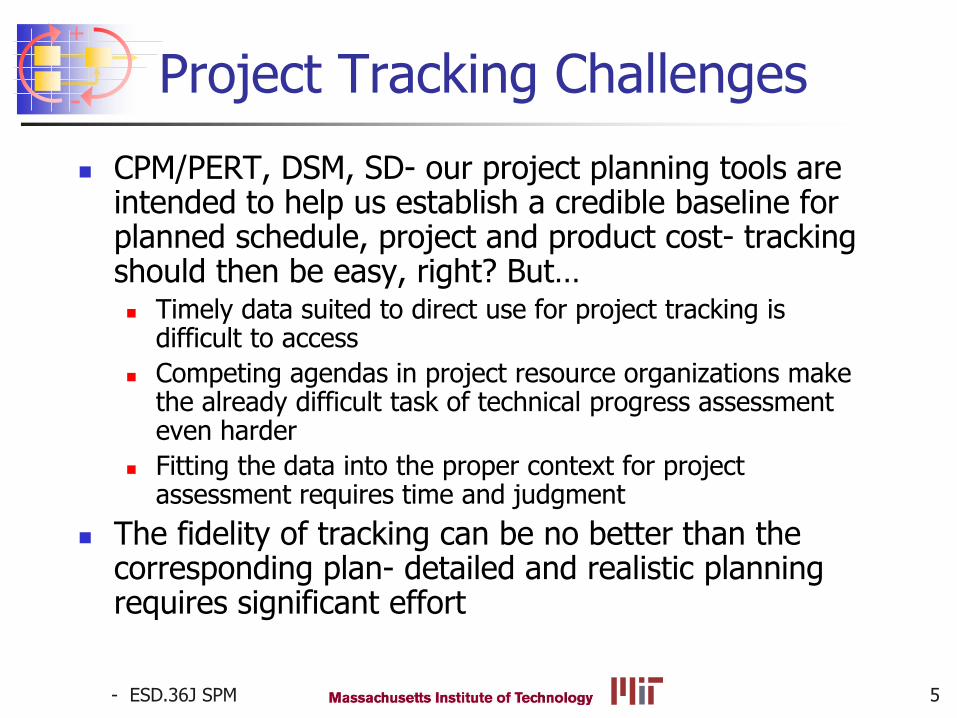
Project Tracking Challenges
CPM/PERT, DSM, SD- our project planning tools are intended to help us establish a credible baseline for planned schedule, project and product cost- tracking should then be easy, right? But… Timely data suited to direct use for project tracking is
difficult to access
Competing agendas in project resource organizations make the already difficult task of technical progress assessment even harder
Fitting the data into the proper context for project assessment requires time and judgment
The fidelity of tracking can be no better than the corresponding plan- detailed and realistic planning requires significant effort

- ESD.36J SPM
+
-
6
Source Notes
Many following examples and methods draw upon DOD/aerospace practices Methods originated in industry
Initial application found to be resource-intensive
DOD applied due to project size and complexity
Commercial practices are converging with defense (movement in both directions) as IT infrastructure enables data acquisition and analyses Practices are coming full circle
Stage-gate processes require tracking metrics
Tailoring for your organization and project is essential
- ESD.36J SPM
+
-
7
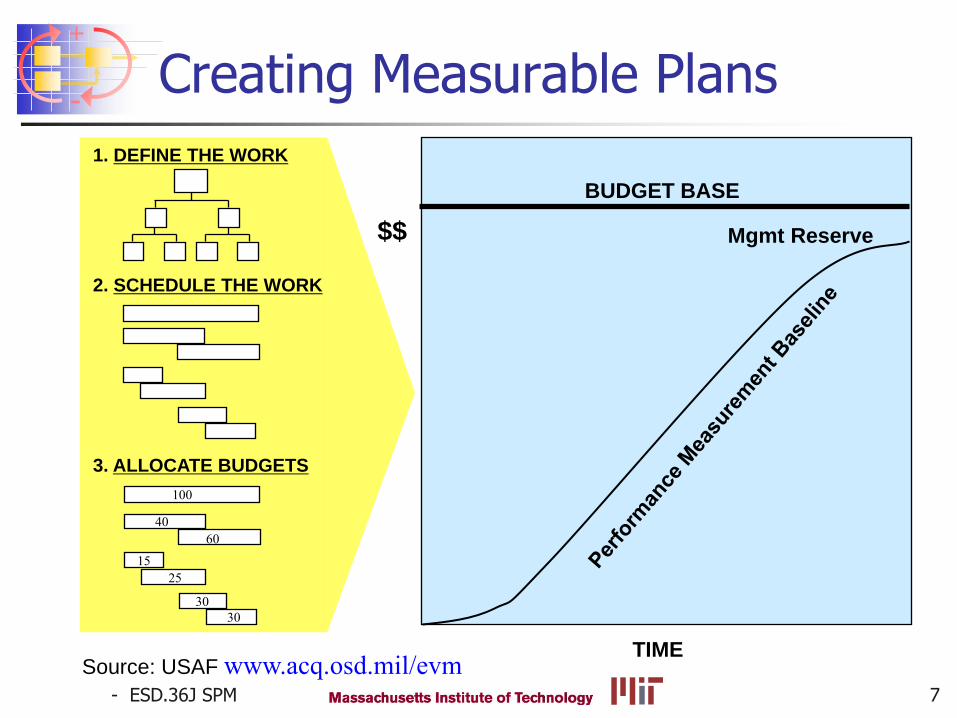
Creating Measurable Plans
1. DEFINE THE WORK
100
40 60
15 25
30 30
2. SCHEDULE THE WORK
3. ALLOCATE BUDGETS
$$
BUDGET BASE
TIME
Mgmt Reserve
Source: USAF www.acq.osd.mil/evm
- ESD.36J SPM
+
-
8
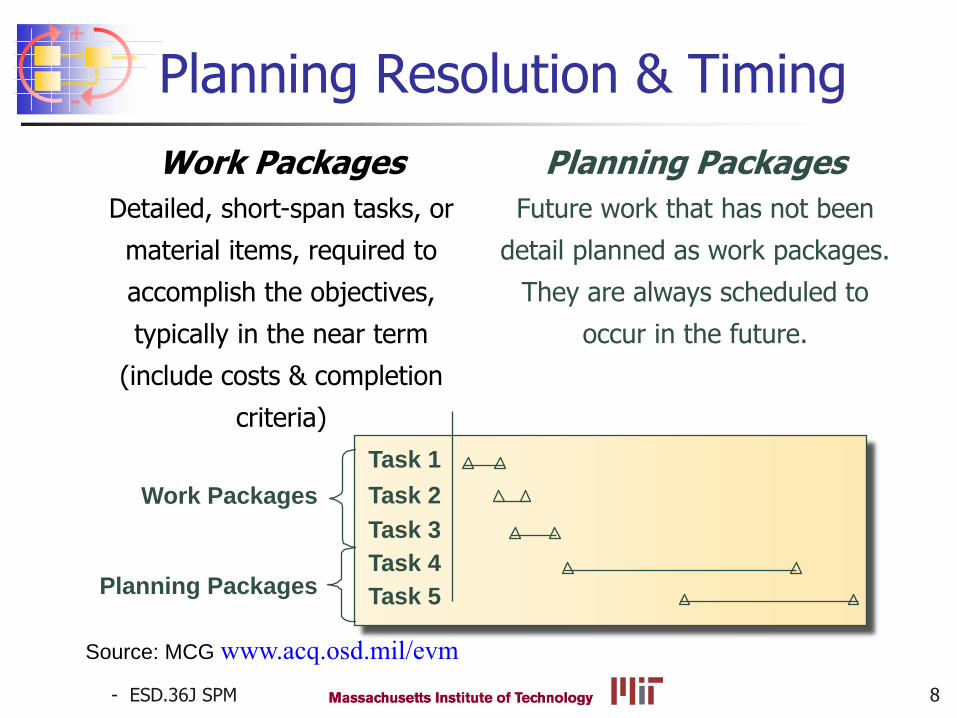
Planning Resolution & Timing
Work Packages
Detailed, short-span tasks, or
material items, required to
accomplish the objectives,
typically in the near term
(include costs & completion
criteria)
Task 1
Task 2
Task 4
Task 5
Task 3
Work Packages
Planning Packages
Planning Packages
Future work that has not been
detail planned as work packages.
They are always scheduled to
occur in the future.
Source: MCG www.acq.osd.mil/evm
- ESD.36J SPM
+
-
Oct 14 2008 9
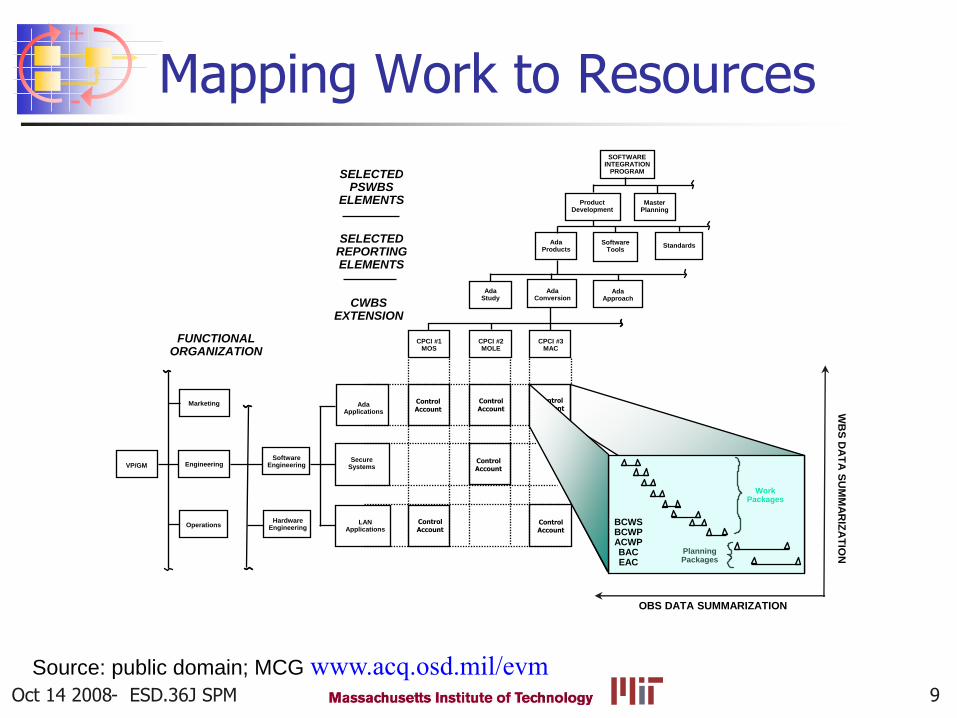
Mapping Work to Resources
Source: public domain; MCG www.acq.osd.mil/evm
OBS DATA SUMMARIZATION
Control Account
Software Engineering
Work Packages
Planning Packages
SOFTWARE INTEGRATION
PROGRAM
Product Development
Master Planning
Ada Products
Software Tools
Standards
CPCI #1 MOS
CPCI #2 MOLE
CPCI #3 MAC
Ada Study
Ada Conversion
Ada Approach
Ada Applications
Secure Systems
LAN Applications
Marketing
BCWS BCWP ACWP BAC EAC
FUNCTIONAL ORGANIZATION
CWBS EXTENSION
SELECTED REPORTING ELEMENTS
SELECTED PSWBS
ELEMENTS
Hardware Engineering
Engineering
Operations
VP/GM
Control Account
Control Account
Control Account
Control Account
Control Account
WB
S D
AT
A S
UM
MA
RIZ
AT
ION
- ESD.36J SPM
+
-
10
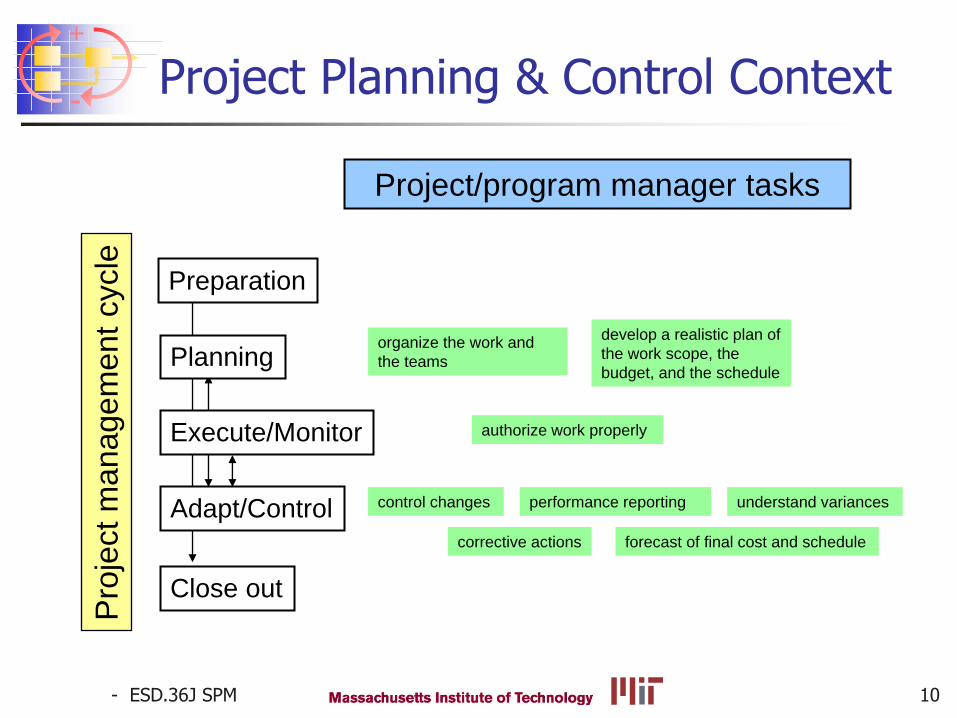
Project Planning & Control Context
Preparation
Close out
Adapt/Control
Execute/Monitor
Pro
ject m
anagem
ent
cycle
Planning develop a realistic plan of
the work scope, the
budget, and the schedule
organize the work and
the teams
Project/program manager tasks
authorize work properly
control changes understand variances
corrective actions forecast of final cost and schedule
performance reporting
- ESD.36J SPM
+
-
11
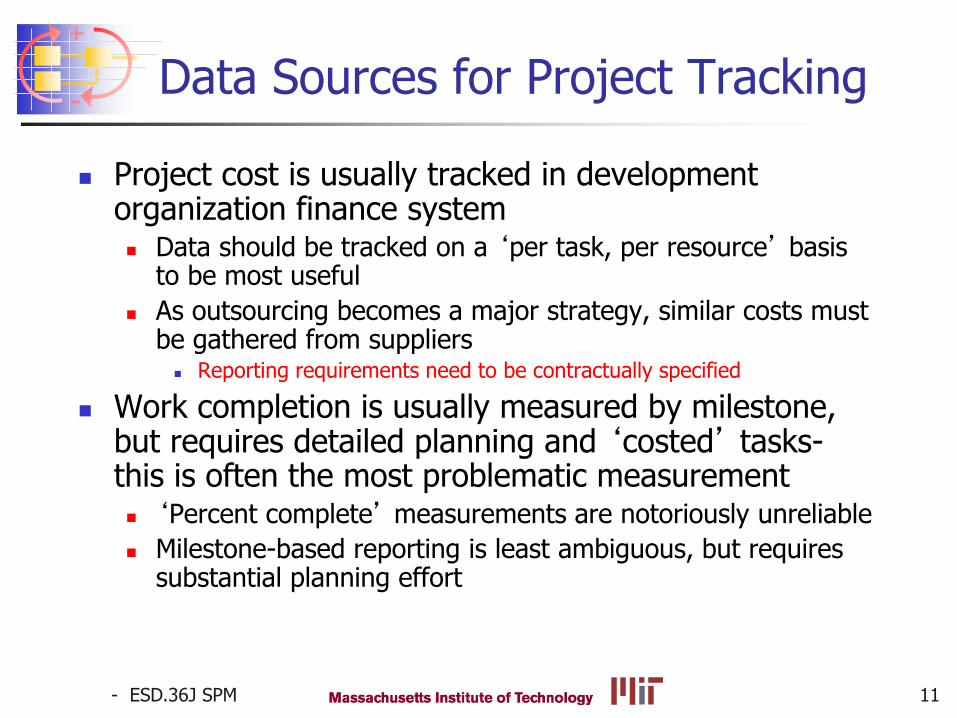
Data Sources for Project Tracking
Project cost is usually tracked in development organization finance system Data should be tracked on a ‘per task, per resource’ basis
to be most useful
As outsourcing becomes a major strategy, similar costs must be gathered from suppliers
Reporting requirements need to be contractually specified
Work completion is usually measured by milestone, but requires detailed planning and ‘costed’ tasks- this is often the most problematic measurement ‘Percent complete’ measurements are notoriously unreliable
Milestone-based reporting is least ambiguous, but requires substantial planning effort
- ESD.36J SPM
+
-
12
Earned Value Management
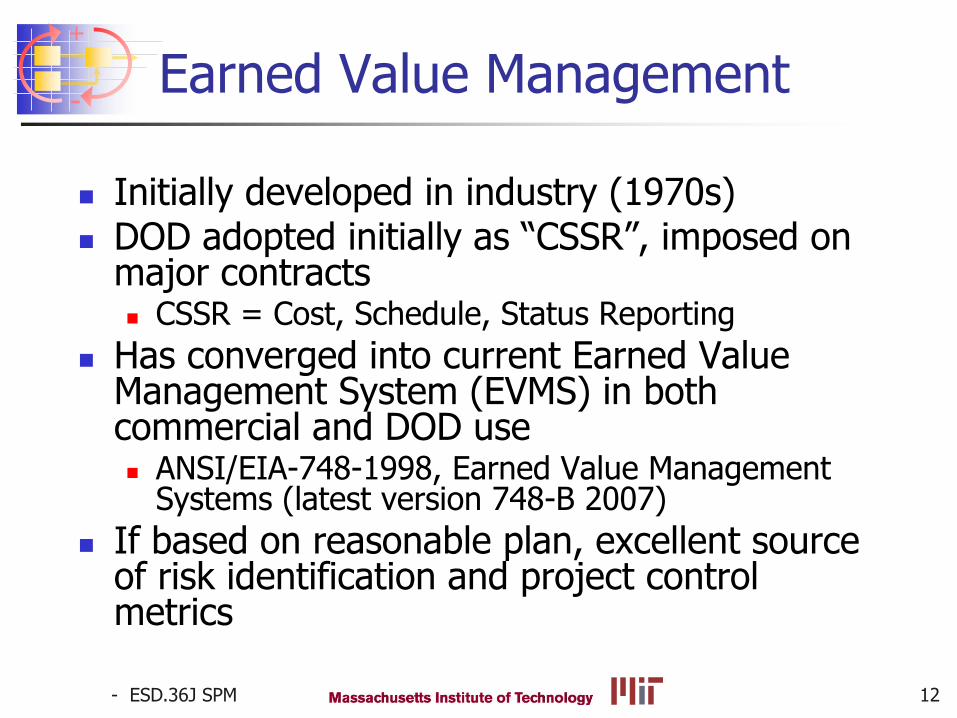
Initially developed in industry (1970s) DOD adopted initially as “CSSR”, imposed on
major contracts CSSR = Cost, Schedule, Status Reporting
Has converged into current Earned Value Management System (EVMS) in both commercial and DOD use ANSI/EIA-748-1998, Earned Value Management
Systems (latest version 748-B 2007)
If based on reasonable plan, excellent source of risk identification and project control metrics
- ESD.36J SPM
+
-
13
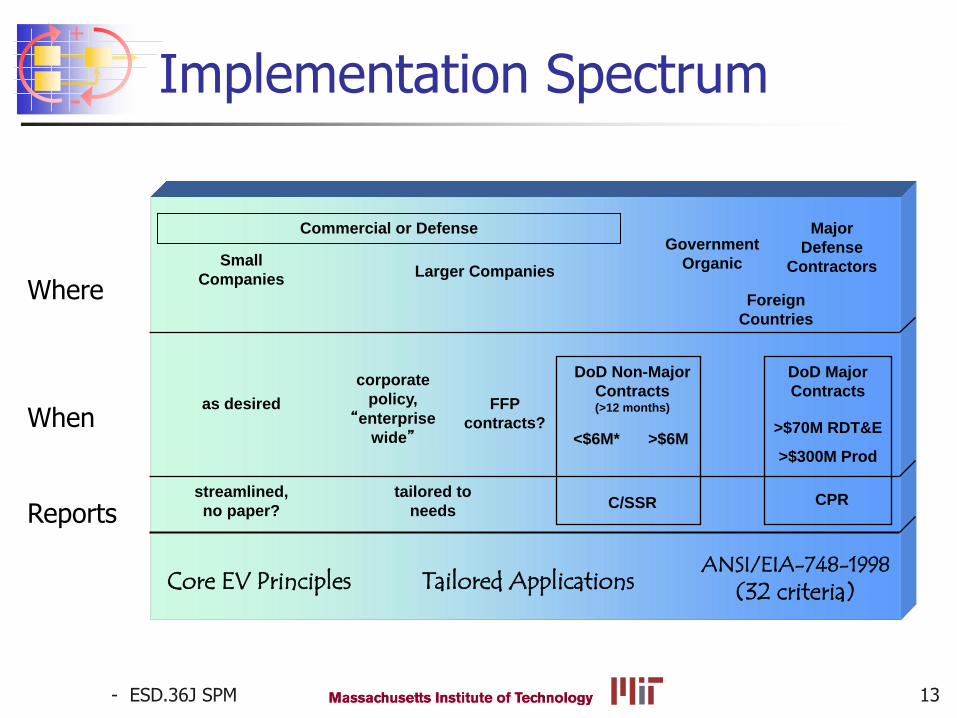
Implementation Spectrum
Core EV Principles ANSI/EIA-748-1998
(32 criteria) Tailored Applications
Small
Companies Larger Companies
Major
Defense
Contractors
as desired
Government
Organic
Foreign
Countries
streamlined,
no paper?
corporate
policy,
“enterprise
wide”
DoD Non-Major
Contracts (>12 months)
<$6M* >$6M
DoD Major
Contracts
>$70M RDT&E
>$300M Prod
tailored to
needs C/SSR CPR
FFP
contracts?
Commercial or Defense
Where When Reports
- ESD.36J SPM
+
-
14
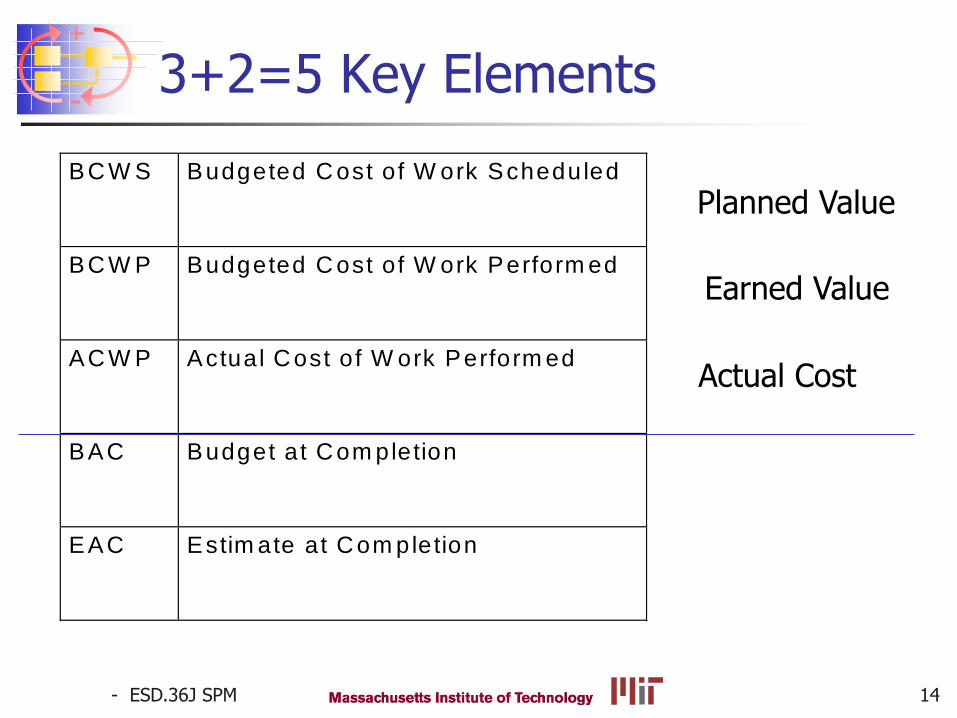
3+2=5 Key Elements
BC W S Budgeted C ost of W ork Scheduled
BC W P Budgeted C ost of W ork Perform ed
AC W P Actual C ost of W ork Perform ed
BAC Budget at C om pletion
EAC Estim ate at C om pletion
Planned Value
Actual Cost
Earned Value
- ESD.36J SPM
+
-
15
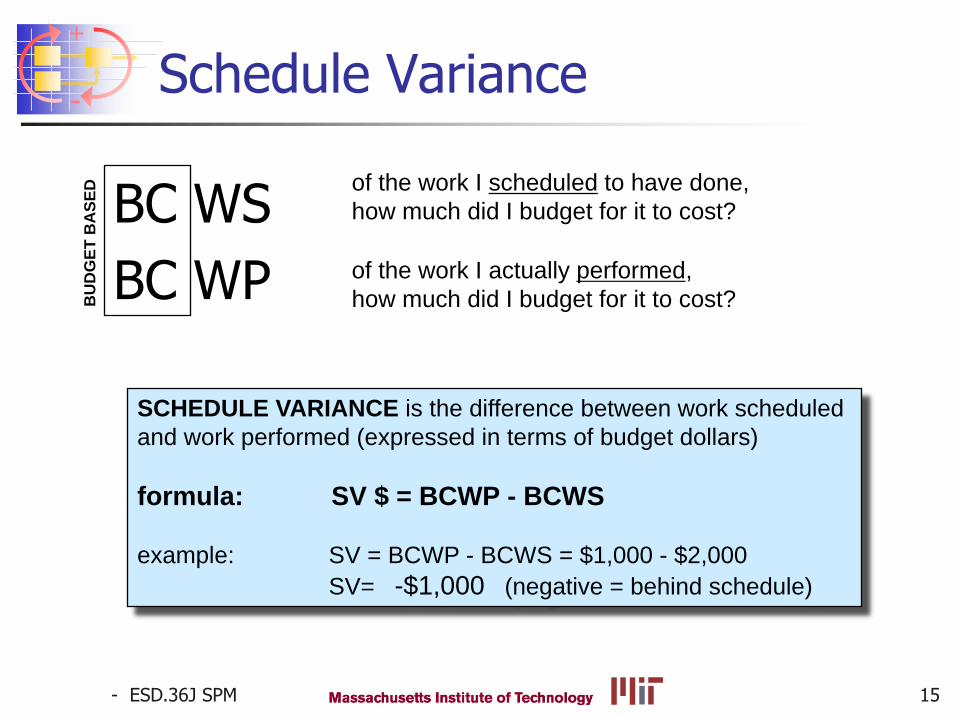
Schedule Variance
BC WS
BC WP
of the work I scheduled to have done,
how much did I budget for it to cost?
of the work I actually performed,
how much did I budget for it to cost?
SCHEDULE VARIANCE is the difference between work scheduled
and work performed (expressed in terms of budget dollars)
formula: SV $ = BCWP - BCWS
example: SV = BCWP - BCWS = $1,000 - $2,000
SV= -$1,000 (negative = behind schedule)
BU
DG
ET
BA
SE
D
- ESD.36J SPM
+
-
16
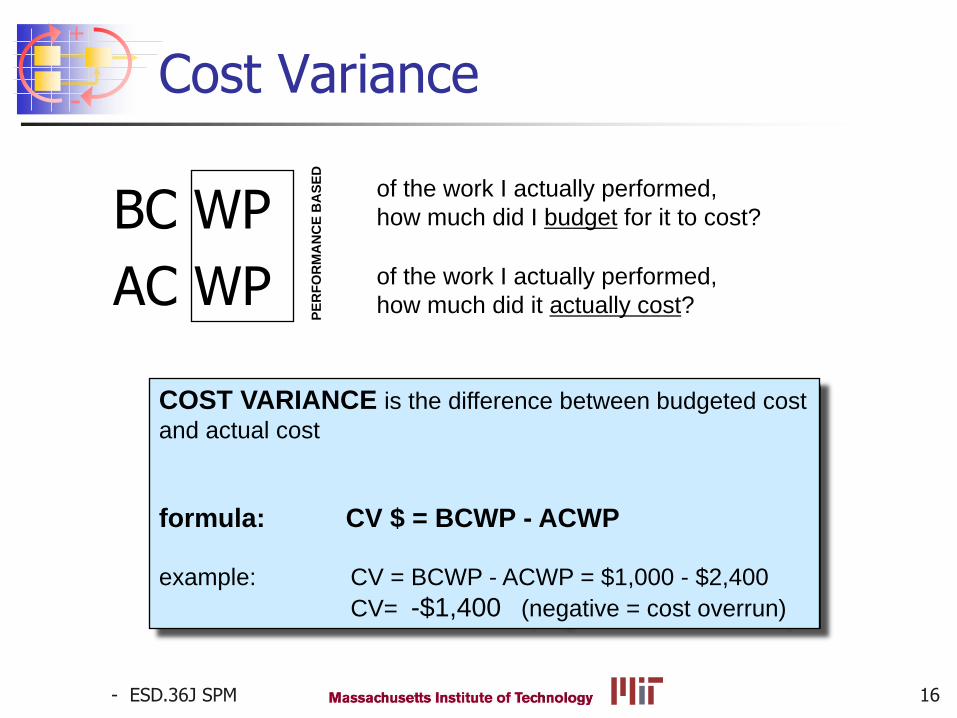
Cost Variance
BC WP
AC WP
of the work I actually performed,
how much did I budget for it to cost?
of the work I actually performed,
how much did it actually cost?
COST VARIANCE is the difference between budgeted cost
and actual cost
formula: CV $ = BCWP - ACWP
example: CV = BCWP - ACWP = $1,000 - $2,400
CV= -$1,400 (negative = cost overrun)
PE
RF
OR
MA
NC
E B
AS
ED
- ESD.36J SPM
+
-
17
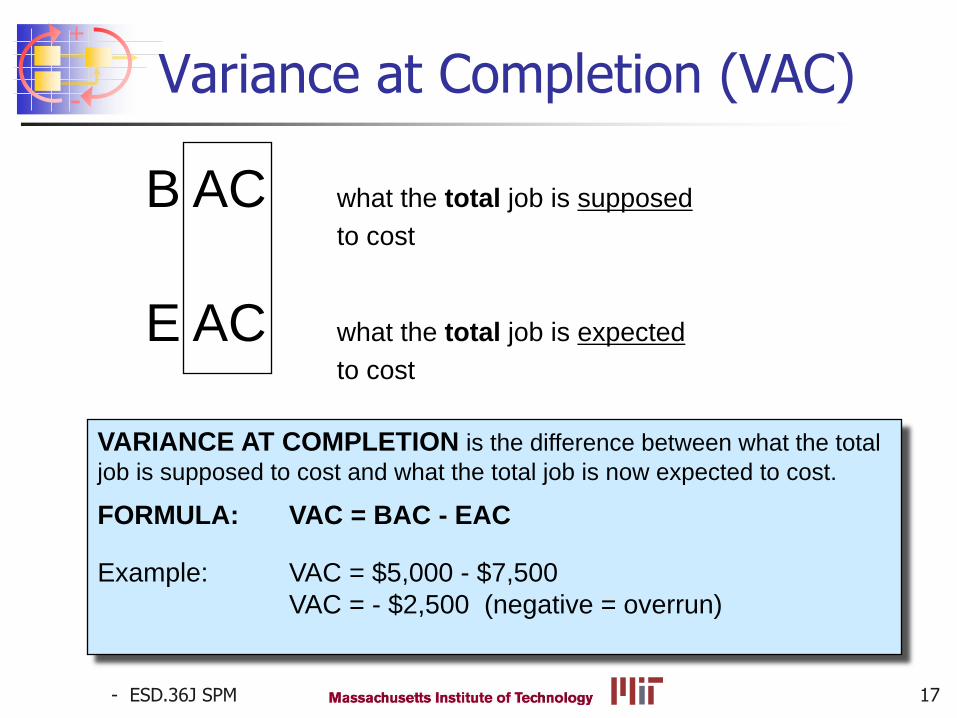
Variance at Completion (VAC)
B AC what the total job is supposed
to cost
E AC what the total job is expected
to cost
VARIANCE AT COMPLETION is the difference between what the total
job is supposed to cost and what the total job is now expected to cost.
FORMULA: VAC = BAC - EAC
Example: VAC = $5,000 - $7,500
VAC = - $2,500 (negative = overrun)
- ESD.36J SPM
+
-
18
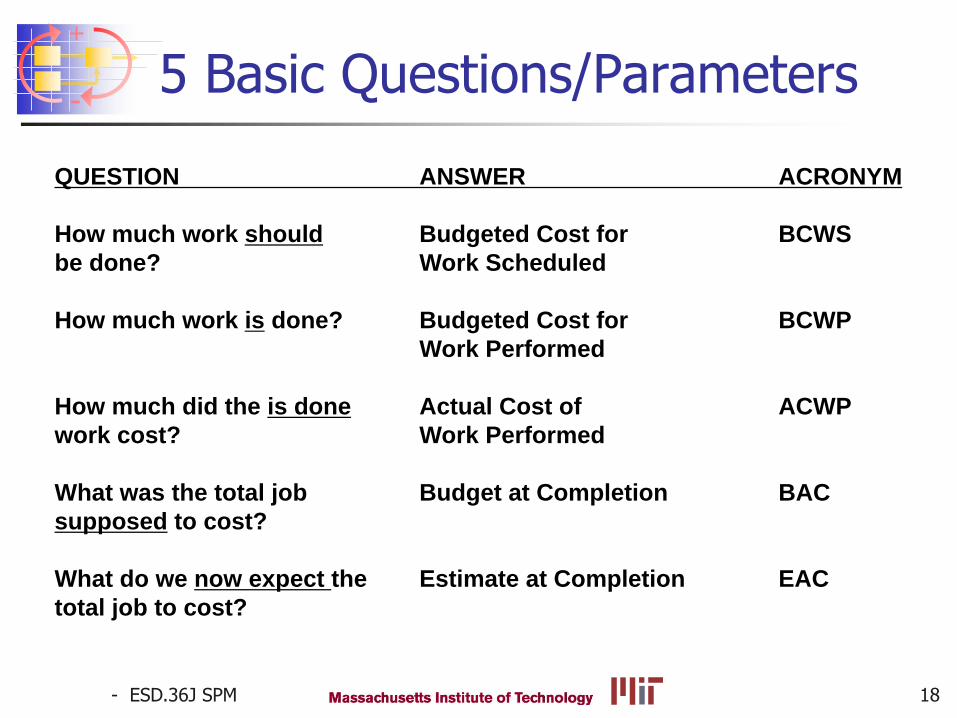
5 Basic Questions/Parameters
QUESTION ANSWER ACRONYM
How much work should Budgeted Cost for BCWS
be done? Work Scheduled
How much work is done? Budgeted Cost for BCWP
Work Performed
How much did the is done Actual Cost of ACWP
work cost? Work Performed
What was the total job Budget at Completion BAC
supposed to cost?
What do we now expect the Estimate at Completion EAC
total job to cost?

- ESD.36J SPM
+
-
19
Concept Question 1
Which of these 5 quantities is most difficult to track? (and why?)
BCWS
BCWP
ACWP
BAC
EAC
- ESD.36J SPM
+
-
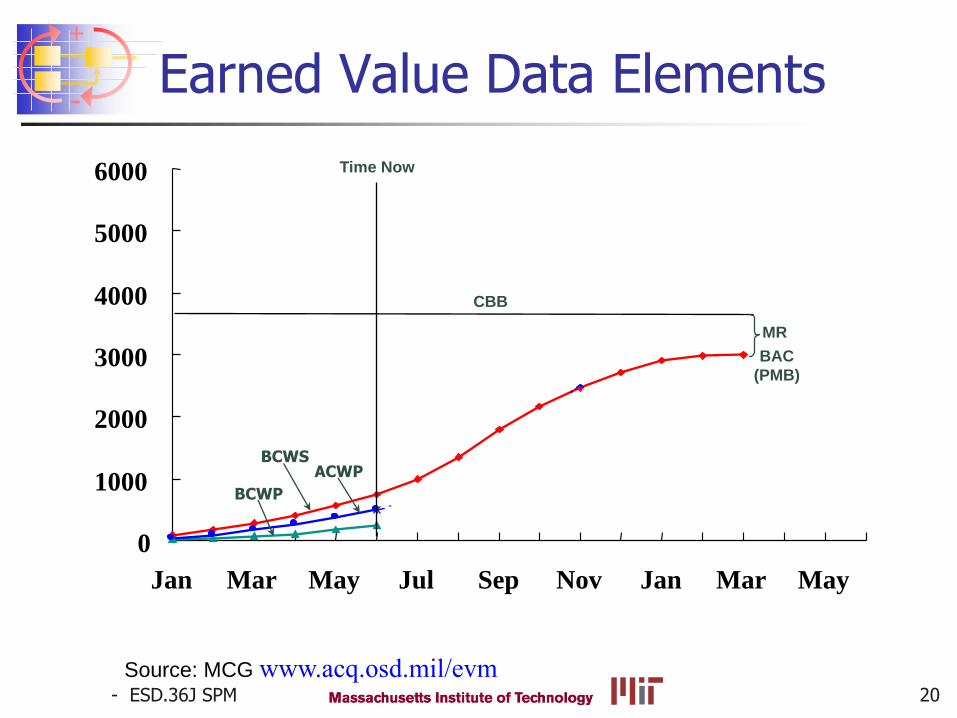
20
Earned Value Data Elements
0
1000
2000
3000
4000
5000
6000
Jan Mar May Jul Sep Nov Jan Mar May
ACWP
BCWP
BCWS
Source: MCG www.acq.osd.mil/evm
Time Now
BAC
(PMB)
CBB
MR
- ESD.36J SPM
+
-
21
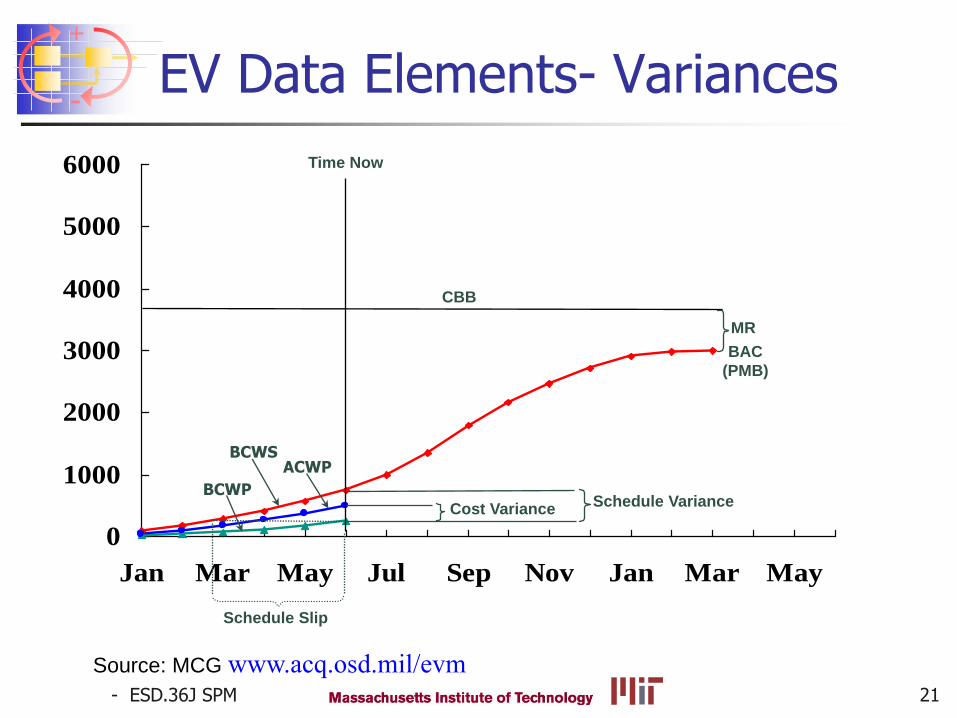
EV Data Elements- Variances
0
1000
2000
3000
4000
5000
6000
Jan Mar May Jul Sep Nov Jan Mar May
Time Now
BAC
(PMB)
CBB
MR
ACWP
BCWP
BCWS
Schedule Slip
Cost Variance Schedule Variance
Source: MCG www.acq.osd.mil/evm
- ESD.36J SPM
+
-
22
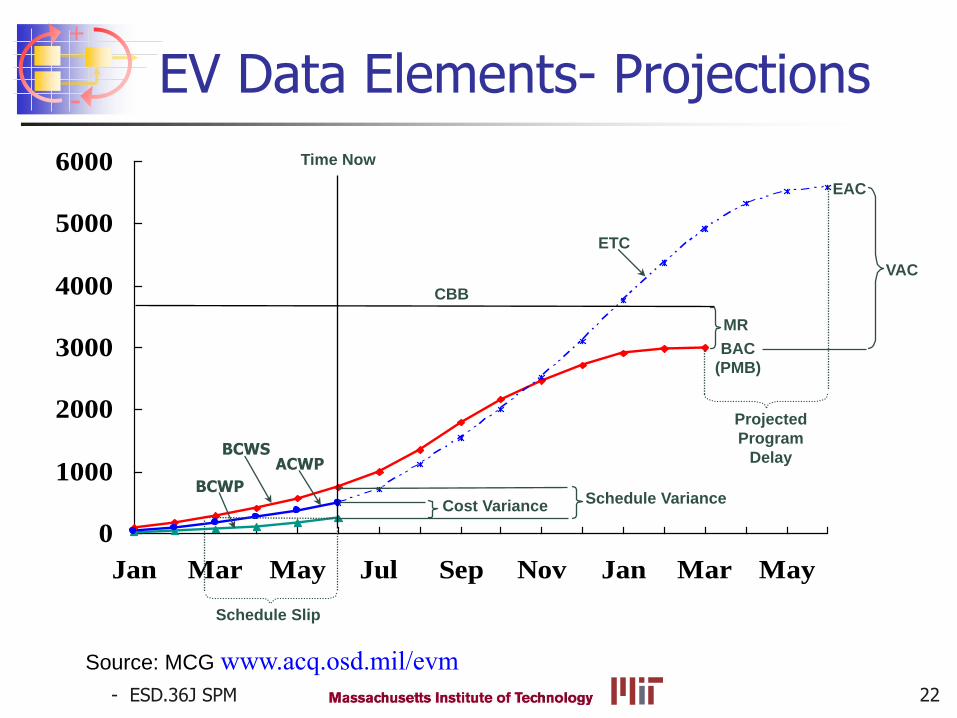
EV Data Elements- Projections
0
1000
2000
3000
4000
5000
6000
Jan Mar May Jul Sep Nov Jan Mar May
Time Now
Projected
Program
Delay
VAC
EAC
BAC
(PMB)
CBB
MR
ACWP
BCWP
BCWS
ETC
Schedule Slip
Cost Variance Schedule Variance
Source: MCG www.acq.osd.mil/evm
- ESD.36J SPM
+
-
23
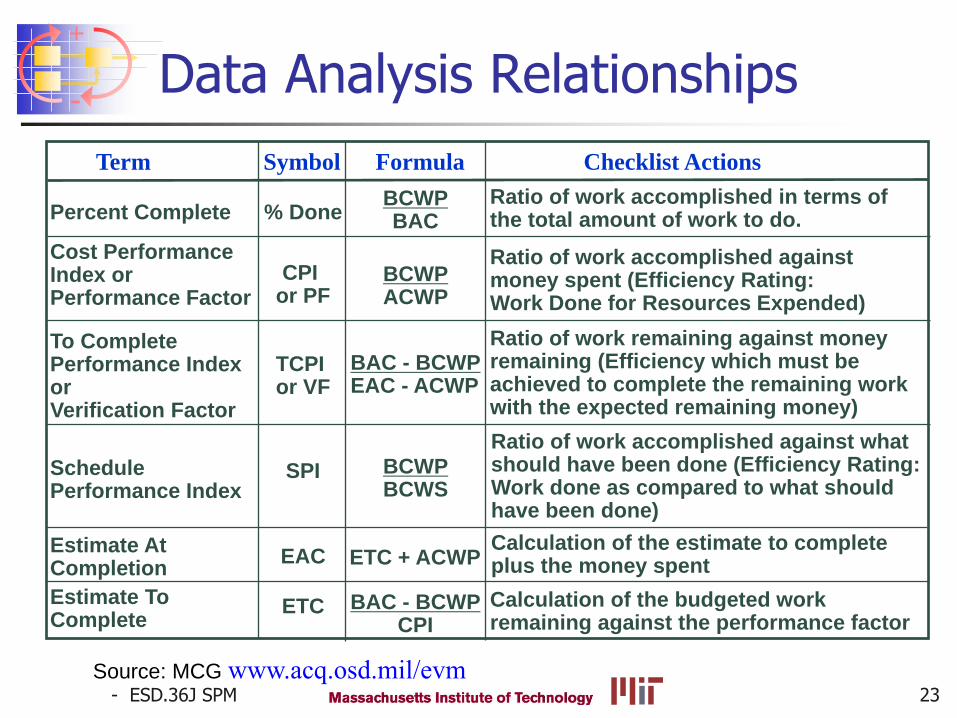
Data Analysis Relationships
Term Formula
Percent Complete
Cost Performance Index or Performance Factor
Checklist Actions
Ratio of work accomplished in terms of the total amount of work to do.
Symbol
% Done
CPI or PF
TCPI or VF
BCWP BAC
Estimate To Complete
BCWP ACWP
Ratio of work accomplished against money spent (Efficiency Rating: Work Done for Resources Expended)
To Complete Performance Index or Verification Factor
BAC - BCWP EAC - ACWP
Ratio of work remaining against money remaining (Efficiency which must be achieved to complete the remaining work with the expected remaining money)
Schedule Performance Index
SPI
Ratio of work accomplished against what should have been done (Efficiency Rating: Work done as compared to what should have been done)
BCWP BCWS
EAC Estimate At Completion
Calculation of the budgeted work remaining against the performance factor
Source: MCG www.acq.osd.mil/evm
ETC BAC - BCWP CPI
ETC + ACWP Calculation of the estimate to complete plus the money spent
- ESD.36J SPM
+
-
24
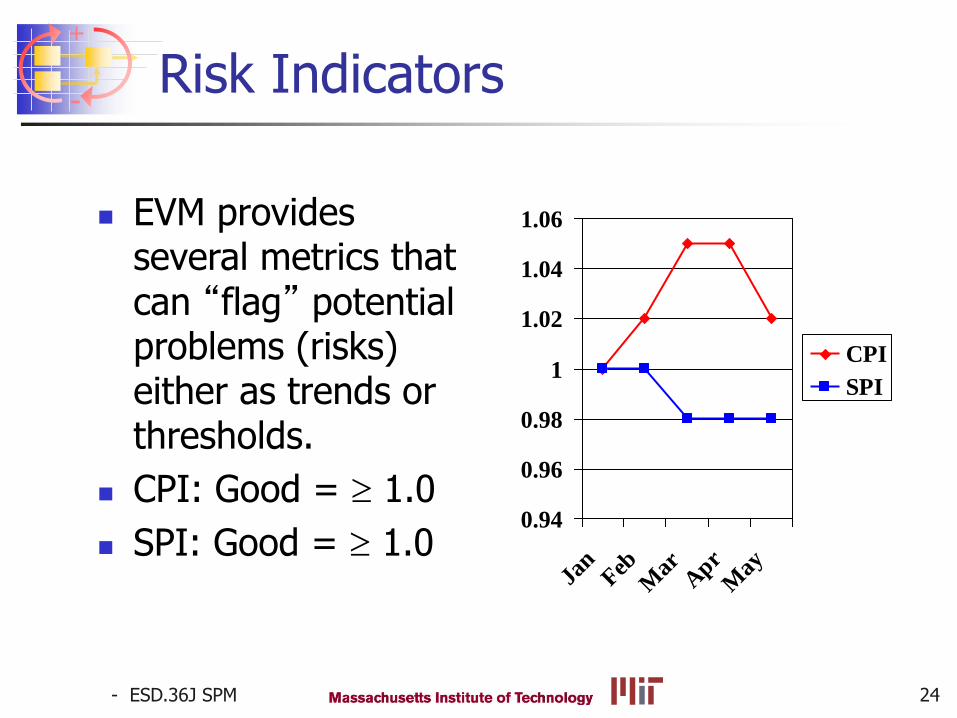
Risk Indicators
EVM provides several metrics that can “flag” potential problems (risks) either as trends or thresholds.
CPI: Good = 1.0
SPI: Good = 1.0 0.94
0.96
0.98
1
1.02
1.04
1.06
Jan
FebM
arA
prM
ay
CPI
SPI
- ESD.36J SPM
+
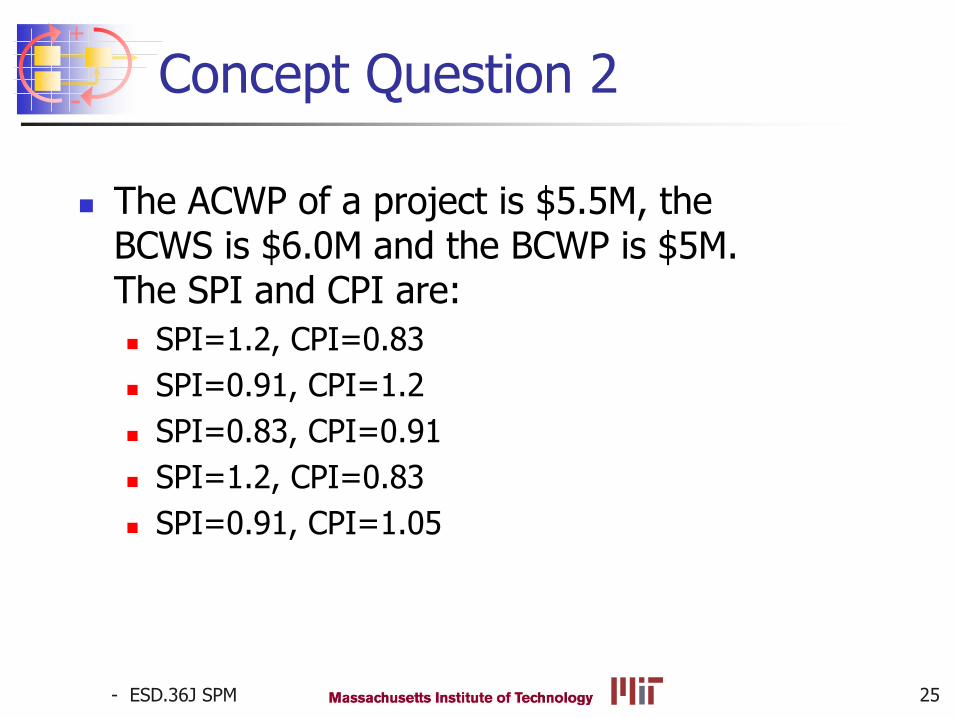
- Concept Question 2
The ACWP of a project is $5.5M, the BCWS is $6.0M and the BCWP is $5M. The SPI and CPI are:
SPI=1.2, CPI=0.83
SPI=0.91, CPI=1.2
SPI=0.83, CPI=0.91
SPI=1.2, CPI=0.83
SPI=0.91, CPI=1.05
25
- ESD.36J SPM
+
-
26
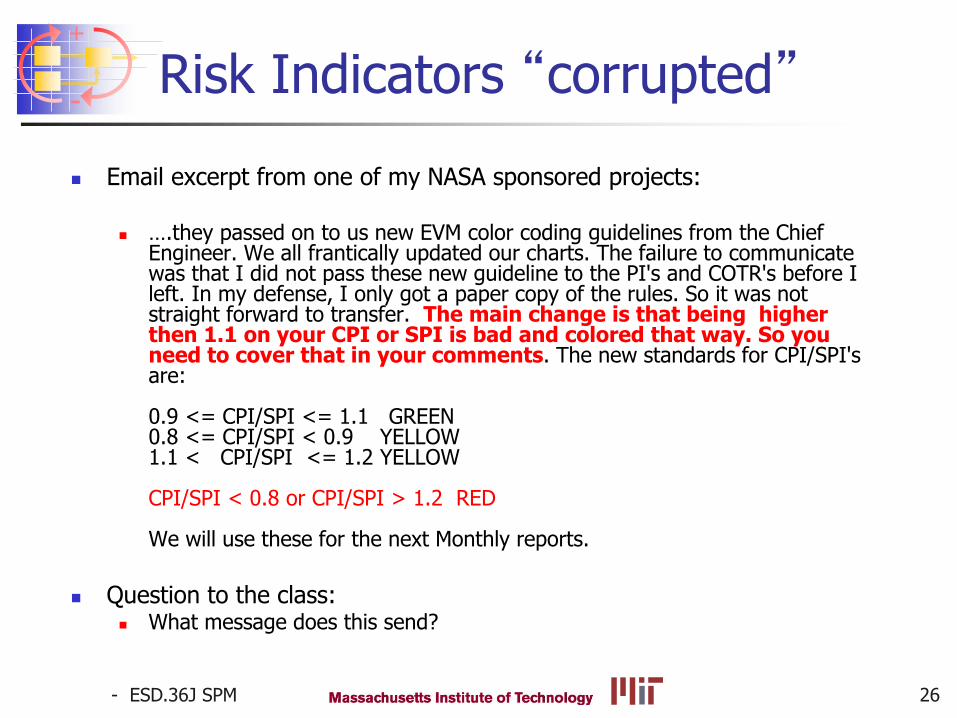
Risk Indicators “corrupted”
Email excerpt from one of my NASA sponsored projects: ….they passed on to us new EVM color coding guidelines from the Chief
Engineer. We all frantically updated our charts. The failure to communicate was that I did not pass these new guideline to the PI's and COTR's before I left. In my defense, I only got a paper copy of the rules. So it was not straight forward to transfer. The main change is that being higher then 1.1 on your CPI or SPI is bad and colored that way. So you need to cover that in your comments. The new standards for CPI/SPI's are: 0.9 <= CPI/SPI <= 1.1 GREEN 0.8 <= CPI/SPI < 0.9 YELLOW 1.1 < CPI/SPI <= 1.2 YELLOW CPI/SPI < 0.8 or CPI/SPI > 1.2 RED We will use these for the next Monthly reports.
Question to the class:
What message does this send?
- ESD.36J SPM
+
-
27
Planning ‘Granularity’
To use EVMS with a reasonable amount of management resources, plan at the appropriate level of detail
Avoid ‘% complete’ estimation
Plan work packages with short duration, estimated package cost, and clear deliverable
Assign ‘earned value’ at discrete levels, e.g.:
Zero value until work package start
50% value while executing
Full value when deliverable is complete
- ESD.36J SPM
+
-
28
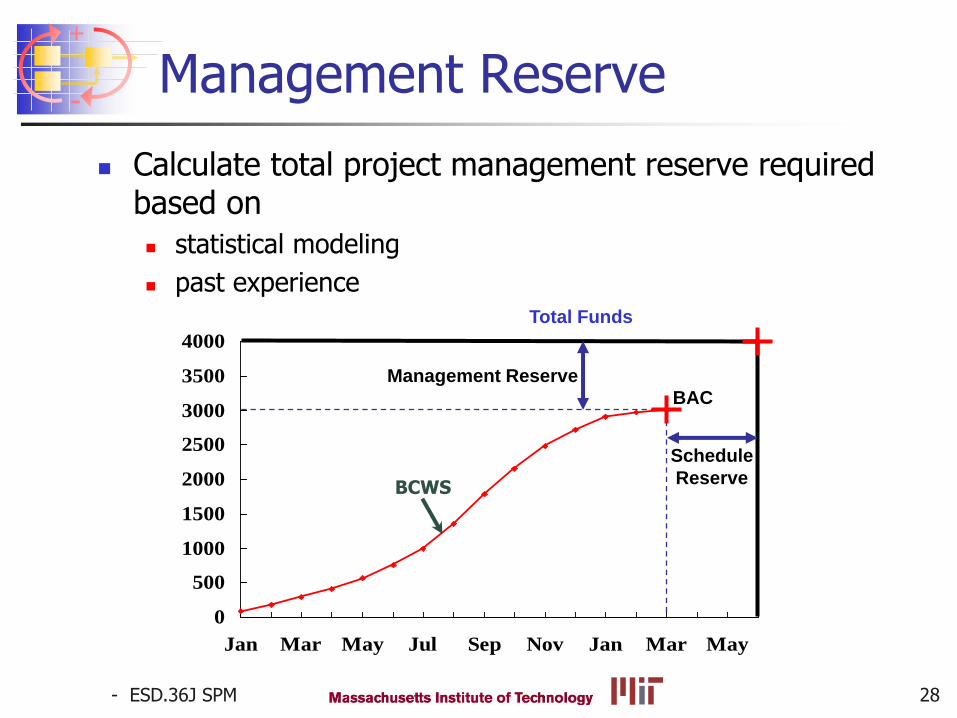
Management Reserve
Calculate total project management reserve required based on
statistical modeling
past experience
0
500
1000
1500
2000
2500
3000
3500
4000
Jan Mar May Jul Sep Nov Jan Mar May
BCWS
Management Reserve
Schedule
Reserve
BAC
Total Funds
- ESD.36J SPM
+
-
29
Project Control & Leverage
Management reserve (cost and schedule) are important project management tools Amounts based on statistical analyses, past
experiences typically in the 10-30% range
Reserves should be planned and validated with the overall project plan
The project manager owns management reserve and unallocated budget/schedule Release of Management Reserve should be part of
a formal, risk-driven process
Requests for reserve allocation should follow a quantitative template
- ESD.36J SPM
+
-
30
* cost can include liens on resources in addition to $
Formulation of Project Metrics
May be marginal, absolute, probabilistic
= X% improvement in ________
= X value of _______
= X value of _______ with 90% confidence
Tradition is metric based on benefit/performance (with cost*, schedule and risk assessed later)
Current practice is metric based on benefit/performance and cost
“Ideal” would be metrics which include benefit/performance, schedule, cost and risk
- ESD.36J SPM
+
-
31
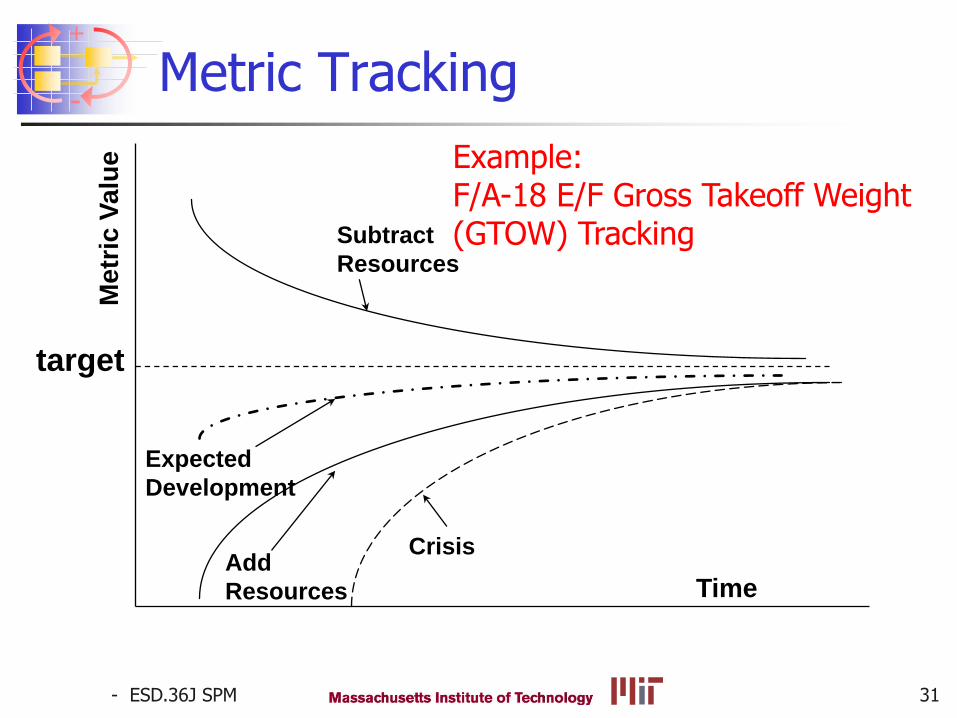
Metric Tracking
target
Subtract
Resources
Expected
Development
Add
Resources
Crisis
Metr
ic V
alu
e
Time
Example: F/A-18 E/F Gross Takeoff Weight (GTOW) Tracking
- ESD.36J SPM
+
-
32
Problems with Metrics
Identifying real and appropriate metrics is often one of the most difficult parts of engineering system design and projects
customer often does not vocalize real metric
often have several metrics (must treat independently or combine)
Metrics don’t necessarily add linearly
mass does, cost doesn’t (can push cost to another element easily)
hard to flow metrics down
- ESD.36J SPM
+
-
Earned Value Management ‘GOLD CARD’
Please see https://acc.dau.mil/gc
Oct 14 2008 33
- ESD.36J SPM
+
-
34
Summary
Budgeting and Cost Control Need to monitor Schedule, Cost, Technical
Progress vs Budget
Risk Identification and Tracking is crucial, but challenging (next week)
Formalized methods exist, e.g. EVM, but need to adapt to needs of particular projects Large government project >$1B class
commercial product development $10M-100M class
small entrepreneurial firm <$10M
MIT OpenCourseWarehttp://ocw.mit.edu
ESD.36 System Project ManagementFall 2012
For inforation about citing these materials or our Terms of Use, visit: http://ocw.mit.edu/terms.