Embed Size (px)
DESCRIPTION
esf
Citation preview
Introduc)on to the Science of Living Organisms Biology 11
• If you missed Wednesday’s first class you can find slides and the syllabus on bcourses: h"ps://bcourses.berkeley.edu/courses/1195924
• There are some example exam ques)ons posted at the end of the slides
Overview
• What defines living organisms?
• What is the chemical basis of life?

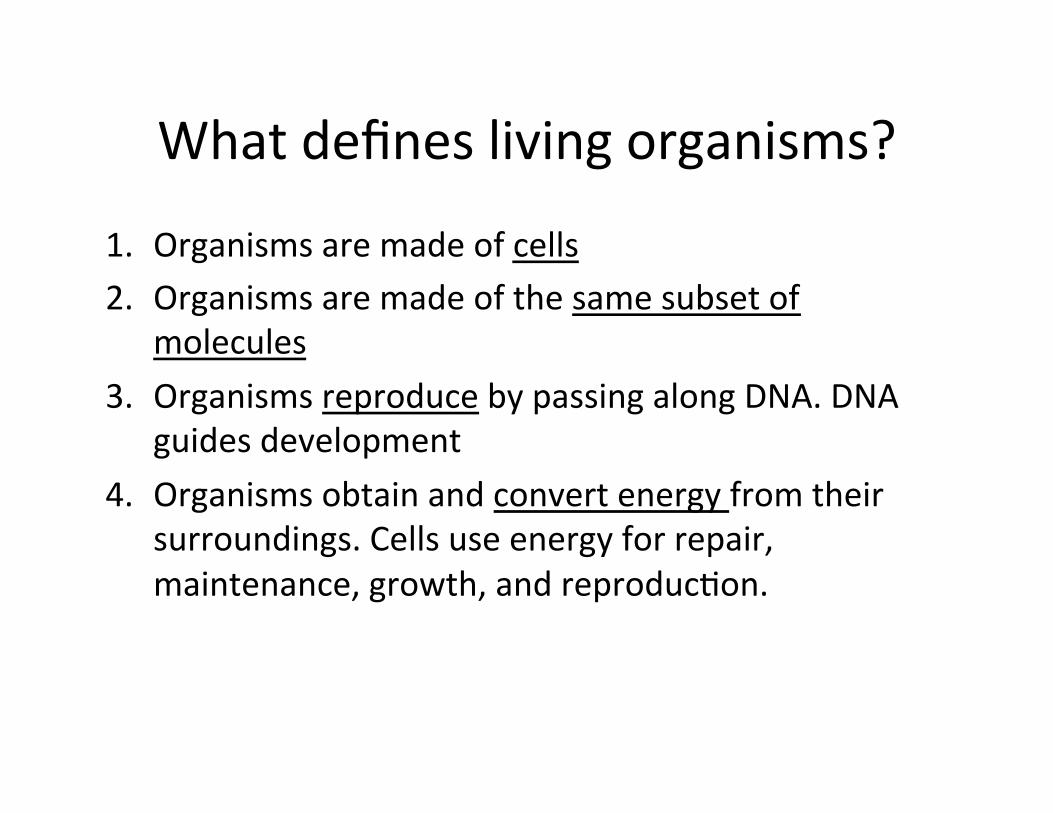
What defines living organisms?
1. Organisms are made of cells 2. Organisms are made of the same subset of molecules: – Proteins – Carbohydrates – Lipids – Nucleic acids

What defines living organisms?
1. Organisms are made of cells 2. Organisms are made of the same subset of
molecules 3. Organisms reproduce by passing along DNA. DNA
guides development – DNA – deoxyribonucleic acid -‐ is the signature molecule of life
and inheritance.
What defines living organisms?
1. Organisms are made of cells 2. Organisms are made of the same subset of
molecules 3. Organisms reproduce by passing along DNA. DNA
guides development 4. Organisms obtain and convert energy from their
surroundings. Cells use energy for repair, maintenance, growth, and reproduc)on.
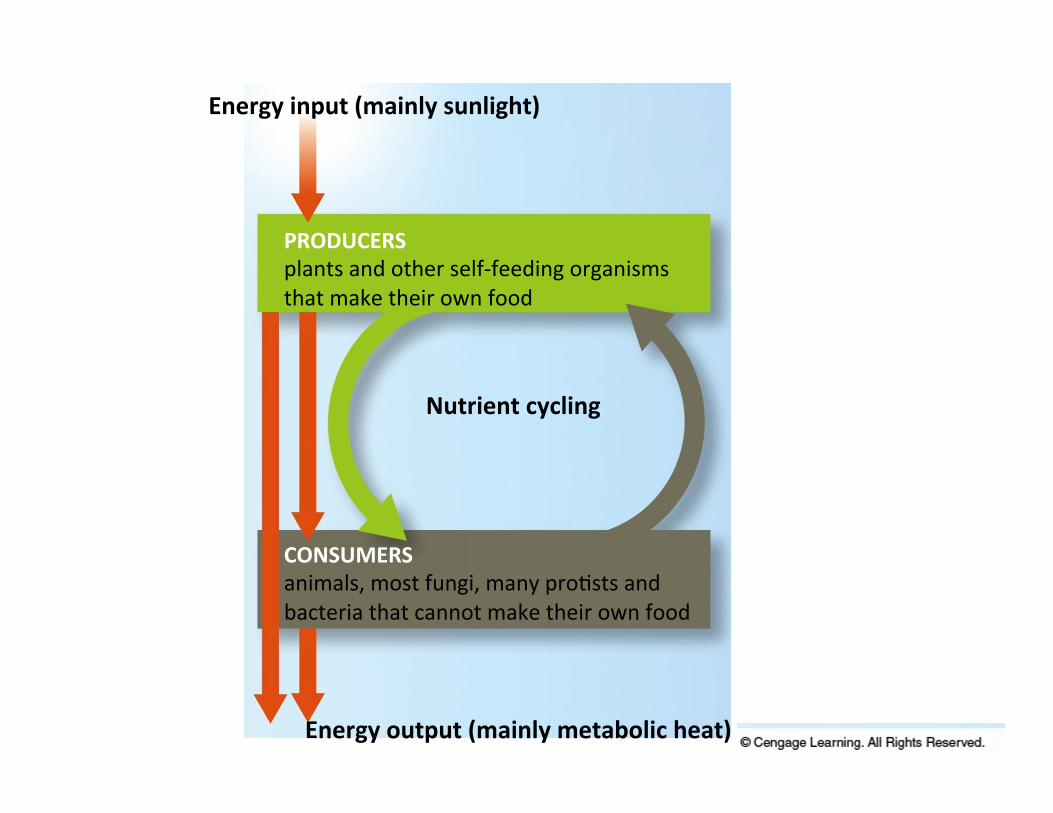
Energy input (mainly sunlight)
PRODUCERS plants and other self-‐feeding organisms that make their own food
CONSUMERS animals, most fungi, many pro)sts and bacteria that cannot make their own food
Energy output (mainly metabolic heat)
Nutrient cycling
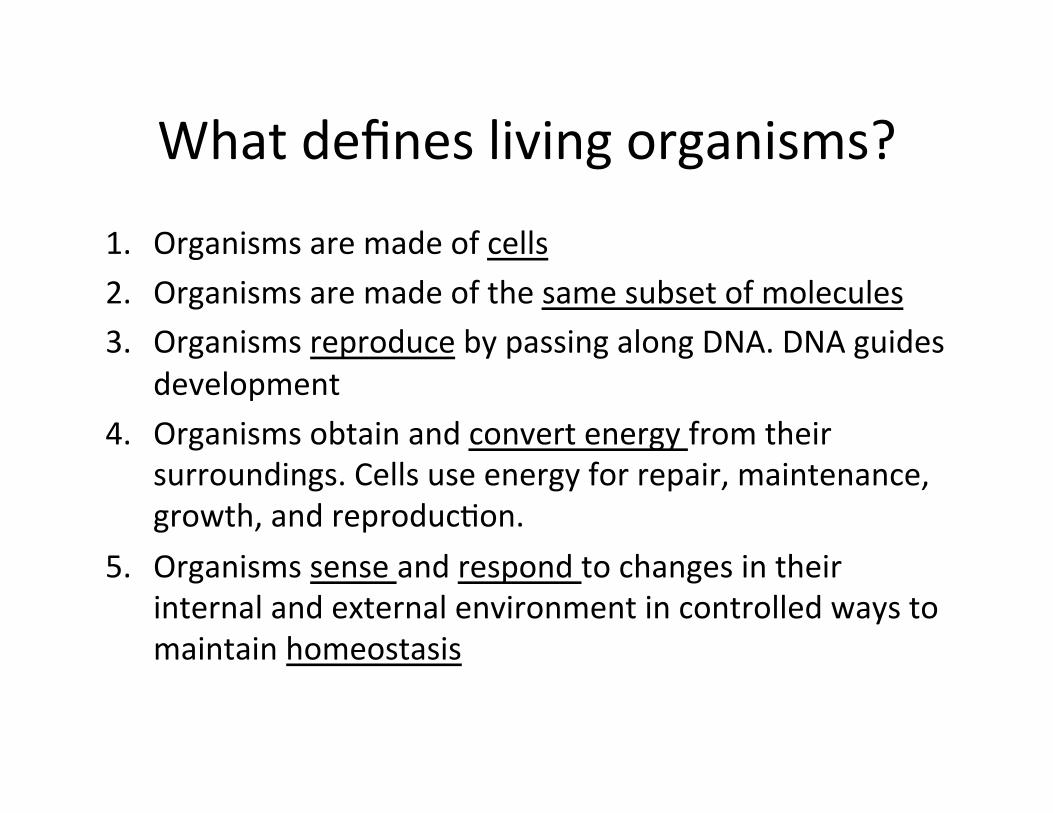
What defines living organisms?
1. Organisms are made of cells 2. Organisms are made of the same subset of molecules 3. Organisms reproduce by passing along DNA. DNA guides
development 4. Organisms obtain and convert energy from their
surroundings. Cells use energy for repair, maintenance, growth, and reproduc)on.
5. Organisms sense and respond to changes in their internal and external environment in controlled ways to maintain homeostasis
Sensing and responding
• Includes: – ATrac)on – Avoidance – Escape – Expression of protec)ve proteins – Changes in physiology

Homeostasis example – blood glucose
Marieb & Hoehn , (2005), Human Anatomy & Physiology
HOMEOSTASIS, EXAMPLE: BLOOD GLUCOSE
Glucose
Insulin released
Glucose uptake
Glucose
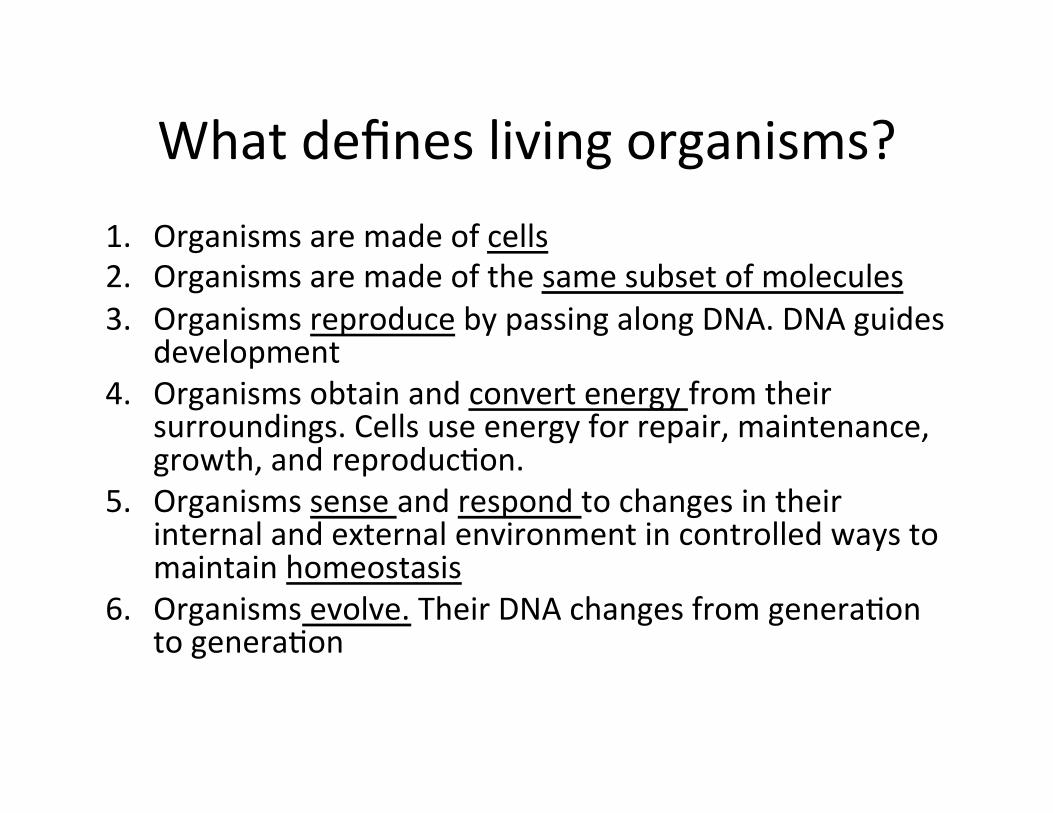
What defines living organisms? 1. Organisms are made of cells 2. Organisms are made of the same subset of molecules 3. Organisms reproduce by passing along DNA. DNA guides
development 4. Organisms obtain and convert energy from their
surroundings. Cells use energy for repair, maintenance, growth, and reproduc)on.
5. Organisms sense and respond to changes in their internal and external environment in controlled ways to maintain homeostasis
6. Organisms evolve. Their DNA changes from genera)on to genera)on
Evolu)on
• Gene)cally based change in a line of descent over )me
• Popula)on changes, not individuals • The basis for evolu)on is varia)on in traits – Muta)ons – Heritable changes in DNA
• What becomes of individuals with different traits is determined by selec)on
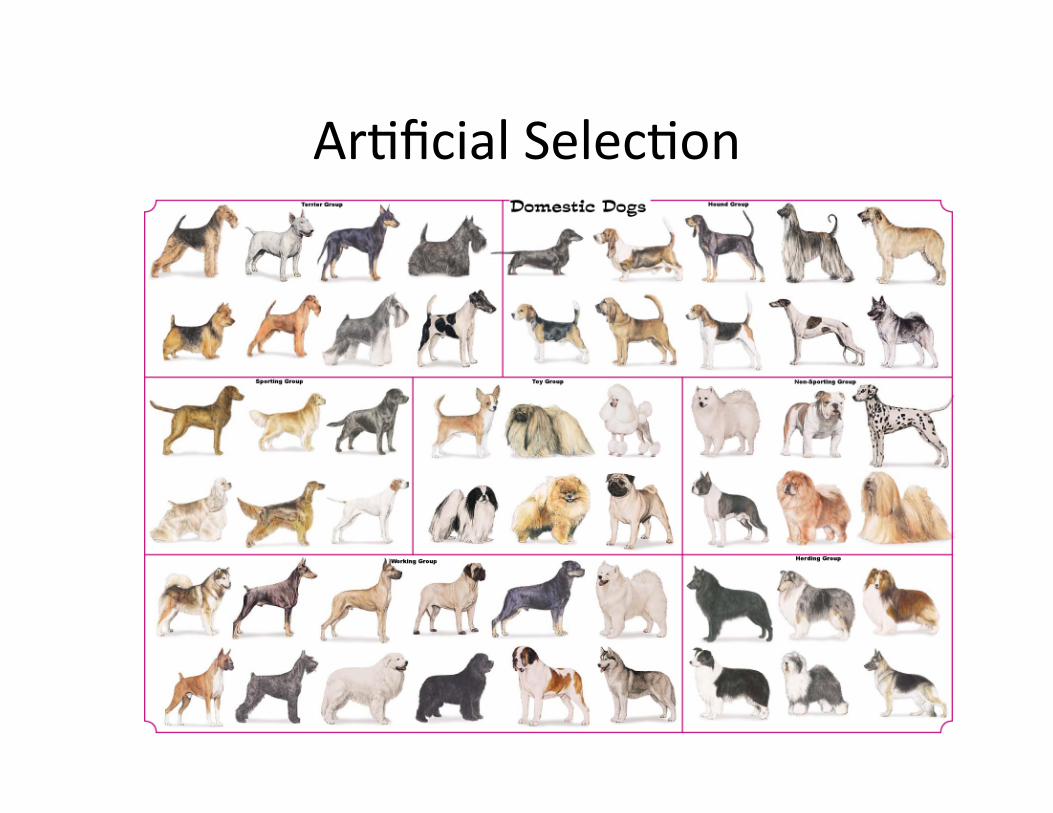
Ar)ficial Selec)on
Natural Selec)on
• The outcome of differences in survival and reproduc)on among individuals that vary in their heritable traits
• This process helps explain evolu)on – changes in a line of descent over genera)ons
THE CHEMICAL BASIS OF LIFE
Basic building blocks
• Atom – smallest unit of an element that s)ll retains the elements proper)es (conduc)vity, reac)vity, etc)
• Element – a pure chemical substance made up of one atom

Using chemistry in archeology
• Assumed that manure wasn’t used at fer)lizer un)l the )mes of Romans
• Recent research shows that manure was used during the Neolithic
• How did researchers figure this out?

How do we describe elements?
n=1
n=2
Valence electrons
ATOMS (EXAMPLE, CARBON)
the smallest unit that retain the properties of an element
C 6 12
atomic number = No. of protons
mass number =protons+neutrons
Hydrogen (H)
Carbon
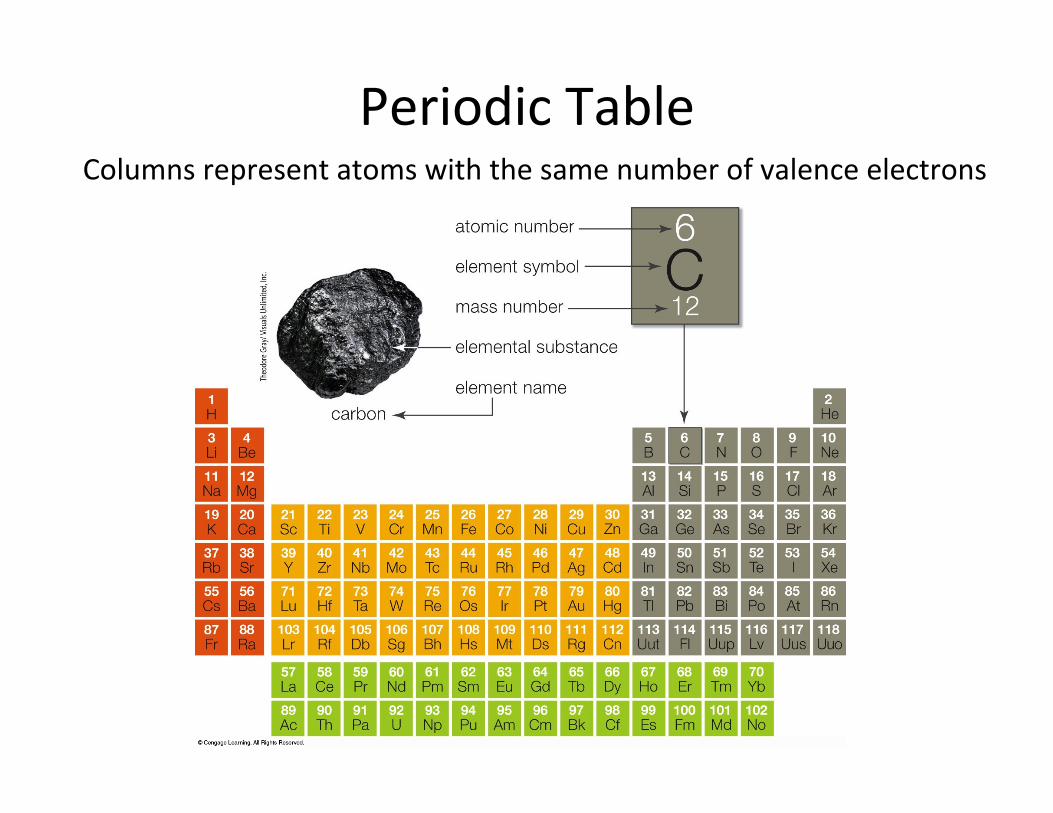
Periodic Table Columns represent atoms with the same number of valence electrons
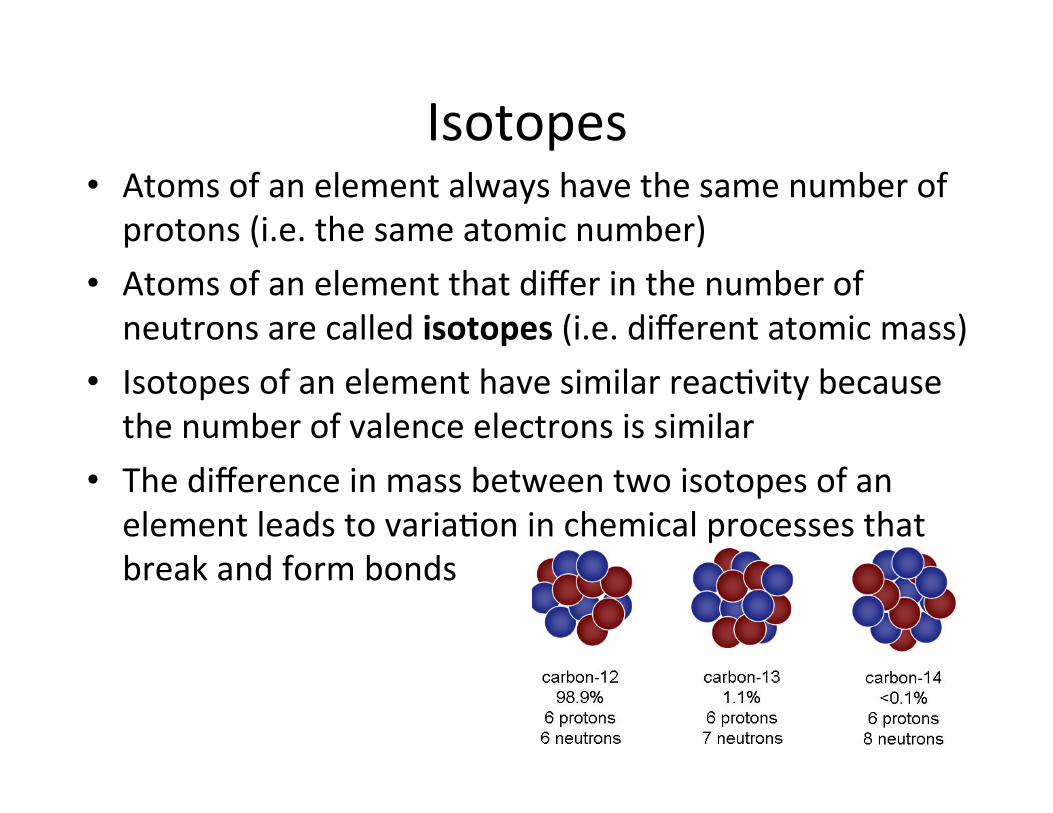
Isotopes • Atoms of an element always have the same number of protons (i.e. the same atomic number)
• Atoms of an element that differ in the number of neutrons are called isotopes (i.e. different atomic mass)
• Isotopes of an element have similar reac)vity because the number of valence electrons is similar
• The difference in mass between two isotopes of an element leads to varia)on in chemical processes that break and form bonds
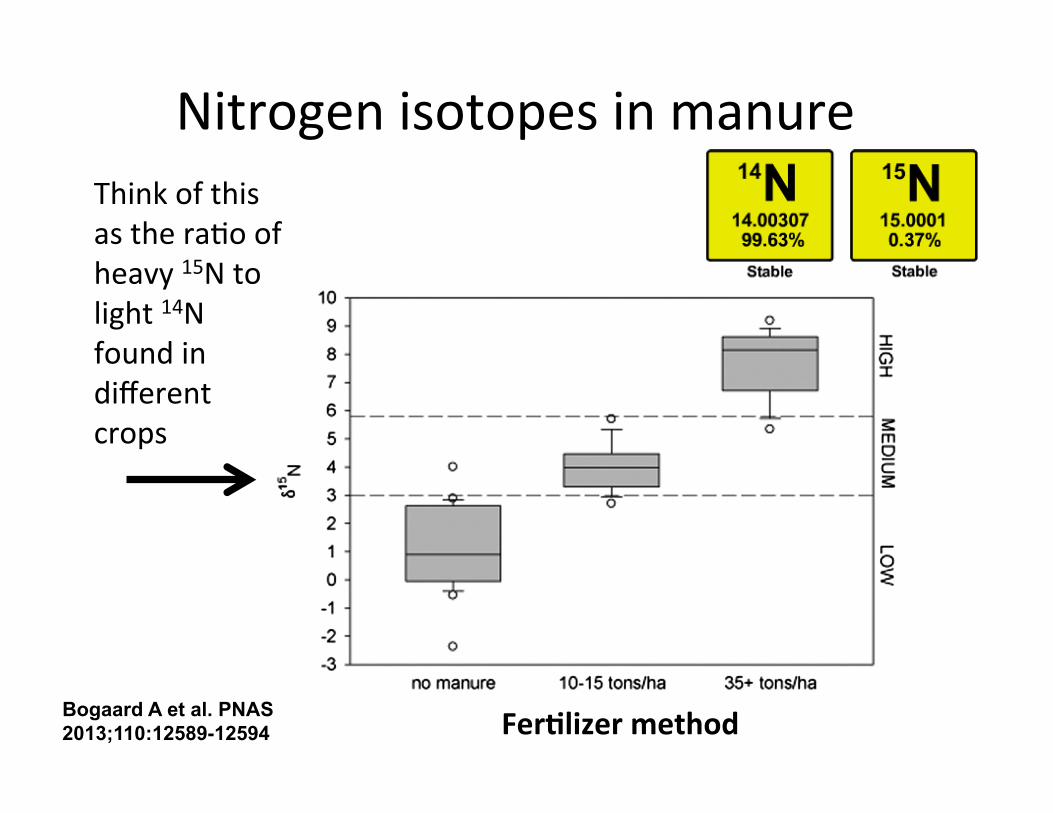
Bogaard A et al. PNAS 2013;110:12589-12594
Nitrogen isotopes in manure Think of this as the ra)o of heavy 15N to light 14N found in different crops
FerQlizer method
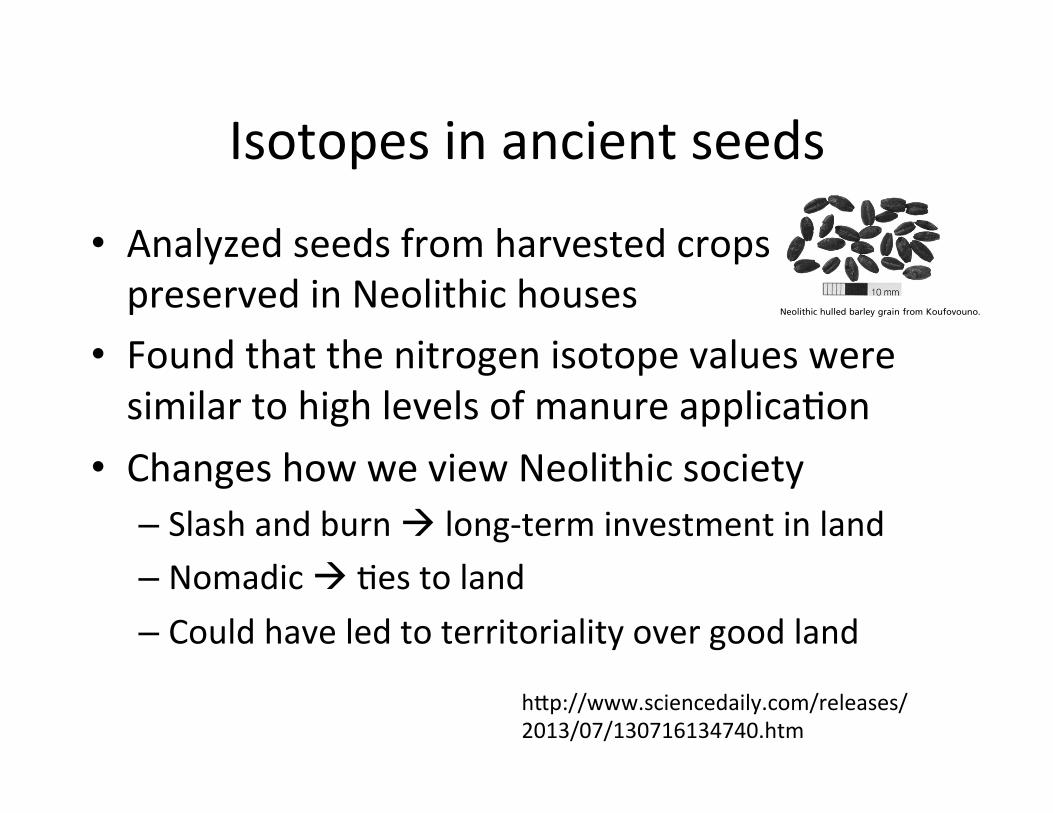
Isotopes in ancient seeds
• Analyzed seeds from harvested crops preserved in Neolithic houses
• Found that the nitrogen isotope values were similar to high levels of manure applica)on
• Changes how we view Neolithic society – Slash and burn à long-‐term investment in land – Nomadic à )es to land – Could have led to territoriality over good land
Methods) (18) and can be used in conjunction with crop !15Nvalues to assess growing conditions and management practices,such as irrigation.Herein we present unique evidence for crop growing con-
ditions and farming practices based on carbon and nitrogenstable isotope determinations of 124 bulk crop samples (totaling>2,500 individual cereal grains or pulse seeds) from 13 Neolithicsites across Europe (Figs. 2 and 3), interpreted in the light ofherbivore forage !15N values estimated from stable isotopicanalysis of associated (domestic and wild) herbivore bone col-lagen, modern isotopic comparanda (12, 13, 16–18), experi-mental work on the effects of charring (19, 20), and associatedarable weed assemblages (4, 5, 21, 22). The sites mostly date tothe earlier Neolithic in their respective regions (Table 1) andwere selected on the basis of richness in well-preserved charredcrop material (Fig. 3); together, these sites provide a rough“transect” from southeast to northwest Europe (Fig. 2).
Results and DiscussionFig. 4 shows !13C and !15N values of cereals and pulses fromfour sites, and Table 2 summarizes results from all sites (forindividual sample results, see Table S2). Unsurprisingly, a broadclimatic trend in humidity is apparent if wheat or barley !13Cvalues at sites in or near the Mediterranean zone are comparedwith those in temperate zones (Fig. 2): thus, !13C values of wheat
(or barley) from sites in Greece and Bulgaria are lower thanthose from Germany and Denmark (Fig. 4 and Table 2). Ex-tensive isotope investigations of cereals and pulses from modernexperimental stations and farm studies across Europe, however,have shown that crop !15N values re!ect management practicesrather than broad climatic trends (13). For six of the sites inTable 2, herbivore forage !15N values have been estimated fromthe !15N determinations of associated bone collagen of largeherbivores by subtracting 4‰ as an average of the 3–5‰ rangeassociated with the trophic shift (15). At these sites, cereal grain!15N values tend to be considerably higher than those inferredfor forage. Although variation in !15N values among cerealcomponents may contribute to this contrast (cereal grain is ca.2.5‰ higher in !15N than associated rachis) (12, 13), even do-mestic herbivores receiving supplementary cereal fodder con-sumed a range of taxa and plant matter from various habitats (8)and, hence, inferred forage stable isotope values provide anapproximation of the local !15N value of nonarable vegetation.Contrasts in cereal and forage !15N values suggest that arablesoil N was relatively enriched in 15N. Weed evidence available ata number of sites indicates that cultivation plots were longestablished, with soils tending to be intensively disturbed andproductive (4, 5, 21, 22). Although these conditions excludesome potential causes of 15N-enrichment, such as wetland de-nitri"cation, salinity, and recent clearance (32, 33), they consti-tute a plausible context for manuring.Cereal grain !15N values at most sites are consistent with
signi"cant rates of manure application (Figs. 1 and 4, and Table 2).There is also considerable diversity in cereal !15N values at somesites. Local variation in manuring rates was observed in stableisotope studies of present-day traditional farming regimes inAsturias, Spain, and the Sighisoara region of western Romania(13). Variation is likely where manure is concentrated at speci"clocations in the landscape because it is heavy to transport andso tends to be used in close proximity to pens, byres, and so forth(9, 34). Low cereal !15N values (<3‰) indicative of long-termunmanured cultivation occur alongside high values at some sites(Fig. 4 A–C, and Table 2), and are dominant among the emmerwheat samples from Sarup, Denmark (Fig. 4D). Herbivore for-age !15N values from all sites (ca. 1–3‰) (Table 2) fall withinthe range of unmanured cereals (Fig. 1).Estimated forage !15N values are often similar to those of
pulses. As expected (13), pulses tend to exhibit lower !15N valuesthan associated cereals (Fig. 4 A and B, and Table 2). Only ex-tremely intensive manuring (>35 tons/ha over a prolonged pe-riod, resulting in the formation of “dung-soil”), as observed ina study of present-day broad bean gardens in Evvia, Greece(13), increases pulse !15N values considerably above 0‰. Thearchaeobotanical pulse !15N values thus point to intensive ma-nuring, variously comparable to, or higher than, the rates appliedto associated cereals. Furthermore, high pulse !13C values rel-ative to wheat at sites in Greece and Bulgaria (Fig. 4 A and B,and Table 2) indicate a higher water status and suggest prefer-ential use of well-watered soils for pulses or supplementaryirrigation.Overall, the crop nitrogen isotope compositions indicate that
early farmers in Europe made strategic use of manure as a re-source that was limited both by the scale of herding and by the
Fig. 1. Ranges of !15N values in modern bulk cereal samples (wheats andbarleys) grown under different rates of manuring at long-term agriculturalexperiments: Rothamsted, United Kingdom, Askov, Denmark, and BadLauchstädt, Germany (13). Dashed horizontal lines represent thresholds oflow (i.e., residual from previous land use history only), medium, and highmanuring rates.
Fig. 2. Map showing the archaeological sites. Fig. 3. Neolithic hulled barley grain from Koufovouno.
12590 | www.pnas.org/cgi/doi/10.1073/pnas.1305918110 Bogaard et al.
hTp://www.sciencedaily.com/releases/2013/07/130716134740.htm
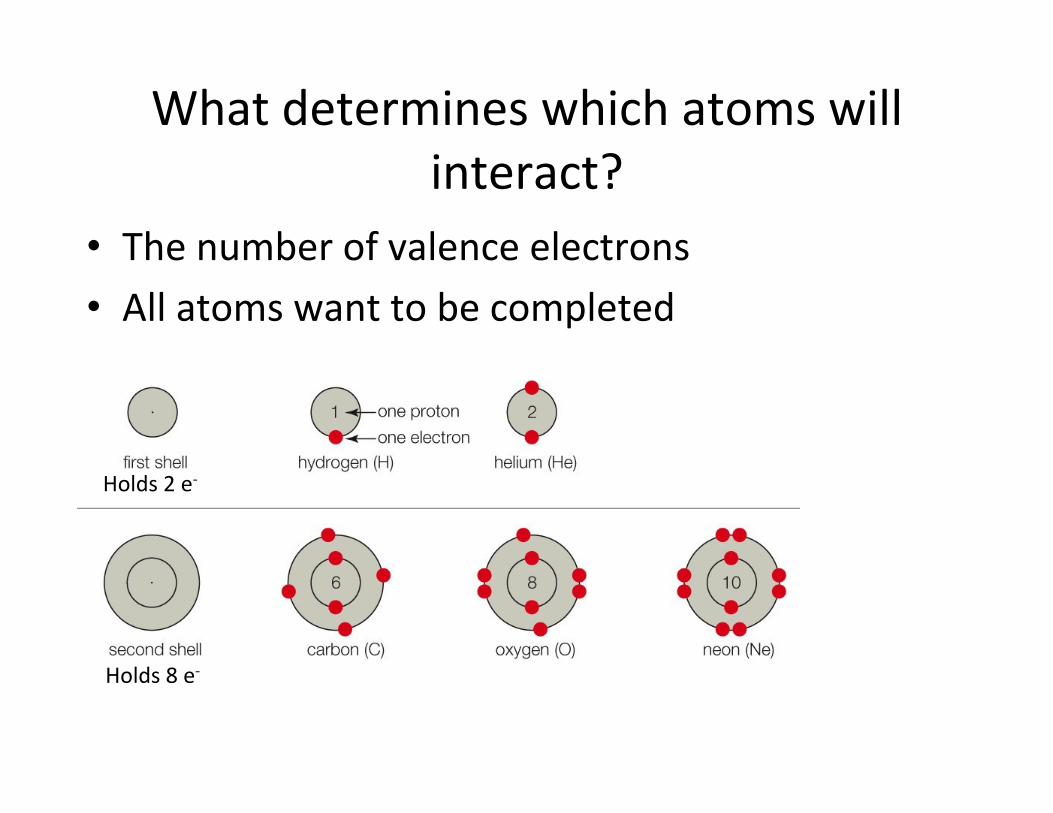
What determines which atoms will interact?
• The number of valence electrons • All atoms want to be completed
Holds 2 e-‐
Holds 8 e-‐
Molecules
• Molecule -‐ when at least two atoms are bound together – Examples: NaCl, O2
• Ions – atoms or molecules that are charged (i.e. + or -‐) due to the loss or gain of an electron or electrons – Example: K+, OH-‐

Molecular bonds
• Ionic bonds – two ions that are held held together by opposite charges • + and – charges aTract • Example: Na+ + Cl-‐ = NaCl
Molecular bonds
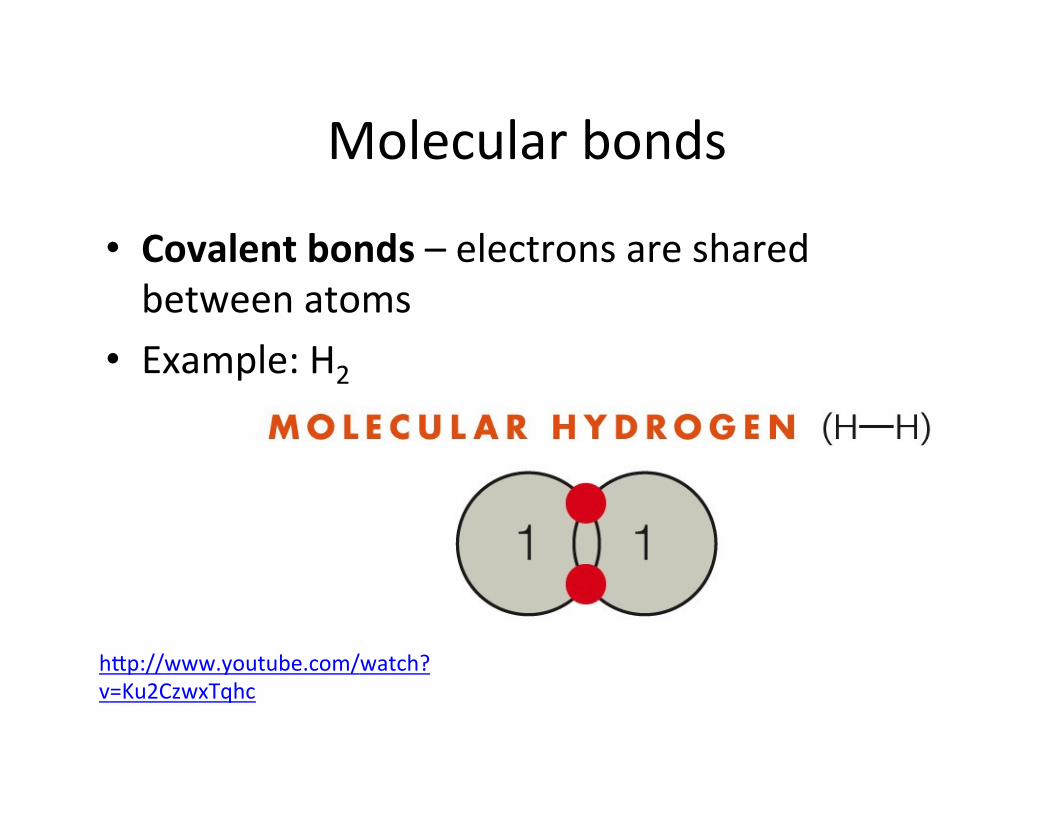
• Covalent bonds – electrons are shared between atoms
• Example: H2
hTp://www.youtube.com/watch?v=Ku2CzwxTqhc
Covalent bonds – polar or nonpolar
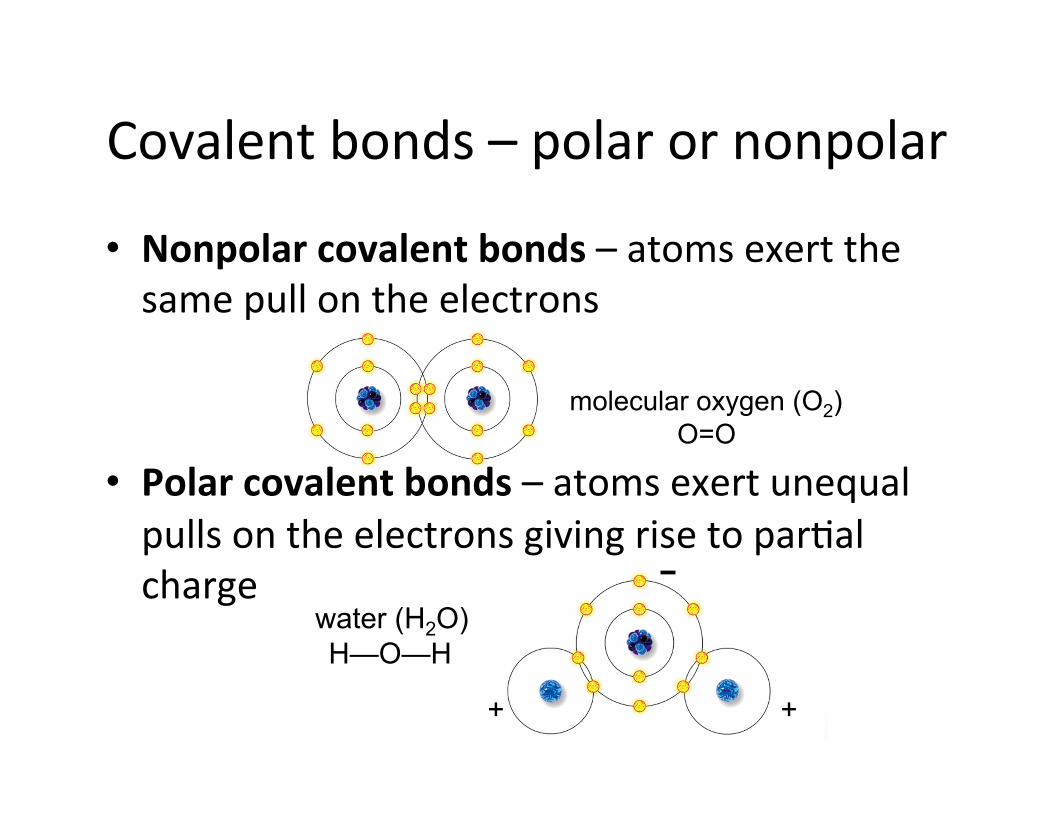
• Nonpolar covalent bonds – atoms exert the same pull on the electrons
• Polar covalent bonds – atoms exert unequal pulls on the electrons giving rise to par)al charge
COVALENT BONDS (POLAR OR NONPOLAR)
Nonpolar covalent bond – atoms exert the same pull on the electrons
Polar covalent bond – atoms exert unequal pulls on the electrons giving rise to partial charge
molecular oxygen (O2)
O=O
water (H2O)
H—O—H
+ +
COVALENT BONDS (POLAR OR NONPOLAR)
Nonpolar covalent bond – atoms exert the same pull on the electrons
Polar covalent bond – atoms exert unequal pulls on the electrons giving rise to partial charge
molecular oxygen (O2)
O=O
water (H2O)
H—O—H
+ +
Molecular bonds
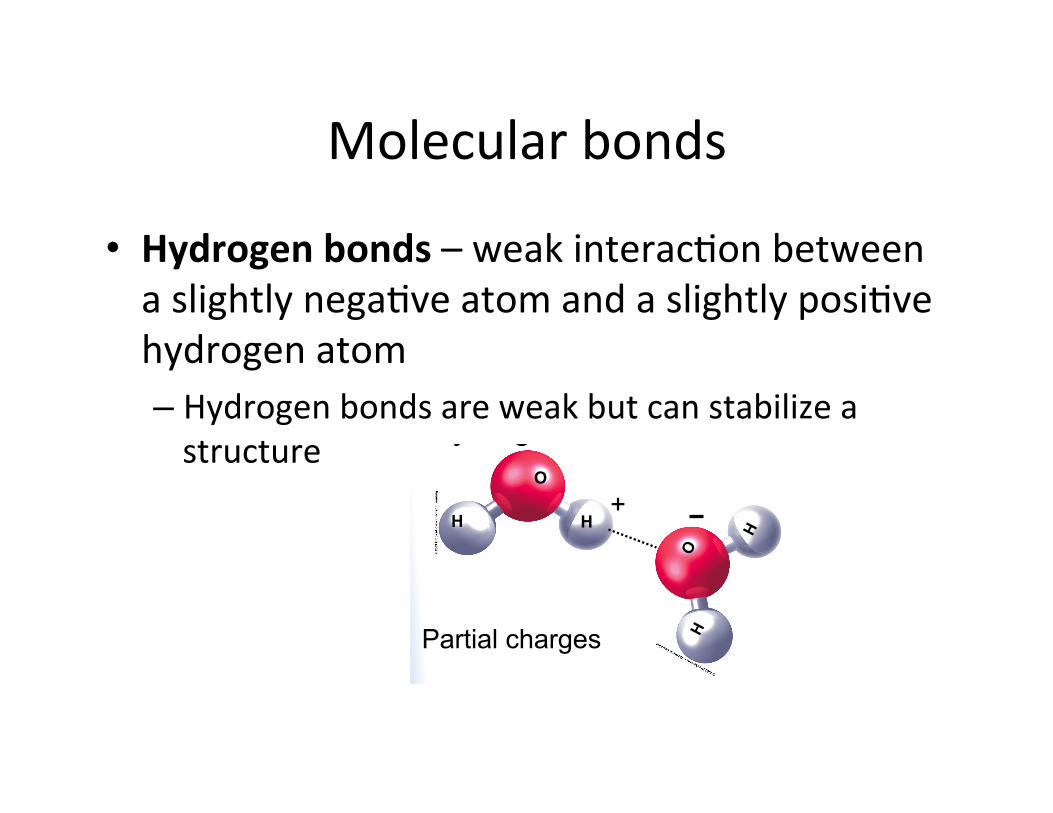
• Hydrogen bonds – weak interac)on between a slightly nega)ve atom and a slightly posi)ve hydrogen atom – Hydrogen bonds are weak but can stabilize a structure
Hydrogen bond – weak
attraction between a
slightly negative atom
and a slightly positive
hydrogen atom
MOLECULAR BONDS
H H
O
Hydrogen bonds can link
chains
+
Partial charges!
Lecture 2
Outline:
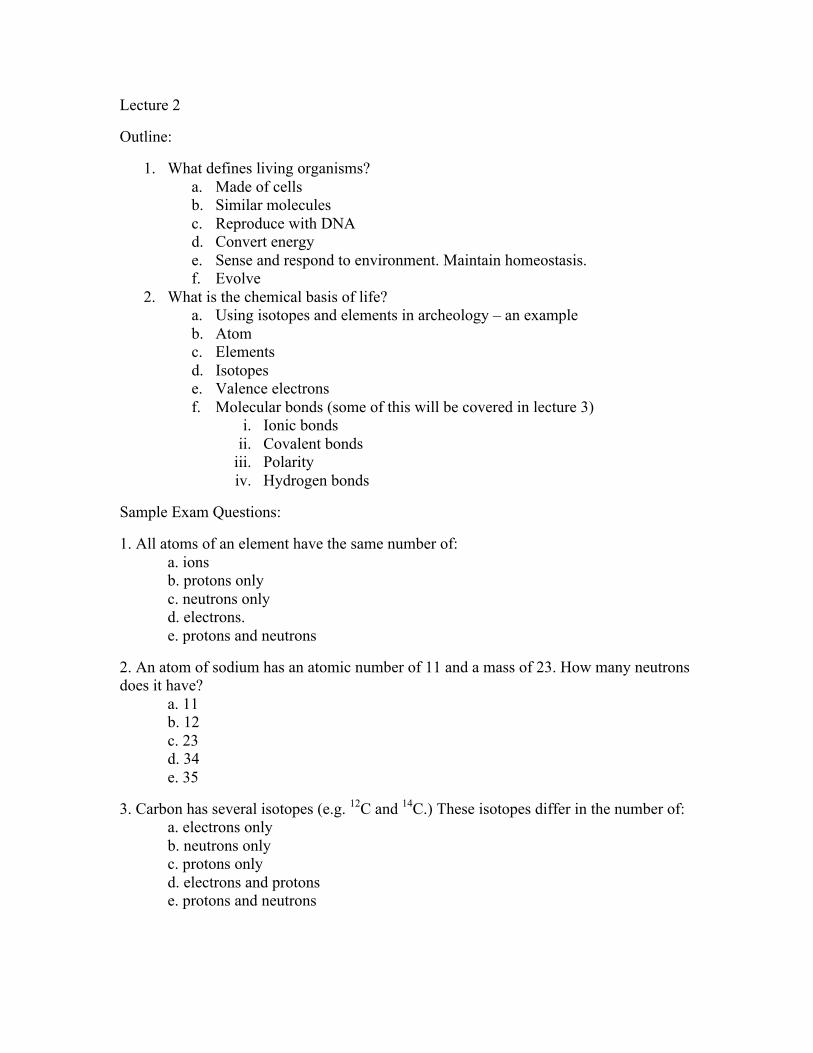
1. What defines living organisms? a. Made of cells b. Similar molecules c. Reproduce with DNA d. Convert energy e. Sense and respond to environment. Maintain homeostasis. f. Evolve
2. What is the chemical basis of life? a. Using isotopes and elements in archeology – an example b. Atom c. Elements d. Isotopes e. Valence electrons f. Molecular bonds (some of this will be covered in lecture 3)
i. Ionic bonds ii. Covalent bonds
iii. Polarity iv. Hydrogen bonds
Sample Exam Questions:
1. All atoms of an element have the same number of: a. ions b. protons only c. neutrons only d. electrons. e. protons and neutrons
2. An atom of sodium has an atomic number of 11 and a mass of 23. How many neutrons does it have? a. 11 b. 12 c. 23 d. 34 e. 35
3. Carbon has several isotopes (e.g. 12C and 14C.) These isotopes differ in the number of: a. electrons only b. neutrons only c. protons only d. electrons and protons e. protons and neutrons
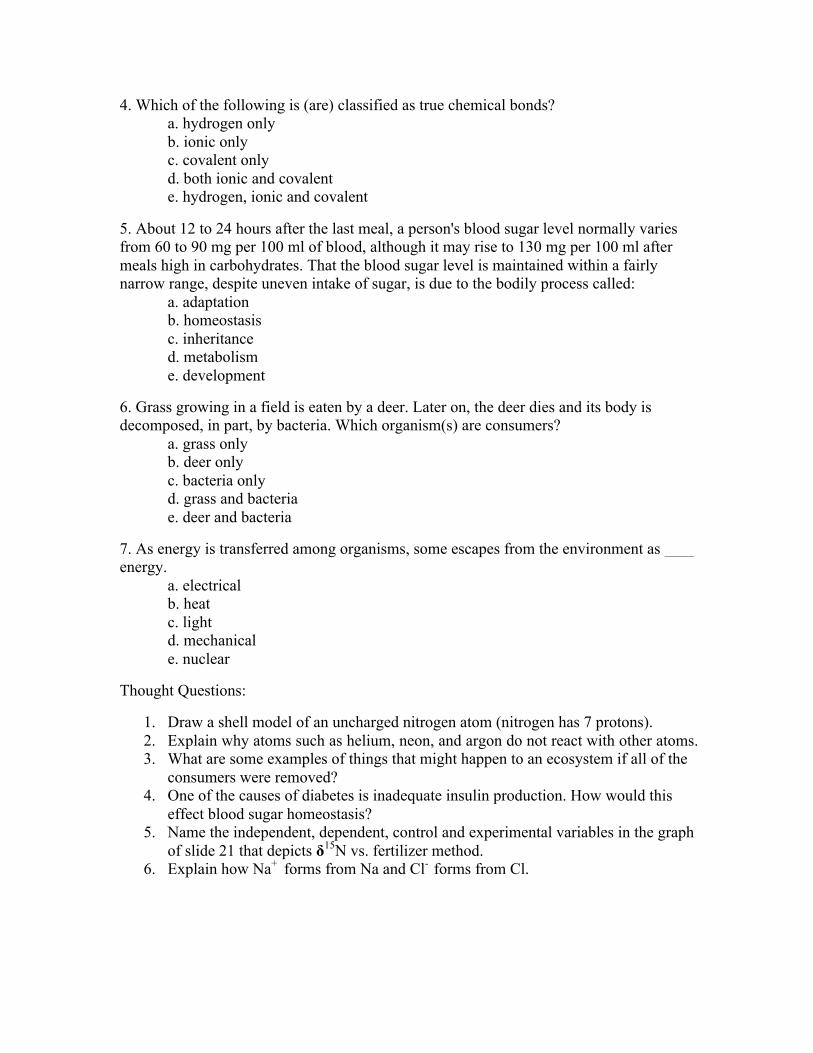
4. Which of the following is (are) classified as true chemical bonds? a. hydrogen only b. ionic only c. covalent only d. both ionic and covalent e. hydrogen, ionic and covalent
5. About 12 to 24 hours after the last meal, a person's blood sugar level normally varies from 60 to 90 mg per 100 ml of blood, although it may rise to 130 mg per 100 ml after meals high in carbohydrates. That the blood sugar level is maintained within a fairly narrow range, despite uneven intake of sugar, is due to the bodily process called: a. adaptation b. homeostasis c. inheritance d. metabolism e. development
6. Grass growing in a field is eaten by a deer. Later on, the deer dies and its body is decomposed, in part, by bacteria. Which organism(s) are consumers? a. grass only b. deer only c. bacteria only d. grass and bacteria e. deer and bacteria
7. As energy is transferred among organisms, some escapes from the environment as energy. a. electrical b. heat c. light d. mechanical e. nuclear
Thought Questions:
1. Draw a shell model of an uncharged nitrogen atom (nitrogen has 7 protons). 2. Explain why atoms such as helium, neon, and argon do not react with other atoms. 3. What are some examples of things that might happen to an ecosystem if all of the
consumers were removed? 4. One of the causes of diabetes is inadequate insulin production. How would this
effect blood sugar homeostasis? 5. Name the independent, dependent, control and experimental variables in the graph
of slide 21 that depicts δ15N vs. fertilizer method. 6. Explain how Na+ forms from Na and Cl- forms from Cl.

Sample Exam Question Answers:
1. B 2. B 3. B 4. D 5. B 6. E 7. B