Embed Size (px)
Citation preview

1
• LAST WEEK: Catalogs, Astrometry, Photometry – Apparent Brightness and Luminosity – The Magnitude Scale
• TODAY: Color & Temperature – Color & Color Indices – Introduction to Spectroscopy – Effective Temperature – Wien’s law; Stephan’s law
• Wednesday: Spectral Classification – Planck Distribution (Blackbody Radiation) – Classifying Stars by their low-resolution spectra
Lec #9: 12 SEP 11 Magnitudes and Brightness; Color and Temperature 5. Color • With our eyes, we can
tell that stars have a range of colors.
• Colors are more prominent in a telescope, but only because the light is brighter.
• Qualitatively, color tells us very little. How can we quantify it?
• What affects color between star and us? – independent of distance, except for ...
• interstellar reddening (ignore for now) • atmospheric extinction • atmospheric refraction and scattering • color response of optics • color response of detector (or our eye)
• Most detectors have broad (but not linear) color response. Need to define a wavelength (or range of wavelengths) corresponding to each color AND calibrate response of sky, telescope, and detector.
• Johnson UBV (365/68; 440/98; 550/89) • Kron UBVRI • Bessell UBVRI • Infrared Colors (JHKLM)
Color Index • Magnitude difference between different bands;
e.g. (B-V), (U-B), (R-I) – must have common “zero point”, so – Vega: U=0, B=0, V=0, R=0, I=0 – magnitude runs backward, and “bluer” color is always
on the left, so a smaller color index -> bluer color – What is (U-B) for Vega? (B-V)?
• As we’ll go into in great detail soon, color is related to the surface temperature of stars. – hotter stars -> bluer – warning: visual perception only works over a very
limited temperature/color range
2
-0.5
0
0.5
1
1.5
2
0 5000 10000 15000 20000 25000 30000 35000 40000 45000
Effective Temperature
(B-V
)
Data from “Astrophysical Quantities” 4E (Allen)
Notice that B-V is single-valued (but not linear) function of Temp.
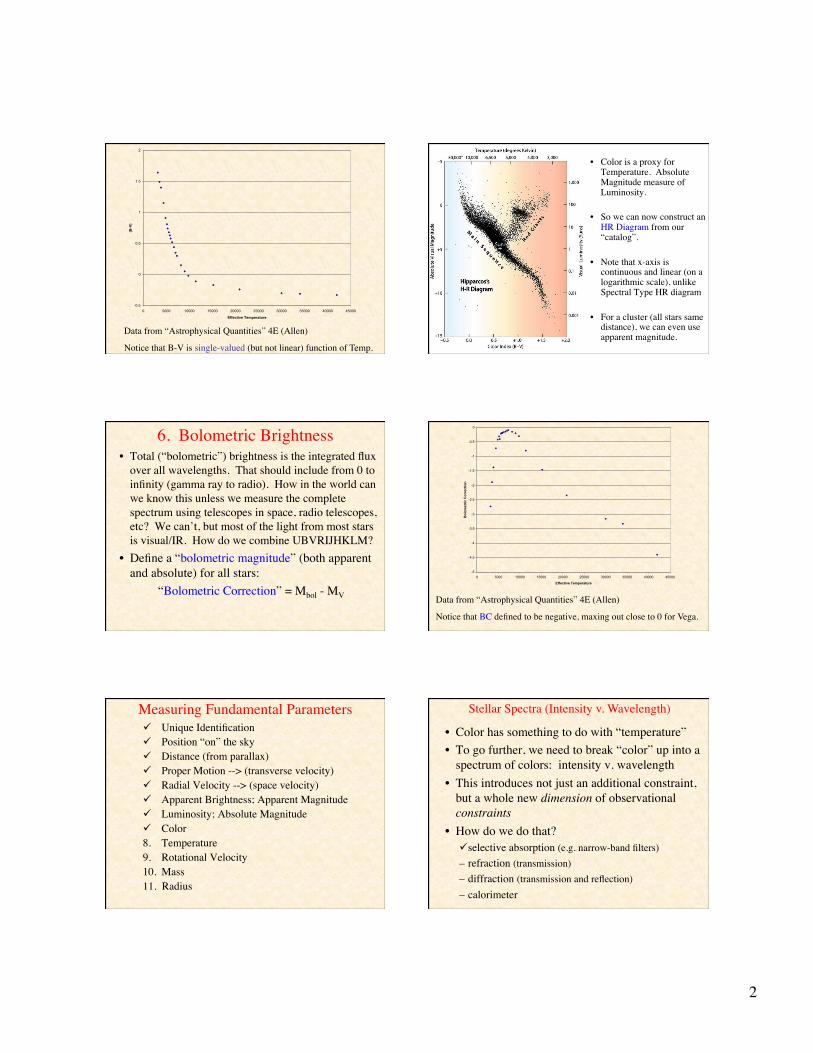
• Color is a proxy for Temperature. Absolute Magnitude measure of Luminosity.
• So we can now construct an HR Diagram from our “catalog”.
• Note that x-axis is continuous and linear (on a logarithmic scale), unlike Spectral Type HR diagram
• For a cluster (all stars same distance), we can even use apparent magnitude.
6. Bolometric Brightness • Total (“bolometric”) brightness is the integrated flux
over all wavelengths. That should include from 0 to infinity (gamma ray to radio). How in the world can we know this unless we measure the complete spectrum using telescopes in space, radio telescopes, etc? We can’t, but most of the light from most stars is visual/IR. How do we combine UBVRIJHKLM?
• Define a “bolometric magnitude” (both apparent and absolute) for all stars:
“Bolometric Correction” = Mbol - MV
-5
-4.5
-4
-3.5
-3
-2.5
-2
-1.5
-1
-0.5
0
0 5000 10000 15000 20000 25000 30000 35000 40000 45000
Effective Temperature
Bol
omet
ric C
orre
ctio
n
Data from “Astrophysical Quantities” 4E (Allen)
Notice that BC defined to be negative, maxing out close to 0 for Vega.
Unique Identification Position “on” the sky Distance (from parallax) Proper Motion --> (transverse velocity) Radial Velocity --> (space velocity) Apparent Brightness; Apparent Magnitude Luminosity; Absolute Magnitude Color 8. Temperature 9. Rotational Velocity 10. Mass 11. Radius
Measuring Fundamental Parameters • Color has something to do with “temperature” • To go further, we need to break “color” up into a
spectrum of colors: intensity v. wavelength • This introduces not just an additional constraint,
but a whole new dimension of observational constraints
• How do we do that? selective absorption (e.g. narrow-band filters) – refraction (transmission) – diffraction (transmission and reflection) – calorimeter
Stellar Spectra (Intensity v. Wavelength)

3
Wavelength in horizontal direction
What does vertical direction represent?
What does height of black lines represent? width?
8. “Surface” Temperature • We’ve used it for a few plots. What is it?
– what is temperature a measure of? – how do we determine it?
• from color index • from fit to full continuous spectrum • from spectral lines
– are all these temperatures the same? – what does it represent in the stellar atmosphere? – how/why do different temperatures produce different
continuous spectra?
1. What do we know? • Solid or dense materials emit electromagnetic
radiation characterized by their temperature above absolute zero.
• They emit at ALL wavelengths.
• The distribution of intensity v. wavelength always has a similar functional form, but... – The peak and amplitude of the distribution are
functions of Temperature
Explore for yourself:
1. applet on our website
2. download “Spectrum Explorer” for your computer (or use it in 104)
Wien’s Law: Inverse linear relation between Temperature and Peak Wavelength
• Can’t remember the constant of proportionality? Remember the solar values instead! (5000 Å)*(5800 K) = Wien’s constant
• A higher temperature object emits more light at EVERY wavelength than a lower temperature object (of the same size) – warning: what is wrong with the following figure...
Caution: Can a 10,000 K star be fainter than a 5,000 K star at 400 nm? at 800 nm?
Of course it can! Size does matter!

4
• Stephan’s Law: The bolometric surface flux is directly proportional to the fourth power of temperature
– Surface Flux: F = σT4
– Luminosity: L = (Surface Area) σ Teff4
= 4πR2 σ T4
σ = 5.67E-5 (cgs) E-8 (mks)
2. The Planckian Brightness Distribution • The functional form of intensity v. wavelength
exactly matches an analytic expression...
Bλ(T) = 2hc2/ λ5 [ehc/λKT -1]-1 erg/s cm-2 Å-1 sr-1 or... Bν(T) = 2hν3/c2 [ehν/KT -1]-1 erg/s cm-2 Hz-1 sr-1
• We’ll worry more about the angular distribution later. For now, the observed flux is
f = πB erg/s cm-2 Å-1