Embed Size (px)
Citation preview
The Lebanese Demographic Reality
January 14, 2013
© All Rights ReservedPrinted by PAPEC s.a.r.l. 09/220786
Lebanese Information CenterLebanon
The Lebanese Demographic Reality
The following report was reviewed by
Statistics Lebanon
Table of Content
I. Introduction …..........…..……………………………………………………………….… 1
II. History of Emigration .....................................................................… 2
III. Emigration by Sects ………………............…………………………...……………… 4
IV. Fertility Rate …………………………………………………….................………...… 10
V. General population by Sects ……………………………..…………....………….... 13
VI. Summary of Projected Data …………..………………………….…………………... 17
VII. Global Summary ……………………………………………………….……………...…… 19
VIII. References …………………………………………………………………..…………….….. 20
1
I Introduction :
The last official census in Lebanon [3, 4, 11, 12] which was conducted in 1932 indicated that the population was 875,252 with around 53% as Christians. Other censuses were conducted unofficially; for example in 1956 it was estimated that the population was 1,411,416, with around 54% Christians and 44% Muslims. According to recent statistics done by the World fact-book, the Christians constitute around 39% of the population and Muslims constitute around 59.7%. Conducting a census has been a very sensitive issue due to the sectarian divisions in the country and due to the pressure that some groups could practice in case statistics showed a wide shift in the population demographics.
The following report sheds light on the demographics in Lebanon based on religious affiliation from a scientific point of view. We start by presenting data on the number of emigrants from Lebanon and we give an estimate on emigration by sects based on crucial historical stages. It is important to mention though that numbers on emigrants represent the actual number of emigrants and not their descendants. The numbers of emigrants as well denote the net immigration estimate which takes into consideration returning emigrants in a given year. We list all possible factors that might be directly related to shifts in emigration by sects. We continue to present data on the fertility rate by sects and show the decline of fertility rate in the Muslim population. We also list the possible factors that play a role in such decline. Finally, we give an estimate on the population by sect in Lebanon. We use the electoral lists as the starting point of our calculations and we proceed by adding and deducting relevant data from school students, technical school students, university students and emigrants. In addition, and for practical reasons plus/minus 2% can be estimated to cover up for inaccuracies in mortality rate, illiteracy rate, approximations in emigration and other relevant facts (ex: around 25,000 convicted person does not show on the electoral lists, Army forces personnel are not registered on the electoral lists …).
2
II History of Emigration :
For more than a century and a half, Lebanon has been characterized by high emigration flux due to the economic and the political situation. This reality is due to Lebanon’s geographic location in addition to other internal and external conflicts. It is true that emigration usually causes brain drain in any nation but in Lebanon, emigration at many points in history was the driving force to many important turns in the history of this country.
The history of Lebanon has been marked by a series of migration waves [9, 14, 18]:
❏❏ Before 1870, hundreds emigrated from Mount Lebanon (keeping in mind that the population back then was around 200,000).
❏❏ From 1870 till 1900, almost 3000 persons emigrated from Lebanon per year.
❏❏ From 1900 till 1914, almost 15,000 persons emigrated from Lebanon per year and this shows a sharp increase in emigration during those 14 years.
❏❏ In 1914 and during the eruption of World War I, around one third of the population of the mountains emigrated (It is important to mention that this wave of emigration gave Lebanon a strong economic push later. It is also estimated that one third of those who left Lebanon during this period returned back. Those people are precisely those who created a very dynamic (Christian) middle class that was behind the creation of modern Lebanon).
❏❏ From 1914 till 1945, not too many people left Lebanon due to the severe economic depression that hit the world in 1929.
❏❏ From 1945 till 1950, emigration resumed with an average of 3000 persons per year.
❏❏ From 1950 till 1960, very small number emigrated due to the strong economy in Lebanon during that period (with an average of 3000 persons per year as well).
❏❏ From 1960 till 1970, emigration increased with a rate of 9000 persons per year and this was due to the outbreak of the Arab Israeli war in 1967.
❏❏ From 1970 till 1975, the rate of emigration increased to about 10,000 persons per year.
3
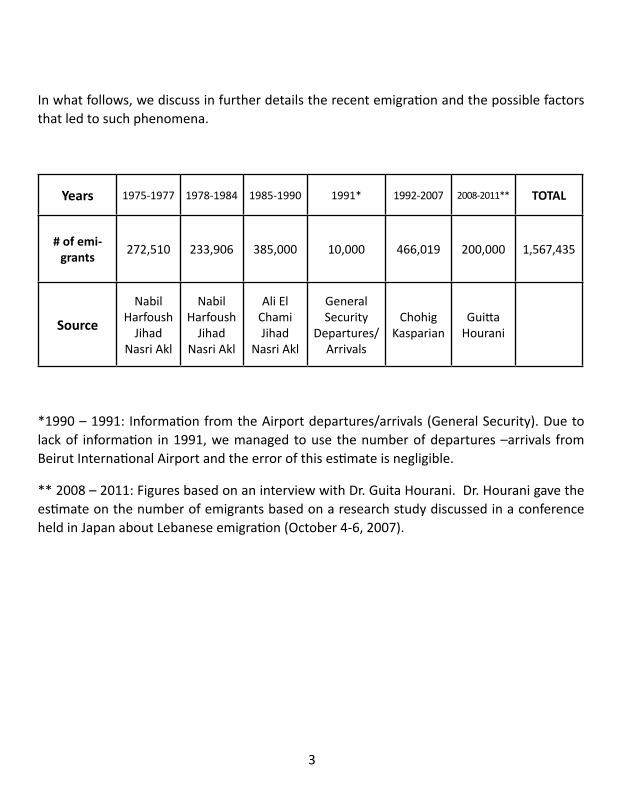
In what follows, we discuss in further details the recent emigration and the possible factors that led to such phenomena.
Years 1975-1977 1978-1984 1985-1990 1991* 1992-2007 2008-2011** TOTAL
# of emi-grants
272,510 233,906 385,000 10,000 466,019 200,000 1,567,435
Source
Nabil Harfoush
Jihad Nasri Akl
Nabil Harfoush
Jihad Nasri Akl
Ali El ChamiJihad
Nasri Akl
General Security
Departures/Arrivals
ChohigKasparian
Guitta Hourani
*1990 – 1991: Information from the Airport departures/arrivals (General Security). Due to lack of information in 1991, we managed to use the number of departures –arrivals from Beirut International Airport and the error of this estimate is negligible.
** 2008 – 2011: Figures based on an interview with Dr. Guita Hourani. Dr. Hourani gave the estimate on the number of emigrants based on a research study discussed in a conference held in Japan about Lebanese emigration (October 4-6, 2007).
4
III Emigration by sects :
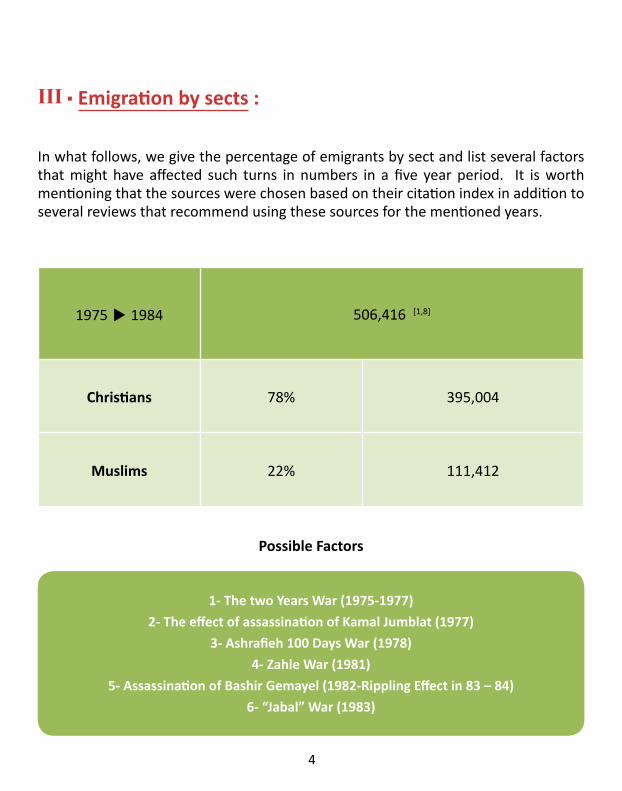
In what follows, we give the percentage of emigrants by sect and list several factors that might have affected such turns in numbers in a five year period. It is worth mentioning that the sources were chosen based on their citation index in addition to several reviews that recommend using these sources for the mentioned years.
1975 1984 506,416 [1,8]
Christians 78% 395,004
Muslims 22% 111,412
Possible Factors
1- The two Years War (1975-1977)
2- The effect of assassination of Kamal Jumblat (1977)
3- Ashrafieh 100 Days War (1978)
4- Zahle War (1981)
5- Assassination of Bashir Gemayel (1982-Rippling Effect in 83 – 84)
6- “Jabal” War (1983)
5
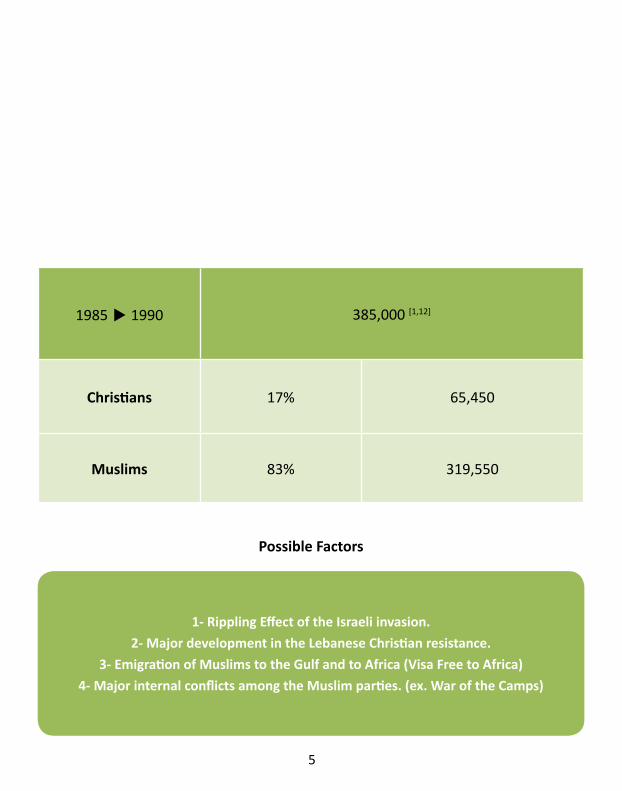
1985 1990 385,000 [1,12]
Christians 17% 65,450
Muslims 83% 319,550
Possible Factors
1- Rippling Effect of the Israeli invasion.
2- Major development in the Lebanese Christian resistance.
3- Emigration of Muslims to the Gulf and to Africa (Visa Free to Africa)
4- Major internal conflicts among the Muslim parties. (ex. War of the Camps)
6
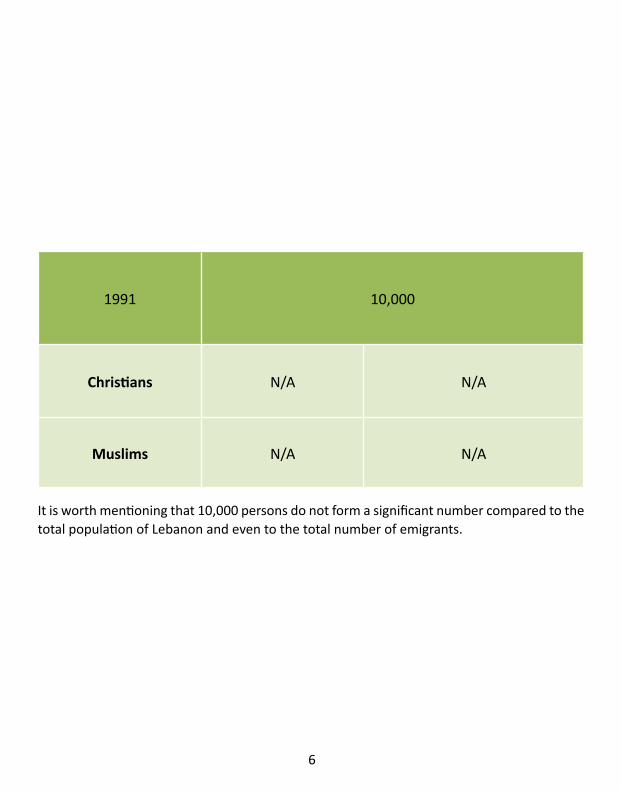
1991 10,000
Christians N/A N/A
Muslims N/A N/A
It is worth mentioning that 10,000 persons do not form a significant number compared to the total population of Lebanon and even to the total number of emigrants.

7
1992 2007 466,019 [10]
Christians 39.40% 183,611
Muslims 60.60% 282,408
Possible Factors
1- Rippling effect of the “Tahrir” and “Ilgha” War
2- Higher Islamic emigration to the gulf Region and Africa
3- Israeli Wars (1993- 1996- 2006)
4- Assassination of Rafik Hariri (2005)
5- The regaining of the Christian political momentum
6- Retreat of the Syrian army (2005)
7- Economic development
8
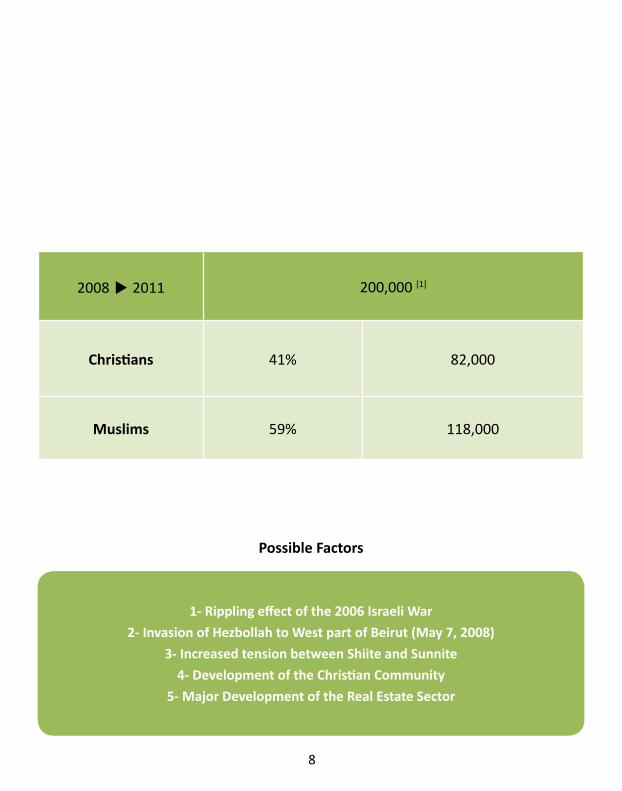
2008 2011 200,000 [1]
Christians 41% 82,000
Muslims 59% 118,000
Possible Factors
1- Rippling effect of the 2006 Israeli War
2- Invasion of Hezbollah to West part of Beirut (May 7, 2008)
3- Increased tension between Shiite and Sunnite
4- Development of the Christian Community
5- Major Development of the Real Estate Sector
9
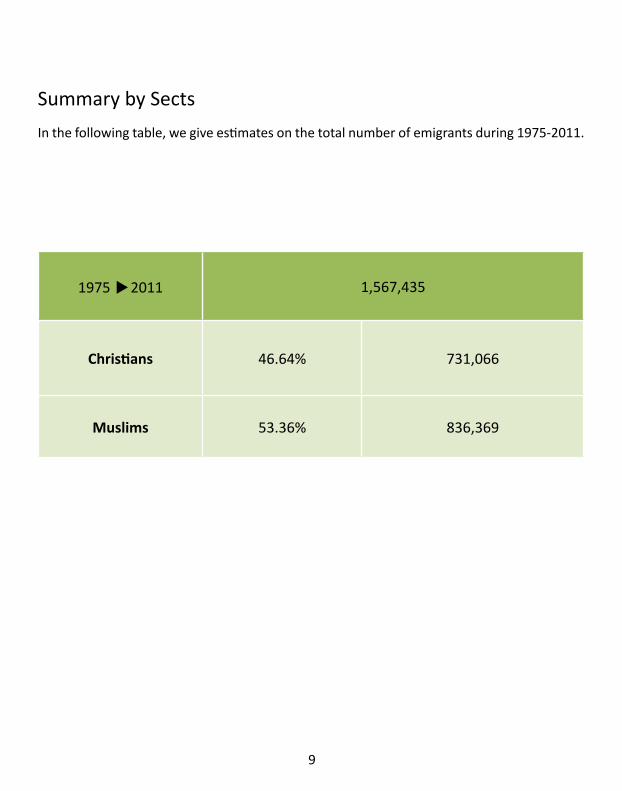
Summary by Sects
In the following table, we give estimates on the total number of emigrants during 1975-2011.
1975 2011 1,567,435
Christians 46.64% 731,066
Muslims 53.36% 836,369
10
IV Fertility Rate :
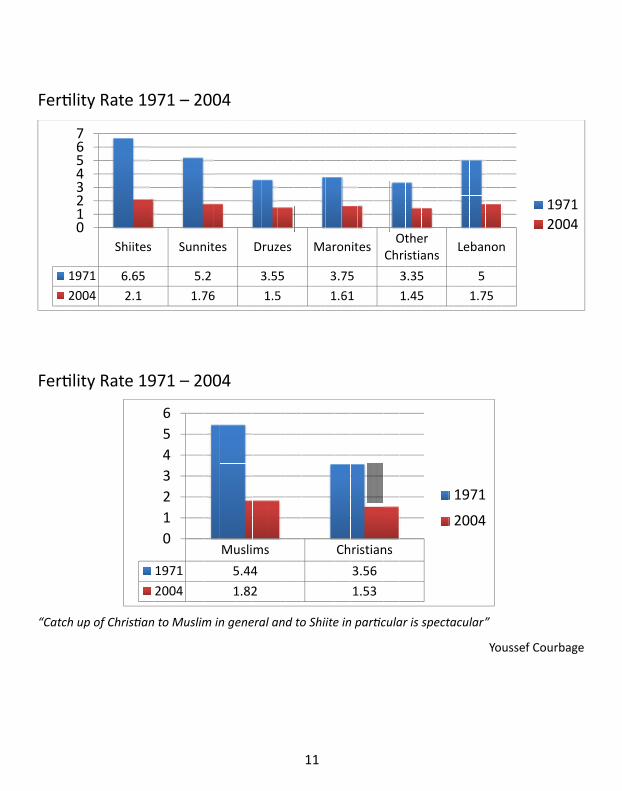
In what follows, we discuss fertility rate and compare it for different sects in Lebanon specially the fertility rate of the years 1971 and 2004. We present the fertility rate for 2004 and adopt it for later years as it is scientifically accepted to consider the fertility rate to be almost constant to a period of 10 years. In other words, there is no significant change in the behavior of fertility in a short period of time (less than 10 years) taking into consideration that no major twists in social behavior have happened from 2004 till 2012 (For example, the fertility rate in Lebanon in 2004 was 1.70, while in 2011 it is 1.60).
As a result and with minor shifts, the same fertility rate for 2004 can be adopted for 2012. The tables below show a huge gap in the fertility rate in the Muslim community and especially the Shiite population due to factors mentioned later. Those figures came to agree with many studies done in this direction [5, 6]. Taking the weighted average of the fertility rates between Christians and Muslims in Lebanon as given below, one can see that the average national fertility rate agrees with the fertility rate that the World Bank estimated for the year 2012.
11
Fertility Rate 1971 – 2004
Fertility Rate 1971 – 2004
“Catch up of Christian to Muslim in general and to Shiite in particular is spectacular”
Youssef Courbage
F
Ferttility
1
2
y Ra
197
200
0
1
2
3
4
5
6
7
ate
71
04
197
S
71 –
Shii
6.6
2.
– 20
tes
65
1
004
s SSun
5
1
nnit
5.2
.76
tes
6
D
3
ruz
3.5
1.5
zes
5
5
Maaro
3.7
1.6
onit
75
61
tes
C
Ot
Chri
3
1
the
istia
3.35
1.45
er
ans
5
5
s
Leban
5
1.7
non
75
ن
n
ـانـبـن ـبـل
1
2
197
200
71
04
13
FFerrtilitty RRate 1
“C
971
Catc
1 –
ch u
20
up o
004
of Ch
197
200
0
1
2
3
4
5
6
hris
71
04
stiann too Mu
Mu
5
1
uslim
usli
5.44
1.82
m in
Y
ms
4
2
n ge
Yous
ener
ssef
ral a
f Co
and
ourb
d to
bage
Ch
Shii
e
rist
3.5
1.5
ite i
tian
56
53
in p
ns
partiicullar iis sp
19
20
pect
971
004
tacu
1
4
ن
ular
ـانـبـن
r”
ـبـل
14
12
Factors that directly affected Reproductive Behavior
We list below all the factors that we believe contributed to the decline of the fertility rate in 2004. Although the political instability is indirectly related to the decrease in fertility rate in the Muslim community, we believe that the following factors played a role in such transformation.
1- Higher literacy rate for boys and in later stages for girls increased their ability to read and write at their early twenties.
2- The advance in education delayed the age of marriage.
3- The advance in education contributed in the use of contraception devices, especially by women.
4- Significant decrease of marriage between cousins and relatives, which result-ed in lowering the family rigidity and the closure of social groups.
5- Urbanization – The internal displacement into cities and suburbs which re-quires a different mode of life of that than in the villages.
6- Decrease in fertility rate allowed parents to focus more on each child, espe-cially on the education level.
7- The direct effect of globalization.
13
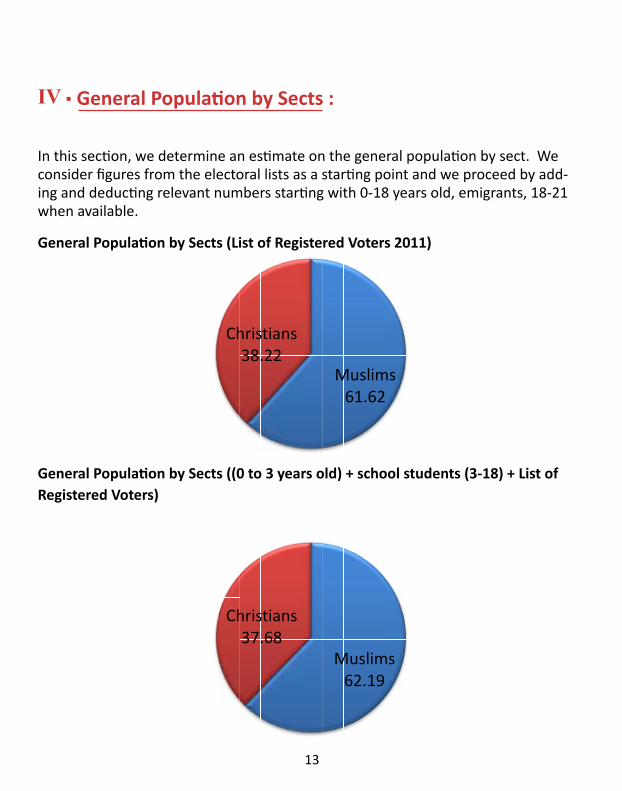
IV General Population by Sects :
In this section, we determine an estimate on the general population by sect. We consider figures from the electoral lists as a starting point and we proceed by add-ing and deducting relevant numbers starting with 0-18 years old, emigrants, 18-21 when available.
General Population by Sects (List of Registered Voters 2011)
General Population by Sects ((0 to 3 years old) + school students (3-18) + List of Registered Voters)
G
Genneraal Poopuulation by Seccts (((0 tto 33 yeears old
Ch
d) +
hris
37
sch
stia
.68
hoo
ns
8
l stuude
M
ents
Mus
62.
s (3-
slim
.19
-18)
ms
) + LList of RReggisteeredd Vo
ن
oter
ـانـبـن
rs)
ـبـل
17
I
s
a
G
In th
start
avai
Gen
his se
ting
lable
nera
V
ectio
poin
e.
al Po
V.
on, w
nt an
opu
G
we d
nd w
ulat
Gen
dete
we p
ion
nera
rmin
roce
by
al P
ne a
eed
Sec
Pop
n es
by a
cts (
pula
stim
addin
(List
atio
ate o
ng a
t of
on b
on t
nd d
f Re
by
the g
dedu
gist
Sec
gene
uctin
tere
Ch
cts
eral
ng re
ed V
hris
38
pop
eleva
Vote
stia
.22
ulat
ant
ers 2
ns
ion
num
201
by s
mber
11)
M
ect.
rs sta
Mus
61
We
artin
slim
.62
e con
ng w
ms
nsid
with 0
er fi
0-18
igure
8 yea
es fr
ars o
rom
old,
the
emig
elec
gran
ن
ctor
nts, 1
ـانـبـن
al lis
18-2
ـبـل
sts a
21 w
as a
when
n
16
14
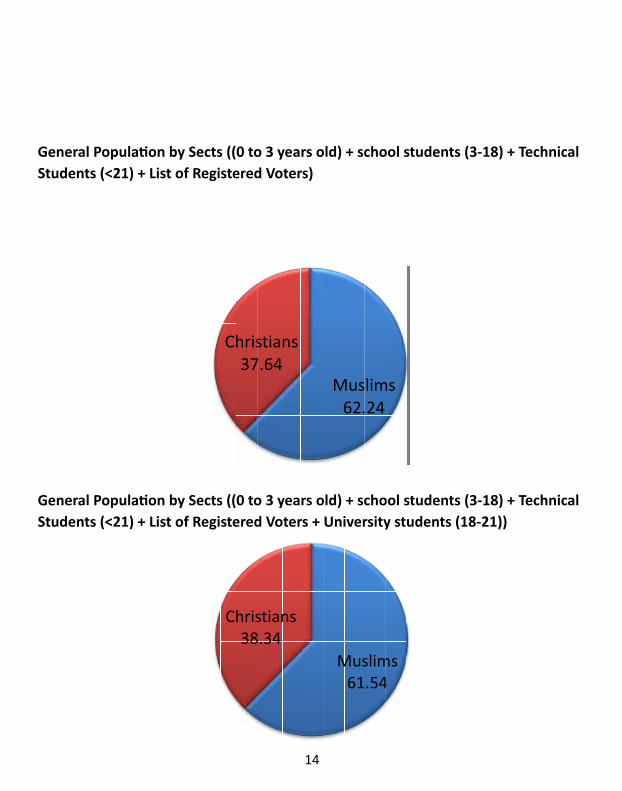
General Population by Sects ((0 to 3 years old) + school students (3-18) + Technical Students (<21) + List of Registered Voters)
General Population by Sects ((0 to 3 years old) + school students (3-18) + Technical Students (<21) + List of Registered Voters + University students (18-21))
G
R
Gen
Reg
nera
giste
al Po
ered
opu
d Vo
ulat
oter
ion
rs)
by Seccts (((0 tto 33 yeears old
Ch
d) +
hris
37
sch
stia
7.64
hoo
ans
4
l stuude
M
ents
Mus
62.
s (3-
lim
.24
-18)
ms
) + TTechhniccal SStuddennts (
ن
(<21
ـانـبـن
1) +
ـبـل
+ Lis
st of
f
18
G
R
Gen
Reg
nera
giste
al Po
ered
opu
d Vo
ulat
oter
ion
rs +
by
+ Un
Sec
nive
cts (
ersit
((0 t
ty st
to 3
tude
3 ye
ent
ears
ts (1
Ch
old
18-2
hrist
38.
d) +
21))
tian
34
sch
ns
hool stu
M
ude
Mus
61
ents
slim
.54
s (3-
ms
4
-18)) + TTechhniccal SStud
dennts (
ن
(<21
ـانـبـن
1) +
ـبـل + Lis
st of
f
19
15
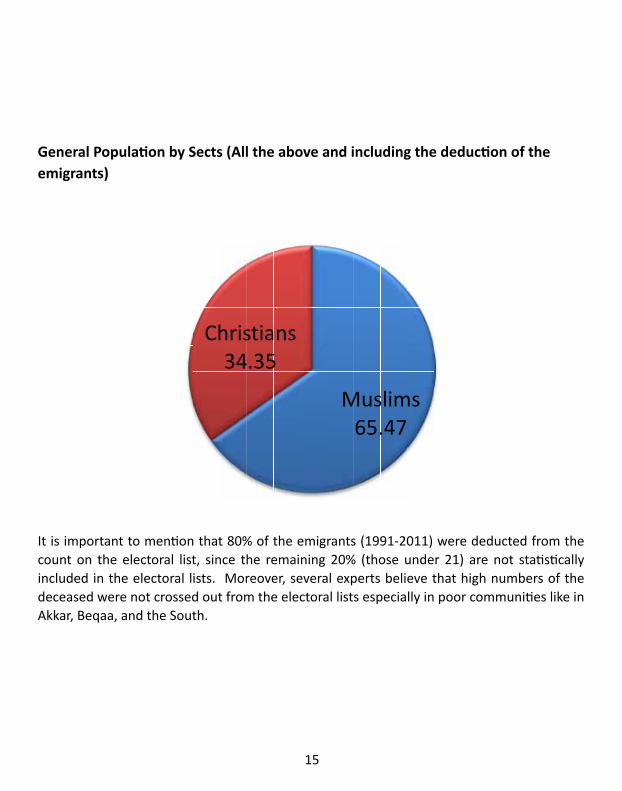
General Population by Sects (All the above and including the deduction of the emigrants)
It is important to mention that 80% of the emigrants (1991-2011) were deducted from the count on the electoral list, since the remaining 20% (those under 21) are not statistically included in the electoral lists. Moreover, several experts believe that high numbers of the deceased were not crossed out from the electoral lists especially in poor communities like in Akkar, Beqaa, and the South.
G
I
r
n
S
Gen
It is
rema
num
Sout
nera
imp
ainin
mber
th.
al Po
porta
ng 2
s of
opu
ant
20%
the
ulat
to m
(tho
dec
ion
men
ose
ceas
by
tion
und
ed w
Sec
tha
der 2
were
cts (
at 80
21)
e no
(All
0% o
are
ot cro
the
of th
not
osse
e ab
he e
sta
ed o
bove
emig
tisti
ut fr
e an
grant
cally
rom
Ch
nd i
ts (1
y inc
the
hris
34
nclu
1991
clud
e ele
stia
.35
udin
1-20
ed i
ctor
ns
5
ng t
011)
in th
ral li
the
wer
he e
sts e
M
ded
re d
elect
espe
Mus
65.
duct
edu
toral
ecial
slim
.47
tion
cted
l list
ly in
ms
n of
d fro
ts.
n po
f the
om t
Mor
or c
e em
the
reov
omm
mig
cou
ver,
mun
ran
nt o
seve
nities
nts)
on th
eral
s like
he e
exp
e in
ن
elect
perts
Akk
ـانـبـن
tora
s be
kar, B
ـبـل
l list
lieve
Beqa
t, sin
e th
aa, a
nce
hat h
and
20
the
high
the
16
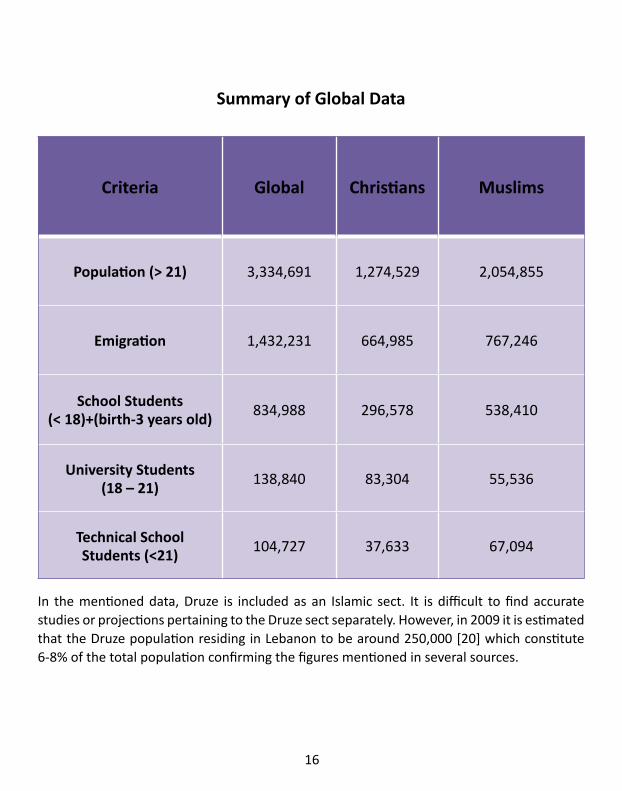
Summary of Global Data
Criteria Global Christians Muslims
Population (> 21) 3,334,691 1,274,529 2,054,855
Emigration 1,432,231 664,985 767,246
School Students (< 18)+(birth-3 years old)
834,988 296,578 538,410
University Students (18 – 21)
138,840 83,304 55,536
Technical School Students (<21)
104,727 37,633 67,094
In the mentioned data, Druze is included as an Islamic sect. It is difficult to find accurate studies or projections pertaining to the Druze sect separately. However, in 2009 it is estimated that the Druze population residing in Lebanon to be around 250,000 [20] which constitute 6-8% of the total population confirming the figures mentioned in several sources.
17
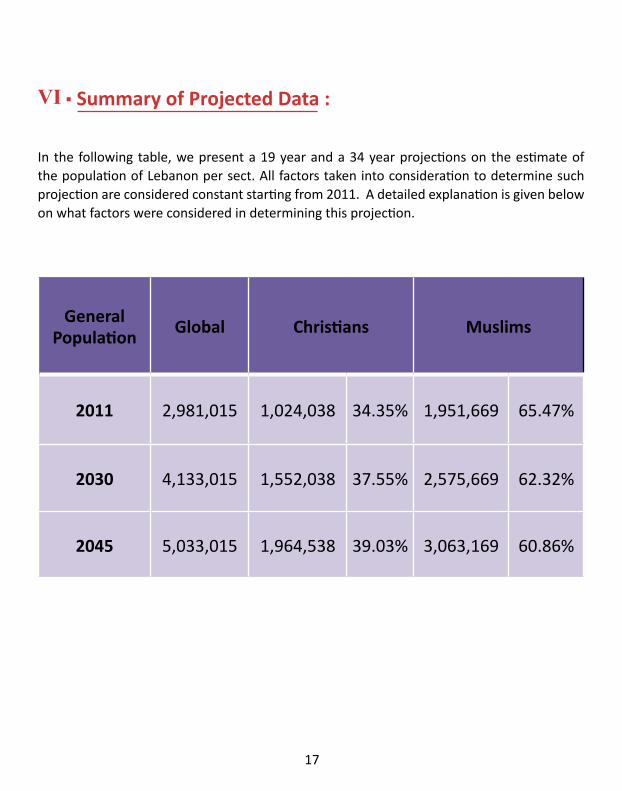
VI Summary of Projected Data :
In the following table, we present a 19 year and a 34 year projections on the estimate of the population of Lebanon per sect. All factors taken into consideration to determine such projection are considered constant starting from 2011. A detailed explanation is given below on what factors were considered in determining this projection.
General Population
Global Christians Muslims
2011 2,981,015 1,024,038 34.35% 1,951,669 65.47%
2030 4,133,015 1,552,038 37.55% 2,575,669 62.32%
2045 5,033,015 1,964,538 39.03% 3,063,169 60.86%
18
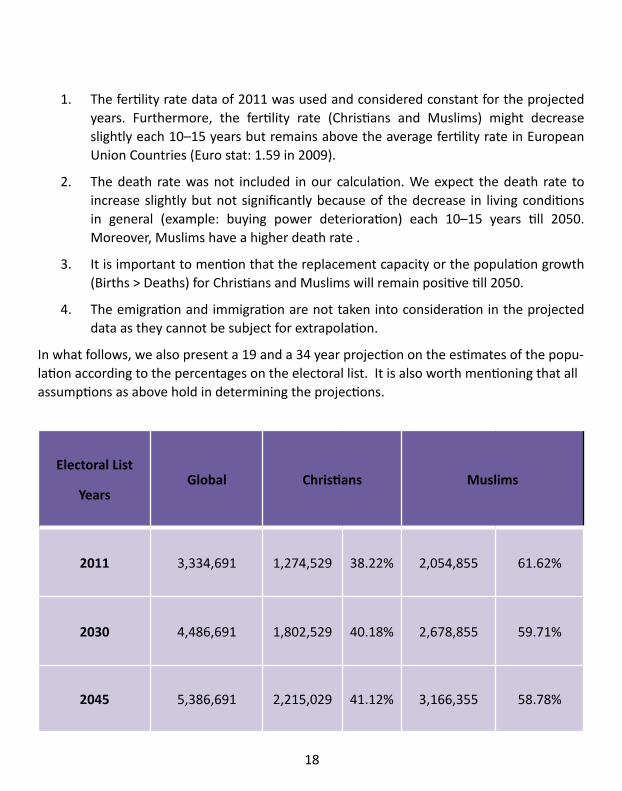
1. The fertility rate data of 2011 was used and considered constant for the projected years. Furthermore, the fertility rate (Christians and Muslims) might decrease slightly each 10–15 years but remains above the average fertility rate in European Union Countries (Euro stat: 1.59 in 2009).
2. The death rate was not included in our calculation. We expect the death rate to increase slightly but not significantly because of the decrease in living conditions in general (example: buying power deterioration) each 10–15 years till 2050. Moreover, Muslims have a higher death rate .
3. It is important to mention that the replacement capacity or the population growth (Births > Deaths) for Christians and Muslims will remain positive till 2050.
4. The emigration and immigration are not taken into consideration in the projected data as they cannot be subject for extrapolation.
In what follows, we also present a 19 and a 34 year projection on the estimates of the popu-lation according to the percentages on the electoral list. It is also worth mentioning that all assumptions as above hold in determining the projections.
Electoral List
Years Global Christians Muslims
2011 3,334,691 1,274,529 38.22% 2,054,855 61.62%
2030 4,486,691 1,802,529 40.18% 2,678,855 59.71%
2045 5,386,691 2,215,029 41.12% 3,166,355 58.78%
19
VII Global Summary :
The major points in this report are:
1- From the onset of the Lebanese war in 1975 through the mid 80’s, emigration was much higher amongst the Christian population. The situation was reversed for the 1984 – 2011 period. As a result, the religious repartition of emigrants from 1975 till 2011 stands at 46% Christians and 54% Muslims.
2- Fertility rates amongst both Christian and Muslim communities in Lebanon have both decreased in the 1971-2004 period. The decrease rate is much higher in the Muslim community, however, leaving both rates close in 2004.
3- Christians are estimated to be around 34% of the total Lebanese resident population, and indeed constitute 38% of eligible electoral voters. Opposite to popular perception, the 40 years old trend of declining Christian numbers has been reversed. This report highlights the stable numbers of the Christian population over the last couple of years, with the above statistics (respectively, Christian percentage of resident Lebanese and Christian percentage of eligible voters) increasing to around 38% and 40% over the next 19 years, and to around 39% and 41% over the next 34 years.
20
VII References :
1. Jihad Nasri Akl, Alhijra alhaditha min Lubnan wa ta’ati almoussasat alrasmiya wal
ahliya ma’aha 1860-2000, Beirut Dar wamaktabat altourath aladabi, 2002.
2. Mayssam Ali, The Road to Recovery: Emigration and the Lebanese Civil War, Harvard
International Review 1995 vol.4 no. 17.
3. Joseph Chamie, Religion and Fertility Arab Christian-Muslim differentials, Cambridge
University Press, England, 1981.
4. Youssef Courbage, Demographic challenges and opportunities ahead in the Middle
East and North Africa: “Arab Spring” or “Islamic winter”? NOREF Policy Brief, May
2012.
5. Youssef Courbage and Emmanuel Tod, A Convergence of Civilizations, Columbia
University Press, 2011.
6. Youssef Courbage and Rafic Boustani, Evolution demographique communautaire au
Liban et ses conséquences, 22 Dec 2008.
7. Muhammad Faour, Religion, Demography and Politics in Lebanon, Middle Eastern
Studies –November 2007.
8. Nabil Harfouche, The Lebanese in the Arab World, Jounieh 1974.
9. Albert Hourani and Nadim Shehadi, The Lebanese in the World: A Century of
Emigration, Center for Lebanese Study, London 1992.
10. Choghig Kasparian, “L’entree des jeunes libanais dans la vie active et l’emigration”
Presse de l’Universite Saint-Joseph 2001.
21
11. Boutros Labaki, Confessional Communities, Social Stratification and Wars in Lebanon,
Social Compass 1988 vol. 35 no. 4 533-561.
12. Boutros Labaki et Khalil Abou Rjeily, Bilan des Guerres du Liban 1975-1990 – 1993.
13. Anna Lietti, The Myth of Soaring Fertility Rate, Worldcrunch; URL: http://worldcrunch.
com/myth-soaring-muslim-fertility-rates/4990
14. Paul Tabar, Immigration and Human Development: Evidence from Lebanon, Human
Development research paper 2009.
15. Rita Tfaily, Marwan Khawaja, Afamia Kaddour Christian-Muslim fertility differences in
poor settings in greater Beirut, 2009.
16. Central Administration for Statistics. URL: www.CAS.gov.lb
17. International Foundation for Electoral Systems IFES, Elections in Lebanon, September
2011.
18. Lebanese Emigration Research Center (LERC), URL: http://www.ndu.edu.lb/lerc/
index.htm.
19. United Nations, World population prospects, 2010 Revision.
20. The Economist, 390, 2009 p. 49.
21. Higher Education in Lebanon, European Commission, July 2012.


![Lebanon CCG 2017 [508] PDF - U.S. Embassy in Lebanon Customs ... The Lebanese Customs Authority reported that Lebanon ... a global standard to promote transparency of the](https://img.pdfslide.us/doc/110x75/5ab051377f8b9a190d8e7a66/lebanon-ccg-2017-508-pdf-us-embassy-in-lebanon-customs-the-lebanese-customs.jpg)