Embed Size (px)
Citation preview

Leaving the EU: Implications for the UK economy
March 2016
PwC Contents
1 Key findings 3
2 Executive summary 5
3 Overview of our approach 11
4 Alternative scenarios 14
5 Scenario modelling results 21
Annexes 33
Annex A: CGE modelling 34
Annex B: Uncertainty and short-term impacts 40
Annex C: Trade and investment 47
Annex D: Migration 56
Annex E: Regulation 65
Annex F: Fiscal contributions 71
Annex G: Bibliography 74
Contents

PwC 3
With the referendum on whether the UK should remain in or leave the European Union (EU) fast approaching, it is important that businesses and individuals should have an informed view on the potential economic implications of alternative outcomes of the vote so that they can plan accordingly. The CBI therefore commissioned PwC to provide a detailed quantitative assessment of the potential economic implications of possible scenarios where the UK voted to leave the EU, as compared to the UK voting to remain in the EU.
We have assessed the potential economic impacts of a UK exit from the EU under two possible scenarios, combining a range of favourable and less favourable assumptions:
An ‘FTA scenario’ in which the UK negotiates a Free Trade Agreement (FTA) with the EU and both this and other aspects of post-exit uncertainty are resolved within five years of the referendum (i.e. by 2021).
A ‘WTO scenario' in which negotiations on post-exit arrangements prove more difficult and prolonged, and trade between the UK and the EU defaults to being conducted under World Trade Organisation (WTO) rules.
Our model estimates are expressed relative to a counterfactual economic scenario in which the UK remains a member of a reformed EU under the deal secured by the UK Government in February 2016. In the counterfactual, the economy continues to grow at a long-run trend rate of 2.3% per annum.
We estimate that total UK GDP in 2020 could be between around 3% and 5.5% lower under the FTA and WTO scenarios respectively than if the UK remains in the EU. In both cases, the largest short-term impact on the economy is felt through the additional uncertainty that would result from a UK vote to leave. The negative impact represents a reduction of around £55-100 billion in UK GDP, at 2015 values.
By 2030 this post-exit uncertainty should be resolved, but we estimate that the net longer term impact of other changes related to EU exit could result in total UK GDP in 2030 being between 1.2% and 3.5% lower in our two exit scenarios than if the UK remains in the EU (around £25-65 billion, at 2015 values). This reflects the potential negative economic impacts of increased barriers to trade and labour mobility after EU exit, offset in part by potential benefits from lower regulatory burdens and fiscal savings from no longer paying net budgetary contributions to the EU.
Projected differences in migration across scenarios will also change the size of the UK population and therefore GDP per capita. We estimate average GDP per capita (in real terms) could be between around 0.8% and 2.7% lower in 2030 in our two exit scenarios than if the UK remains in the EU. In the short-term, however, there could be a bigger decline due to uncertainty. We estimate GDP per household could be around £2,100-3,700 lower in 2020 if the UK leaves the EU.
Average real UK GDP per capita in 2030 would, however, be around 25% to 28% higher in 2030 than in 2015 in the EU exit scenarios, as compared to an estimated 29% increase with continued EU membership.
1 Key findings

PwC 4
In the short-term, our results suggest that employment levels fall by 1.7% and 2.9% relative to the counterfactual in 2020. Over the longer-term, total UK employment (the number of people employed) in 2030 could be between around 350,000 and 600,000 lower in our two exit scenarios relative to remaining in the EU. This equates to a reduction of around 1% to 1.8% in total projected UK employment in 2030 in these two exit scenarios relative to remaining in the EU, in large part due to lower inward migration of workers. In the short-term, unemployment could rise to around 7-8% in the next 3-4 years if the UK left the EU, compared with a rate of 5% if the UK remained in the EU. But the unemployment rate should return to around 5% in 2030 in the exit scenarios as the labour market adjusts.
As with any economic modelling exercise, our estimates are subject to many uncertainties. They should therefore only be taken as indicative of the broad direction and order of magnitude of the potential economic impacts of alternative exit scenarios. The report aims to inform the debate from an economic perspective and does not cover the wider political, social and cultural impacts of an exit from the EU that have been discussed in the public debate on EU membership, which are outside the scope of this study.
PwC 5
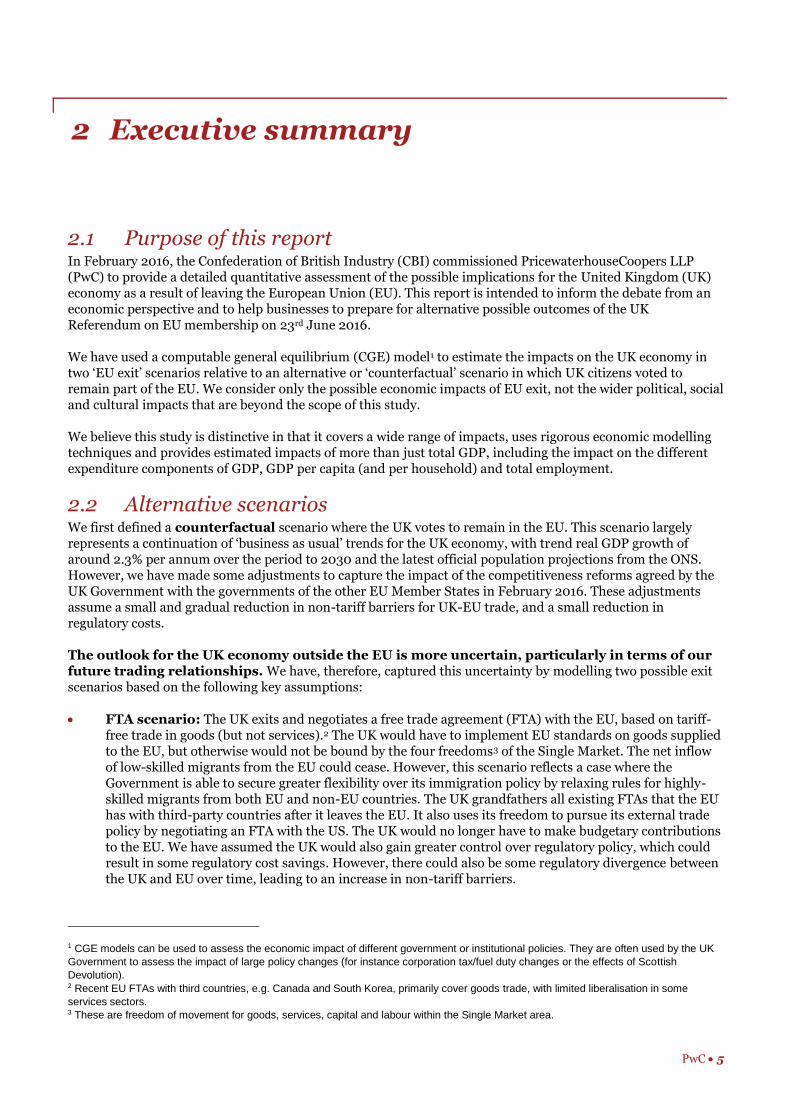
2.1 Purpose of this report In February 2016, the Confederation of British Industry (CBI) commissioned PricewaterhouseCoopers LLP (PwC) to provide a detailed quantitative assessment of the possible implications for the United Kingdom (UK) economy as a result of leaving the European Union (EU). This report is intended to inform the debate from an economic perspective and to help businesses to prepare for alternative possible outcomes of the UK Referendum on EU membership on 23rd June 2016.
We have used a computable general equilibrium (CGE) model1 to estimate the impacts on the UK economy in two ‘EU exit’ scenarios relative to an alternative or ‘counterfactual’ scenario in which UK citizens voted to remain part of the EU. We consider only the possible economic impacts of EU exit, not the wider political, social and cultural impacts that are beyond the scope of this study.
We believe this study is distinctive in that it covers a wide range of impacts, uses rigorous economic modelling techniques and provides estimated impacts of more than just total GDP, including the impact on the different expenditure components of GDP, GDP per capita (and per household) and total employment.
2.2 Alternative scenarios We first defined a counterfactual scenario where the UK votes to remain in the EU. This scenario largely represents a continuation of ‘business as usual’ trends for the UK economy, with trend real GDP growth of around 2.3% per annum over the period to 2030 and the latest official population projections from the ONS. However, we have made some adjustments to capture the impact of the competitiveness reforms agreed by the UK Government with the governments of the other EU Member States in February 2016. These adjustments assume a small and gradual reduction in non-tariff barriers for UK-EU trade, and a small reduction in regulatory costs.
The outlook for the UK economy outside the EU is more uncertain, particularly in terms of our future trading relationships. We have, therefore, captured this uncertainty by modelling two possible exit scenarios based on the following key assumptions:
FTA scenario: The UK exits and negotiates a free trade agreement (FTA) with the EU, based on tariff-free trade in goods (but not services).2 The UK would have to implement EU standards on goods supplied to the EU, but otherwise would not be bound by the four freedoms3 of the Single Market. The net inflow of low-skilled migrants from the EU could cease. However, this scenario reflects a case where the Government is able to secure greater flexibility over its immigration policy by relaxing rules for highly-skilled migrants from both EU and non-EU countries. The UK grandfathers all existing FTAs that the EU has with third-party countries after it leaves the EU. It also uses its freedom to pursue its external trade policy by negotiating an FTA with the US. The UK would no longer have to make budgetary contributions to the EU. We have assumed the UK would also gain greater control over regulatory policy, which could result in some regulatory cost savings. However, there could also be some regulatory divergence between the UK and EU over time, leading to an increase in non-tariff barriers.
1 CGE models can be used to assess the economic impact of different government or institutional policies. They are often used by the UK
Government to assess the impact of large policy changes (for instance corporation tax/fuel duty changes or the effects of Scottish
Devolution). 2 Recent EU FTAs with third countries, e.g. Canada and South Korea, primarily cover goods trade, with limited liberalisation in some
services sectors. 3 These are freedom of movement for goods, services, capital and labour within the Single Market area.
2 Executive summary

PwC 6
WTO scenario: The UK exits the EU and then trades with the EU on the World Trade Organisation’s (WTO) MFN basis, which means that the UK would no longer enjoy tariff-free trade in goods with the EU. The UK would not be bound by the EU four freedoms. The net inflow of low-skilled migrants from the EU could cease. However, unlike the FTA scenario, there is assumed to be no corresponding relaxation in immigration rules for high-skilled migrants from both EU and non-EU countries. The Government would gain greater control over regulatory policy, which could result in some regulatory cost savings. However, there could also be some regulatory divergence between the UK and EU over time, leading to an increase in non-tariff barriers. We also assume that current FTAs between the EU and third-party countries no longer apply to the UK once it exits the EU, and trade with those countries reverts to a WTO MFN basis between 2020 and 2026 until new arrangements are put in place. The UK could use its freedom to pursue its external trade policy by negotiating an FTA with the US, but we assume this takes longer than in the FTA scenario to come into force. The UK would no longer contribute to the EU budget.
It should be noted that post-exit trade arrangements with the EU (FTA vs WTO rules) are a key aspect of our modelled scenarios, but there are other assumptions included that are not specific to trade (as discussed in Section 2.3 below) and would not necessarily be related to the trade relationships that would exist following an exit.
We have also reviewed other widely discussed possible EU exit scenarios, including the UK becoming a member of the European Economic Area (EEA), with a relationship to the EU broadly similar to that of Norway, or agreeing a series of bilateral deals with the EU in a way broadly similar to Switzerland. We have not modelled these alternative scenarios, however, because they would seem inconsistent with many of the key arguments that have been put forward for voting to leave the EU, notably as regards continued free movement of labour between the UK and the rest of the EU.
2.3 Potential economic impacts of a UK withdrawal from the EU We identified five main potential impacts on the UK economy from a possible UK vote to leave the EU, and subsequent withdrawal from the EU. These are discussed in turn below.
1. Increase in uncertainty
In the short-term following a UK vote to leave the EU, there is likely to be significant economic and political uncertainty around the UK’s future relationship with other EU countries if the UK voted to leave the EU. This is because it would take at least two years, and perhaps more, before the post-exit relationship between the UK and the EU would be clarified in relation to trade and other matters.
This uncertainty would be likely to manifest itself in increased financial market and exchange rate volatility, higher risk premia in credit and equity markets, and possible consequential impacts on business confidence and investment.
Some of this could be offset by some positive sentiment around whether the UK would become more
prosperous outside of the EU, but this is not considered to be the most likely outcome. Therefore, we would still expect uncertainty to have a negative impact on GDP.
2. Lower levels of trade and investment
At present, UK businesses are able to export goods tariff-free to other EU Member States. Similarly, businesses in other EU countries can export goods to the UK tariff-free. The EU is still the largest export market for UK goods and services, although its share of total UK exports has fallen from around 55% in 1999 to around 45% in 2014. On the other hand, the UK accounts for around a tenth of EU exports.
The UK’s total stock of inward FDI has grown steadily over time since accession to the EU, amounting to around £1 trillion in 2014.
The UK could face an increase in tariffs and/or non-tariff barriers (NTBs) to trade with the EU following exit from the EU, depending on the nature of the post-exit negotiated arrangement with the EU.
An increase in trade barriers would be likely to have a knock-on impact on investment and, in particular, foreign direct investment (FDI), as EU market access restrictions may lower the returns to investment in the UK.
PwC 7
3. Reduction in migration in to the UK
Free movement of labour is one of the four fundamental freedoms of the EU, allowing EU nationals to move between and reside freely in other Member States.
The inflow of EU nationals into the UK has more than doubled since the 2004 EU enlargement4 and individuals born in other EU Member States now account for around 6% of people in employment in the UK.
Following the UK’s exit from the EU, restrictions could be placed on immigration to the UK from the EU (and vice versa), in particular on the inflow of lower skilled labour.
4. Reduction in regulation
If the UK left the EU, it would no longer be bound by regulations originating from the EU which could create some scope for deregulation and a potential reduction in regulatory costs.
Regulation is usually intended to address market failures, such as monopoly power, externalities or to provide public goods. The potential savings from reducing regulatory costs could, however, be relatively limited once the foregone benefits of regulations are taken into account. In addition, the UK may have limited scope to change those regulations that have been largely driven by global initiatives following the UK’s exit from the EU.
5. Reduction in fiscal contributions
All EU Member States are required to make a financial contribution to the EU budget. From 2010 to 2015, the UK’s average annual gross contribution to the EU amounted to around £16.8 billion. However, the UK also receives a rebate and funding from the EU in the form of farming subsidies and funding from rural and regional development programmes and other EU initiatives. This means that the UK’s average annual net contribution to the EU budget over these same years is estimated to be around £8.8 billion, or around 0.5% of GDP.
If the UK leaves the EU, the UK would no longer be required to make budgetary contributions (unless
these were part of a negotiated bilateral deal, though this is not a feature of the scenarios we have modelled). It would, however, also cease to receive funding from the EU (e.g. in relation to the Common Agricultural Policy and research and development).
2.4 Estimated economic impacts in alternative EU exit scenarios Based on our modelling of the five types of impact discussed above, we estimate that the level of real (i.e. adjusted for inflation) UK GDP in 2030 could be around 1.2% lower in the FTA exit scenario than in the counterfactual (i.e. without an EU exit) and around 3.5% lower in the WTO exit scenario. After adjusting for population changes in the different scenarios, we estimate that average real GDP per capita could be between 0.8 and 2.7% lower in 2030 in the two scenarios. We looked at the impacts over the period to 2030 as this is a time horizon over which the short-term uncertainty relating to post-exit arrangements should have largely dissipated and the UK economy would have had time to adapt to a new relationship with EU countries.
As set out in Table 2.1, these longer term impacts on real GDP are driven primarily by trade and migration effects. Limitations on free access to the EU Single Market, and the resulting tightening in trade terms with the EU, would be expected to reduce exports and GDP. The migration impacts could lead to a lower number of working individuals in the UK, which would have a negative impact on GDP, although the effect on GDP per capita would be smaller as shown in the final row of Table 2.1
The estimated impacts vary over time as illustrated in Figure 2.1 and Figure 2.2. There is a significant short-term impact of around 3% to 5.5% of GDP by 2020 due in large part to the effect of uncertainty, and then a longer term impact of between around 1.2% and 3.5% on GDP in 2030 once the initial impact of uncertainty has faded away.
4 2004 enlargement countries were Cyprus, the Czech Republic, Estonia, Hungary, Latvia, Lithuania, Malta, Poland, Slovakia and Slovenia.

PwC 8
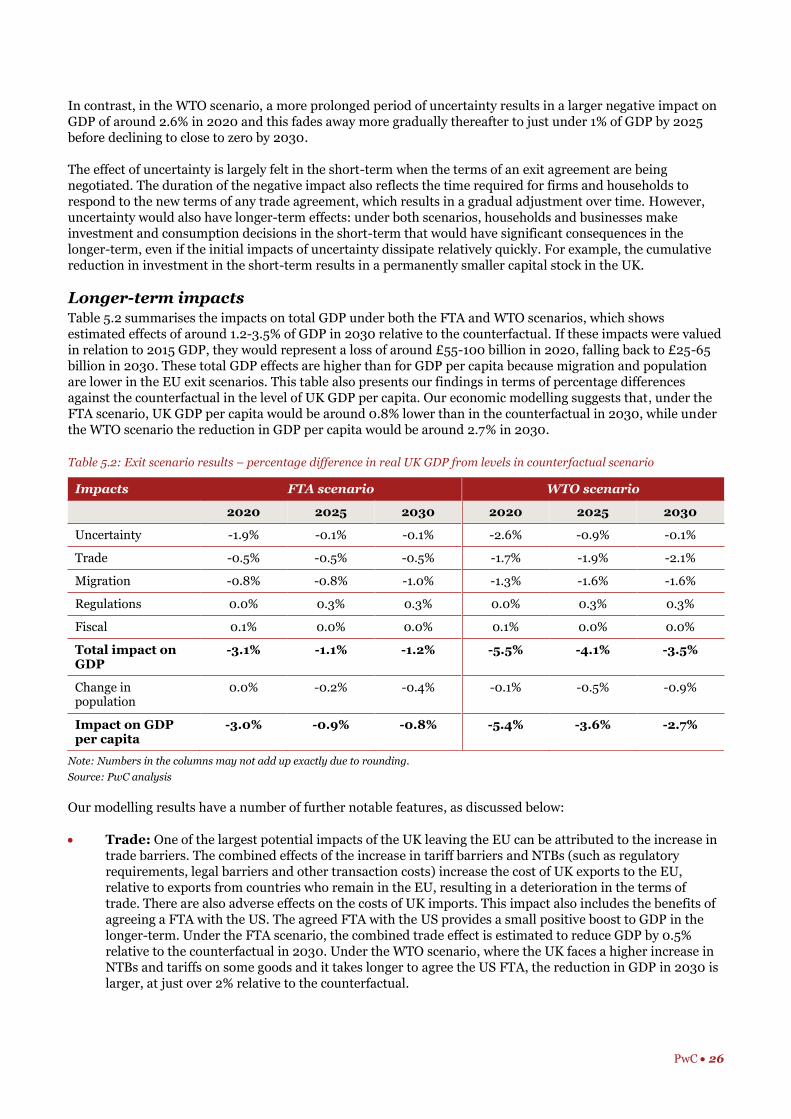
Table 2.1: Exit scenario results – percentage difference in real UK GDP from levels in counterfactual scenario
Impacts FTA scenario WTO scenario
2020 2025 2030 2020 2025 2030
Uncertainty -1.9% -0.1% -0.1% -2.6% -0.9% -0.1%
Trade -0.5% -0.5% -0.5% -1.7% -1.9% -2.1%
Migration -0.8% -0.8% -1.0% -1.3% -1.6% -1.6%
Regulations 0.0% 0.3% 0.3% 0.0% 0.3% 0.3%
Fiscal 0.1% 0.0% 0.0% 0.1% 0.0% 0.0%
Total impact on GDP -3.1% -1.1% -1.2% -5.5% -4.1% -3.5%
Change in population 0.0% -0.2% -0.4% -0.1% -0.5% -0.9%
Impact on GDP per capita -3.0% -0.9% -0.8% -5.4% -3.6% -2.7%
Note: Numbers in the columns may not add up exactly due to rounding.
Source: PwC analysis.
Figure 2.1: FTA scenario results – percentage difference from the level of real UK GDP in the counterfactual
Source: PwC analysis
Figure 2.2: WTO scenario results – percentage difference from the level of real UK GDP in the counterfactual
Source: PwC analysis
-6.0%
-5.0%
-4.0%
-3.0%
-2.0%
-1.0%
0.0%
1.0%
2015 2016 2017 2018 2019 2020 2021 2022 2023 2024 2025 2026 2027 2028 2029 2030
Fiscal Regulation Uncertainty Trade barriers Migration Total
-6.0%
-5.0%
-4.0%
-3.0%
-2.0%
-1.0%
0.0%
1.0%
2015 2016 2017 2018 2019 2020 2021 2022 2023 2024 2025 2026 2027 2028 2029 2030
Fiscal Regulation Uncertainty Trade barriers Migration Total

PwC 9
We discuss below our estimates for each of the different types of potential economic impact:
Uncertainty: A vote to leave the EU would create economic and political uncertainty that could last for several years while the UK Government negotiates the terms of its exit from the EU as well as new trade arrangements with non-EU countries. This uncertainty is modelled through increased risk premia on the cost of capital that are estimated to have the largest economic impact in the short-term, with UK GDP around 2-2.5% lower in 2020 in the two scenarios due to uncertainty. However, by 2030, this impact should have almost entirely reduced as we assume the terms of the UK’s post-exit relationship with the EU and other countries would by then have been agreed and had time to bed down.
Trade: Under the WTO scenario our model estimates suggest that UK GDP could be more than 2% lower than in the counterfactual in 2030 due to the combined trade impact, but this would reduce to around 0.5% of GDP in the FTA scenario.
Migration: The introduction of tighter restrictions on migration is estimated to reduce UK GDP by around 1-1.6% of GDP in the two scenarios due to reduced labour supply. This will particularly impact sectors which are heavily dependent on low-skilled migrant workers at present, such as agriculture, food and accommodation services.
Regulatory and fiscal impacts: The potential post-exit benefits of reducing regulatory costs are estimated to be relatively small in macroeconomic terms at around 0.3% of GDP in 2030 in the two scenarios. This effect reflects cost savings for businesses, particularly in sectors that are relatively labour- and energy-intensive. These impacts are small due to leakages from the domestic economy (i.e. some of the benefits of lower regulatory costs flow outside the UK), as well as due to adjustment costs in response to regulatory changes. This has the effect of reducing some of the benefits from regulatory cost savings. There are also some benefits to GDP from lower EU contributions, but these are also relatively modest once the knock-on impacts of these changes in fiscal flows are taken into account through our model.
In both exit scenarios, the largest effect on GDP comes through investment, particularly in the short-term due to the assumed heightened degree of uncertainty following a vote to leave the EU. Under the FTA scenario, investment falls by over 16% by 2020, while under the WTO scenario, investment falls by over 25% by 2020 relative to the counterfactual.
It is also important, however, to recognise that the total size of the UK economy in 2030, and average income levels per capita, would be considerably larger than today. Specifically, our model estimates suggest that:
Total real UK GDP could be around 36-39% higher in 2030 than in 2015 in the two exit scenarios, as compared to a cumulative GDP rise of around 41% in our counterfactual scenario where the UK remains in the EU.
Average real GDP per capita in 2030 could be around 25-28% higher than in 2015 in the two exit scenarios, as compared to around 29% if the UK remains in the EU.
Estimated impacts on employment levels
The reduction in economic output and activity associated with a potential UK exit from the EU results in a negative impact on demand and investment, which leads to a reduction in employment. In the short-term, our results suggest that employment levels fall by between 1.7% and 2.9% in the two scenarios relative to the counterfactual in 2020, but this effect gradually reduces in the long-term. Our model estimates suggest that total employment in 2030 could be between 350,000 and 600,000 lower relative to the counterfactual case in the FTA and WTO exit scenarios respectively. A significant proportion of these impacts are accounted for by the reduction in labour supply due to the reduction in migration inflows, but others reflect the effects of increased trade barriers on economic activity more generally.
Limitations and uncertainties relating to our approach and model estimates
The report aims to inform the debate from an economic perspective and does not cover the wider political, social and cultural impacts of an exit from the EU that have been discussed in the public debate on EU membership, which are outside the scope of this study.

PwC 10
Within this economic approach, all economic model estimates are subject to uncertainties and this is particularly true when assessing such a complex and unprecedented possible event as the UK leaving the EU. Our estimates should, therefore, only be taken as indicative of the broad direction and magnitude of the potential economic impacts of alternative UK exit scenarios.
Also, we have only modelled two possible exit scenarios: many other variants would be possible in practice as regards, for example, post-exit trade arrangements, immigration regimes and regulatory regimes outside the EU.
Our FTA scenario also assumes fairly ambitious achievements, including significant changes in migration policy in order to attract inflows of high-skilled workers to the UK. The assumption that the UK would be able to accelerate negotiations with the US (potentially on the back of existing TTIP negotiations) in time for an FTA to be implemented in 2021 is similarly ambitious.
In contrast, the WTO scenario reflects a relatively unfavourable outcome from a labour supply perspective where the UK does not allow any increase in high-skilled migration. However, we also note that the regulatory savings modelled in this scenario could be relatively optimistic as it may not be politically or socially desirable to ease or repeal all of the social, employment and environmental and climate change regulations as assumed in our modelling.
Our modelling also assumes no significant changes in the global macroeconomic outlook that would affect the UK economy in a materially different way depending on whether the UK remains in or leaves the EU. As is widely acknowledged, there are currently some material risks to the global economy, such as a more marked slowdown in the Chinese economy and escalating problems in commodity-exporting economies, which could affect the UK’s future growth prospects in a significant way. But, in general, these would apply whether the UK remains within or chooses to leave the EU.5
Our study also does not cover potential structural changes to the economy, or any potential political knock-on impacts of the UK voting to leave the EU. This could include the possibility of a second referendum on Scottish independence after a vote to leave the EU in the UK that was not matched in Scotland, or reactions from other EU Member State governments or the governments of countries outside the EU, beyond what we have explicitly modelled in terms of future trade arrangements or cost of capital risk premia related to post-exit uncertainty.
These limitations on the scope of the study should be borne in mind when interpreting the results.
5 For example, by the OBR in their Economic and Fiscal Outlook report, March 2016, as well as in recent economic analyses by the IMF,
the OECD and leading central banks.

PwC 11
In this section, we outline the approach we have used to derive our results and the timeline we have assumed in our modelling.
3.1 Our analytical approach We focused on three steps in our analytical approach:
1. Identification of possible EU exit scenarios: We identified a set of exit scenarios to be modelled, based on our assessment of the alternative options that have been discussed in the public debate on the possible outcomes of the EU referendum, as well as a counterfactual scenario for the case where the UK votes to remain a member of the EU. These scenarios are set out in more detail in Section 4.
2. Analysis of the impacts on the UK economy: To inform our analysis, we conducted a comprehensive review and critical assessment of the existing evidence. Based on this, we identified various ways through which a potential UK exit from the EU could result in economic impacts. Our analysis also seeks to address the evidence gaps identified in existing studies, in particular by considering the economic impacts of changes to migration and the regulatory environment following a potential UK exit from the EU. Figure 3.1 provides an overview of the potential impacts of an EU exit.
Figure 3.1: Potential impacts of an EU exit
Source: PwC analysis
3. Modelling of the impacts using a computable general equilibrium (CGE) model: We modelled the impact of UK exit from the EU by changing various policy or macroeconomic levers that are available in the model to simulate the economic impacts of a UK exit from the EU. The model inputs are informed by our review of existing quantitative evidence for each of the channels through which a UK exit from the EU could impact the UK economy. The results of this modelling are set out in Section 5 of the report, while Annexes B to F provide further detail on each potential policy impact.
Initial impacts Impact on markets Impact on economy
Uncertainty Product Output and productivity
Trade
Migration Labour Employment
Regulations
Fiscal Capital Public finances
3 Overview of our approach

PwC 12
3.2 Our CGE modelling approach Introduction to the CGE model The analytical tool used in this report is a Computable General Equilibrium (CGE) model of the UK economy (see Annex A for further details). CGE models are often used to assess the impact of different government or institutional policies, or to investigate the effects of significant economic events. They are used widely by international institutions such as the World Bank, IMF and OECD as well as the UK Government.
A CGE model combines economic data and a complex system of equations in order to capture the interactions of the three main elements in an economy – households, businesses and the government (See Figure 3.2 for more detail). Each element is defined and linked through labour market or capital market flows, household consumption, intermediate product demand, taxes or government transfers.
Our model features the supply chain interactions of different industries in the economy based on the 2014 Supply and Use Tables for the UK compiled by the Office for National Statistics (ONS). The model also enables us to account explicitly for the impact of trade relationships, which is important as it is likely that trade flows could change significantly following a UK exit from the EU. Our CGE model allows us to project the impact of a UK exit from the EU on a range of different macroeconomic variables, including GDP (and GDP per capita), employment, household consumption, exports, imports and investment.
The model that we use is broadly consistent with the approaches used by HM Treasury (HMT) and HM Revenue and Customs (HMRC) to model the impact of large policy changes. The relationships within the CGE model are calibrated based on actual historical economic data.
Figure 3.2: Economic interactions in the CGE model
Source: PwC
3.3 Timelines for modelling economic impacts The timelines involved if the UK were to exit the EU are highly uncertain as there is no precedent for a country leaving the EU under current Treaty arrangements6. However, we have outlined an indicative timeline in Figure 3.2 below based on available public information. We assume that:
In the event of a vote to leave in the June 2016 referendum, the UK Government would notify the European Council of its intention to exit the EU, as set out in the provisions of Article 50 of the Lisbon Treaty, and a withdrawal agreement would start to be negotiated between the EU and the UK.
6 Greenland did leave the European Economic Community in 1985, but the circumstances were very different from those facing the UK in
the event of a possible exit from the EU in 2016, so this does not provide a useful comparator.
Government
Household Companies (local and multi-national)
Companies (local and multi-national)
Transfers
Taxes
Subsidies
Taxes
Labour and investment
Goods and services, and wage income
Companies purchasegoods and services from one another
Companies determine the level of production by
maximising profit

PwC 13
The agreement would then be approved by the Council, acting by qualified majority, after obtaining the consent of the European Parliament.
The EU treaties would then cease to apply from the date of the agreement, or failing that, within two years of the initial notice. However, this could go on for a longer period if there is unanimous agreement amongst the remaining 27 Member States to extend the negotiation period. There is considerable uncertainty around how long the formal exit process would last. For example, the UK Government has suggested that negotiating trade agreements can take up to ten years or more so a two-year period could be relatively optimistic.7
Figure 3.3: Timeline for possible exit negotiations
Source: PwC analysis
Based on this indicative timetable, we have assumed that the transitional period while an exit is negotiated would run from mid-2016 until the end of 2019, culminating in a formal exit in 2020. A shorter or longer period is possible, but we need to make a concrete assumption for modelling purposes and this seems reasonable based on the available information. We have considered two main time periods within our analysis:
A short-term transition period between 2016 and the end of 2019, during which an exit agreement is negotiated between the UK and the EU. The UK is likely to experience political and economic uncertainty over this period as to the outcome of the exit negotiations. We simulate the impacts of uncertainty using a change in the credit risk premium, which feeds into the CGE model as a cost of capital impact that applies to both debt and equity.
A longer-term period between 2020 and 2030 where we examine the long-term impacts of alternative EU exit scenarios. We expect that, during this period, the impact of uncertainty would fade away as greater clarity emerges over the status of the UK’s post-exit economic and trading relationships with the EU and other trading partners. The EU treaties would cease to apply formally to the EU from this point onwards, which is when changes to the UK’s relationship with the EU (e.g. change in tariffs and NTBs, changes to migration, regulations and fiscal contributions) would take effect.
7 Cabinet Office (2016b).
June 2016UK holds referendum on EU membership
2016The UK gives two years notice to leave the EU under Article 50
2017-2018UK negotiates the terms of its exit with the EU
2019 onwardsThe UK and EU continue to work towards the UK’s formal exit
2020 onwardsThe UK is no longer a member of the EU
PwC 14
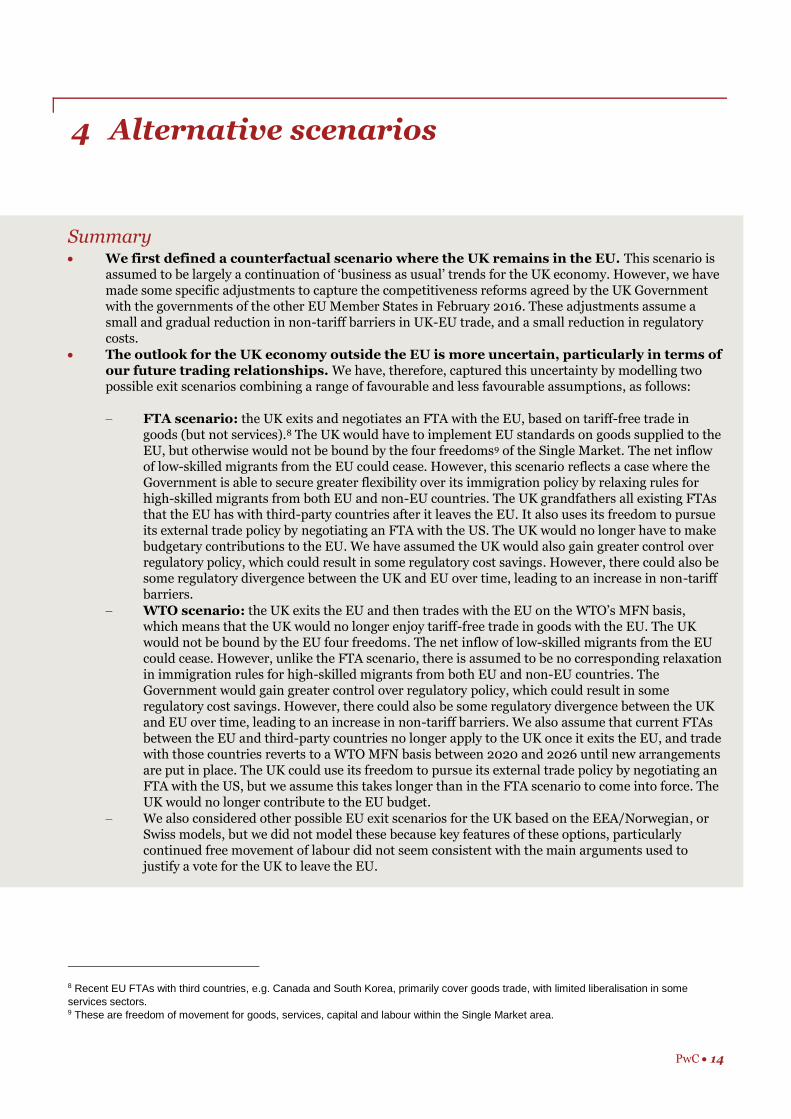
Summary We first defined a counterfactual scenario where the UK remains in the EU. This scenario is
assumed to be largely a continuation of ‘business as usual’ trends for the UK economy. However, we have made some specific adjustments to capture the competitiveness reforms agreed by the UK Government with the governments of the other EU Member States in February 2016. These adjustments assume a small and gradual reduction in non-tariff barriers in UK-EU trade, and a small reduction in regulatory costs.
The outlook for the UK economy outside the EU is more uncertain, particularly in terms of our future trading relationships. We have, therefore, captured this uncertainty by modelling two possible exit scenarios combining a range of favourable and less favourable assumptions, as follows:
FTA scenario: the UK exits and negotiates an FTA with the EU, based on tariff-free trade in goods (but not services).8 The UK would have to implement EU standards on goods supplied to the EU, but otherwise would not be bound by the four freedoms9 of the Single Market. The net inflow of low-skilled migrants from the EU could cease. However, this scenario reflects a case where the Government is able to secure greater flexibility over its immigration policy by relaxing rules for high-skilled migrants from both EU and non-EU countries. The UK grandfathers all existing FTAs that the EU has with third-party countries after it leaves the EU. It also uses its freedom to pursue its external trade policy by negotiating an FTA with the US. The UK would no longer have to make budgetary contributions to the EU. We have assumed the UK would also gain greater control over regulatory policy, which could result in some regulatory cost savings. However, there could also be some regulatory divergence between the UK and EU over time, leading to an increase in non-tariff barriers.
WTO scenario: the UK exits the EU and then trades with the EU on the WTO’s MFN basis, which means that the UK would no longer enjoy tariff-free trade in goods with the EU. The UK would not be bound by the EU four freedoms. The net inflow of low-skilled migrants from the EU could cease. However, unlike the FTA scenario, there is assumed to be no corresponding relaxation in immigration rules for high-skilled migrants from both EU and non-EU countries. The Government would gain greater control over regulatory policy, which could result in some regulatory cost savings. However, there could also be some regulatory divergence between the UK and EU over time, leading to an increase in non-tariff barriers. We also assume that current FTAs between the EU and third-party countries no longer apply to the UK once it exits the EU, and trade with those countries reverts to a WTO MFN basis between 2020 and 2026 until new arrangements are put in place. The UK could use its freedom to pursue its external trade policy by negotiating an FTA with the US, but we assume this takes longer than in the FTA scenario to come into force. The UK would no longer contribute to the EU budget.
We also considered other possible EU exit scenarios for the UK based on the EEA/Norwegian, or Swiss models, but we did not model these because key features of these options, particularly continued free movement of labour did not seem consistent with the main arguments used to justify a vote for the UK to leave the EU.
8 Recent EU FTAs with third countries, e.g. Canada and South Korea, primarily cover goods trade, with limited liberalisation in some
services sectors. 9 These are freedom of movement for goods, services, capital and labour within the Single Market area.
4 Alternative scenarios

PwC 15
In this section, we:
Define the counterfactual scenario in which the UK remains a member of the EU, which we use as a comparator for the EU exit scenarios in the modelling we have undertaken; and
Describe the scenarios we have considered in our modelling in more detail.
4.1 Counterfactual scenario Our analysis estimates the economic impact of the UK’s potential exit from the EU by comparing it to the outcome that would arise if the UK remained part of the EU (i.e. the counterfactual). This scenario is assumed to be largely a continuation of ‘business as usual’ trends for the UK economy. There are likely to be longer-term impacts of the reformed EU deal that was agreed by the UK Government with other EU Member States at the European Council meeting on the 18th and 19th February, but it is difficult to reflect the long-term benefits of all aspects of the deal within the modelling, particularly in the areas of economic governance, sovereignty and welfare and free movement. However, we have made some specific adjustments to capture the competitiveness reforms. These adjustments assume a small and gradual reduction in non-tariff barriers in UK-EU trade, and a small reduction in regulatory costs.
Our counterfactual scenario uses the following real GDP growth projections that are based on our latest UK Economic Outlook report in the short-term and our World in 2050 model beyond 2020.10 These projections are also broadly in line with historical average UK GDP growth rates since 1970.11
We have also set out our assumptions regarding employment levels (i.e. the number of people employed) under the counterfactual case in Table 4.1.
Table 4.1: Trend GDP and employment assumptions under the counterfactual scenario
Year GDP growth p.a.* Employment (millions)
2015 2.2% 30.3
2020 2.3% 32.2
2025 2.3% 33.1
2030 2.3% 34.5
Source: PwC assumptions
*2020, 2025 and 2030 figures are 5-year averages ending in these years.
4.2 Potential exit options for the UK There is considerable uncertainty around what the UK’s relationship with the EU might look like if the outcome of the referendum is a vote to leave.
In this section, we set out four alternative options which have been put forward that the UK could pursue in the event of a leave vote. These are summarised in Table 4.2.
1. UK-EU free trade agreement (FTA).
2. A ‘WTO’ scenario.
3. Membership of the European Economic Area (EEA).
4. Bespoke bilateral deals – Swiss option.
10 PwC “UK Economic Outlook (March 2016)” and PwC (2015) “The World in 2050”. 11 As discussed above, we have not explicitly factored in changes in the growth rate as a result of the reformed EU deal within our
counterfactual scenario as these are difficult to determine at this stage. However, we note that there could be some growth impacts that
could arise from the deal over the longer-term.

PwC 16
Table 4.2: Possible scenarios for the UK leaving the EU
UK-EU Free trade agreement (FTA)
WTO EEA membership (similar to Norway)
Bespoke bilateral deals (similar to Switzerland)
Access to single market
Medium - UK would retain free trade in goods with the EU, but non-tariff barriers such as divergence in standards and regulations could emerge
Low High – EEA countries have access to the Single Market
Medium – the Swiss agreements cover trade in goods but not in services.
Influence over EU regulations
No No Some – no voting rights but limited formal engagement. Some autonomy in other areas
No
Application of EU regulations and directives
The UK would have to comply with EU regulations around the goods covered by the FTA
Technically no, but product exports to the EU would still need to meet EU product standards.
Yes, including social and labour law (Working Time Directive)
Technically no, but required in practice if domiciling in other territories (e.g. Swiss banks operating out of UK)
Contribution to EU budget
No No Yes, but smaller Yes, but smaller
Independent immigration policy
Yes Yes No – all four freedoms retained
Some autonomy, but Switzerland cannot restrict EU immigration
Independent trade policy
Yes – UK may negotiate FTAs with other countries
Yes – UK may negotiate FTAs with other countries in financial services and other services
Yes – UK may negotiate free trade agreements (FTA) with other countries
Yes – UK may negotiate FTAs with other countries
Source: PwC analysis
More details around each of these scenarios are provided below. This is not an exhaustive list, and many sub-variants are possible within these four broad options, but it covers the main spectrum of options discussed in the EU membership debate thus far. We begin by discussing the two variants we have modelled (FTA and WTO) and then consider the other two options and explain why we chose not to include these in our quantitative modelling exercise.
UK-EU free trade agreement The UK could aim to negotiate a free trade agreement (FTA) with the EU upon exit. Across the world, FTAs vary greatly, both in terms of their coverage and ambition. An FTA would allow the UK to trade with the EU with reduced tariffs on goods. However, there would still be non-tariff barriers on both goods and services to a greater degree than if the UK had remained in the EU Single Market.
If the UK entered into a FTA with the EU, the UK would have to implement EU standards on goods supplied to the EU, but would otherwise have greater freedom in implementing its own regulatory policy. Historical FTAs with the EU (e.g. the EU-Canada CETA and EU-South Korea FTA) usually mainly cover goods but can include limited liberalisation in some services sectors.

PwC 17
We assume that the UK would not be bound by the four freedoms of the Single Market in this scenario (other than in relation to required standards for free trade in goods). Similarly, the UK would not be bound by EU policies such as the Common Agricultural Policy and Common Fisheries Policy.
Trade agreements often take years to negotiate and implement. For example, the EU FTA with South Korea took four years to conclude, and the EU’s negotiations with Canada concluded in 2014 after seven years of talks, although the agreement has not yet come in to force. The EU also currently holds trade agreements with 53 countries. If the UK left the EU, it may not remain party to these and may have to renegotiate agreements with these third-party countries.
A ‘’WTO’ scenario Another potential exit scenario is that the UK would revert to conducting trade with the EU under the rules of the World Trade Organisation. This means that exporters would be subject to the EU’s common external tariffs for WTO members on a MFN basis for trade in goods. Moreover, the UK is likely to face non-tariff barriers in the cross-border provision of services, including financial services. It would no longer be bound by the four freedoms and would no longer have to make fiscal contributions to the EU. The UK would also have complete control over its external trade policy and would be able to pursue its own trade deals with other economies.
Leaving the EU under this scenario would see the UK lose access to the Single Market. Tariffs on UK’s goods exports to the EU would increase from zero to MFN rates, while imports from the EU would become more expensive should the UK impose tariffs on goods imports from the EU.
Membership of the European Economic Area (EEA) This option would see the UK leave the EU but become a member of the EEA, which consists of the 28 EU Member States and three non-EU Member States - Norway, Liechtenstein and Iceland.
Under this scenario, the UK would largely retain access to the Single Market and would, therefore, maintain most of its economic and trading relations with the EU. For example, Norway has extensive, but not full, access to the Single Market.12 The UK would also remain bound by the four freedoms of the Single Market (i.e. freedom of movement of goods, services, labour and capital) and would continue to make contributions to the
EU budget (estimated to be 91% of the current levels of the UK’s contribution).13 Furthermore, the UK would
have to continue to implement EU legislation that relates to the areas of the Single Market that the UK still has access to. EEA Member States have the right to participate in expert groups and committees in the early stages of a legislative proposal, however, they cannot vote on legislation in the European Council or European Parliament. The UK would, therefore, lose formal access to the EU decision making process under this scenario.
However, the UK would no longer be bound by the Common Agricultural and Fisheries Policies and could, therefore, determine its own approach to these policy areas. Additionally, the UK would no longer be required to conform with the rest of the EU in other policy areas, such as regional policy or judicial co-operation.
Bespoke bilateral deals – Swiss option Switzerland engages with the EU through a series of bespoke bilateral deals that cover trade in goods but not in services. In order to maintain access and alignment with the Single Market, Switzerland has adopted legislation in parallel to the EU and adjusted some domestic legislation to meet EU requirements.
Striking a similar deal to Switzerland would mean that the UK would continue to have tariff-free access to the EU goods market. However, in order to gain this access, the UK would need to ensure that it aligns domestic legislation with that of the EU and adopts some of the rules governing the Single Market.14 The UK would have little to no influence in the composition or evolution of these rules. The Swiss option would also mean that the
12 Norway is outside the Common Agriculture Policy and Common Fisheries Policy which means that it does not trade freely in these
sectors. The EU also applies its ‘rules of origin’ to trade with Norway. This means that if a Norwegian firm exports goods which contain a
high proportion of content produced by non-EU countries to the EU, tariffs are applied by the EU countries. 13 These estimates from the Centre for European Reform assume that UK contributions would be made at the same proportion of GDP as
current Norwegian contributions. Source: Centre for European Reform (June 2014). 14A study by the University of Kent for the City of London estimates that around 40% of Swiss legislation is derived from EU rules. See
University of Kent Centre for Swiss Politics (2013).
PwC 18
freedom of movement of people would continue to apply. Additionally, the UK would contribute to the EU
Budget, though this would be a smaller amount than it would pay under the EEA membership scenario.15
One feature of this option is that the UK would be able to pursue its own external trade agenda i.e. trade outside of the EU, unrestricted by the need to conduct trade policy as part of the wider EU. The Swiss currently have an agreement for free trade in goods but have been unable to reach a free trade in services agreement.16 This could mean restrictions on UK exports in services, including financial services which make up a large part of the UK economy.
The relationship between the EU and Switzerland has evolved over decades with complex bilateral agreements now in place. Agreeing a similar set of deals could take a long time - it took around ten years for Switzerland and the EU to put in place the agreements that currently exist between them.
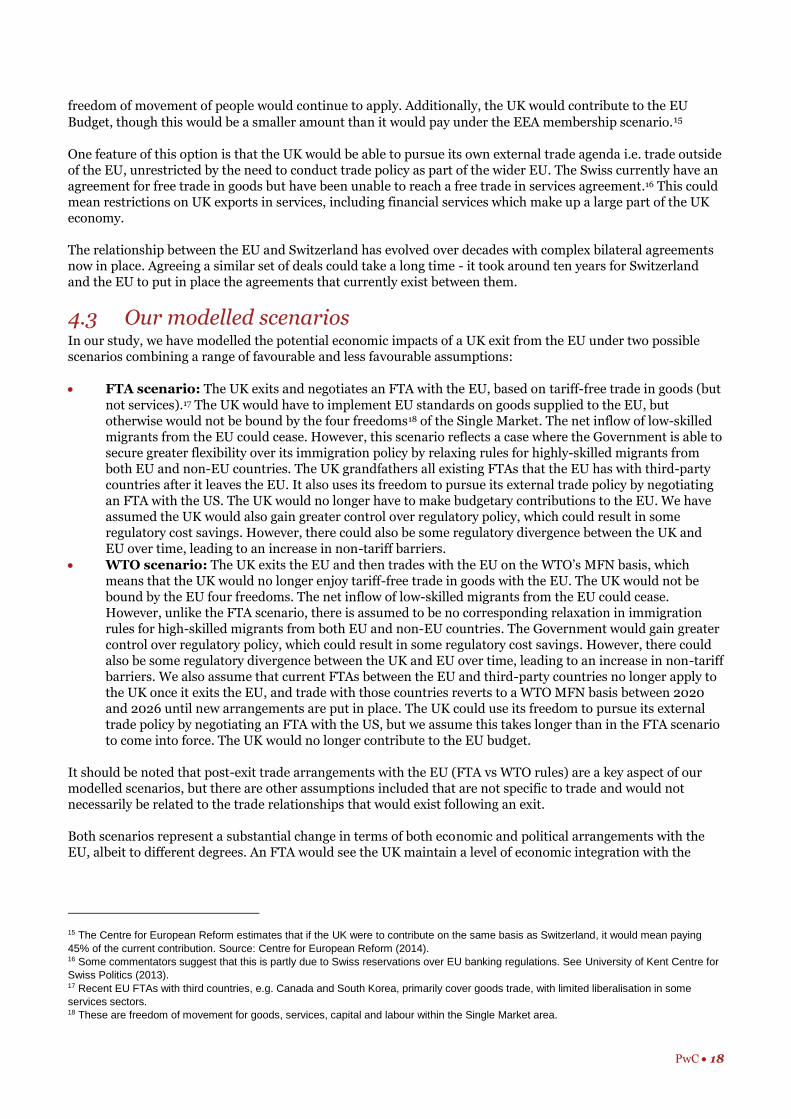
4.3 Our modelled scenarios In our study, we have modelled the potential economic impacts of a UK exit from the EU under two possible scenarios combining a range of favourable and less favourable assumptions:
FTA scenario: The UK exits and negotiates an FTA with the EU, based on tariff-free trade in goods (but
not services).17 The UK would have to implement EU standards on goods supplied to the EU, but otherwise would not be bound by the four freedoms18 of the Single Market. The net inflow of low-skilled migrants from the EU could cease. However, this scenario reflects a case where the Government is able to secure greater flexibility over its immigration policy by relaxing rules for highly-skilled migrants from both EU and non-EU countries. The UK grandfathers all existing FTAs that the EU has with third-party countries after it leaves the EU. It also uses its freedom to pursue its external trade policy by negotiating an FTA with the US. The UK would no longer have to make budgetary contributions to the EU. We have assumed the UK would also gain greater control over regulatory policy, which could result in some regulatory cost savings. However, there could also be some regulatory divergence between the UK and EU over time, leading to an increase in non-tariff barriers.
WTO scenario: The UK exits the EU and then trades with the EU on the WTO’s MFN basis, which means that the UK would no longer enjoy tariff-free trade in goods with the EU. The UK would not be bound by the EU four freedoms. The net inflow of low-skilled migrants from the EU could cease. However, unlike the FTA scenario, there is assumed to be no corresponding relaxation in immigration rules for high-skilled migrants from both EU and non-EU countries. The Government would gain greater control over regulatory policy, which could result in some regulatory cost savings. However, there could also be some regulatory divergence between the UK and EU over time, leading to an increase in non-tariff barriers. We also assume that current FTAs between the EU and third-party countries no longer apply to the UK once it exits the EU, and trade with those countries reverts to a WTO MFN basis between 2020 and 2026 until new arrangements are put in place. The UK could use its freedom to pursue its external trade policy by negotiating an FTA with the US, but we assume this takes longer than in the FTA scenario to come into force. The UK would no longer contribute to the EU budget.
It should be noted that post-exit trade arrangements with the EU (FTA vs WTO rules) are a key aspect of our modelled scenarios, but there are other assumptions included that are not specific to trade and would not necessarily be related to the trade relationships that would exist following an exit.
Both scenarios represent a substantial change in terms of both economic and political arrangements with the EU, albeit to different degrees. An FTA would see the UK maintain a level of economic integration with the
15 The Centre for European Reform estimates that if the UK were to contribute on the same basis as Switzerland, it would mean paying
45% of the current contribution. Source: Centre for European Reform (2014). 16 Some commentators suggest that this is partly due to Swiss reservations over EU banking regulations. See University of Kent Centre for
Swiss Politics (2013). 17 Recent EU FTAs with third countries, e.g. Canada and South Korea, primarily cover goods trade, with limited liberalisation in some
services sectors. 18 These are freedom of movement for goods, services, capital and labour within the Single Market area.

PwC 19
Single Market, whereas assuming WTO rules would mean that the UK would have no preferential access to the Single Market.
We have not modelled the other two alternative scenarios presented above for the following reasons:
EEA membership would see the UK largely retaining the main elements of its current relationship with the EU, including access to the Single Market, implementation of the four freedoms and budgetary contributions (albeit at a smaller level than full EU membership). Therefore, the economic impact of this outcome would probably not be fundamentally different from the outcome which would be expected if the UK were to remain part of the EU. Such an arrangement would not address any of the main arguments that have been put forward for the UK leaving the EU, notably as regards restricting free movement of people into the UK, increasing UK sovereignty in relation to laws and regulations now set at EU level, or saving on net contributions to the EU budget. As such, while we cannot entirely rule it out, this does not seem likely to be a politically acceptable outcome in the event of a UK vote to leave the EU.
The option of agreeing a series of bilateral deals similar to those that exist between Switzerland and the EU could see the UK maintain access to the Single Market in goods (but not for services), continued implementation of the free movement of labour and making a smaller budgetary contribution to the EU. However, the series of bilateral agreements between Switzerland and the EU are complex and both sides have questioned the viability of the model. Also, this model has developed as an exception over time, tailored to the particular circumstances of Switzerland, with the aim of driving gradual integration with the EU. So it is not clear if this would be an appropriate or realistic option for the UK if it chose to leave the EU, which would be a move in the opposite direction. It is, therefore, unlikely that the UK could reach a similar agreement with the EU.
In summary, both EEA membership and the Swiss option appear to be inconsistent with the main arguments of the campaign for the UK to leave the EU, including the obligation to make budgetary contributions and, in particular, continued implementation of the free movement of labour. While we cannot entirely rule them out, they do not seem likely to be politically acceptable outcomes following a vote to leave the EU. We have, therefore, focused on the FTA option (which has some elements of the Swiss model but without free movement of labour or EU contributions) as well as the limit case of the WTO option.
Table 4.3 describes both the FTA and WTO scenarios for each of the main impacts. The form and scale of our modelled impacts are informed by our review of the existing evidence around how they could impact the economy following a decision to leave the EU and our own additional analysis for this study, particularly in the areas of trade, migration and uncertainty.
Table 4.3: Exit scenario descriptions and explanations
Potential economic impact
FTA scenario WTO scenario
Short-term uncertainty
The UK quickly negotiates an FTA with the EU, leading to a shorter period (5 years) of uncertainty, during which UK corporates experience an increase in credit risk.
Protracted exit negotiations result in a prolonged period (9 years) of uncertainty, during which UK corporates experience an increase in credit risk.
Trade - tariffs The UK manages to negotiate an FTA with the EU. The UK continues to maintain zero tariffs on goods trade with the EU.
Trade between the UK reverts to WTO / MFN basis. The UK experiences an increase in EU tariffs on goods trade to MFN rates.
Trade – non-tariff barriers
Gradual regulatory divergence between the UK and the EU results in an increase in NTBs on goods and services.
Gradual regulatory divergence between the UK and the EU results in an increase in NTBs on goods and services.

PwC 20
Potential economic impact
FTA scenario WTO scenario
Trade – trading relationships with third-party countries
The UK grandfathers all existing FTAs that the EU has with third-party countries after it leaves the EU.
We assume no change to tariffs or NTBs on trade with third-party countries that currently have an FTA with the EU.
The UK is able to accelerate its FTA negotiations with the US. The US FTA comes into effect in 2021.
There is no change to the trading relationship between the UK and other countries (that are not party to an existing FTA with the EU).
Current FTAs between the EU and third-party countries no longer apply to the UK once it exits the EU. Trade with those countries reverts to a WTO MFN basis in 2020. The FTAs come back into effect in 2026, following renegotiations.
We assume no change to NTBs on trade with third-party countries that currently have an FTA with the EU.
The UK negotiates a FTA with the US. The US FTA comes into effect in 2026.
There is no change to the trading relationship between the UK and other countries (that are not party to an existing FTA with the EU).
Migration New migrants, including those from the EU must qualify under the Immigration Rules (applicable to all foreign nationals).
This in practice would mean the cessation of net migration inflows of low-skilled migration from the EU.
This is accompanied by a relaxation of immigration requirements for high-skilled labour, which results in an increase in high-skilled migrant inflows.
New migrants, including those from the EU must qualify under Immigration Rules (applicable to all foreign nationals).
This in practice would mean the cessation of net migration inflows of low-skilled migration from the EU.
There is no change to migration patterns of high-skilled labour.
Regulations Greater control over regulatory policy results in some regulatory cost savings.
Greater control over regulatory policy results in some regulatory cost savings.
Fiscal The UK no longer makes a contribution to the EU budget and, therefore, the net contribution goes towards government spending (c.0.5% of GDP).
The UK continues to fund EAGF, EAFRD and social and regional development funds.
Half of these savings (i.e. reduction in net contribution) go towards debt reduction while the other half goes towards capital investment.
The UK no longer makes a contribution to the EU budget and, therefore, the net contribution goes towards government spending (c.0.5% of GDP).
The UK continues to fund EAGF, EAFRD and social and regional development funds.
Half of these savings (i.e. reduction in net contribution) go towards debt reduction while the other half goes towards capital investment.
Source: PwC assumptions

PwC 21
Summary In the short-term, the impact of uncertainty over the shape of the UK’s post-exit relationship with the
EU following a vote to leave could result in significant economic costs. Under the FTA scenario these could be close to 2% of GDP in 2020, rising to around 2.6% of GDP in our WTO scenario. In both cases, however, the negative impact of this uncertainty fades away over time, being close to zero by 2030.
In the longer term, we estimate the impact of the UK leaving the EU to reduce UK GDP by around 1.2% in the FTA scenario relative to the counterfactual in 2030, while under the WTO scenario the reduction in GDP could be around 3.5% in 2030. After allowing for population changes due, in particular, to different migration levels across scenarios, UK GDP per capita would be between 0.8% and 2.7% lower in 2030 in these two scenarios, relative to the counterfactual.
The increase in trade barriers and reduction in migration accounts for the largest negative impacts in the long-term. Under the FTA scenario, the increase in trade barriers is estimated to reduce GDP by around 0.5% relative to the counterfactual in 2030, rising to over 2% in the WTO scenario where both tariffs and NTBs increase.
The changes to net migration results in significant negative impacts on GDP of around 1-1.6% in 2030 in the two scenarios, although these effects are less marked for GDP per capita levels.
There are offsetting GDP gains from a potential reduction in the regulatory cost burden and EU fiscal contributions in the two exit scenarios, but these are significantly lower than the potential costs from increased trade barriers and reduced labour supply according to our modelling estimates. It should be noted that, although regulations often place a cost on businesses, regulations can also have a positive impact on growth by improving economic efficiency and addressing market failures.
In both exit scenarios, the largest effect on GDP comes through investment, particularly in
the short-term due to the assumed heightened degree of uncertainty following a vote to leave the EU. The impacts on the other components of GDP are expected to be smaller, with government expenditure actually estimated to be higher in the exit scenarios than under the counterfactual.
The reduction in economic output and activity associated with a potential UK exit from the EU results in a negative impact on demand and investment, which leads to a reduction in employment. Our model estimates suggest that a UK exit from the EU could reduce employment (the number of people employed) by between around 350,000 and 600,000 in 2030 relative to the counterfactual in the FTA and WTO scenarios respectively.
Labour markets also gradually adjust to the lower level of output and investment in the economy. Therefore, unemployment rates (as opposed to total employment levels) gradually converge to those observed in the counterfactual in the long-run, with relatively small differences across scenarios by 2030. However, unemployment would be higher in EU exit scenarios on the transition to these longer term positions as it could take a long time for labour markets to adjust fully to new circumstances after an EU exit.
In this section, we present our results including the potential impacts on GDP, GDP per capita and employment.
5.1 Modelling inputs We modelled the potential impact of the UK’s exit from the EU under two alternative scenarios by varying input assumptions to reflect the effect of the various policy changes associated with each of them so that we can simulate the expected economic impacts on the UK economy. The input assumption changes we have used for
5 Scenario modelling results
PwC 22
each exit scenario are summarised in Table 5.1. Their form and scale are informed by our review of existing evidence for each of the channels through which a UK exit from the EU could impact the UK economy. The underlying assumptions used in our model are set out and justified in detail in Annexes B to F and are summarised more briefly below.19
Short-term uncertainty: A vote to leave the EU could have an impact on firms’ credit risk, as the potential loss of access to the EU Single Market could have a negative impact on UK firms’ export earnings and put upward pressure on import prices. We model the impact of uncertainty by applying a cost of capital rise to our model, which is broadly aligned to the changes to firms’ risk premia during the Eurozone crisis in 2011-12. This translates into a cost of debt rise of 50 bps and a cost of equity rise of 20 bps. We expect uncertainty to fade away as greater clarity emerges over the terms of the UK’s exit from the EU. We assume that uncertainty would fade away relatively quickly (within around 5 years) under the FTA scenario but could take up to 9 years to do so under our WTO scenario. In practice, there could also be differences in the scale of the rise in risk premia in different scenarios but, for simplicity, we captured this through the duration of the change instead. There is also a possibility that some of this could be offset by some positive sentiment around whether the UK would become more prosperous outside of the EU, but this is not considered to be the most likely outcome. We would still expect uncertainty to have a negative impact on GDP.
Trade – tariffs: In the WTO scenario where no agreement is negotiated with the EU, then the UK’s trading relationship with the EU is assumed to revert to WTO rules. We anticipate that the tariffs imposed on trade with the rest of the EU would follow the MFN basis using WTO rules.20 Under the FTA scenario, we assume the continued application of zero tariffs on goods trade.21 We also assume that the UK would continue trading with other third-party countries on the basis of trade liberalisation commitments made when the UK was part of the EU.
Trade – non-tariff barriers (NTBs): It is likely that following the UK’s exit from the EU, the UK would seek to gain greater control over its own regulatory regime, leading potential regulatory divergence. As a result, NTBs on trade between the UK and the rest of the EU may increase after the UK’s exit as exporting firms need to adhere to different sets of regulations, which add to the costs of trade. Under the WTO scenario, this is modelled as an increase equivalent to three-quarters of the difference in NTBs that the UK and third-party countries face when exporting to the EU. The NTBs rise to a smaller extent in the FTA scenario. This means that the UK would face an increase in NTBs that is equivalent to one-quarter of the difference in NTBs applied to third-part countries’ and UK exports to the EU. Our estimates of NTBs are informed by our econometric modelling (using gravity models) based on trade flow data.
Trade – trading relationships with third party countries: In the FTA scenario, we have assumed that the UK is able to ‘grandfather’ all of the existing trade agreements that the EU has with other countries and, therefore, continues to trade under these terms. We also assume that the UK takes advantage of its ability to pursue its own external trade policy by independently negotiating an FTA with the US, which comes into effect in 2021. The assumption that the UK would be able to accelerate negotiations with the US (potentially on the back of existing TTIP negotiations) in time for an FTA to be implemented in 2021 is ambitious.22 Under the WTO scenario, we have assumed that the EU’s existing trade agreements would no longer apply to the UK and it has to negotiate its own agreements with other third-party countries. Trade with these countries revert to WTO terms until the new FTAs are assumed to come into effect in 2026. Under the WTO scenario, the UK still negotiates an FTA with the US, but this comes into effect in 2026 instead of 2021 as in the FTA scenario.
19 These annexes are in the order of impacts listed here, but Annex C covers all trade effects and includes the evidence and assumptions
used to inform the tariff, NTB and border cost impacts. 20 “Most Favoured Nation” (MFN) is a status or level of treatment accorded by one state to another in international trade. The term means
the country which is the recipient of this treatment must receive equal trade advantages as the “most favoured nation” by the country
granting such treatment. In effect, a country that has been accorded MFN status may not be treated less advantageously than any other
country with MFN status by the promising country. 21 This is consistent with recently negotiated FTAs between the EU and third-party countries, such as the EU-Canada CETA and EU-South
Korea FTA. 22 In practice, renegotiations would take some time, and it is unclear whether the UK would be able to begin trade negotiations ahead of a
formal exit from the EU taking place.

PwC 23
Migration: One of the key changes proposed by those campaigning to leave is to reduce low-skilled migration from the EU while maintaining or increasing high-skilled migration as appropriate, whether from outside or inside the EU. Under the WTO scenario, we therefore model the impact of a reduction in inflows of net migration of low-skilled labour from the EU, in line with the current treatment of low-skilled migration from non-EU countries.23 This reflects a relatively pessimistic outcome where the UK does not allow any increase in high-skilled migration.24 We also assume no change to the inflow of high-skilled labour, as EU nationals would be required to qualify for entry to the UK under immigration rules that currently apply to non-EU migrants. In the FTA scenario, the reduction in net inflows of low-skilled labour is accompanied by an increase in inflows of high-skilled labour, which could follow from a small liberalisation in visa requirements for high-skilled migrants. Our assumption that high-skilled migration flows could increase reflects a favourable outcome for labour supply, as we assume that the UK would secure greater flexibility over its immigration policy by relaxing immigration rules for high-skilled migrants from both EU and non-EU countries. We model an increase in high-skilled inflows that is equivalent to half of the reduction in net inflows of low-skilled labour. We estimate the impact of changes in migration flows on UK labour supply using ONS projections of population growth, labour force and recent trends in net international migration by skill levels. As a result, UK labour supply falls by 1.4% in the WTO scenario by 2030 and 0.7% in the FTA scenario relative to the counterfactual (see Figure 5.1).
Regulations: Based on Open Europe’s analysis of regulatory impact assessments25, we identified three areas where regulations might change in the event of an EU exit, as the UK would have greater latitude in deciding its own regulatory regime. These are: (1) social, employment, health and safety; (2) environment and climate change; and (3) product standards. We modelled the realised annual cost savings to be in the order of £12.6 billion under both scenarios. The idea is that the reduction in regulatory costs reduces business costs and frees up business resources that can then be redirected to more productive activities, which increases overall output and productivity. In our CGE model, this is represented as an increase in input efficiency, which enables an increase in output per unit of input. We also note that these savings may be relatively optimistic as it may not be politically or socially desirable to ease or repeal all of the social, employment and environmental and climate change regulations as assumed in our modelling.
Fiscal: If the UK left the EU, the UK would no longer have to contribute to the EU budget although this depends on the exit scenario. We assume that the UK Government regains control of its net contribution (which is equal to approximately 0.5% of UK GDP, excluding direct transfers to the private sector). In effect, this means that the UK Government would replace EU funding for regions and businesses that currently benefit from EU funding with its own funding at the same level. To capture this, we apply a fiscal saving equivalent to 0.5% of GDP (based on HM Treasury accounts) such that 50% of this saving is allocated to capital investment and the remaining 50% is allocated to government debt reduction. These allocations are broadly in line with the UK Government’s current fiscal policy priorities.
Table 5.1: Changes to policy or macroeconomic assumptions applied in the CGE model in exit scenarios
Change FTA scenario WTO scenario
Short-term uncertainty
Uncertainty impact applied for five years between 2016 and 2021 (but assumed to fade away gradually over the second half of this period)
Uncertainty impact applied for nine years between 2016 and 2025 (but assumed to fade away gradually over the second half of this period)
23 The principle of free movement is applied on a reciprocal basis to those members of the EEA that are not members of the EU. Therefore
our references to EU migration apply equally to the EEA. 24 In practice, the UK could adopt a less restrictive migration policy in relation to low-skilled migration, e.g. by opening the Tier 3 visa route
for low-skilled labour. However, even if Tier 3 were implemented, this may have a limited impact on low-skilled migration from the EU after
a potential UK exit from the EU, because it would nevertheless be more costly for both workers and their UK employers, as compared to
the current position. 25 Open Europe (2015).

PwC 24
Change FTA scenario WTO scenario
Cost of debt increases by 50 bps
Cost of equity increases by 20 bps
Cost of debt increases by 50 bps
Cost of equity increases by 20 bps
Trade – tariffs
UK experiences no tariffs on goods exports to the EU.
Average tariffs on UK goods exports to the EU increases from zero to WTO MFN tariff values
This amounts to an increase in effective tariff rate of 2.5% on all UK goods exports. The UK would also charge MFN tariffs on imports from the EU. This amounts to an increase in effective tariff rate of 2.9% on all UK goods imports.
Trade – non-tariff barriers (NTBs)
NTBs between the UK and the EU increase by one quarter of the differential between the NTBs on UK exports to the rest of the world and the EU.
This would amount to an increase of around 0.5% in the cost of all exports from the UK, as well as a 0.7% increase in the cost of all imports into the UK.
NTBs between the UK and the EU increase by three quarters of the differential between the NTBs on UK exports to the rest of the world and the EU.
This would amount to an increase of around 1.4% increase in the cost of all exports from the UK, as well as a 1.8% increase in the cost of all imports into the UK.
Trade – trading relationships with third-party countries
The UK is able to accelerate its FTA negotiations with the US. The US FTA comes into effect in 2021. We assume that tariffs decrease by 75% immediately, then gradually decrease to zero from 2021 to 2030.
By 2030, this would cut the cost of all exports from the UK by around 0.4%. Tariffs and NTBs on UK imports as a whole would also decrease by 0.3% by 2030.
There is no change to the trading relationship between the UK and other countries (that are not party to an existing FTA with the EU).
Current FTAs between the EU and third-party countries no longer apply to the UK once it exits the EU. Trade with those countries reverts to a WTO MFN basis in 2020. The FTAs come back into effect in 2026, following renegotiations.
The UK negotiates a FTA with the US. The US FTA comes into effect in 2026. We assume that tariffs decrease by 75% immediately, then gradually decrease from 2026 to 2030 (at the same rate as the FTA scenario, but starting at 2026 rather than 2021).
By 2030, this would cut the cost of all exports from the UK by around 0.3%. Tariffs and NTB costs on imports to the UK as a whole would also decrease by 0.2% and 0.3% respectively by 2030.
There is no change to the trading relationship between the UK and other countries (that are not party to an existing FTA with the EU).
Migration Net inflow of low-skilled labour from the EU falls to zero from 2020 onwards.
This is accompanied by an increase in the net inflow of high-skilled workers equivalent to half of the decline in low-skilled labour inflows. This means that high-skilled inflows increase by 1.4% relative to the counterfactual.
Overall UK labour supply falls by 0.7% relative to the 2030 counterfactual.
Net inflow of low-skilled labour from the EEA falls to zero, which reduces UK labour supply by 1.4% relative to the 2030 counterfactual.
Regulations Regulatory costs fall by approximately £12.6 billion per annum.
Regulatory costs fall by approximately £12.6 billion per annum.

PwC 25
Change FTA scenario WTO scenario
Fiscal Half of the savings from the reduction in net EU budget contributions (c.0.5% of GDP) goes towards debt repayments.
The remaining half goes towards capital investment.
The UK continues to fund EAGF, EAFRD and social and regional development funds.26
Half of the savings from the reduction in net EU budget contributions (c.0.5% of GDP) goes towards debt repayments.
The remaining half goes towards capital investment.
The UK continues to fund EAGF, EAFRD and social and regional development funds.
Source: PwC assumptions
Figure 5.1: Working age population projections under the WTO and FTA scenarios and counterfactual
Source: PwC analysis based on ONS population projections and 2011 Census data
5.2 Results Short-term impacts of uncertainty Our economic modelling suggests that the impact of uncertainty on the UK economy could be significant. A vote to leave the EU could have a negative impact on firms’ credit risk, as the potential loss of access to the EU Single Market could have a negative impact on UK firms’ export earnings and put upward pressure on import prices should tariffs be imposed on goods imported from the EU. This also reflects heightened investor and consumer uncertainty, which also manifests as a delay in hiring and employment decisions. These risks could increase firms’ credit risk and probability of default. An increase in risk premiums has a direct impact on the firms’ cost of debt, as it increases the cost to investors of insuring against default on UK corporate and sovereign debt. There may be other channels through which uncertainty increases following a vote to leave the EU (e.g. increased exchange rate volatility), but this is the best way to quantify this within the framework of our CGE model.
Under the FTA scenario where the exit agreement is assumed to be achieved relatively quickly with the EU and negotiations also proceed reasonably smoothly with other trading partners, the impact of uncertainty results in a short but sharp negative impact on the economy which fades away once a deal is reached. This results in a negative impact of just under 2% of GDP compared to the counterfactual in 2020 but this falls to close to zero in 2025 and beyond (see Table 5.2).
26 The EAGF refers to the European Agricultural Guarantee Fund and the EAFRD refers to the European Agricultural Fund for Rural
Development.
40.0
41.0
42.0
43.0
44.0
45.0
2015 2016 2017 2018 2019 2020 2021 2022 2023 2024 2025 2026 2027 2028 2029 2030
Mlii
ons
FTA Scenario WTO Scenario Counterfactual
PwC 26
In contrast, in the WTO scenario, a more prolonged period of uncertainty results in a larger negative impact on GDP of around 2.6% in 2020 and this fades away more gradually thereafter to just under 1% of GDP by 2025 before declining to close to zero by 2030.
The effect of uncertainty is largely felt in the short-term when the terms of an exit agreement are being negotiated. The duration of the negative impact also reflects the time required for firms and households to respond to the new terms of any trade agreement, which results in a gradual adjustment over time. However, uncertainty would also have longer-term effects: under both scenarios, households and businesses make investment and consumption decisions in the short-term that would have significant consequences in the longer-term, even if the initial impacts of uncertainty dissipate relatively quickly. For example, the cumulative reduction in investment in the short-term results in a permanently smaller capital stock in the UK.
Longer-term impacts Table 5.2 summarises the impacts on total GDP under both the FTA and WTO scenarios, which shows estimated effects of around 1.2-3.5% of GDP in 2030 relative to the counterfactual. If these impacts were valued in relation to 2015 GDP, they would represent a loss of around £55-100 billion in 2020, falling back to £25-65 billion in 2030. These total GDP effects are higher than for GDP per capita because migration and population are lower in the EU exit scenarios. This table also presents our findings in terms of percentage differences against the counterfactual in the level of UK GDP per capita. Our economic modelling suggests that, under the FTA scenario, UK GDP per capita would be around 0.8% lower than in the counterfactual in 2030, while under the WTO scenario the reduction in GDP per capita would be around 2.7% in 2030.
Table 5.2: Exit scenario results – percentage difference in real UK GDP from levels in counterfactual scenario
Impacts FTA scenario WTO scenario
2020 2025 2030 2020 2025 2030
Uncertainty -1.9% -0.1% -0.1% -2.6% -0.9% -0.1%
Trade -0.5% -0.5% -0.5% -1.7% -1.9% -2.1%
Migration -0.8% -0.8% -1.0% -1.3% -1.6% -1.6%
Regulations 0.0% 0.3% 0.3% 0.0% 0.3% 0.3%
Fiscal 0.1% 0.0% 0.0% 0.1% 0.0% 0.0%
Total impact on GDP
-3.1% -1.1% -1.2% -5.5% -4.1% -3.5%
Change in population
0.0% -0.2% -0.4% -0.1% -0.5% -0.9%
Impact on GDP per capita
-3.0% -0.9% -0.8% -5.4% -3.6% -2.7%
Note: Numbers in the columns may not add up exactly due to rounding.
Source: PwC analysis
Our modelling results have a number of further notable features, as discussed below:
Trade: One of the largest potential impacts of the UK leaving the EU can be attributed to the increase in trade barriers. The combined effects of the increase in tariff barriers and NTBs (such as regulatory requirements, legal barriers and other transaction costs) increase the cost of UK exports to the EU, relative to exports from countries who remain in the EU, resulting in a deterioration in the terms of trade. There are also adverse effects on the costs of UK imports. This impact also includes the benefits of agreeing a FTA with the US. The agreed FTA with the US provides a small positive boost to GDP in the longer-term. Under the FTA scenario, the combined trade effect is estimated to reduce GDP by 0.5% relative to the counterfactual in 2030. Under the WTO scenario, where the UK faces a higher increase in NTBs and tariffs on some goods and it takes longer to agree the US FTA, the reduction in GDP in 2030 is larger, at just over 2% relative to the counterfactual.

PwC 27
Migration: The changes to net migration results in significant negative impacts on total GDP of around 1-1.6% of GDP by 2030 under the FTA and WTO scenarios respectively. In both scenarios, the reduction in labour supply results in a fall in productive capacity of the economy. A reduction in labour supply could lead to skills shortages. This, in turn, has a negative impact on output and employment. As Figure 5.1 shows, the impact of lower migration inflows is likely to have a cumulative impact on UK labour supply, with the result that the negative impacts are amplified over time. The impact on GDP per capita is, however, lower than for total GDP as this corrects for the population impact of reduced migration.
Regulations: Our analysis suggests that the gains from a reduction in the regulatory cost burden are fairly minimal. The impact of a potential reduction in regulatory costs on GDP under both scenarios is relatively small at around 0.3% in 2030 relative to the counterfactual. These impacts are small due to leakages from the domestic economy (i.e. some of the benefits of lower regulatory costs flow outside the UK via imports, or taxes), as well as the presence of “frictions” in the model, meaning that adjustment costs in response to regulatory changes are non-zero. This has the effect of reducing some of the benefits from regulatory cost savings. Although regulations often place a cost on businesses, regulations can have a positive impact on growth by improving economic efficiency and addressing market failures. Because our analysis considers the gross, rather than the net, costs of regulations, it is possible that the gains from regulatory savings could be even smaller than our model suggests once these benefits are factored in (but this is beyond the scope of our model to quantify).
Fiscal: Finally, if the UK no longer has to make its contributions to the EU budget, this is estimated to lead to a small positive impact on GDP, which is due to the share of the budgetary saving that is assumed to go towards investment. .
We have attempted to estimate how these impacts could translate into an impact per UK household (see Table 5.3). When expressed in 2015 values (i.e. based on 2015 GDP), the GDP impact per household is around £2,100 in 2020 under the FTA scenario and £3,700 under the WTO scenario relative to the counterfactual. These estimates are calculated using our GDP per capita impacts, but making an adjustment for the average number of people per household in the UK. By 2030, however, estimated GDP losses per household are around £600-£1,800 at 2015 values.
Table 5.3: GDP impact per household (£, expressed in 2015 values and relative to the counterfactual)
2020 2025 2030
FTA scenario -£2,100 -£600 -£600
WTO scenario -£3,700 -£2,500 -£1,800
Source: PwC analysis
Table 5.4 compares the rate of GDP growth in the counterfactual, FTA and WTO scenarios. Although leaving the EU has a negative impact on short-term growth, the growth effects return to their long-term averages over time. This means that the estimated impact of the UK leaving the EU on the growth rate is temporary in our model.
In the FTA scenario, the average annual real GDP growth rate falls by 0.8 percentage points relative to the counterfactual in the short-term (2016-2020), and the economy grows at a rate of 1.5% per annum on average. This is, however, expected to rebound to 2.7% over 2021-2025 as the economy adjusts to the new equilibrium. Growth then converges with that of the counterfactual scenario during 2026-2030. In the WTO scenario, the economy suffers from a larger initial negative impact in 2016-2020: real GDP growth falls by 1.4 percentage points relative to the counterfactual to just 0.9% per annum on average over this period. The UK economy then experiences faster growth in the medium term at 2.6% on average in 2021-25, before settling at around 2.4% per annum in 2026-2030. The economy takes a longer time to adjust to the new equilibrium under the WTO scenario compared to the FTA scenario. While growth rates in the two exit scenarios converge to those of the counterfactual in the long-run, growth occurs from a lower base, and the level of real GDP in the exit scenarios remains lower than in the counterfactual throughout the period to 2030.

PwC 28
Table 5.4: Comparison of average real GDP growth per annum for the counterfactual, WTO and FTA scenarios
2016-2020 2021-2025 2026-2030
Counterfactual scenario 2.3% 2.3% 2.3%
FTA scenario 1.5% 2.7% 2.3%
WTO scenario 0.9% 2.6% 2.4%
Source: PwC analysis
Figure 5.2 shows the level of real UK GDP under the three scenarios. Compared to 2015 levels, real UK GDP would be 39% larger in the FTA scenario and 36% larger in the WTO scenario in 2030. Nonetheless, the level of UK GDP would still be lower in 2030 under both the WTO and FTA scenarios than under the counterfactual scenario (GDP grows by 41% over the same period) where the UK remains part of the EU. However, one should not overstate this difference, which amounts to less than one year of trend growth in the FTA scenario and less than two years of trend growth in the WTO scenario. The UK would remain a relatively large, affluent and growing economy in both our exit scenarios, just not quite as large or affluent as in the counterfactual where the UK remains in the EU.
Figure 5.2: Real UK GDP in levels under the counterfactual, WTO and FTA scenarios
Source: PwC analysis
Figure 5.3 shows the evolution of the economic impact of the FTA scenario relative to the counterfactual over time, while Figure 5.4 shows the equivalent analysis for the WTO scenario. Both charts show that some of the negative impacts are realised ahead of the UK’s anticipated formal exit in 2020.
This is largely due to the fact that companies and households respond to uncertainty by reducing investment and consumption. They also react to anticipated policy changes, meaning that they respond to lower levels of output and employment in the future as a result of the UK leaving the EU, causing the economic impacts to be brought forward in the short-term.
In our modelling, the effects of the UK’s exit build up over time due to the cumulative effects of migration restrictions on the UK’s labour supply and the permanently lower level of investment, which leads to a smaller capital stock in the UK.
1,600
1,800
2,000
2,200
2,400
2,600
2,800
201
0
201
1
201
2
201
3
201
4
201
5
201
6
201
7
201
8
201
9
202
0
202
1
202
2
202
3
202
4
202
5
202
6
202
7
202
8
202
9
203
0
£ b
illio
ns a
t 2015 p
rices
Counterfactual FTA Scenario WTO scenario
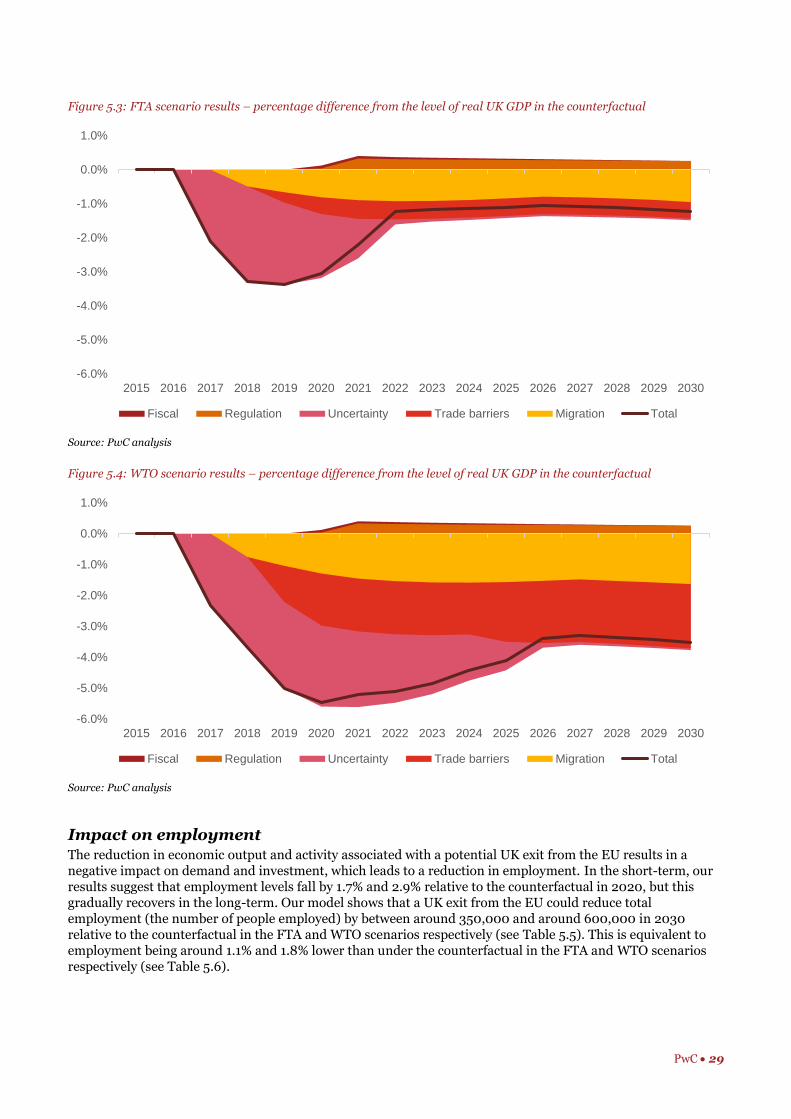
PwC 29
Figure 5.3: FTA scenario results – percentage difference from the level of real UK GDP in the counterfactual
Source: PwC analysis
Figure 5.4: WTO scenario results – percentage difference from the level of real UK GDP in the counterfactual
Source: PwC analysis
Impact on employment The reduction in economic output and activity associated with a potential UK exit from the EU results in a negative impact on demand and investment, which leads to a reduction in employment. In the short-term, our results suggest that employment levels fall by 1.7% and 2.9% relative to the counterfactual in 2020, but this gradually recovers in the long-term. Our model shows that a UK exit from the EU could reduce total employment (the number of people employed) by between around 350,000 and around 600,000 in 2030 relative to the counterfactual in the FTA and WTO scenarios respectively (see Table 5.5). This is equivalent to employment being around 1.1% and 1.8% lower than under the counterfactual in the FTA and WTO scenarios respectively (see Table 5.6).
-6.0%
-5.0%
-4.0%
-3.0%
-2.0%
-1.0%
0.0%
1.0%
2015 2016 2017 2018 2019 2020 2021 2022 2023 2024 2025 2026 2027 2028 2029 2030
Fiscal Regulation Uncertainty Trade barriers Migration Total
-6.0%
-5.0%
-4.0%
-3.0%
-2.0%
-1.0%
0.0%
1.0%
2015 2016 2017 2018 2019 2020 2021 2022 2023 2024 2025 2026 2027 2028 2029 2030
Fiscal Regulation Uncertainty Trade barriers Migration Total

PwC 30
However, it should be noted that lower migration accounts for a significant proportion of this reduction in employment in the EU exit scenarios.
Table 5.5: Impact on total UK employment relative to counterfactual in different EU exit scenarios (000s)
Impact in 2020 Impact in 2025 Impact in 2030
FTA scenario -550 -450 -350
WTO scenario -950 -950 -600
Note: These numbers are rounded to the nearest 50,000.
Source: PwC analysis
Table 5.6: Percentage difference from the counterfactual number of employment
Impact in 2020 Impact in 2025 Impact in 2030
FTA scenario -1.7% -1.4% -1.1%
WTO scenario -2.9% -2.9% -1.8%
Source: PwC analysis
The UK unemployment rate is projected to rise in both scenarios, peaking in around 2020 at about 7% in the FTA scenario and around 8% in the WTO scenario. In the 2020s, unemployment gradually falls back in both scenarios as the labour market adjusts, so that by 2030 unemployment has returned to broadly the same level as in the counterfactual scenario (around 5%).
Impact on expenditure components of GDP Table 5.7 summarises the impacts on different expenditure components of GDP under both the FTA and WTO scenarios in terms of the percentage difference against the counterfactual for the level of UK GDP. There is a significant negative impact on consumption, net exports and particularly investment under both scenarios.
Table 5.7: Exit scenario results – percentage difference from counterfactual levels of expenditure categories
FTA scenario WTO scenario
2020 2025 2030 2020 2025 2030
Consumption -2.8% -1.8% -1.8% -5.5% -5.3% -5.2%
Investment -16.4% -4.7% -1.7% -25.8% -14.8% -9.9%
Government expenditure 0.6% 0.6% 0.6% 0.6% 0.6% 0.6%
Exports -3.6% 0.4% 0.7% -9.8% -8.4% -6.0%
Imports -4.8% -0.6% -0.3% -11.9% -10.5% -7.8%
Total impact on GDP -3.1% -1.1% -1.2% -5.5% -4.1% -3.5%
Note: Numbers in the columns may not add up exactly due to rounding.
Source: PwC analysis
Consumption: Our analysis shows that if the UK exited the EU, this would have a negative overall effect on consumption ranging from 1.8-5.2% relative to the counterfactual in 2030 in the FTA and WTO scenarios respectively. This is due to a broader decline in industrial sector output and investment, leading to overall lower levels of income and wealth for households, which in turn leads to lower consumer spending.
Investment: Investment is the most significantly affected of all the different expenditure components of GDP. The largest driver of this decline is the increase in credit risk associated with short-term uncertainty, which means that the most severe impacts on investment are largely felt in the short-term: under the FTA scenario, investment falls by over 16% by 2020, while under the WTO scenario, investment falls by over 25% by 2020 relative to the counterfactual. An increase in credit risk has a direct

PwC 31
impact on firms’ cost of capital, which affects the volume of investment. A reduction in export earnings and an increase in the cost of imports for UK businesses due to the presence of tariffs and non-tariff barriers causes a shrinkage in output and a reduction in returns from investment, which in turn, causes firms to cut back investment.
In the longer-term, investment is negatively affected by an increase in trade barriers and border costs. This results in investment falling by around 1.7-10% relative to the 2030 counterfactual in the FTA and WTO scenarios respectively.
Although the precise mix of domestic and foreign investment is too difficult to predict due to the lack of reliable data, it is very likely that some of this decline in investment would be caused by a reduction in foreign direct investment (FDI). Although it is difficult to fully account for the “EU effect” on FDI location decisions (which are also influenced by considerations such as factor costs, fiscal incentives, exchange rate, business environment, language etc.), existing evidence suggests that EU membership has contributed to FDI growth in the UK by enhancing access to a larger market.27
A UK exit from the EU could, therefore, have a negative impact on investment and FDI. If the UK’s trading relationship with the EU reverts to WTO rules, it is likely that inward investment into the manufacturing and services sectors would be affected. However, if the UK successfully negotiates a bilateral FTA with the EU on goods trade, the impact on investment in the manufacturing and industrial sectors could be mitigated, but the services sectors, which account for a larger share of the UK economy, would nevertheless be negatively affected in the absence of an FTA in services.
Exports: In the long-run, exports are around 0.7% higher in 2030 in the FTA scenario than the counterfactual but around 6% lower in the WTO scenario. The small rise in the FTA scenario is in part driven by the immediate grandfathering of existing EU trade deals upon exit, an assumed FTA with the US on terms that are favourable to the UK, particularly in services, and lower regulatory costs which contribute positively to GDP in part through higher exports. The lower regulatory costs cause a small rebalancing of the economy towards more export-oriented sectors. However, what is a relatively small boost in exports needs to be considered against larger reductions in investment and household consumption in 2030. The fall in the WTO scenario is due to an increase in trade tariffs and NTBs on exports of goods and services to the EU. The subsequent impact on export volumes is amplified by the reduced economies of scale available to UK firms from access to the Single Market.
Imports: These decline in both scenarios, though by a considerably larger volume in the WTO scenario. In the FTA scenario, the decline is due to a reduction in economic activity that reduces the demand for imports. In the WTO scenario, this impact is driven by the imposition of higher tariffs by the UK on EU imports, which has the effect of increasing their price.
Government expenditure: Government expenditure increases by 0.6% in 2030 in both scenarios, which provides a small positive boost to the economy.
Impact on productivity The impact on productivity after an EU exit is likely to result from lower exports and investment, in particular FDI. The reduction in the level of UK net exports, particularly in sectors with higher levels of export intensity such as manufacturing, financial services, and business services, is likely to have a negative impact on productivity. Studies have shown that exporters have a higher level of productivity compared to non-exporters.28 A reduction in net exports could, therefore, lead to lower levels of productivity in the UK economy.
27 For example, Straathof et al. (2008) show that EU membership boosted the bilateral FDI stock of EU countries by 28%. The Bank of
England (2015) also provides evidence that inward FDI stocks have increased faster in both the UK and EU (as a percentage of GDP) than
in the US and the rest of the world since the establishment of the Single Market in 1993. There is some evidence that the UK seems to
have benefitted disproportionately from the growth in extra-EU FDI, as shown by its persistently high levels of FDI as a share of GDP, in
comparison to the EU. 28 See for example: European Central Bank (2015) and ONS (2008).

PwC 32
Our estimates on the impact on UK productivity levels could be conservative as they do not explicitly account for the productivity-enhancing effects of FDI relative to domestic investment. Existing studies show that foreign-owned companies in the UK have helped to boost productivity levels as their average productivity is higher than that of UK-owned firms, and because there are spillovers that raise the productivity of domestic firms.29 The potential reduction in FDI after EU exit could mean that the UK could lose out from the possible additional dynamic spillover effects from this FDI.
5.3 Additional considerations We recognise that there are many areas of uncertainty relating to the results. First, the eventual impacts of the different impacts on the wider economy would depend on the actual changes to tariffs and NTBs and migration flows, which are highly dependent on the form of the UK’s exit agreement with the EU. Second, there could be additional behavioural and policy responses we have not been able to capture in our model. As such, our estimates can only be indicative of the broad direction and order of magnitude of economic impact that could arise following a potential UK exit from the EU.
It should be emphasised that our FTA scenario also assumes fairly ambitious achievements, including significant changes in migration policy in order to attract inflows of high-skilled workers to the UK. The assumption that the UK would be able to accelerate negotiations with the US (potentially on the back of existing TTIP negotiations) in time for an FTA to be implemented in 2021 is similarly ambitious. In contrast, the WTO scenario reflects a relatively pessimistic outcome where the UK does not allow any increase in high-skilled migration. However, we also note that the regulatory savings modelled may be relatively optimistic as it may not be politically or socially desirable to ease or repeal all of the social, employment and environmental and climate change regulations as assumed in our modelling.
One particular limitation of our model is that it does not assume any proactive monetary or fiscal policy response to EU exit. In terms of a monetary policy response, further reductions in the policy rate are limited, due to the zero lower bound. However, the Bank of England could respond to potential increased uncertainty by providing additional market liquidity or quantitative/credit easing in order to restore market stability, particularly in the immediate aftermath of a vote to leave. As discussed in Annex B, there are limitations to how far this can address the underlying uncertainties about future arrangements between the UK and the EU. The government could also respond by loosening fiscal policy, but its capacity to do this would be limited by the larger fiscal deficit that would accrue in both of our scenarios relative to the counterfactual.
More detail on the underlying assumptions used in our modelling is provided in Annexes B-F.
29 See for example the study by Pain and Young (2004), which estimates that a 1% increase in the stock of manufacturing FDI increases
labour-augmenting technical progress in the manufacturing by 0.32%, and a 1% increase in financial services inward FDI is estimated to
increase technical progress by 0.135% in the financial services sector.

PwC 33
Annexes

PwC 34
This Annex sets out in more detail the key technical features of the CGE model used in our analysis of the economic impact of a potential UK exit from the EU.
A.1 Model structure overview CGE models capture interactions between different sectors of the economy, households and the government. As they are “general equilibrium” in nature they are specifically designed to capture these interactions, as opposed to “partial equilibrium” models that evaluate economic issues from the perspective of a single household or sector of the economy. They are based on a circular flow of income model which illustrates how economic agents receive and spend income in the economy.
The primary data source underpinning the model are the ONS Supply and Use Tables (SUTs). These data are explicitly designed to reflect business, household and government interactions across the economy – they show, by product and industry sector, what businesses produce, the wages they pay, the profits they make, patterns of consumer and government spending as well as trade and investment. The SUT dataset is supplemented by additional tax payment data published by HM Revenue and Customs (HMRC) and labour market data published by the ONS.
In Figure A.1, we provide a summary of the circular flow in the context of the CGE model. We have split the economy into two main components, or “blocks” as they are often referred to when describing CGE models. The consumption block outlines the structure of consumption within the economy and identifies sources of income and how that income can be spent. The production block explains the organisation of the productive side of the economy and how domestic output is determined. In Figure A.1, imports and exports refer to both imported and exported goods and services.
Each block contains equations and data that correspond to a key feature of the model. For instance, in the consumption block, the private expenditure feature contains mathematical equations and data that determine private consumption, investment and transfer payments. The diagram we have used to present these blocks does not capture every single economic linkage in the CGE model. However, it summarises the most important economic interactions in an intuitive way.
In the Figures in this Annex, the rectangular shapes represent sets of model equations and data within the two blocks. The solid arrows represent two-way direct, indirect and induced linkages in economic activity. The dotted arrows used in later Figures represent elasticity parameters and their associated functional forms that govern the interactions of these relationships. The direction of the arrows denote the flow of money (e.g. payment for intermediate inputs or final goods). The income and price elasticities in our model, where not specified, are derived from the GTAP database30 in line with the HMRC CGE modelling (2013) methodology. We have used these pictorial definitions throughout this Annex.
30 Hertel et al. (2012).
Annex A: CGE modelling

PwC 35
Figure A.1: The circular flow of income
Source: PwC
A.2 The consumption block The consumption block (see Figure A.2) outlines the organisation of consumption within the CGE model. In our model there are two sources of income: factor incomes, such as wages and gross operating surplus, and government transfers/subsidies from the redistribution of taxes collected. This income can then be spent in three ways: government expenditure, private expenditure, and savings products - otherwise known as national savings. Changes in the relative price of consumption are governed by a Cobb-Douglas function with unit elasticity.31 This means that a tax rise which increases the relative price of private expenditure by 1% would initially lead to a 1% reduction in the relative quantity of private expenditure. However, ensuing behavioural effects and relative price changes are likely to reduce this effect.
Figure A.2: The domestic consumption block
Source: PwC
Private and government expenditure lead to demand for domestic and imported goods, while savings products drive investments in the economy. Government spending is determined by a Cobb Douglas function with unit elasticity to represent spending in each sector being a constant proportion of total government spending. The CGE model accounts for international capital mobility through the balance of payments, i.e. a current account deficit must be matched by a capital account surplus.
31 We specify utility functions of the Cobb–Douglas form. The Cobb-Douglas function is a common functional form used in economic theory
(the most well-known use being in production).
Factor incomes Transfers/subsidies
Domestic consumption
Private expenditure (goods and services)
Savings productsGovernment
expenditure (goods and services)
Domestic Imports Investments Domestic Imports
Factor demandExports
Total imports
Domestic output
Gross value added Intermediate inputs
Capital Labour Domestic Imports
Factor incomes Transfers/subsidies
Domestic consumption
Private expenditure (goods and services)
Savings productsGovernment
expenditure (i.e. tax payments)
Cobb Douglas factor (1,0)
Income
Demand for goods and services
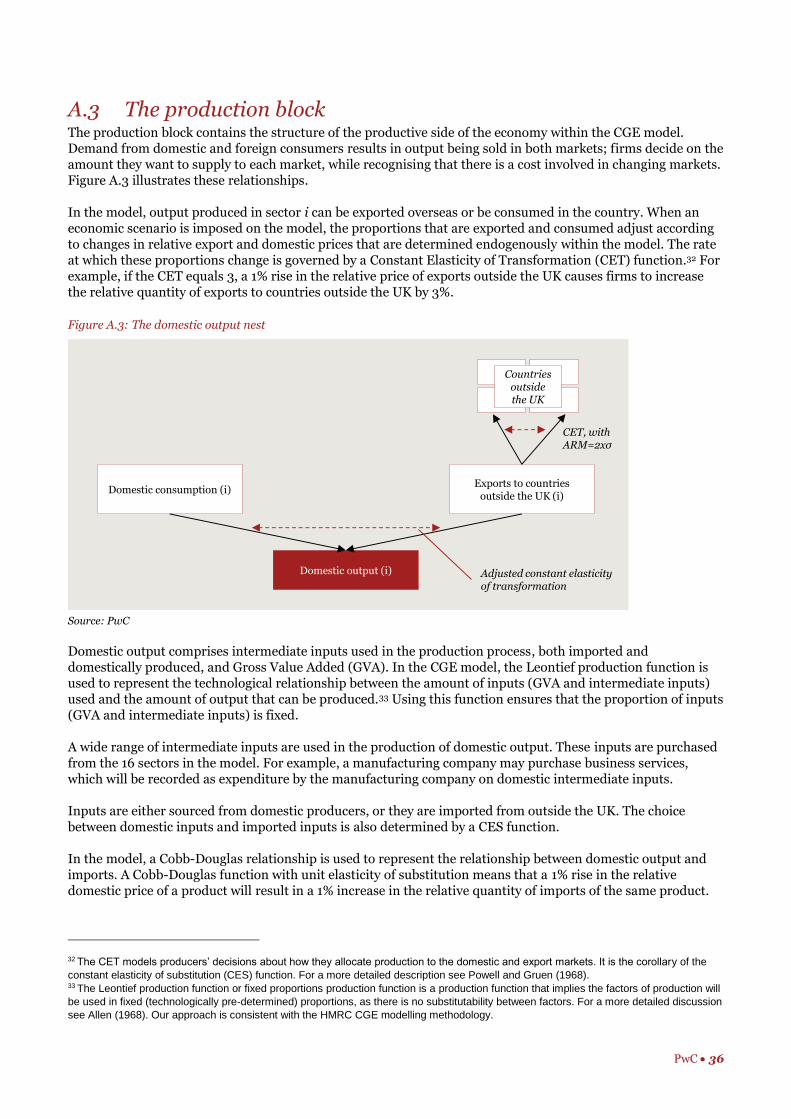
PwC 36
A.3 The production block The production block contains the structure of the productive side of the economy within the CGE model. Demand from domestic and foreign consumers results in output being sold in both markets; firms decide on the amount they want to supply to each market, while recognising that there is a cost involved in changing markets. Figure A.3 illustrates these relationships.
In the model, output produced in sector i can be exported overseas or be consumed in the country. When an economic scenario is imposed on the model, the proportions that are exported and consumed adjust according to changes in relative export and domestic prices that are determined endogenously within the model. The rate at which these proportions change is governed by a Constant Elasticity of Transformation (CET) function.32 For example, if the CET equals 3, a 1% rise in the relative price of exports outside the UK causes firms to increase the relative quantity of exports to countries outside the UK by 3%.
Figure A.3: The domestic output nest
Source: PwC
Domestic output comprises intermediate inputs used in the production process, both imported and domestically produced, and Gross Value Added (GVA). In the CGE model, the Leontief production function is used to represent the technological relationship between the amount of inputs (GVA and intermediate inputs) used and the amount of output that can be produced.33 Using this function ensures that the proportion of inputs (GVA and intermediate inputs) is fixed.
A wide range of intermediate inputs are used in the production of domestic output. These inputs are purchased from the 16 sectors in the model. For example, a manufacturing company may purchase business services, which will be recorded as expenditure by the manufacturing company on domestic intermediate inputs.
Inputs are either sourced from domestic producers, or they are imported from outside the UK. The choice between domestic inputs and imported inputs is also determined by a CES function.
In the model, a Cobb-Douglas relationship is used to represent the relationship between domestic output and imports. A Cobb-Douglas function with unit elasticity of substitution means that a 1% rise in the relative domestic price of a product will result in a 1% increase in the relative quantity of imports of the same product.
32 The CET models producers’ decisions about how they allocate production to the domestic and export markets. It is the corollary of the
constant elasticity of substitution (CES) function. For a more detailed description see Powell and Gruen (1968). 33 The Leontief production function or fixed proportions production function is a production function that implies the factors of production will
be used in fixed (technologically pre-determined) proportions, as there is no substitutability between factors. For a more detailed discussion
see Allen (1968). Our approach is consistent with the HMRC CGE modelling methodology.
Domestic consumption (i)
Domestic output (i)
Exports to countries outside the UK (i)
Adjusted constant elasticityof transformation
CET, with ARM=2xσ
Countries outside the UK

PwC 37
A.4 The Government sector Government performs two roles in the CGE model: collecting taxes and spending money. Government expenditure is split into the two main functions used in government accounting: Departmental Expenditure Limits (DEL)34 and Annually Managed Expenditure (AME).35
There is a specific category in the CGE that is a catch-all for the non-capital elements of government department spending (R-DEL). The model also captures capital spending by departments (DEL or C-DEL) which is government expenditure on capital investment projects such as infrastructure spending. The model estimates the government’s capital stock using the assumption that it depreciates at a rate of 5% per annum, so some government investment is necessary to preserve the level of capital.36
The model was constructed using assumptions about the burden of taxation across households in line with published HMRC statistics.37 The CGE model captures approximately 95% of all tax payments to the UK exchequer – taxes paid on a realisation basis, such as stamp duty and capital gains tax, are not modelled.38
The government budget balance is dictated by what is known in CGE modelling terms as a closure rule, i.e. the gap between government spending and receipts must be “closed” within the model each year. Suppose government DEL spending increases – then there are four main ways in which it can be closed in the model:
Harberger closure rule - Through an ad-hoc lump-sum tax on households;
Tax closure rule - Specific tax rates (VAT, corporation tax, income tax etc.) can increase to finance the additional spending;
Debt closure rule - The extra spending can be funded by increasing the fiscal deficit; and
Household transfer closure - Benefits can be cut.
For the purposes of this modelling exercise we use the debt closure rule, the contraction in GDP that results from a UK EU exit in both scenarios leads to a reduction in GDP and hence tax receipts. The subsequent fiscal deficit is then assumed to be financed by increasing Government debt.
The CGE model has built in “closure rules” to maintain fiscal balances. For instance, if the government chose to cut the corporate tax rate, then this would need to be financed from government spending, transfer payments, debt, or increases in other taxes. Furthermore, if the corporate tax cut increased the level of activity in the UK, then tax receipts in the UK would increase. As these effects ripple through the economy, the model would also automatically invoke the debt closure rule to bring fiscal positions back into balance.
A.5 The labour market and migration flows A dynamic labour market function underpins the CGE model. It incorporates a direct relationship between employment, wages and levels of economic activity. Its core properties are as follows:
Changes in wages can lead to workers entering or exiting the labour market;
Workers can move between sectors as these expand or contract depending on the level of economic activity;
If workers move between sectors, it is assumed they need to retrain (e.g. an investment banker cannot turn into a chef overnight). The model assumes a temporary loss in productivity as people retrain and consequently their wages fall during this period. This decline in wages approximates a degree of labour market rigidity in the model; and
The wage sensitivity of migration flows is governed by a separate elasticity parameter.
34 Spending which is planned and controlled on a multi-year basis in Spending Reviews. The DEL is the annual spending limit imposed on
a government department arising from its agreed, longer-term financial settlement with DFP. 35 Expenditure that is relatively volatile and largely demand-led that cannot reasonably be given firm, multi-year limits in the same way as
DEL. AME includes social security benefits, local authority self-financed expenditure, debt interest, and payments to EU institutions. 36 Our depreciation rate assumption comes from the OECD STAN Database. 37 HM Revenue and Customs (2013). 38 These taxes are captured separately in the models fiscal calculations and are assumed to grow in line with long-run OBR estimates in
line with their Fiscal Sustainability report.
PwC 38
Data on employee compensation are taken from ONS GVA figures, with gross wages being a subcomponent of employee compensation, the other component being benefits in kind (BIKs). BIKs consist of a range of financial and non-financial employee remuneration such as company mobile phones, vehicles, accommodation allowances etc. Employee compensation data are broken down by sector in the model.
A.6 Model dynamics The CGE model is dynamic. This means that it makes a forward looking projection of the economy over time. The model assumes perfect foresight and can simulate approximately 54 time periods. The length of time over which the model can simulate the economy is dependent on two main factors:
The complexity of the scenario and the magnitude of changes: More complex scenarios or scenarios with large changes to the economy use more computing power and make the model harder to solve, thus necessitating the need to reduce the number of time periods; and
The overall size of the model: the additional equations relating to the dynamic labour market and imperfect competition increase the size of the model considerably and therefore the required computing power.
Time periods are linked through savings, household utility, and capital accumulation. In each time period capital adjustment is governed by a standard depreciation plus investment function. The model is calibrated so that each time period is equal to one year. However, this is approximate and where possible the adjustment processes in the model need to be compared directly to econometric evidence about adjustment speeds to policy changes to refine the model’s accuracy. For the present study, we calibrated the model to produce annual results for the period to 2030.
Investment in each industry, and for each type of capital, is subject to installation costs whereby the cost of investment is related to the amount of installed capital.39 The equations are set up so that more rapid capital accumulation therefore becomes increasingly costly using a quadratic function.
The model is based on a long-term trend growth rate assumption of GDP of 2.3%, this is designed to be consistent with the trend growth assumption used in Government and OBR forecasts. Inflation is assumed to grow at 2% per annum in line with the Bank of England inflation target. The debt-to-GDP ratio is set based on the 2014/15 outturn for the supplementary target (83.1% of GDP). The parameter choices used CGE model in this instance is designed to reflect long-term trends in the UK economy, this modelling exercise is not designed to examine the interaction between UK EU exit and the business cycle.
A.7 Imperfect competition In the model, industries are imperfectly competitive with increasing returns to scale. Imperfect competition is based on the Dixit-Stiglitz large-firm Cournot structure and is based on a number of important assumptions including:40
Perceived or real entry by rival firms forces economic profits to zero;
Firms set a mark-up depending on their perception of the elasticity of demand for their product; and
Firms’ perception of their elasticity of demand is a function of the Herfindahl-Hirschman Index (HHI) in each sector and a conjectural variation parameter. This is used to calibrate firms’ market power in both domestic markets and overseas export markets for all commodities that they produce.
A.8 International trade The way in which the foreign sector is modelled in our CGE model is largely governed by the Armington (1969) assumption, whereby domestically produced and imported goods are treated as being qualitatively different. This assumption is used in most trade models. In CGE models, products are often differentiated on the basis of
39 Uzawa (1961) and Markusen et al. (2000).
40 Dixit and Stiglitz (1977).

PwC 39
their geographic point of production as well as by their physical characteristics, with “similar” products being close substitutes in demand.
The assumption of product heterogeneity is used to accommodate the statistical phenomenon of cross-hauling (the simultaneous importing and exporting of the same good) in the data used, and to exclude complete specialisation in production as a behavioural response in the model.

PwC 40
In this Annex we first outline the potential key impacts of EU exit on uncertainty. We then go on to describe how we have modelled this in different EU exit scenarios and discuss the justification for these assumptions as well as the uncertainties surrounding them. We conclude by briefly outlining how these effects feed through into model projections for GDP, including reference to estimates from other recent studies.
B.1 Potential key impacts of EU exit on uncertainty Increase in corporate and sovereign credit risk A vote to leave the EU could have an impact on firms’ credit risk, as the potential loss of access to the EU Single Market could have a negative impact on UK firms’ export earnings and put upward pressure on import prices. The impact is likely to be more pronounced for firms with a high degree of exposure to EU trade or with a significant share of assets in the UK, whose revenue streams may be affected by the potential imposition of tariffs on EU trade. This has, to an extent, already been observed in recent movements in sterling corporate debt markets. Spreads on UK investment grade corporate debt widened relative to European corporate bonds by 20 basis points in the first two months of 2016 and uncertainty around the outcome of the EU referendum has probably been one factor behind this, though it is difficult to isolate it from other factors (see Figure B.1).
Figure B.1: Spread differentials between UK and EU investment grade (10-year A-rated) corporate bonds
Source: Thomson Reuters Datastream, PwC analysis
Credit rating agencies have also suggested that the UK leaving the EU could lead to a downgrade in the sovereign credit ratings, as summarised in Table B.1 below.
A sovereign credit rating downgrade could result in investor outflows from UK gilts and other sterling assets. For example, the change in the UK’s outlook from neutral to negative in June 2015 by S&P was associated with non-resident outflows from UK gilts of around £4 billion.41 The near failure of a UK gilt auction in January 2016 also indicated some degree of elevated risk and uncertainty in gilt markets.42 UK fund managers also suffered
41 Deutsche Bank (2016). 42 Bloomberg (2016a).
0.0%
0.1%
0.2%
0.3%
0.4%
0.5%
0.6%
0.7%
0.8%2016
Annex B: Uncertainty and short-term impacts

PwC 41
the largest month of outflows in January 2016, pushing total funds under management £20 billion lower than levels recorded in January 2015.43 A heightened awareness of the possibility of a UK exit from the EU has probably been one factor behind these events (though not the only one), and this suggests there could be a significantly larger adverse market reaction if the UK actually did vote to leave the EU. By contrast, sterling asset markets may calm down somewhat if this risk is removed by a vote to remain in the EU on 23rd June.
Table B.1: Summary of views by credit rating agencies
Rating agency View
Standard & Poor’s
An S&P report in June 2015 stated that the UK faced a one-in-three chance of a downgrade in the next two years. In February 2016, its chief ratings officer reaffirmed that a vote to leave the EU could affect the UK’s credit rating, which could amount to at least a one-notch downgrade.44,45
Moody’s
Moody’s stated in December 2015 that the vote to leave the EU could negatively impact the UK’s credit rating. Its lead UK analyst said that this could be mitigated if the UK negotiates new trade deals with major partners quickly. Although they observe that it is likely to be a short-term growth impact, it is unlikely that the UK leaving the EU would alter the fundamentals of the economy.46
Fitch
Fitch reports that a vote to leave the EU could lead to a moderate credit downgrade for the UK due to putting at risk its medium-term growth and investment prospects, its external position, and the future of Scotland. However, they observe that over longer-term the impacts would be modest.47
Source: various (see footnotes)
A downgrade in the UK’s sovereign debt rating could have knock-on impacts on UK corporate credit ratings, particularly in the financial sector. Higher sovereign risk is likely to have an impact on cost of borrowing for banks and financial institutions to access wholesale funding, which would put upward pressure on their cost of funding.48 This could, in turn, have significant impacts on the cost of financing for other UK companies.
Sterling depreciation The recent depreciation of sterling at the end of February 2016 to 7-year lows against the US dollar could be another manifestation of uncertainty in financial markets over the possibility of the UK leaving the EU (see Figure B.2). This has not been the only factor in play - the role of delayed UK interest rate rises and underlying concerns about a widening UK current account deficit should also be acknowledged – but it seems likely to have played a part in recent sterling weakness.
If the UK were to vote to leave the EU, this could lead to potential sell-offs of UK assets and capital outflows, exacerbating the recent sterling depreciation. Some market commentators have suggested that sterling could depreciate by a further 10-15% in the aftermath of the referendum.49
43 Investment Association (2016). 44 However, S&P do say that the UK’s ratings could be upgraded if the economy maintained its influence. It cited the examples of Norway
and Switzerland – neither of whom are part of the EU – have an AAA rating. 45 Source: Bloomberg (2016b). 46 Source: Moody’s (2015). 47 Source: Fitch Ratings (2015). 48 Research by BIS (2011) suggests that rises in sovereign risk adversely affects banks’ funding costs via the following channels: (1) losses
on the holdings of government debt weaken banks’ balance sheets, which increases bank risks and, therefore, funding costs; (2) higher
sovereign risk also reduces the value of bank collateral in order to raise wholesale funding and liquidity; and (3) sovereign downgrades tend
to flow through to lower ratings for domestic banks. 49 Oxford Economics (2016) suggests that sterling could depreciate by 15% relative to the dollar in the short-term, and in the medium-term
the value of sterling could be around 9% below their baseline. While JP Morgan (2016) suggests that the rate of sterling depreciation could
be in the order of 10%.
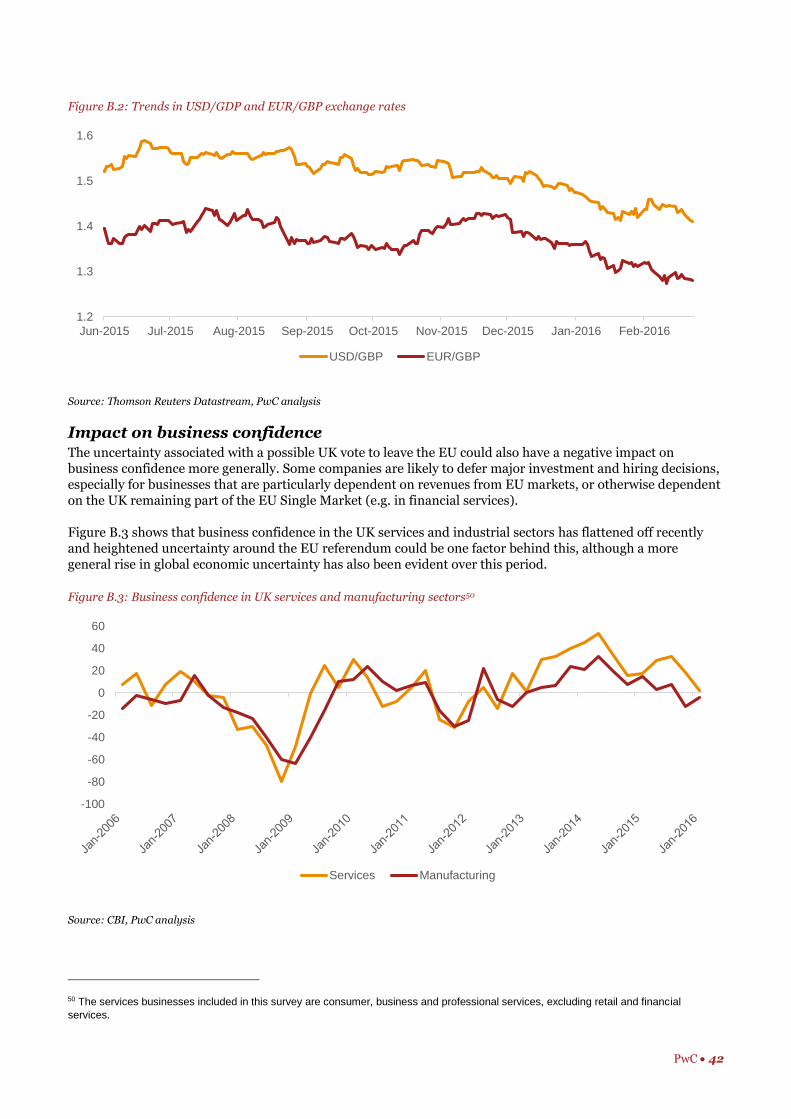
PwC 42
Figure B.2: Trends in USD/GDP and EUR/GBP exchange rates
Source: Thomson Reuters Datastream, PwC analysis
Impact on business confidence The uncertainty associated with a possible UK vote to leave the EU could also have a negative impact on business confidence more generally. Some companies are likely to defer major investment and hiring decisions, especially for businesses that are particularly dependent on revenues from EU markets, or otherwise dependent on the UK remaining part of the EU Single Market (e.g. in financial services).
Figure B.3 shows that business confidence in the UK services and industrial sectors has flattened off recently and heightened uncertainty around the EU referendum could be one factor behind this, although a more general rise in global economic uncertainty has also been evident over this period.
Figure B.3: Business confidence in UK services and manufacturing sectors50
Source: CBI, PwC analysis
50 The services businesses included in this survey are consumer, business and professional services, excluding retail and financial
services.
1.2
1.3
1.4
1.5
1.6
Jun-2015 Jul-2015 Aug-2015 Sep-2015 Oct-2015 Nov-2015 Dec-2015 Jan-2016 Feb-2016
USD/GBP EUR/GBP
-100
-80
-60
-40
-20
0
20
40
60
Services Manufacturing
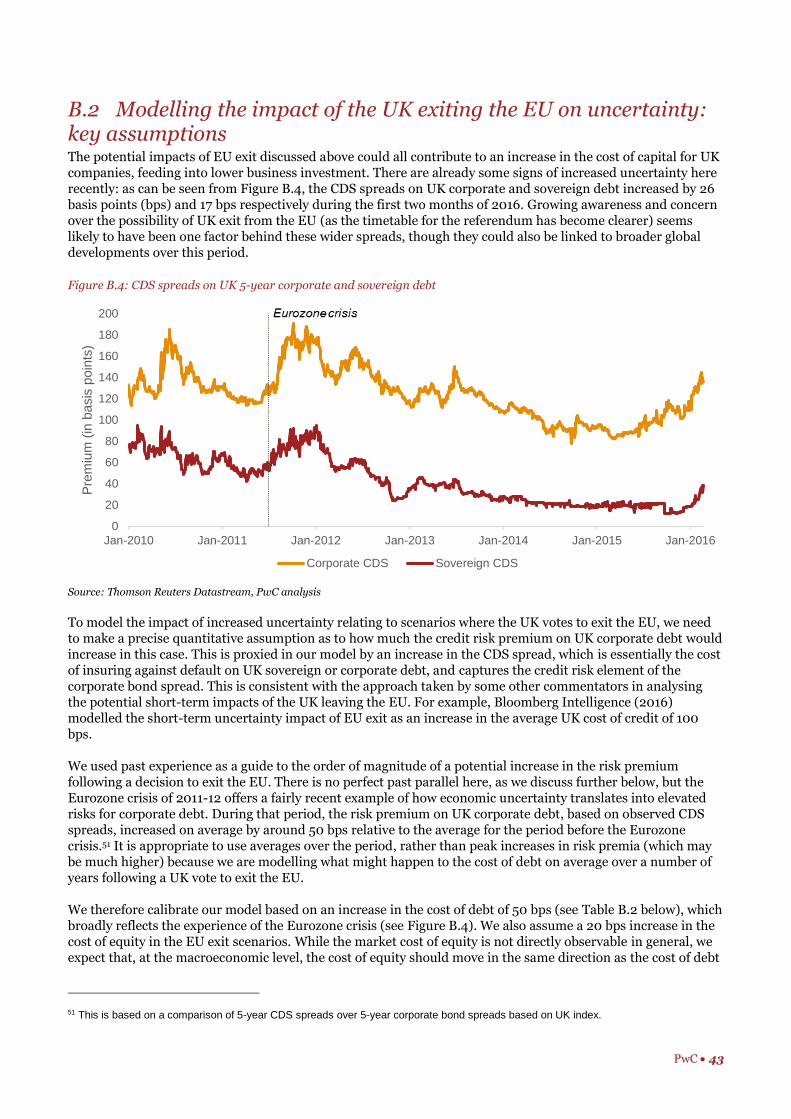
PwC 43
B.2 Modelling the impact of the UK exiting the EU on uncertainty: key assumptions The potential impacts of EU exit discussed above could all contribute to an increase in the cost of capital for UK companies, feeding into lower business investment. There are already some signs of increased uncertainty here recently: as can be seen from Figure B.4, the CDS spreads on UK corporate and sovereign debt increased by 26 basis points (bps) and 17 bps respectively during the first two months of 2016. Growing awareness and concern over the possibility of UK exit from the EU (as the timetable for the referendum has become clearer) seems likely to have been one factor behind these wider spreads, though they could also be linked to broader global developments over this period.
Figure B.4: CDS spreads on UK 5-year corporate and sovereign debt
Source: Thomson Reuters Datastream, PwC analysis
To model the impact of increased uncertainty relating to scenarios where the UK votes to exit the EU, we need to make a precise quantitative assumption as to how much the credit risk premium on UK corporate debt would increase in this case. This is proxied in our model by an increase in the CDS spread, which is essentially the cost of insuring against default on UK sovereign or corporate debt, and captures the credit risk element of the corporate bond spread. This is consistent with the approach taken by some other commentators in analysing the potential short-term impacts of the UK leaving the EU. For example, Bloomberg Intelligence (2016) modelled the short-term uncertainty impact of EU exit as an increase in the average UK cost of credit of 100 bps.
We used past experience as a guide to the order of magnitude of a potential increase in the risk premium following a decision to exit the EU. There is no perfect past parallel here, as we discuss further below, but the Eurozone crisis of 2011-12 offers a fairly recent example of how economic uncertainty translates into elevated risks for corporate debt. During that period, the risk premium on UK corporate debt, based on observed CDS spreads, increased on average by around 50 bps relative to the average for the period before the Eurozone crisis.51 It is appropriate to use averages over the period, rather than peak increases in risk premia (which may be much higher) because we are modelling what might happen to the cost of debt on average over a number of years following a UK vote to exit the EU.
We therefore calibrate our model based on an increase in the cost of debt of 50 bps (see Table B.2 below), which broadly reflects the experience of the Eurozone crisis (see Figure B.4). We also assume a 20 bps increase in the cost of equity in the EU exit scenarios. While the market cost of equity is not directly observable in general, we expect that, at the macroeconomic level, the cost of equity should move in the same direction as the cost of debt
51 This is based on a comparison of 5-year CDS spreads over 5-year corporate bond spreads based on UK index.
0
20
40
60
80
100
120
140
160
180
200
Jan-2010 Jan-2011 Jan-2012 Jan-2013 Jan-2014 Jan-2015 Jan-2016
Pre
miu
m (
in b
asis
poin
ts)
Corporate CDS Sovereign CDS

PwC 44
in the face of a major impact of this kind.52 In support of this assumption, we observe that Ita (2015) showed that, on average, there is a statistically significant positive relationship between cost of equity, CDS spreads, and the risk-free rate. Based on this relationship, we scaled the impact on cost of debt to derive an estimate of a cost of equity increase of around 20 bps.53
It is important to note that these cost of capital impacts apply relative to the counterfactual scenario where the UK votes to remain in the EU, in which case some of the recent rise in the risk premia on UK assets described above may unwind. We are not assuming that the cost of debt in the case of exit would be 50 bps higher than it was immediately before the EU referendum, just that it would be 50 bps higher than in the case of a vote to remain in the EU.
Table B.2: Assumed risk premium impacts under alternative EU exit scenarios (relative to the counterfactual with
continued EU membership)
FTA scenario WTO scenario
Increase in cost of debt 50 bps 50 bps
Increase in cost of equity 20 bps 20 bps
Duration of impact* 5 years 9 years
Source: PwC assumptions
*Risk premia peak at the levels shown in 2017-18 in both scenarios, but then fade away more gradually in the WTO scenario.
For simplicity, we apply the same size of cost of capital impacts to the model for both scenarios. This reflects the fact that these impacts are likely to manifest themselves from the moment when the EU referendum decision is known in mid-2016, while it could be many years before it is clear which post-exit scenario is being followed. Instead, we differentiate the two exit scenarios based on the duration of the cost of capital impact, which we assume to last for a total of 5 years in the FTA scenario (i.e. ending in 2021), but for 9 years in the WTO scenario (i.e. ending in 2025).
The 5 year assumption in our FTA scenario reflects historical experience, which suggests that negotiating FTAs can take a long time, although we assume that the impact on the risk premium peaks in 2017-18 with a gradual reduction towards zero over the following three years. In the WTO scenario, we assume that the elevated risk premium also peaks in 2017-18 at the same level, but then takes seven more years to fade away entirely as negotiations on post-exit arrangements drag on and are ultimately unsuccessful.
Uncertainties and caveats relating to our model assumptions It is difficult to calibrate the scale and duration of an uncertainty impact of this kind given the unprecedented nature of a possible UK exit from the EU. We looked at a variety of past events such as UK exit from the ERM in 1992, the global financial crisis of 2008-9 and the Eurozone crisis of 2011-12, but none offer a perfect parallel. In particular:
The UK’s exit from the ERM in 1992 allowed a sharp fall in UK interest rates (due to de-linking these from German rates), which swamped any change in risk premia. This is not an option at present given that official UK interest rates are close to zero.
The global financial crisis of 2008-9 was an event unprecedented since at least the early 1930s and, while CDS risk premia rose by much more than 50 bps at that time, this probably overstates the likely effects of a UK vote to exit the EU, which would be a significant event but not one that posed such a severe threat to global macroeconomic and financial stability.
52 Both debt and equity are claims on assets of firms. While it is possible that cost of debt and cost of equity for an individual company to
move in different directions as risk is being shifted from one type of capital to another, from an economy-wide point of view, an external
shock would change the level of risk inherent in the cash flow of firms, and moves the economy-wide average cost of debt and cost of
equity in the same direction. 53 Source: Ita, A. (2015) “Credit Default Swap Spreads and Implied Cost of Equity”. Barone-Adesi and Brughelli (2010) also find that there
is a positive cointegration relationship between CDS spread and the implied cost of equity. Chava and Purnanandam (2009) also show that
there is a positive correlation between default risk and implied cost of equity.
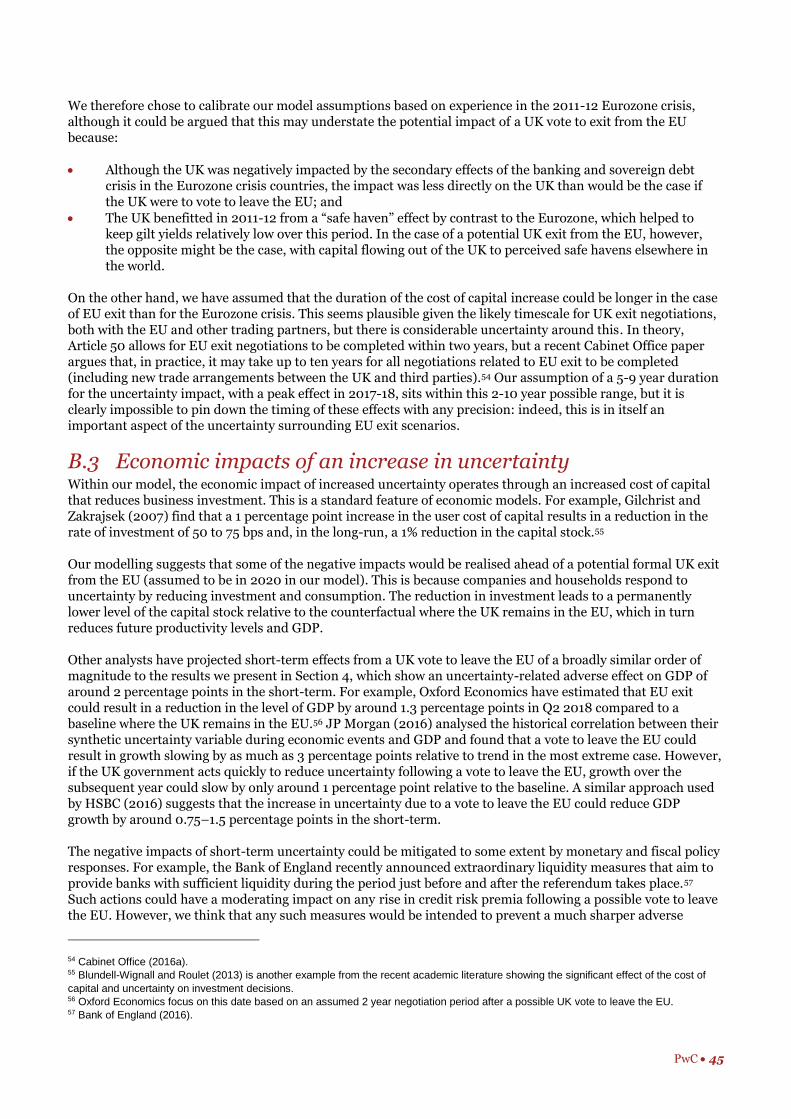
PwC 45
We therefore chose to calibrate our model assumptions based on experience in the 2011-12 Eurozone crisis, although it could be argued that this may understate the potential impact of a UK vote to exit from the EU because:
Although the UK was negatively impacted by the secondary effects of the banking and sovereign debt crisis in the Eurozone crisis countries, the impact was less directly on the UK than would be the case if the UK were to vote to leave the EU; and
The UK benefitted in 2011-12 from a “safe haven” effect by contrast to the Eurozone, which helped to keep gilt yields relatively low over this period. In the case of a potential UK exit from the EU, however, the opposite might be the case, with capital flowing out of the UK to perceived safe havens elsewhere in the world.
On the other hand, we have assumed that the duration of the cost of capital increase could be longer in the case of EU exit than for the Eurozone crisis. This seems plausible given the likely timescale for UK exit negotiations, both with the EU and other trading partners, but there is considerable uncertainty around this. In theory, Article 50 allows for EU exit negotiations to be completed within two years, but a recent Cabinet Office paper argues that, in practice, it may take up to ten years for all negotiations related to EU exit to be completed (including new trade arrangements between the UK and third parties).54 Our assumption of a 5-9 year duration for the uncertainty impact, with a peak effect in 2017-18, sits within this 2-10 year possible range, but it is clearly impossible to pin down the timing of these effects with any precision: indeed, this is in itself an important aspect of the uncertainty surrounding EU exit scenarios.
B.3 Economic impacts of an increase in uncertainty Within our model, the economic impact of increased uncertainty operates through an increased cost of capital that reduces business investment. This is a standard feature of economic models. For example, Gilchrist and Zakrajsek (2007) find that a 1 percentage point increase in the user cost of capital results in a reduction in the rate of investment of 50 to 75 bps and, in the long-run, a 1% reduction in the capital stock.55
Our modelling suggests that some of the negative impacts would be realised ahead of a potential formal UK exit from the EU (assumed to be in 2020 in our model). This is because companies and households respond to uncertainty by reducing investment and consumption. The reduction in investment leads to a permanently lower level of the capital stock relative to the counterfactual where the UK remains in the EU, which in turn reduces future productivity levels and GDP.
Other analysts have projected short-term effects from a UK vote to leave the EU of a broadly similar order of magnitude to the results we present in Section 4, which show an uncertainty-related adverse effect on GDP of around 2 percentage points in the short-term. For example, Oxford Economics have estimated that EU exit could result in a reduction in the level of GDP by around 1.3 percentage points in Q2 2018 compared to a baseline where the UK remains in the EU.56 JP Morgan (2016) analysed the historical correlation between their synthetic uncertainty variable during economic events and GDP and found that a vote to leave the EU could result in growth slowing by as much as 3 percentage points relative to trend in the most extreme case. However, if the UK government acts quickly to reduce uncertainty following a vote to leave the EU, growth over the subsequent year could slow by only around 1 percentage point relative to the baseline. A similar approach used by HSBC (2016) suggests that the increase in uncertainty due to a vote to leave the EU could reduce GDP growth by around 0.75–1.5 percentage points in the short-term.
The negative impacts of short-term uncertainty could be mitigated to some extent by monetary and fiscal policy responses. For example, the Bank of England recently announced extraordinary liquidity measures that aim to provide banks with sufficient liquidity during the period just before and after the referendum takes place.57 Such actions could have a moderating impact on any rise in credit risk premia following a possible vote to leave the EU. However, we think that any such measures would be intended to prevent a much sharper adverse
54 Cabinet Office (2016a). 55 Blundell-Wignall and Roulet (2013) is another example from the recent academic literature showing the significant effect of the cost of
capital and uncertainty on investment decisions. 56 Oxford Economics focus on this date based on an assumed 2 year negotiation period after a possible UK vote to leave the EU. 57 Bank of England (2016).

PwC 46
market reaction of the kind seen, for example, during the global financial crisis, rather than being likely to avoid any increase in risk premia. This judgment is based on the fact that no such action by the central bank could eliminate the underlying uncertainty relating to the UK’s post-exit relationship with the EU and other trading partners.

PwC 47
In this Annex we first outline the economic context and key issues in relation to the UK’s trading relationship with the EU and non-EU countries. We then set out the potential impacts of the UK’s exit from the EU on trade and investment, and describe how we have modelled changes in tariffs and non-tariff barriers in different EU exit scenarios. We also discuss the justification for these assumptions as well as the uncertainties surrounding them, referencing estimates from other recent studies.
C.1 Economic context and key issues Free trade in goods and services is one of the four fundamental freedoms of the EU Single Market. As a result, UK businesses are able to export goods tariff-free to other EU Member States. Similarly, businesses in EU countries can also export goods to the UK without any tariffs being applied to them.
The rest of the EU remains by far the largest overseas market for UK goods and services. However, the EU share of total UK goods and services exports has been declining in recent years. UK exports to the EU accounted for around 55% of total UK exports in 1999 but the share has since fallen to 45% (as of 2014), as shown in Figure C.1.58 Despite this, the rest of the EU remains an important market for all the major trading sectors of the UK economy. On the other hand, the UK accounts for around a tenth of EU exports.59
Figure C.1: Percentage of UK exports to EU and non-EU countries
Source: ONS, PwC analysis
Figure C.2 shows the UK’s net exports of goods and services to the EU by sector in 2014. The maroon bars represent service sectors, and the orange bars represent goods sectors. Five of the seven sectors in which the UK has a trade surplus are services sectors. The UK enjoys a surplus of around £10 billion in services trade with the EU, which is due in large part to the £20 billion surplus in trade in financial services and insurance. Other major services exports to the EU include business services (such as legal and accounting, and administrative services), travel and transport services.
58 Trade data for 2015 has not been published – hence we are reporting 2014 figures. 59 Global Counsel (2015).
30%
40%
50%
60%
1999 2000 2001 2002 2003 2004 2005 2006 2007 2008 2009 2010 2011 2012 2013 2014
% o
f U
K e
xp
ort
s
% of exports to EU % of exports to non-EU
Annex C: Trade and investment

PwC 48
Figure C.2: UK net exports of goods and services to the EU, 2014
Source: OECD, PwC analysis
Although much discussion has centred on the importance of emerging markets as UK export markets, they are not yet that significant. We still export more to Ireland, for example, than to China and Hong Kong combined. In the future, we expect this to change, but it would be a slow process, as this would require structural adjustments to reorient exports towards emerging markets.
Reflecting these strong trading relationships with the EU, Figure C.3 shows that the UK’s inward foreign direct investment (FDI) position has grown steadily over time since its accession to the EU and the creation of the Single Market, reaching around £1 trillion in 2014. Around half of these inflows can be attributed to investment by companies in other EU countries.
There is a wide range of evidence to suggest that EU membership has contributed to FDI growth in the UK by enhancing access to a larger market. For example, by using the UK as a production base for exporting to the rest of the Single Market, non-EU producers could avoid the costs associated with external tariffs which might otherwise be imposed on their products.60
Figure C.3: UK inward FDI investment position by source region
Source: ONS,, PwC analysis
60 For example, historical studies on the impact of the UK’s EU membership such as Barrell and Pain (1998) found that EU membership
had a significant positive impact on the stock of US FDI in the UK, Ireland, Spain and Sweden. More recent studies such as Straathof et al.
(2008) also show that EU membership boosted bilateral FDI stock of EU countries by 28%. The Bank of England (2015) also provides
evidence that inward FDI stocks have increased faster in both the UK and EU (as a percentage of GDP) than the US and the rest of the
world since the establishment of the Single Market in 1993.
14.1
0.3
-3.3
-6.9
-9.8
16.1
3.9
1.6
1.4
0.9
-0.5
-1.3
-1.9
-2.9
-8.5
-15 -10 -5 0 5 10 15 20
Financial
Fuels
Insurance & pension
Telecoms & information services
Intellectual property
Personal, cultural & recreational
Unspecified goods
Construction
Government
Other business services
Transport
Basic materials
Other manufactured goods
Travel
Material manufactures
Net exports (£ billion)
Goods Services
-
200
400
600
800
1,000
1,200
2005 2006 2007 2008 2009 2010 2011 2012 2013 2014
£ b
illio
n
EU US Rest of world

PwC 49
C.2 Potential key impacts of EU exit on trade and investment There are a number of key mechanisms by which the UK’s exit from the EU could affect its trade:
Increase in tariff barriers;
Increase in non-tariff barriers (NTBs);
Opportunity costs from forgoing future decreases in intra-EU non-tariff barriers; and
Impacts on future trade agreements with non-EU countries.
Increase in tariff barriers One of the four fundamental freedoms of the EU Single Market is that there is free trade in goods and services. As a result, UK businesses are able to export goods tariff-free to other EU Member States and vice versa. Following the UK’s exit from the EU, the UK would no longer have automatic access to the EU Single Market and it would be at risk of paying external tariffs levied on many third party countries to access other key European markets (see Table C.1).
Table C.1: MFN tariffs applied by the EU on goods trade by sector of production
Sector EU MFN tariff
Agriculture, fisheries and forestry 5.6%
Mining and quarrying 0.0%
Food, beverage and tobacco manufacturing 5.0%
Chemical manufacturing 2.2%
Transport equipment 7.2%
Other manufacturing 2.8%
Source: Ottaviano et al. (2014) and PwC analysis
Increase in non-tariff barriers Although tariffs are not applicable to goods or services trade under the EU Single Market framework, local regulations in some sectors act as a non-monetary barrier to cross-border trade. These are known as non-tariff barriers (NTBs). NTBs add to the costs of trade in both goods and services. Examples of NTBs include regulatory requirements, language, currency, legal barriers, and other transaction costs.
Another part of NTBs are border costs, such as time spent at customs checks and export/import administration. These costs could also increase following a UK exit from the EU. According to Ciuriak et al. (2015), border costs could cost the UK 1.2% of GDP if the UK leaves the EU and is then unable to negotiate a favourable trade deal.
The type and characteristics of NTBs that apply to goods and services trade differ significantly. For example, when agricultural or manufactured goods are imported into a country, these need to satisfy local product standard requirements. However, banks wishing to establish a branch in another country face different NTBs, such as specific capital requirements that need to be met. Trade in services typically requires the movement of people and financial capital across countries. With some exceptions, the majority of services are by their nature, non-tradable. Trade barriers are not restricted to quantifiable and observable barriers, such as import tariffs, but comprise of a complex set of trade regulations, restrictions and prohibitions, that limit market access of foreign suppliers.
As a result of barriers to services trade, the prices of services could increase, not because the real resource costs of producing these have gone up, but because incumbent firms are able to earn economic rents. Services trade restrictions also increase the real resource cost of doing business. An example is the cost of retraining foreign professionals in a new country. Liberalisation of such barriers would therefore increase productivity by reducing real resource costs for businesses and reducing the costs for other users in the economy.
One of the major benefits of being part of the EU Single Market framework is that it has helped to reduce NTBs within the EU. For example, by harmonising regulations such as product standards across 28 Member States,

PwC 50
or the passporting regime for financial services.61 This reduces the overall cost of compliance for businesses as they are only required to comply with one set of standards rather than one for each Member State to which they export.62 NTBs on trade between the UK and the rest of the EU for both goods and services may therefore increase after the UK’s exit due to gradual regulatory divergence. For example, should the UK lose the benefits of the single passport for financial services, it is likely that UK banks would have to face higher NTBs when providing services to EU clients, such as higher capitalisation requirements (should they be required to establish a subsidiary in the EU). These NTBs are likely to persist unless the UK agrees an FTA with the EU that also covers services.63
NTBs are important when considering the trade impact of the UK leaving the EU on trade and there is evidence from the academic literature that the costs of NTBs to trade are higher than tariff costs.64 LooiKee, Nicita and Olarrega (2009) finds that on average, NTBs add an additional 87% to the level of trade restrictiveness imposed by tariffs.65
As part of our modelling of the potential costs and benefits of the UK leaving the EU, we have sought to measure the current NTBs applied to trade between the UK and EU and non-EU countries. This estimation is done using the following two steps:
1. Step 1: Bilateral trade flows are modelled, providing an estimate of “normal” trade between the UK and the partner country. The estimation of “normal” trade is computed using a gravity model of international trade. In the model bilateral trade is determined (positively) by the size of both countries and (negatively) by the distance between them – while accounting for various other variables which impact trade flows, such as exchange rate movements, corruption and the sharing of a common language. The difference between actual and “normal” trade is then attributed to the non-tariff barriers.
2. Step 2: We compare “normal” and actual trade by computing a protection rate from our econometric results. This rate is a measure of the level of trade protection, i.e. non-tariff barriers, between the two countries; the higher the rate, the more non-tariff barriers exist. These barriers may be logistical, cultural and historical, but they can also reflect barriers imposed through national economic policies and regulations.
Our estimated protection rates are reported in Tables C.2 and C.3. Manufacturing (excluding food and transport) has the lowest protection rate, at only 8% for non-EU countries and 12.7% for EU countries. For UK imports, manufacturing again has the lowest protection rates.
We find that NTBs in services sector exports to the EU are on average lower than non-EU countries. This is very significant for the UK which has the highest services export share (as a percentage of GDP) of any G7 economy and runs a substantial export surplus in services. However, the EU imposes slightly higher NTBs on UK goods exports compared to non-EU countries.
Similar to the impacts of an increase in tariffs, an increase in NTBs is also likely to increase the costs of UK exports to the rest of the EU, relative to exports from countries still in the EU. These are all significant impacts on the UK, as the UK’s comparative advantage is in the services industry (and NTBs are the main barriers to trade for the services sector). Ottaviano et al. (2014) estimates the increase in EU / UK NTBs results in a reduction in UK GDP of between around 0.4% and 0.9% of GDP depending on whether the UK is able to
61 The passporting regime enables banks and investment companies authorised in an EEA state to provide services in other EEA states via
a branch or providing services across borders. 62 Mejean and Schwellnus (2009) sought to provide a quantitative estimate of the effect of European economic integration on the speed of
price convergence, which is a sign of falling NTB (i.e. price converges when there are smaller barriers to trade). Their work suggested that
this can be interpreted in two ways. First, firms may find it harder to discriminate between markets in the EU because of stronger arbitrage
pressures. The second possible explanation is that because fixed entry costs are lower in EU markets, less productive firms are able to
serve those markets. Mejean and Schwellnus (2009) argue that if productivity is correlated with price decisions, it can be argued that firms
serving EU markets also have less discriminatory pricing strategies. 63 However, it is worth noting that the Single Market in services is still in progress, and there are ongoing efforts to drive greater
harmonisation of national rules across the EU. See European Parliamentary Research Service (2014). 64 Anderson and van Wincoop (2004) and Novy (2013). 65 Trade restrictiveness indices (TRI) are measures of welfare loss caused by trade policy instruments, such as tariffs.

PwC 51
negotiate a favourable trade deal with the EU after voting to leave.66 Similarly, Ciuriak et al. (2015) estimate the increase in EU / UK goods and services NTBs to cost the UK around 0.1% to 0.6% of GDP depending on whether the UK is able to negotiate a favourable trade deal with the EU after exiting the EU.
Table C.2: NTBs (in ad-valorem tariff equivalents) faced by UK exports to EU and non-EU countries67
NTBs non-EU (%) NTBs EU (%)
Business services 27.1 23.8
Financial services 80.2 71.4
Services 44.5 35.6
Food and accommodation 538.6 303.6
Other manufacturing 8.0 12.7
Chemistry 12.4 12.7
Transport equipment 23.1 24.6
Source: PwC analysis
Table C.3: NTBs (in ad-valorem tariff equivalents) applied to non-EU and EU imports
NTBs non-EU (%) NTBs EU (%)
Business services 62.3 33.3
Financial services 64.8 88.6
Transport 16.0 28.6
Food and accommodation 125.0 175.9
Food manufacturing 37.4 33.3
Other manufacturing 10.5 16.6
Transport equipment 28.1 57.7
Source: PwC analysis
Potential future decreases in intra-EU non-tariff barriers Academic literature finds that intra-EU NTBs have been falling over time, and that the rate at which they are falling is 40% faster than in other OECD countries.68 One of the implications of the UK exiting the EU is that the UK would not be able to benefit from future falls in NTBs as a result of further integration in the EU in the medium- to long-term. This is a potentially significant opportunity cost for the UK leaving the EU, especially if the NTB reductions primarily affect the services sector, in which the UK has a comparative advantage. Ciuriak et al. (2015) have estimated the potential cost of the lost opportunity to be between -1.3% and -2.6% of GDP depending on whether the UK would be able to negotiate a favourable trade deal with the EU after leaving the EU. To capture this opportunity cost, we model the counterfactual such that it takes into account gradual reductions in NTBs on EU trade.
Impact on external trade policy One of the potential benefits of the UK exiting the EU is that the UK would be able to pursue its own trade policy, independent of the interests of other EU Member States. For example, the UK would be able to negotiate FTAs with other large economies and fast growing emerging markets without the burden of needing to negotiate as a whole trade bloc. The EU has historically focused on goods trade rather than services trade (which is where the UK’s comparative advantage primarily lies), which suggests that the interests of the UK and the EU have not always been fully aligned in past trade negotiations. Ciuriak et al. (2015) note that an FTA with
66 This estimate excludes border costs. 67 The sectors in the table form 82% of total UK exports in 2011. 68 Mejean and Schwellnus (2009).
PwC 52
major East Asian economies (China, Japan, India, and the Association of Southeast Asian Nations) could generate something on the order of a net of 0.6% of GDP for the UK.
Existing studies finds that the benefits to the UK of being able to negotiate a quicker FTA with deeper liberalisation commitments with the US (compared to a counterfactual scenario where the UK stays within the EU and a TTIP implementation in 2020) is between 0.02% and 0.04% increase in GDP.69
However, exiting the EU also has an impact on existing trade agreements that the EU has with other countries. The EU currently has existing Preferential trading agreements (PTAs) with 53 countries, and it is negotiating trade agreements with another 72 countries. So in practice, should the UK leave the EU, the UK may need to re-negotiate 125 trade agreements.70
C.3 Modelling the impact of the UK exiting the EU on trade and investment: key assumptions To capture the issues described above in our analysis, we have modelled two scenarios to reflect the potential changes in NTBs for goods and services:
FTA scenario: The UK manages to negotiate a FTA deal with the EU. This means that a continuation of zero-tariff trade in goods. NTBs between UK-EU would increase by one quarter of the differential between the NTBs faced by UK exports to the rest of the world and the EU, reflecting minor divergence between regulation and standards between the UK and the rest of the EU. Existing FTAs between the EU and other countries are grandfathered such that they continue to apply to the UK. In our modelling, we have also assumed that the UK takes advantage of its ability to pursue its own external trade policy independently by negotiating an FTA with the US. The UK would also be able to accelerate their trade negotiations with the US.71 The US-UK FTA would then be implemented in 2021.
WTO scenario: The UK fails to strike a trade deal with the rest of the EU – hence the tariffs on goods trade with the EU revert to MFN basis. NTBs between UK-EU would increase by three quarters of the differential between the NTBs faced by UK exports to the rest of the world and the EU. This represents major divergence between regulation and standards between the UK and the rest of the EU. When the UK exits the EU in 2020, existing FTAs between the EU and the other countries would need to be re-negotiated. Trade with those countries revert back to a WTO MFN basis. We assume that the re-negotiations take 5 years to complete (this is shorter than historical EU trade negotiations, as we assume that the UK is able to accelerate discussions once it exits the EU), and that FTAs with those countries would be implemented in 2026. We also assume that the FTA with the US would take longer to negotiate, partly because the UK would conduct these negotiations in parallel with other re-negotiations. We assume that the FTA with the US would take effect in 2026.
The model calibrations under the trade impact for both scenarios are summarised in Table C.4. In our scenarios, we anticipate that the EU would continue to honour existing trade arrangements with the UK under the provisions of the Single Market following a vote to leave the EU. These trading arrangements would continue until the end of 2019 but thereafter the outcome depends on the ability of the UK to negotiate its own trading relationships, both with the EU and other countries. In both scenarios, the trade policy changes therefore come into effect in 2020 in our CGE modelling exercise.
69 Ciuriak et al. (2015). 70 Cabinet Office (2016b) and Hüttl and Merler (2016). 71 Potentially on the basis of current TTIP negotiations.
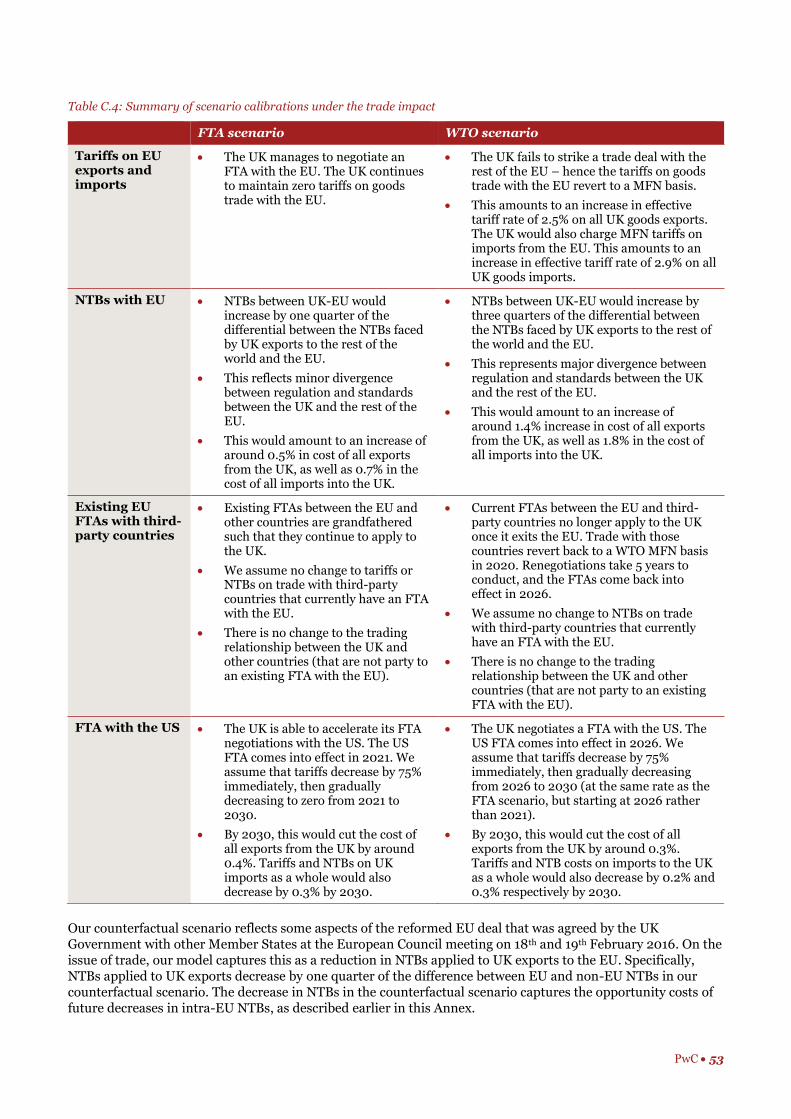
PwC 53
Table C.4: Summary of scenario calibrations under the trade impact
FTA scenario WTO scenario
Tariffs on EU exports and imports
The UK manages to negotiate an FTA with the EU. The UK continues to maintain zero tariffs on goods trade with the EU.
The UK fails to strike a trade deal with the rest of the EU – hence the tariffs on goods trade with the EU revert to a MFN basis.
This amounts to an increase in effective tariff rate of 2.5% on all UK goods exports. The UK would also charge MFN tariffs on imports from the EU. This amounts to an increase in effective tariff rate of 2.9% on all UK goods imports.
NTBs with EU NTBs between UK-EU would increase by one quarter of the differential between the NTBs faced by UK exports to the rest of the world and the EU.
This reflects minor divergence between regulation and standards between the UK and the rest of the EU.
This would amount to an increase of around 0.5% in cost of all exports from the UK, as well as 0.7% in the cost of all imports into the UK.
NTBs between UK-EU would increase by three quarters of the differential between the NTBs faced by UK exports to the rest of the world and the EU.
This represents major divergence between regulation and standards between the UK and the rest of the EU.
This would amount to an increase of around 1.4% increase in cost of all exports from the UK, as well as 1.8% in the cost of all imports into the UK.
Existing EU FTAs with third-party countries
Existing FTAs between the EU and other countries are grandfathered such that they continue to apply to the UK.
We assume no change to tariffs or NTBs on trade with third-party countries that currently have an FTA with the EU.
There is no change to the trading relationship between the UK and other countries (that are not party to an existing FTA with the EU).
Current FTAs between the EU and third-party countries no longer apply to the UK once it exits the EU. Trade with those countries revert back to a WTO MFN basis in 2020. Renegotiations take 5 years to conduct, and the FTAs come back into effect in 2026.
We assume no change to NTBs on trade with third-party countries that currently have an FTA with the EU.
There is no change to the trading relationship between the UK and other countries (that are not party to an existing FTA with the EU).
FTA with the US The UK is able to accelerate its FTA negotiations with the US. The US FTA comes into effect in 2021. We assume that tariffs decrease by 75% immediately, then gradually decreasing to zero from 2021 to 2030.
By 2030, this would cut the cost of all exports from the UK by around 0.4%. Tariffs and NTBs on UK imports as a whole would also decrease by 0.3% by 2030.
The UK negotiates a FTA with the US. The US FTA comes into effect in 2026. We assume that tariffs decrease by 75% immediately, then gradually decreasing from 2026 to 2030 (at the same rate as the FTA scenario, but starting at 2026 rather than 2021).
By 2030, this would cut the cost of all exports from the UK by around 0.3%. Tariffs and NTB costs on imports to the UK as a whole would also decrease by 0.2% and 0.3% respectively by 2030.
Our counterfactual scenario reflects some aspects of the reformed EU deal that was agreed by the UK Government with other Member States at the European Council meeting on 18th and 19th February 2016. On the issue of trade, our model captures this as a reduction in NTBs applied to UK exports to the EU. Specifically, NTBs applied to UK exports decrease by one quarter of the difference between EU and non-EU NTBs in our counterfactual scenario. The decrease in NTBs in the counterfactual scenario captures the opportunity costs of future decreases in intra-EU NTBs, as described earlier in this Annex.

PwC 54
Table C.5 and C.6 show how the trade impacts described in Table C.4 above are captured in the CGE model.
Table C.5: Capturing trade impacts in the CGE model
Exports Imports
Tariffs Since tariffs are essentially a transfer from UK exporters to foreign countries, an increase in export tariffs is modelled as a decrease in the world price of UK exports in the CGE model.
We apply a change to the import tariff variable in the CGE model to capture increases in import tariffs.
NTBs An increase in export NTBs is modelled as a decrease in the world price of UK exports in the CGE model.
An increase in import NTBs is modelled as an increase in the world price of UK imports in the CGE model
Existing EU FTAs with third-party countries
Assumptions on FTAs with the US and other third-party countries impact tariffs and NTBs. These are captured via changes to the world prices for UK exports / imports, as well as UK import tariffs, as explained above.
FTA with the US
Table C.6: Trade impacts applied in the CGE model
World prices on UK exports
World prices on UK imports
UK import tariffs
Scenario FTA scenario
WTO scenario
FTA scenario
WTO scenario
FTA scenario
WTO scenario
Agriculture -0.5% 3.8% 0.1% 0.1% 0.1% 3.0%
Mining -1.0% -0.5% 0.1% 0.1% 0.1% -0.3%
Food manufacturing
-0.5% 4.0% 0.8% 2.3% 0.2% 5.1%
Transport equipment
-0.4% 2.9% 0.0% 0.0% 0.7% 5.8%
Chemicals -0.2% 1.4% 0.1% 0.1% 0.0% 1.8%
Other manufacturing
-0.5% 1.4% 0.6% 1.7% 0.3% 1.5%
Services 1.0% 3.5% 2.3% 5.8% 0.0% 0.0%
Source: PwC analysis
Impact on investment The UK is the 5th largest economy in the world and continues to benefit from substantial FDI. Therefore, it is unlikely that all foreign investment would fall immediately if the UK were to leave the EU. Direct investment (as opposed to portfolio investment) also tends to be long-term rather than short-term, which makes it less vulnerable to sudden reversals in investor sentiment. The presence of sunk costs and self-perpetuating agglomeration effects could minimise the impact of divestments and makes it difficult to dislodge the UK’s position as an attractive investment position in the short-term following a UK exit, especially in high-productivity, knowledge-intensive sectors.
However, over the longer-term, as existing investments are wound down and as other EU countries further integrate and liberalise their internal markets, this could gradually erode the UK’s position as the investment destination of choice as investors gradually relocate investments to within the Single Market.72
72 Blomstrom and Kokko (1997) review early studies that found that the early years of the Common Market had attracted investment from
the US to the UK that might otherwise have gone to other European countries, which demonstrates the importance of the Single Market in
influencing FDI location decisions.

PwC 55
The impact on investment is captured endogenously within our CGE model via trade impacts, the response of the cost of capital to higher uncertainty, and the impact of reduced GDP on the overall level of business revenues. As the results reported earlier in this report, the combined impact of tariff and NTB changes indicate there could be a substantial negative impact on investment – particularly in the short-term when uncertainty about the future of the UK’s trading relationships and its economic future are at their peak. Our modelling results point to a 17-27% drop in the level of investment by 2020 relative to the counterfactual scenario in which the UK remains within the EU. A lower level of investment and capital stock in the UK economy would also have knock-on impacts on future productivity levels, which feed into lower growth and output in the future.
Therefore, we do not include a separate modelling input to capture the impacts of a reduction in FDI or the negative impact of these investment flows on productivity. However, given that the existing evidence suggests that FDI has a disproportionately large impact on UK productivity relative to domestic investment, the impacts on output produced by the model are likely to be conservative.
Uncertainties and caveats relating to our model assumptions There are a few important limitations to the analysis:
Our counterfactual does not explicitly account for the fact that the UK could also lose out from not being
able to participate in the reduction in NTBs that could come from trade agreements that the EU is currently negotiating – such as the Transatlantic Trade and Investment Partnership (TTIP). The Centre for Economic Policy Research (CEPR) estimates that TTIP could yield an increase in UK national income between £4–10 billion annually, or up to £100 billion over a ten-year period.73 The UK would also be potentially excluded from any agreement made between the EU, Japan and China. However, should this be factored into our analysis, it would further diminish the additional economic benefits that the UK could derive from an FTA with the US.
The assumption that the UK would be able to accelerate negotiations with the US (potentially on the back of existing TTIP negotiations) in time for an FTA to be implemented in 2021 is ambitious and reflects a best case scenario. In practice, renegotiations would take some time, and it is unclear whether the UK would be able to begin trade negotiations ahead of a formal exit from the EU taking place. Historical experience suggests that negotiating trade agreements is a long drawn-out process. For example, negotiations for the EU-Canada Comprehensive Economic and Trade Agreement (CETA) began in 2009, with the final text only recently concluded in December 2015. The agreement is also yet to be approved by the Council of the European Union and the European Parliament. Similarly, negotiations for the EU-South Korea free trade agreement began in 2007, and only entered into force in 2011.
The UK’s membership of the EU has facilitated capital flows within the EU and reduced firms’ cost of capital via the freedom of movement of capital and financial services, capital markets integration and direct investment funding from the EU. Although not explicitly modelled in this study, we anticipate that there could be negative impacts on firms’ ability to access capital as a result of a potential UK exit from the EU. This is due to the negative impacts on the financial services sector that could have a knock-on impact on lending to UK corporates and the number of banks operating in the UK, and a potential reduction in market liquidity due to the loss of critical mass in financial services activity in the UK.
In addition, the opportunity cost of not participating in major reforms such as the Capital Markets Union (CMU) that are taking place in Europe have not been taken into account. The CMU reforms, including those to securitisation markets, aim to remove national barriers to the seamless flow of capital throughout the EU. These could offer even more opportunities for access to finance and lower cost of borrowing for UK corporates as the CMU.
73 CEPR (2013).

PwC 56
In this Annex we first outline the economic context and key issues in relation to the free movement of labour in the EU. We then set out the potential impacts of the UK’s exit from the EU on migration patterns for low- and high-skilled workers, and describe how we have modelled changes in labour supply as a result of changes in net migration under different EU exit scenarios. We also discuss the justification for these assumptions as well as the uncertainties surrounding them, referencing estimates from other recent studies.
D.1 Economic context and key issues Free movement of labour is one of the four fundamental freedoms of the EU, allowing people to move between and reside freely in other Member States. The key elements of EU free movement law are set out in EU treaties and other provisions with direct effect in the UK.74 EU citizens are entitled to:75
Look for a job in another EU country;
Work there without needing a work permit;
Reside there for that purpose;
In certain circumstances, stay there after employment has finished; and
Enjoy equal treatment with nationals in access to employment, working conditions and all other social and tax advantages.
EU migrants can reside in the UK for up to three months without conditions. Longer residence is permitted for as long as the person is working, self-employed, self-sufficient, studying, or subject to restrictions, a jobseeker. After five years’ continuous residence in another member state, EU migrants are entitled to permanent residence.
Economic migration to the UK under EU free movement law is virtually unrestricted. There are no numerical limits or prescribed minimum salaries and EU migrants can work for any employer, whether the employer holds a sponsor licence or not. The absence of the need for a sponsor licence and of minimum salary levels reduces the costs for businesses to employ EU migrants, in comparison to non-EU migrants. Employers are entitled to engage EU migrants at any skill level, in the same way as they would employ UK workers.
The principle of free movement is applied on a reciprocal basis to those members of the EEA that are not members of the EU.76 In this Annex most of our references to the EU and EU migration apply equally to the EEA.
In contrast, the UK exercises independent control over all other migration into the UK. The immigration requirements for non-EU migrants coming to the UK for any purpose (other than family members of EU nationals) are set out in the UK’s Immigration Rules. Economic migration under the Immigration Rules is strictly controlled. The main work category is for skilled migrants under Tier 2 (General) of the Points Based System. Applicants are subject to numerical quotas and minimum salary levels, depending on their jobs. If they are granted permission to work in the UK in this category, their permission is limited to a particular job with a particular employer. Their UK employers have to obtain a sponsor licence from the Home Office, which comes with numerous and strict sponsor obligations. In most cases sponsors need to show that a non-EU migrant is
74 The free movement of workers is enshrined in Article 45 of the Treaty on the Functioning of the European Union. A separate EU Directive
set out the conditions under which EU citizens and their families can exercise the right to reside in other member states. 75 Source: European Commission “Free Movement - EU nationals”. 76 The three countries are Iceland, Liechtenstein and Norway. Switzerland is not a member of the EEA but also has reciprocal free
movement arrangements with the EU.
Annex D: Migration

PwC 57
filling a job that cannot be filled from the resident labour market, or is on the Government’s shortage occupation list.77
There is no existing work route under the Immigration Rules for low-skilled migrants, unless they fit into one of the other categories under the Immigration Rules such as the partner of someone entitled to be in the UK. Tier 3 of the Points Based System was envisaged as a category for low-skilled migrants coming to the UK to fill specific labour shortages, but has never been implemented. This is because the UK’s unmet low-skilled labour needs have been met to some extent by EU migrants.
The free movement of EU labour has allowed higher levels of net migration to the UK from the European Union in the past decade. Successive rounds of enlargement in 2004, 2007 and 2013 changed the shape of the EU fundamentally, bringing the number of Member States from 15 to 28 and the total population of the EU to more than 500 million in 2015.78
The UK has experienced a significant increase in population in the last 40 years, of about 15%.79 A natural increase in the population has accounted for 40% of population growth over this period.80 Another 40% of this increase can be attributed to non-EU migration, with the remaining 20% being accounted for by EU migration.81 Therefore, migration under EU free movement laws has accounted for an increase in the UK’s population of about 3% since 1973.
Figure D.1: UK net migration flows, 2004 to 2015
Source: ONS population estimates and historic Migration Projections, PwC analysis
Figure D.1 shows net migration flows in the UK between 2004 and 2015. Although inflows from the EU8 countries more than doubled between 2004 and 2007, this slowed significantly during the financial crisis in 2008 when economic conditions in the UK worsened.82,83 In 2014, inflows from non-EU countries accounted for 55% of total inflows, followed by inflows from EU Member States (apart from the EU8) at 32%, and 12%
77 Separate arrangements are made for intra-company transfers (a separate element of Tier 2), youth workers and other temporary workers
(Tier 5), those coming to make a substantial investment in the UK economy (Tier 1 investors) and those coming to set up new businesses
(Tier 1 entrepreneurs). 78 Eurostat – population and population change statistics. 79 ONS (2015) “United Kingdom population mid-year estimate”, June 2015. 80 The rate of natural increase is the difference between birth rate and death rate in a given country. 81 Bank of England (2015a). 82 EU8 refers to a group of Eastern European countries which joined the EU in 2004 (Czech Republic, Estonia, Hungary, Latvia, Lithuania,
Poland, Slovakia and Slovenia) and whose migration was restricted until 2011. 83 ONS, 2014 Historic Migration Projections.
-400
-200
0
200
400
600
2004 2005 2006 2007 2008 2009 2010 2011 2012 2013 2014
Mig
ratio
n (
tho
usa
nd
s)
Total UK outflows EU8 inflows Other EU inflows Non-EEA inflows UK net migration

PwC 58
from the EU8 countries. Total UK annual net migration continues to set historic highs, and reached around 323,000 in the year ending September 2015, the second highest in the EU after Germany.84
Despite these high levels of net migration, rates of movement between EU Member States are low relative to migration within federal countries. In the US, 2.5% of the US population relocate to a different state every year. In the EU this figure is just 0.3%.85
A significant number of UK emigrants also currently reside in other EU Member States, though there is no single consistent figure for this. Oxford University’s Migration Observatory estimates the number at 1.4 million. In 2014, total UK outflows were nearly 300,000. 40% of this related to the emigration of UK citizens, while 60% were non-UK citizens returning or relocating elsewhere.86
The impact of migration on UK labour markets In economic terms, EU migrants contribute to the UK economy by boosting the supply of the workforce. Consequently, they play an important role in the economy, accounting for around 6% of the total working population.87 EU migrants also tend to be younger than the native population: the average age of an EU migrant is 32.3 years (based on 2011 statistics), compared to an average age of 40.8 years amongst UK nationals.88 Three-quarters of EU migrants in the UK were of working age in 2014.
As shown in Figure D.2, the current employment rate for working-age EU migrants is higher than for UK nationals.89 EU migrants also tend to have lower levels of economic inactivity (which includes students and pensioners, as well as jobseekers), in comparison to UK nationals.90
Figure D.2: Share of employed and non-active individuals in the UK
Source: European Commission, PwC analysis
Over the last 20 years there have been changes to the composition of both native and migrant employment across sectors. This is partly due to increasing job polarisation in UK occupations: the decline of middle-ranking jobs and an increasing number of jobs concentrated in the highest- and lowest-paid occupations (McIntosh 2013).91 EU migrants tend to be more “high-skilled” or “low-skilled” than UK-born workers (who tend to fall into the “medium-skilled” category).92 The bifurcation in the skills distribution of EU migrants in comparison to
84 House of Commons Briefing Paper (2016b). 85 Bank of England (2015a). 86 ONS, 2014 Historic Migration Projections. 87 ONS, 2014 Annual Population Survey. 88 Invesco (2015). 89 Juravle et al. (2013). 90 The European Commission includes jobseekers in its definition of non-active individuals. 91 McIntosh (2013). 92 Credit Suisse (2016).
68%
43%
77%
30%
0%
20%
40%
60%
80%
100%
% Employed individuals aged 16-64 % Non-active individuals aged 15 and above
UK EU migrants

PwC 59
UK nationals suggests that their skills profile is more aligned to the job polarisation observed in UK employment.93
Data from the ONS suggests that 46% of EU migrants are high-skilled, while 54% are low-skilled.94 Figure D.3 shows a comparison of skills levels between EU, non-EU and UK-born workers. This suggests that EU migrants are only marginally less skilled than UK-born workers. However, among the high-skilled, EU-born migrants tend to be better educated than UK nationals, with 32% having a degree compared to 21% of nationals and far fewer being in the low education category.95
Figure D.3: Share of individuals in the UK aged 16-64 in high and low-skilled employment, 2013
Source: Migration Advisory Committee – ONS, PwC analysis
However, if we consider the number of low-skilled workers as a whole, of the 13 million low-skilled workers aged 16-64 in the UK, 84% are UK born, 9.6% are non-EU migrants and just 6.4% EU migrants.96 This suggests that EU migrants make up a small proportion of low-skilled workers.
In addition, there is some evidence to suggest that migrant inflows generally, both EU and non-EU are becoming increasingly high-skilled. Figure D.4 shows the percentage of recent migrant workers that are high-skilled. It shows that recent migrant workers in the UK are more likely to be high-skilled compared to 2007: 60% of all 2013 recent migrant workers were high-skilled compared to 50% in 2007. This has been driven by an increase in skilled migrant inflows from EU Member States, where the share of high-skilled recent migrant workers have increased from 45% to 56%.97
Figure D.4: Percentage of recent migrant workers that are high-skilled
Source: Migration Observatory (2014), PwC analysis
93 Bloomberg Brief (2016). 94 These figures reflect the ONS Standard Occupational Classification (SOC), whereby occupations are divided into 4 groups, whereby
skills levels 1 and 2 are considered low-skilled, while 3 and 4 are high-skilled. The SOC does not account for middle-skilled jobs. 95 Invesco (2015). 96 Migration Advisory Committee (2014). 97 Migration Observatory defines recent migrant workers as individuals born outside the UK who are not UK nationals, have been in the UK
for less than three years and are in employment.
54%45% 45%
46%55% 55%
0%
20%
40%
60%
80%
100%
EU migrants UK-born workers Non-EU migrants
Low-skilled High-skilled
58%
45%50%
68%
56%60%
0%
20%
40%
60%
80%
non-EEA EEA Total
2007 2013

PwC 60
D.2 Potential key impacts of EU exit on migration If the UK voted to leave the EU, flows of migration between the UK and the rest of Europe could be significantly affected.
Several studies have sought to understand the impact of migration on economies, and in particular on labour markets. Where migration increases the size of the workforce in an economy, there is the potential for higher levels of economic output. In the context of the UK economy, the free movement of labour within the EU enables businesses to draw upon a larger pool of workers than that available in the domestic economy. If the UK does not retain the principle of free movement of labour, the immediate impact would be to reduce the size of the workforce.
There is no consistent ex-post estimate of the impact of migration on the UK’s GDP to date. However, a study by Di Giovanni et al. (2014) estimated that the recent reduction of international migration resulted in an average welfare loss for the UK of -1.5% in the long-run. The same study on the relationship between migration and productivity in the UK estimated that a 1% increase in immigrant share in employment is associated with an increase in labour productivity of 0.06 to 0.07%.
Free movement has also facilitated flexibility in the labour force in the UK. Although relative incomes remain a key driver of migration flows (wage differentials between the UK and other parts of the EU have been significant and sustained for some time), there is also a cyclical element to migration that allows the UK labour market to adjust to changes in economic conditions. This is because wage differentials mean that migrants are typically more mobile than natives, and able to plug gaps in the labour market during upswings in business cycles or exit the labour market during downswings. This is demonstrated by the historic employment rate of migrants, which has been more volatile than that of UK-born workers. If businesses no longer have access to the flexibility that EU migrant labour provides, a restricted labour supply could put upward pressure on both wages and prices.
Much of the literature focuses on the impact of migration on native citizens’ employment and wages. In general, mainstream economic theory does not predict any long-term negative impacts.98 However, there may be short-term impacts, depending on the economic context and mix of skills in the workforce. In sectors where migrants compete with native workers (i.e. they are direct substitutes), there is the potential for downward pressure on wages. Literature for the US finds that migrant and native workers are not perfect substitutes in economic terms, which suggests that - to some extent - native workers are insulated from increases in migrant labour supply. However, for low-skilled work, migrants are likely to be closer substitutes, which may have implications for wages in the short-term.99 Research also suggests that the negative impacts of immigration on wages are likely most significant for resident workers who are migrants themselves, given the fact they are likely to be closer substitutes for skills.100
In the context of the UK, EU migrants have had consistently higher employment rates than both UK-born workers and non-EU migrants. However, there is little evidence to date indicating a statistically significant displacement of UK-born workers,101 though the strength of the evidence varies by stage of the business cycle and the overall magnitude of migration. In addition, the immigrant share of new jobs has been broadly the same as the share of immigrants in the working population since 1985.102
There is also some evidence of small, negative impacts of immigration on wages in semi- and low-skilled occupations in the UK as a result of EU and non-EU migration.103 Research has found that a 1% increase in the share of migrants in the UK-born working age population leads to a 0.6% decline in the wages of the 5% lowest paid workers.104 However, this study also found that a 1% increase in the inflow of immigrants also leads to a 0.7% increase in the median wage and a 0.5% increase in the top 10% of highest paid workers. Therefore, on
98 BIS and Home Office (2014). 99 Ottaviano and Peri (2005). 100 Manacorda and Manning (2011). 101 BIS and Home Office (2014). 102 CEP and LSE (2014). They note that it is slightly higher because the immigration population is younger and job turnover is higher among
the younger population. 103 Bank of England (2015). 104 Dustmann, Frattini and Preston (2013).

PwC 61
balance, evidence suggests that there has been a slight positive overall effect on natives’ employment and average wages, but the distributional story is more complex, with positive impacts at the higher end of the skills distribution counteracting negative impacts at the lower end.
Another key feature of migration in the UK is migrants are more likely to be self-employed than UK-born workers. There is a strong concentration of self-employed EU migrants in particular sectors, such as the distribution, hotels and restaurants sector. Some immigrant communities are likely to have a comparative advantage in such forms of self-employment, such as in the restaurants sector. The expertise of migrants in this sector often contribute to improved standards in particular cuisines and skills are likely to be passed on to UK born workers.105 Although there is less literature in this area, it could well be that EU migrants with specialist knowledge contribute to improved standards in other sectors in the UK economy.
Sectors reliant on migrant workers may also face a shortage of skills. Global Counsel (2015) estimates that 1.5 million new jobs would be created in high-skilled jobs by 2022 in the UK. However, in our counterfactual, the UK working age population would increase by just under 2 million inclusive of net migration between 2016 and 2022, which suggests a potential shortfall in the ability to fill these jobs, even without any changes to current migration patterns. The impact of restricting immigration as a result of a potential EU exit could therefore exacerbate this shortfall. The impacts of lower migration would also be felt disproportionately in London, where EU-born employees represent just over one in ten workers. This ratio is higher for the construction, accommodation and food services, and financial and insurance sectors.106 The UK could seek to counter these effects by increasing labour supply through channels such as education and skills, or providing greater incentives for the older population to return to work or work for longer. However, these policy levers are likely to have a significant lag before the impacts materialise.
D.3 Modelling the impact of the UK exiting the EU on migration: key assumptions There is no precedent for a Member State leaving the EU, and the exact legal and practical implications would depend on the outcome of negotiations, and the new form of the UK’s relationship with the EU. Such negotiations would probably result in reciprocal immigration arrangements between the UK and the rest of the EU.
Following the UK’s exit from the EU, EU migrants seeking to come and work in the UK may have to meet the requirements for one of the work categories in the UK’s Immigration Rules. The current arrangements for economic migration under the Rules are summarised in Section D.1, but these may be modified if the UK leaves the EU. The requirements imposed on skilled migrants under the Rules may be relaxed, whether for EU nationals or generally, and there may be transitional arrangements to deal with EU nationals who are in the UK when the UK’s formal exit from the EU takes effect.
Equally, UK nationals seeking to reside and work in the EU would be subject to whatever restrictions the EU or its member states choose to impose on them. Again, these are likely to be reciprocal restrictions.
In our modelling, we assume that under both scenarios (WTO and FTA), some form of transitional provisions would be put in place for existing EU migrants so that they continue to work in the UK after a potential UK exit from the EU, whether or not they have permanent residence status.107 This means that in practice, EU migrants
105 Dustmann and Fabbri (2005). 106 Mayor of London (2014). 107 Existing EU migrants, i.e. those who are in the UK at the date of a formal exit, would probably be permitted to remain here if they have
obtained permanent residence status under EU law. They would form a small minority of the EU migrant population and they might be
given permanent residence status under the Immigration Rules (“indefinite leave to remain”) as a concession. Those who have become
eligible to naturalise as UK citizens may take that option. In practice, unless special provision was made under the Immigration Rules, EU
migrants with no permanent resident status would cease to have any right to stay in the UK under EU law, because EU law would cease to
have effect in the UK. Some would not qualify to switch into a category under the Immigration Rules, because, for instance: (1) they would
not be working for a sponsor, (2) they would not be earning enough and/or they would not be sufficiently skilled. The Government might
make transitional concessions for these existing EU migrants so that they can continue to work on the same basis should the UK leave the
EU, if only to ensure that similar concessions are made for UK migrants working in the EU.

PwC 62
who are already in the UK would be allowed to remain in the UK, while restrictions would be put in place for future migrant inflows from the EU. Our scenario assumptions are summarised in Table D.1.
Table D.1: Scenarios under the migration impact
FTA scenario WTO scenario
Migration Existing
EU
migrants
in the UK
Existing EU migrants with the right to permanent residence remain.
Transitional provisions are put in place for existing migrants without permanent residence.
Existing EU migrants with the right to permanent residence remain.
Transitional provisions are put in place for existing migrants without permanent residence.
Future
migration
flows
New migrants must qualify under the Immigration Rules (applicable to all foreign nationals).
There is no longer entry of low-skilled workers from the EU.
The Government relaxes Tier 2 requirements while Tier 3 remains closed. We assume that half of the decline in low-skilled EU inflows is replaced by an increase in high-skilled inflows from the EU and non-EU.
New migrants must qualify under the Immigration Rules (applicable to all foreign nationals).
There is no longer entry of low-skilled workers from the EU.
The tier system remains as in the status quo: Tier 2 remains open subject to requirements. Tier 3 remains closed.
There is no change to the inflow of skilled workers from the EU and non-EU.
In practice, the reduction in net migration is likely to result in a decline in UK labour supply, relative to the counterfactual. To model the changes in migration on labour supply, we undertook the following steps:
First, using ONS projections of the population and the labour force, as well as net international migration108, we apply recent trends in EU net migration flows (based on 2013 data109) to project the proportion of future UK labour force that is accounted for by future EU migration flows. We also estimate the proportion of high- and low-skilled workers from both EU and non-EU countries as a proportion of total inflows, based on data from Migration Observatory on the skills levels of recent migrants who are in employment.110 These are summarised in Table D.2. This forms the migration assumptions in our counterfactual scenario.
Second, in the WTO scenario, we assume that net migration inflows of low-skilled workers would cease. This results in a direct impact on the stock of projected low-skilled workers in the UK, and this impact is accumulated over time. We also assume no change to the future inflow of skilled workers from EU and non-EU countries. Table D.3 sets out the impact of our model assumptions on future projections of labour supply by skill level under this scenario. In practice, this means that UK labour supply is 1.4% lower relative to the 2030 counterfactual.
Finally, in the FTA scenario that has been modelled, we assume that net migration inflows of low-skilled workers from the EU would cease, as in the WTO scenario. However, half of this decline is offset by an increase in high-skilled migration from EU and non-EU countries. Table D.3 sets out the impact of our model assumptions on future projections of labour supply by skill level under this scenario. In practice, this means that UK labour supply is 0.7% lower relative to the 2030 counterfactual.
108 We have also assumed in the counterfactual that net inward migration to the UK is 265,000 annually. This figure is based on an
extrapolation of ONS population projections up until 2019. We assume that net inward migration would remain stable. 109 Note that the shares of inflows of EU high-skilled, EU low-skilled and non-EU high-skilled migrants have been rescaled to exclude future
flows of non-EU low-skilled migrants. This is because the Tier 3 route of entry for low-skilled migrants has never been implemented and
may remain closed in the future. 110 Migration Observatory (2014).

PwC 63
Table D.2: Projected patterns of net migration inflows from EU and non-EU countries in counterfactual
% of total recent migrant inflows (2010-2013)
High-skilled EU 41%
Low-skilled EU 33%
High-skilled non-EU 26%
Source: PwC analysis based on Migration Observatory analysis of recent migrant inflows
Table D.3: Impact of changes in net migration inflows on UK working age population
FTA scenario WTO scenario
High-skilled +1.4% 0% (no change)
Low-skilled -2.7% -2.7%
Total -0.7% -1.4%
Source: PwC analysis
Assuming the UK votes to leave the EU, changes to UK labour supply are expected to occur after the UK’s formal exit from the EU in 2020. The evolution of our labour force projections over time under both scenarios and the counterfactual are shown in Figure D.5. The increase in the growth of the labour force in 2026 can be explained by an increase in the state pension age to 67 for both sexes, which is likely to have a large short-term impact on labour force supply before levelling off in 2028. 111
Figure D.5: Working age population projections under the WTO and FTA scenarios and counterfactual
Source: PwC analysis based on ONS population projections and 2011 Census data
111 Based on ONS National Population Projections 2014. This is the state pension age under the 2014 Pensions Act.
40.0
40.5
41.0
41.5
42.0
42.5
43.0
43.5
44.0
44.5
45.0
2015 2016 2017 2018 2019 2020 2021 2022 2023 2024 2025 2026 2027 2028 2029 2030
Mlii
ons
FTA Scenario WTO Scenario Counterfactual
PwC 64
Uncertainties and caveats relating to our model assumptions There are a few important limitations to the analysis:
In this analysis, our approach focuses on migrants in the context of labour markets, i.e. we do not model
any effects relating to migration for reasons of family, education and asylum.112 The analysis required to understand the impact for these groups is wider-ranging than purely economic considerations, and beyond the scope of this report.
If the UK voted to leave the EU there would be a long period of uncertainty as the UK negotiates the terms of its exit with the EU. During this period, there may be an increase in migration from the EU ahead of the UK’s formal exit while it remains possible for EU nationals to exercise their right to free movement. We have not modelled this explicitly. However, if inflows were to increase in the short-term, this could mitigate some of the future negative impacts of restrictions to migration flows.
Our assumption that high-skilled migration flows can be maintained to meet the UK's business needs reflects a best case scenario, as the UK may face challenges in increasing the flow of high-skilled labour required to meet those needs.113 If these challenges were to materialise, the labour supply shortfalls predicted in our modelling would be greater in both scenarios.
In practice, the UK could adopt a less restrictive migration policy in relation to low-skilled migration. For example, opening the Tier 3 visa route for low-skilled labour could be one way of alleviating labour shortages targeted towards certain sectors, or on a short-term (or even seasonal) basis, and be subject to numerical limits. However, even if Tier 3 were implemented, this may have a limited impact on low-skilled migration from the EU after a potential UK exit from the EU, because it would be a much less attractive option for both workers and their UK employers, as compared to the current position.114
112 The UN defines a migrant as someone whose country of birth or nationality is different to their country of residence, or someone that
changes their country of usual residence for a period of at least a year. 113 If the UK left the EU, many EU skilled migrants who would otherwise come to work in the UK may no longer qualify to do so under the
Immigration Rules. In addition, the relatively costly process of obtaining Tier 2 status, including the fact that migrants are restricted to a
particular job with a particular employer, may also encourage some high-skilled migrants to move elsewhere in the EU or remain in their
home countries. Even if the requirements under Tier 2 (General) are relaxed, it may have a limited impact on addressing those inhibiting
factors. 114 Unlike the position under free movement law, low-skilled EU workers coming to the UK under Tier 3 would be subject to numerical limits,
permitted to stay for only short periods, tied to a particular job and employer as determined by the Government, and would be unlikely to
qualify for permanent residence. Employers would also face significant restrictions on recruiting Tier 3 migrants, none of which currently
exist.
PwC 65
In this Annex we first outline the economic context and key issues in relation to the influence of EU membership on the UK’s regulatory environment. We then set out the potential impacts of the UK’s exit from the EU on regulations, and in particular, regulatory costs. We then describe how we have modelled changes in labour supply as a result of changes in net migration under different EU exit scenarios. We also discuss the justification for these assumptions as well as the uncertainties surrounding them, referencing estimates from other recent studies.
E.1 Economic context and key issues Regulation is usually intended to address market failures, such as monopoly power, externalities or to provide public goods. It does, however, impose burdens on businesses and households, for example by introducing compliance costs (including administrative burdens). These burdens can detract from the competitiveness of business.
EU membership has had a wide-ranging impact on the structure and scope of regulation in the UK, via legislative instruments such as Regulations or Directives.115 Areas of regulatory policy shaped by the EU include employment and social policy, consumer protection, financial services, competition, product standards, agriculture and fisheries, and environment and climate change.
The extent of the EU’s influence on UK regulation is difficult to measure and depends on how it is measured. Some studies suggest that the effect of the EU on the UK’s regulatory environment is non-trivial.116,117
E.2 Potential key impacts of EU exit on regulations In principle, if the UK left the EU, it could revise or remove some or all regulations which are linked to either EU Regulations or Directives. Our analysis, therefore, seeks to assess the potential economic impacts of any reduction in the regulatory burden that would face UK-based firms.
Our modelling assumptions are informed by a review of several third party reports which analyse the impact of EU regulation to estimate the potential regulatory cost savings.
In particular, an Open Europe study (2015) reviewed over 2,300 regulatory impact assessments undertaken in the UK between 1998 and 2009.118,119 The study then identified the 100 EU-derived regulations with the largest gross cost. Open Europe estimated that the total annual gross cost to the UK economy of these 100 regulations was £33.3 billion in 2014 prices.120 It then identified those regulations which would potentially be amended or repealed if the UK voted to leave the EU. The results of this analysis are summarised in Table E.1.
115 Directives are binding legislative acts agreed by EU Member States which define common goals. They need to be transposed into UK
domestic law in order to take effect. Member States, therefore, have some discretion in how they translate the substance of Directives into
national law. Regulations are binding EU legislative acts that apply in their entirety across the EU. These do not require further enabling
legislation before they take effect. 116 A 2015 study by the House of Commons found that 13.2% of UK Acts of Parliament and Statutory Instruments from 2003-14 implement
EU Directives, refer to an EU obligation, cross-refer to the European Communities Act 1972. 117 A study by Business for Britain found that between 1993 and 2014, 64.7% of UK law could be deemed to be influenced by the EU when
taking EU Regulations into account. 118 Open Europe (2015). 119 Open Europe estimate that the UK Government has produced around 2,500 Impact assessments since 1998. Source: Open Europe
(2010). 120 Open Europe acknowledge that this assessment is limited by the quality and availability of the government’s impact assessments. In
particular, they acknowledge that their assessment may not have covered all impact assessments produced in the time period, since there
is no central repository of impact assessments available to ensure completeness.
Annex E: Regulation
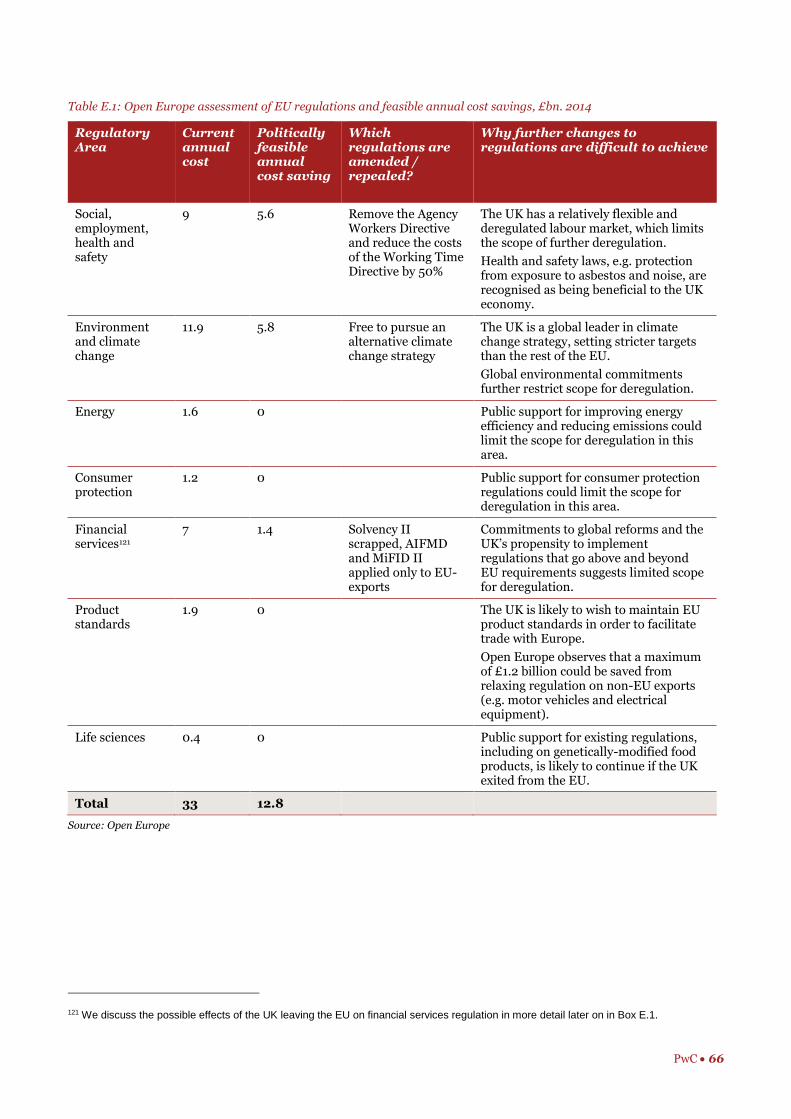
PwC 66
Table E.1: Open Europe assessment of EU regulations and feasible annual cost savings, £bn. 2014
Regulatory Area
Current annual cost
Politically feasible annual cost saving
Which regulations are amended / repealed?
Why further changes to regulations are difficult to achieve
Social, employment, health and safety
9 5.6 Remove the Agency Workers Directive and reduce the costs of the Working Time Directive by 50%
The UK has a relatively flexible and deregulated labour market, which limits the scope of further deregulation.
Health and safety laws, e.g. protection from exposure to asbestos and noise, are recognised as being beneficial to the UK economy.
Environment and climate change
11.9 5.8 Free to pursue an alternative climate change strategy
The UK is a global leader in climate change strategy, setting stricter targets than the rest of the EU.
Global environmental commitments further restrict scope for deregulation.
Energy 1.6 0 Public support for improving energy efficiency and reducing emissions could limit the scope for deregulation in this area.
Consumer protection
1.2 0 Public support for consumer protection regulations could limit the scope for deregulation in this area.
Financial services121
7 1.4 Solvency II scrapped, AIFMD and MiFID II applied only to EU-exports
Commitments to global reforms and the UK’s propensity to implement regulations that go above and beyond EU requirements suggests limited scope for deregulation.
Product standards
1.9 0 The UK is likely to wish to maintain EU product standards in order to facilitate trade with Europe.
Open Europe observes that a maximum of £1.2 billion could be saved from relaxing regulation on non-EU exports (e.g. motor vehicles and electrical equipment).
Life sciences 0.4 0 Public support for existing regulations, including on genetically-modified food products, is likely to continue if the UK exited from the EU.
Total 33 12.8
Source: Open Europe
121 We discuss the possible effects of the UK leaving the EU on financial services regulation in more detail later on in Box E.1.
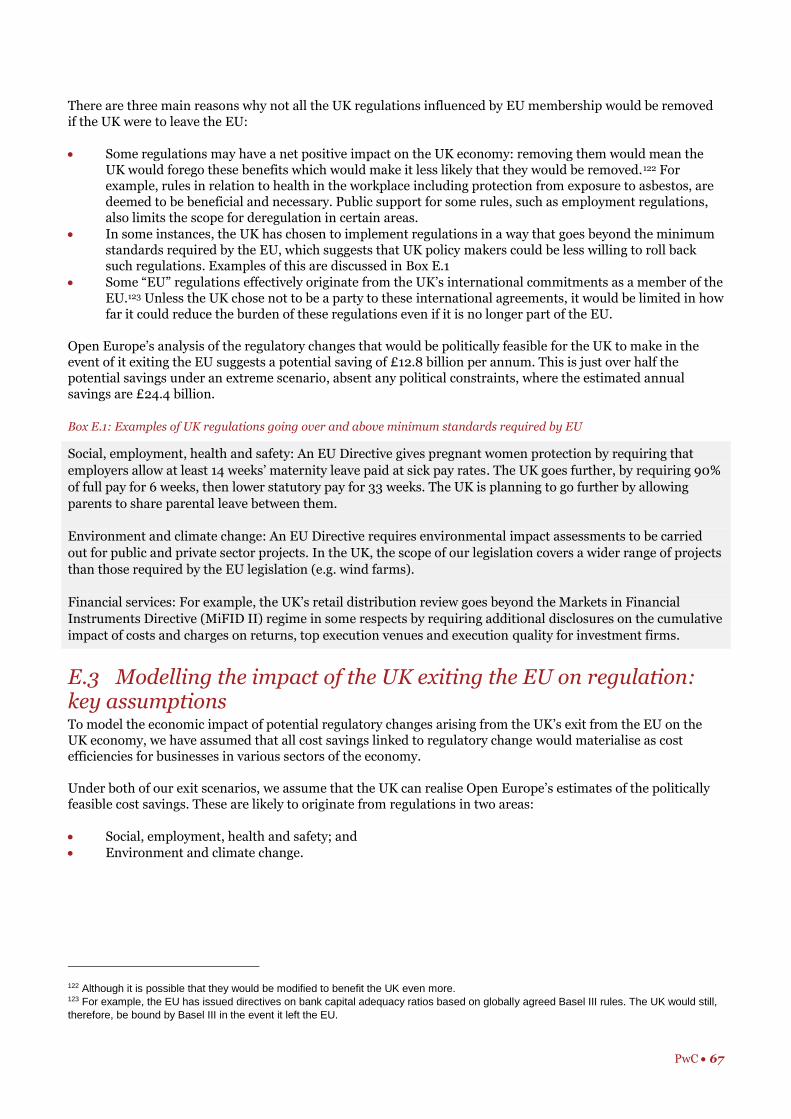
PwC 67
There are three main reasons why not all the UK regulations influenced by EU membership would be removed if the UK were to leave the EU:
Some regulations may have a net positive impact on the UK economy: removing them would mean the UK would forego these benefits which would make it less likely that they would be removed.122 For example, rules in relation to health in the workplace including protection from exposure to asbestos, are deemed to be beneficial and necessary. Public support for some rules, such as employment regulations, also limits the scope for deregulation in certain areas.
In some instances, the UK has chosen to implement regulations in a way that goes beyond the minimum standards required by the EU, which suggests that UK policy makers could be less willing to roll back such regulations. Examples of this are discussed in Box E.1
Some “EU” regulations effectively originate from the UK’s international commitments as a member of the EU.123 Unless the UK chose not to be a party to these international agreements, it would be limited in how far it could reduce the burden of these regulations even if it is no longer part of the EU.
Open Europe’s analysis of the regulatory changes that would be politically feasible for the UK to make in the event of it exiting the EU suggests a potential saving of £12.8 billion per annum. This is just over half the potential savings under an extreme scenario, absent any political constraints, where the estimated annual savings are £24.4 billion.
Box E.1: Examples of UK regulations going over and above minimum standards required by EU
Social, employment, health and safety: An EU Directive gives pregnant women protection by requiring that
employers allow at least 14 weeks’ maternity leave paid at sick pay rates. The UK goes further, by requiring 90%
of full pay for 6 weeks, then lower statutory pay for 33 weeks. The UK is planning to go further by allowing
parents to share parental leave between them.
Environment and climate change: An EU Directive requires environmental impact assessments to be carried
out for public and private sector projects. In the UK, the scope of our legislation covers a wider range of projects
than those required by the EU legislation (e.g. wind farms).
Financial services: For example, the UK’s retail distribution review goes beyond the Markets in Financial
Instruments Directive (MiFID II) regime in some respects by requiring additional disclosures on the cumulative
impact of costs and charges on returns, top execution venues and execution quality for investment firms.
E.3 Modelling the impact of the UK exiting the EU on regulation: key assumptions To model the economic impact of potential regulatory changes arising from the UK’s exit from the EU on the UK economy, we have assumed that all cost savings linked to regulatory change would materialise as cost efficiencies for businesses in various sectors of the economy.
Under both of our exit scenarios, we assume that the UK can realise Open Europe’s estimates of the politically feasible cost savings. These are likely to originate from regulations in two areas:
Social, employment, health and safety; and
Environment and climate change.
122 Although it is possible that they would be modified to benefit the UK even more. 123 For example, the EU has issued directives on bank capital adequacy ratios based on globally agreed Basel III rules. The UK would still,
therefore, be bound by Basel III in the event it left the EU.
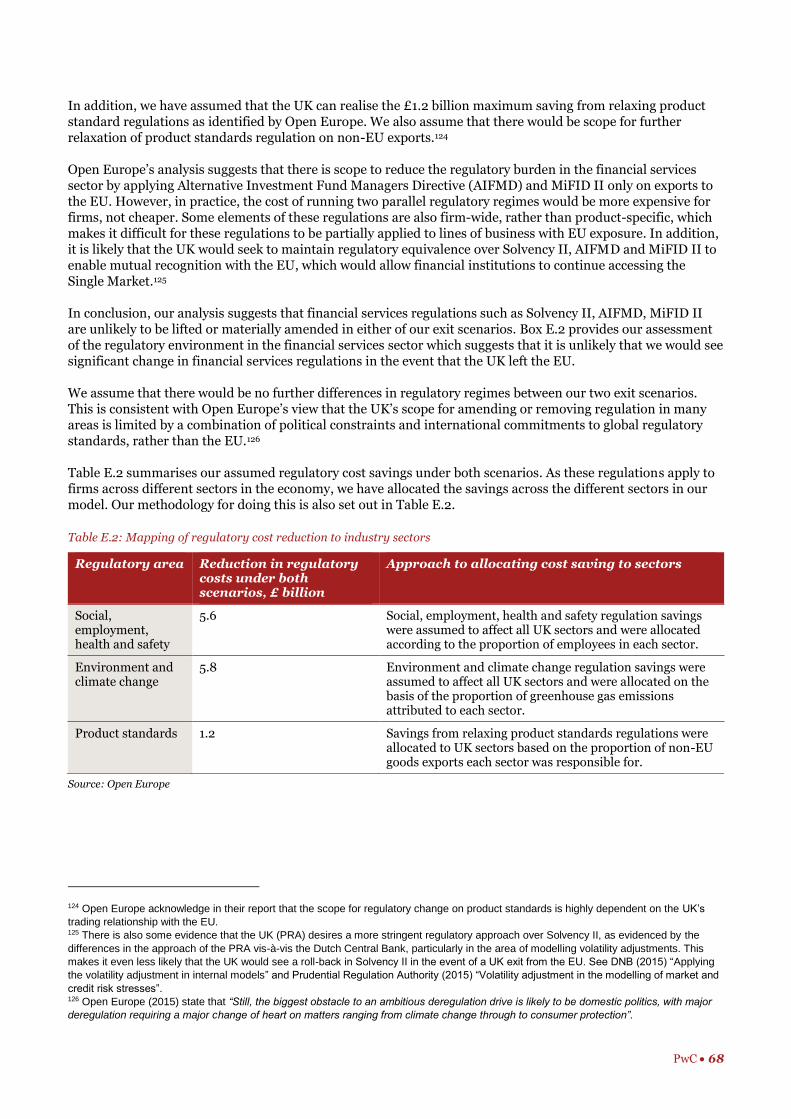
PwC 68
In addition, we have assumed that the UK can realise the £1.2 billion maximum saving from relaxing product standard regulations as identified by Open Europe. We also assume that there would be scope for further relaxation of product standards regulation on non-EU exports.124
Open Europe’s analysis suggests that there is scope to reduce the regulatory burden in the financial services sector by applying Alternative Investment Fund Managers Directive (AIFMD) and MiFID II only on exports to the EU. However, in practice, the cost of running two parallel regulatory regimes would be more expensive for firms, not cheaper. Some elements of these regulations are also firm-wide, rather than product-specific, which makes it difficult for these regulations to be partially applied to lines of business with EU exposure. In addition, it is likely that the UK would seek to maintain regulatory equivalence over Solvency II, AIFMD and MiFID II to enable mutual recognition with the EU, which would allow financial institutions to continue accessing the Single Market.125
In conclusion, our analysis suggests that financial services regulations such as Solvency II, AIFMD, MiFID II are unlikely to be lifted or materially amended in either of our exit scenarios. Box E.2 provides our assessment of the regulatory environment in the financial services sector which suggests that it is unlikely that we would see significant change in financial services regulations in the event that the UK left the EU.
We assume that there would be no further differences in regulatory regimes between our two exit scenarios. This is consistent with Open Europe’s view that the UK’s scope for amending or removing regulation in many areas is limited by a combination of political constraints and international commitments to global regulatory standards, rather than the EU.126
Table E.2 summarises our assumed regulatory cost savings under both scenarios. As these regulations apply to firms across different sectors in the economy, we have allocated the savings across the different sectors in our model. Our methodology for doing this is also set out in Table E.2.
Table E.2: Mapping of regulatory cost reduction to industry sectors
Regulatory area Reduction in regulatory costs under both scenarios, £ billion
Approach to allocating cost saving to sectors
Social, employment, health and safety
5.6 Social, employment, health and safety regulation savings were assumed to affect all UK sectors and were allocated according to the proportion of employees in each sector.
Environment and climate change
5.8 Environment and climate change regulation savings were assumed to affect all UK sectors and were allocated on the basis of the proportion of greenhouse gas emissions attributed to each sector.
Product standards 1.2 Savings from relaxing product standards regulations were allocated to UK sectors based on the proportion of non-EU goods exports each sector was responsible for.
Source: Open Europe
124 Open Europe acknowledge in their report that the scope for regulatory change on product standards is highly dependent on the UK’s
trading relationship with the EU. 125 There is also some evidence that the UK (PRA) desires a more stringent regulatory approach over Solvency II, as evidenced by the
differences in the approach of the PRA vis-à-vis the Dutch Central Bank, particularly in the area of modelling volatility adjustments. This
makes it even less likely that the UK would see a roll-back in Solvency II in the event of a UK exit from the EU. See DNB (2015) “Applying
the volatility adjustment in internal models” and Prudential Regulation Authority (2015) “Volatility adjustment in the modelling of market and
credit risk stresses”. 126 Open Europe (2015) state that “Still, the biggest obstacle to an ambitious deregulation drive is likely to be domestic politics, with major
deregulation requiring a major change of heart on matters ranging from climate change through to consumer protection”.
PwC 69
Box E.2: Effect of UK exiting the EU on financial services regulation in the UK
The financial services sector in the UK and EU is highly regulated. There is a possibility that the UK would have
greater latitude in designing and implementing regulations that are more suited to the needs of the UK
following the UK’s exit from the EU. However, our analysis of financial services regulation suggests that, on
balance, it is unlikely that we would observe a significant change in many regulatory areas for the following
reasons:
1. The UK is still bound by international regulatory commitments: The UK’s membership of the
G20 and IOSCO would require the UK to continue to implement G20 reforms, which are also the most
material ones in terms of cost to financial institutions. Examples include Basel III capital and liquidity
requirements for banks, and reforms to derivatives markets. These reforms are being implemented in the
EU via European Directives and Regulations such as the Capital Requirements Directive and Regulation
(CRD IV) and European Market Infrastructure Regulation (EMIR). The new requirements under the
Markets in Financial Instruments Directive and Regulation (MiFID II/MiFIR) have also been introduced,
partly as a response to G20 commitments that aimed to strengthen supervisory powers and to ensure
that OTC derivatives are traded on exchanges or electronic trading platforms (Europe Economics 2015).
2. UK regulation needs to comply with EU rules to facilitate financial services trade: The UK’s
regulatory regime would still need to demonstrate compliance with EU rules in order for UK financial
institutions to retain access to EU markets. For example, the Alternative Investment Fund Managers
Directive (AIFMD) requires non-EU alternative funds to comply with EU requirements including capital
requirements and pay guidelines. Non-EU regulations must also be deemed equivalent for the cross-
border provision of products and services, including for managers to continue marketing their funds in
the EU. Solvency II, MiFID II and MiFIR have similar equivalence requirements for market access.
3. The UK adopts a tougher stance than the EU on a variety of regulatory issues: The UK also
has a tendency to impose higher minimum standards for some financial services regulations, relative to
the minimum standards necessary to comply with global and EU standards. Many of the regulations that
have been implemented in the UK have gone beyond global and EU requirements where permissible. For
example, the UK’s retail distribution review goes beyond the MiFID II regime in some respects by
requiring additional disclosures on the cumulative impact of costs and charges on returns, requirements
to disclose top execution venues and requirements for execution quality for investment firms. In
addition, the UK also desired higher capital requirements than those which were introduced under CRD
IV, but was unable to implement higher requirements as capital ratios came within the scope of CRD IV
Regulation, which prohibits the imposition of higher minimum standards.
Our analysis assumes that the cost savings would apply on an annual basis from 2020 onwards, which is when we assume a formal exit would take place. We currently assume in our model that the UK would continue to apply most regulations, with the exception of the regulatory changes in Table E.2. This means that most EU regulation is assumed to continue to apply in the UK, which would require domestic Acts of Parliament or statutory instruments in order for these to be enshrined in UK law. Whereas Directives (which require domestic legislation to take effect) would remain in force until they are repealed or amended.
In practice, it has been suggested that should the UK vote to leave the EU, deregulation could be achieved through a ‘Great Repeal Bill’, based on the principles of the Public Bodies Act (2011), to which regulation deemed unnecessary or too costly can be added once voted upon.127 In the event that the UK left the EU, the required changes to legislation would need significant Parliamentary time and resources, particularly if a case-by-case approach was needed to determine which regulations should be retained, amended or discarded.
During this transitional period, there is likely to be significant uncertainty over the new regulatory regime, which could impact investment decisions.
127 Mansfield (2014).

PwC 70
Uncertainties and caveats relating to our model assumptions There are a few important limitations to the analysis:
On the one hand, our assumptions are based on an analysis of the 100 costliest regulations which may
mean that the potential impact of regulatory change is understated; and
On the other hand, this effect may be mitigated (or even outweighed) by the fact that Open Europe’s study relies on gross cost savings: in principle, the cost savings should be set against any benefits that are foregone by removing regulations. This is difficult to do because:
Many of the government’s regulatory impact assessments did not quantify benefits as they were too difficult to assess; and
Open Europe concluded that a large proportion of the benefits in the Government’s impact assessments are overstated.128
Given the difficulty in obtaining consistent and reliable data on the benefits of regulations, the gross costs of regulations have been used. In any case, our modelling suggests that the impact of the reduction in regulatory costs is unlikely to be significant relative to the other impacts we have assessed. It would be smaller still once the foregone benefits of regulations have been taken into account.
We also note that these savings may be relatively optimistic as it may not be politically or socially desirable to ease or repeal all of the social, employment and environmental and climate change regulations as assumed in our modelling.129
In addition, we recognise that the UK would gain more flexibility to use State Aid for the benefit of UK firms if it left the EU.130 However, this has not been explicitly factored into our modelling as our analysis suggests that greater discretion is unlikely to deliver significant benefits to the UK for the following reasons:
The UK would continue to face constraints on how it uses public resources to aid UK firms;131 and
There is evidence that the UK already has more scope to use State Aid under the EU regime than it currently does, suggesting that the UK Government is not significantly constrained by EU State Aid rules.
128 In particular, Open Europe state that a large proportion of the benefits are from climate change regulation, which have not been realised.
Open Europe argue that the government’s impact assessments state that the benefits of such regulations would only emerge if there was a
global deal on climate change and emissions reduction, which has not materialised. 129 Open Europe’s savings from changing environmental and climate change regulation also include abandoning the EU’s renewable
energy target, which in our view, is unlikely to occur. 130 The European State Aid regime is designed to preserve a level playing field between firms across Europe, restricting Member States
from using public resources to subsidise, selectively, firms in their own country and so give those firms competitive advantage against
unaided firms (e.g. rivals from other Member States). It, therefore, protects fair competition and the free movement of goods and services
across Europe. 131 Even if the UK gains some degree of benefit from increasing levels of State Aid, the costs of providing State Aid (e.g. reduction in
government spending in other areas or tax increases) also need to be offset against these benefits.

PwC 71
In this Annex we first outline the economic context and key issues in relation to the UK’s fiscal contribution to the EU budget. We then describe how we have modelled changes in the UK’s fiscal contribution. We also discuss the justification for these assumptions as well as the uncertainties surrounding them.
F.1 Economic context and key issues All EU Member States make a financial contribution to the EU budget. These contributions are transferred to the accounts held by the European Commission with Member States’ central banks, treasuries, and commercial banks. Responsibility for managing EU funds lies ultimately with the European Commission. However, in practice, around 80% of EU funds are managed by national governments or regional managing authorities.132 Funding is used for programmes and policies that seek to aid the prosperity and development of the Member States, as well as the costs of running the European Commission.133
From 2010 to 2015, the UK’s average gross contribution to the EU amounted to around £16.8 billion. However, the UK also:
Received fiscal transfers from the EU in the form of public receipts, which are paid primarily to the private sector but are channelled through UK government departments. These payments are worth around £4.4 billion a year, and include funding for agriculture, regional policy and research and development; and
Received a rebate that is based on the difference between what the UK contributes and its receipts.
This means that the UK’s average net contribution to the EU budget over these same years is estimated to be around £8.8 billion per year or around 0.5% of GDP.
Figure F.1 shows the UK’s gross contributions to the EU and the receipts it received since 2009, as well as the net contributions expressed as a percentage of nominal UK GDP. The UK’s net contribution in 2015 was estimated to be around £8.5 billion (HM Treasury 2015).134 The chart shows that net contributions have remained stable at around 0.5% of GDP between 2010 and 2015. In 2009, however, the UK’s net budget contribution was significantly lower at 0.3%. The increase in the following years was largely due to a reduction in the UK’s rebate. Public sector receipts from the EU budget have remained broadly consistent at between £4 billion and £4.7 billion between 2009 and 2015.
132 European Commission official website: EU contractors and beneficiaries of funding from the EU budget. 133 The EU budget financial report shows that administration costs, including the costs of running EU institutions and administrative bodies,
accounted for around 6% of the total EU budget. Source: European Commission (2014). 134 HM Treasury (2015).
Annex F: Fiscal contributions
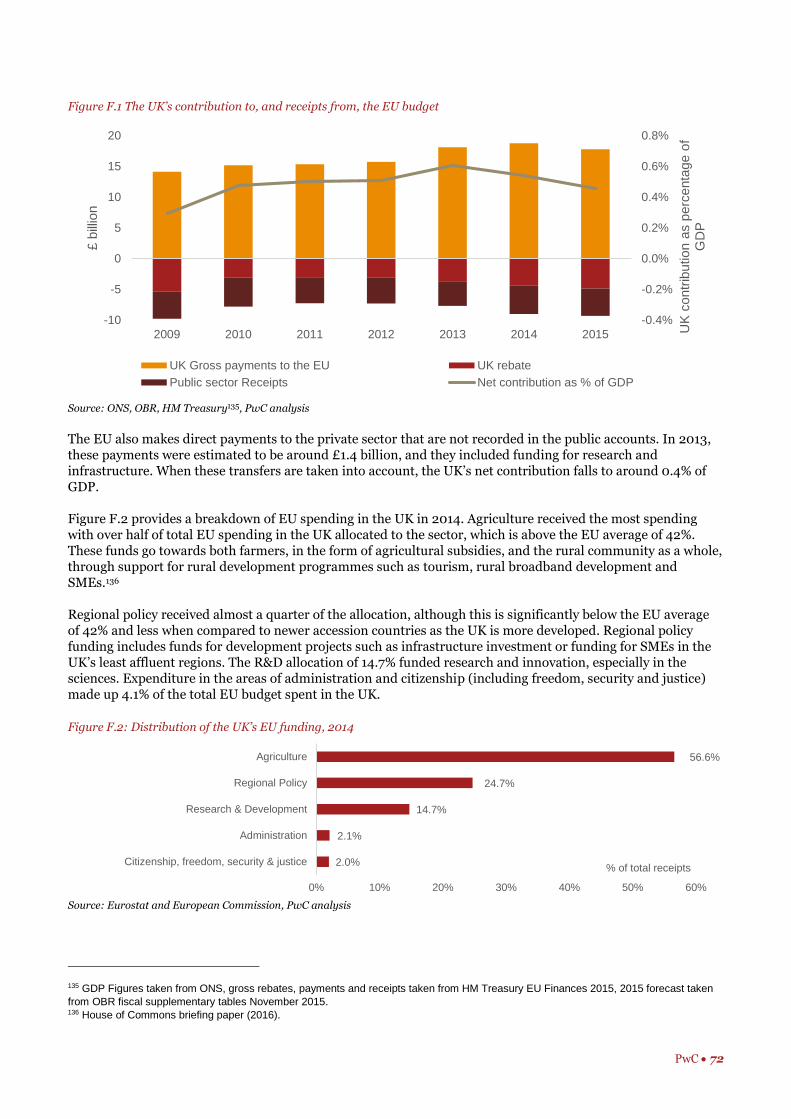
PwC 72
Figure F.1 The UK’s contribution to, and receipts from, the EU budget
Source: ONS, OBR, HM Treasury135, PwC analysis
The EU also makes direct payments to the private sector that are not recorded in the public accounts. In 2013, these payments were estimated to be around £1.4 billion, and they included funding for research and infrastructure. When these transfers are taken into account, the UK’s net contribution falls to around 0.4% of GDP.
Figure F.2 provides a breakdown of EU spending in the UK in 2014. Agriculture received the most spending with over half of total EU spending in the UK allocated to the sector, which is above the EU average of 42%. These funds go towards both farmers, in the form of agricultural subsidies, and the rural community as a whole, through support for rural development programmes such as tourism, rural broadband development and SMEs.136
Regional policy received almost a quarter of the allocation, although this is significantly below the EU average of 42% and less when compared to newer accession countries as the UK is more developed. Regional policy funding includes funds for development projects such as infrastructure investment or funding for SMEs in the UK’s least affluent regions. The R&D allocation of 14.7% funded research and innovation, especially in the sciences. Expenditure in the areas of administration and citizenship (including freedom, security and justice) made up 4.1% of the total EU budget spent in the UK.
Figure F.2: Distribution of the UK’s EU funding, 2014
Source: Eurostat and European Commission, PwC analysis
135 GDP Figures taken from ONS, gross rebates, payments and receipts taken from HM Treasury EU Finances 2015, 2015 forecast taken
from OBR fiscal supplementary tables November 2015. 136 House of Commons briefing paper (2016).
-0.4%
-0.2%
0.0%
0.2%
0.4%
0.6%
0.8%
-10
-5
0
5
10
15
20
2009 2010 2011 2012 2013 2014 2015 UK
contr
ibution a
s p
erc
enta
ge o
f G
DP
£ b
illio
n
UK Gross payments to the EU UK rebate
Public sector Receipts Net contribution as % of GDP
56.6%
24.7%
14.7%
2.1%
2.0%
0% 10% 20% 30% 40% 50% 60%
Agriculture
Regional Policy
Research & Development
Administration
Citizenship, freedom, security & justice% of total receipts

PwC 73
F.2 Modelling the impact of the UK exiting the EU on fiscal contributions: key assumptions If the UK left the EU, the UK would no longer have to contribute to the EU budget although this depends on the exit scenario. If the UK joined the EEA, like Norway, it would still have to contribute in order to access the Single Market, albeit at a slightly lower rate than as a full EU member. On the other hand, if the UK were to negotiate an FTA or left with no access agreement, a budgetary contribution would not be required.
In our modelling we assume under both WTO and FTA scenarios that:
The UK Government regains control of its net contribution (which is equal to approximately 0.5% of UK GDP, excluding direct transfers to the private sector). In effect, this means that the UK Government would replace EU funding for regions and businesses (that currently benefit from EU funding) with its own funding at the same level.
This is applied as a fiscal impact in the model such that 50% of the saving is allocated to capital investment and the remaining 50% is allocated to government debt reduction. This is broadly in line with the UK Government’s policy priorities.
The reduction in contribution takes effect from 2020 onwards, which is when we assume that the UK’s formal exit would take effect.
Uncertainties and caveats relating to our model assumptions There are a few limitations to the analysis:
Our analysis assumes that the UK would replace EU funding for regions and businesses with its own funding. We do not explicitly model changes to fiscal spending patterns. However, in practice, the mix could change in the future, depending on UK government priorities and regional funding and infrastructure needs.
Our analysis also does not assume any proactive fiscal policy response to EU exit. The government could also respond by loosening fiscal policy, but its capacity to do this would be weakened by a larger fiscal deficit that would accrue in both of our scenarios.
The EU also makes direct payments to the private sector in the form of the contribution to R&D and infrastructure funding, worth £1.4 billion in 2013.137 Our analysis does not explicitly capture the reduction in these payments. However, it is likely that the loss of these direct payments (if not replaced by the UK Government) would have a small, negative impact on the economy through their effect on productivity.
137 HM Treasury (2015).

PwC 74
Aghion, P. Dewatripont, M., Harrison, A. and Legros, P. (2005) “Industrial Policy and Competition”.
Allen, R.G.D (1968) “Macro-economic Theory: A Mathematical Treatment”, London: Macmillan.
Anderson, J.E. and van Wincoop, E. (2004) “Trade costs”, Journal of Economic Literature, Vol. 42, pp. 691-751.
Armington, P.S. (1969) “A Theory of Demand for Products Distinguished by Place of Production”, Staff Papers-International Monetary Fund.
Bank for International Settlements (2011) “The impact of sovereign credit risk on bank funding options” CGFS Papers, No 43.
Bank of England (2015a) “EU membership and the Bank of England”, October 2015.
Bank of England (2015b) “The impact of immigration on occupational wages: evidence from Britain” Staff Working Paper No. 574, December 2015.
Bank of England (2016) “Market notice: Additional Indexed Long-Term Repo operations”, March 2016.
Barrell, R. and Pain, N. (1998) “Real exchange rates, agglomerations and irreversibilities: macroeconomic policy and FDI in EMU”, Oxford Review of Economic Policy, Vol 14, pp. 152-167.
Barrell, R. and Pain, N. (1999) “Domestic institutions, agglomerations and foreign direct investment in Europe”, European Economic Review, Vol. 43, pp. 925-934.
Bekaert, G., Harvey, C., Lundblad, C. and Siegel, S. (2012) “The European Union, the Euro, and Equity Market Integration”.
Business for Britain (2015) “The EU’s influence over British law: the definitive answer”.
Department for Business, Innovation and Skills (BIS) and Home Office (2014) “Impacts of migration on UK native employment: An analytical review of the evidence”, March 2014.
Blomstrom, M. and Kokko, A. (1997) “Regional integration and foreign direct investment: a conceptual framework and three cases”.
Bloomberg (2015) “Bloomberg Brief: Brexit Special”, February 2016.
Bloomberg (2016a) “U.K. Gilt Sale Sees Least Demand Since Crisis-Era Failed Auction”, January 2016.
Bloomberg (2016b) “The Impact of ‘Brexit’ on Sovereign Ratings for the U.K.”, February 2016.
Business for Britain (2015) “Briefing Note: 7% or 75%: The EU’s influence over British laws: the definitive answer”, March 2015.
Cabinet Office (2016a) “The Process for withdrawing from the European Union”, 29 February 2016.
Cabinet Office (2016b) “Alternative to membership: possible models for the United Kingdom outside the European Union”, 2 March 2016.
Annex G: Bibliography

PwC 75
Centre for Financial Studies (2014) “The costs and benefits of leaving the EU”, CFS Working Paper Series No. 472.
Centre for European Reform (June 2014) “The economic consequences of leaving the EU: The final report of the CER commission on the UK and the EU single market”, June 2014.
CEP and LSE (2014) “Immigration, the European Union and the UK Labour Market”, May 2014.
Ciuriak Consulting (2015) “The trade-related impact of a UK exit from the EU Single Market”, 25 April, 2015.
Damiani, M., and Pompei, F. (2010) “Labour protection and productivity in EU economies: 1995-2005” The European Journal of Comparative Economics, Vol 7.
Deutsche Bank (2016) “The UK & EU: Exit Emergency”, February 2016.
Di Giovanni, J., Levchenko, A. and Ortega, F. (2014) “A global view of cross-border migration”.
Dixit, A.K., and Stiglitz, J.E. (1977) “Monopolistic competition and optimum product diversity”, the American Economic Review.
Dustmann, C. and Fabbri, F. (2005) “Immigrants in the British Labour Market”.
Dustmann, C. and Fabbri, F. (2005) “The Effect of Immigration along the Distribution of Wages”.
Dustmann, C. and Frattini, T. (2013) “The Fiscal Effects of Immigration to the UK”, CReAM Discussion Paper No. 22/13 (2013), November 2013.
Dustmann, C., Frattini, T. and Preston, I (2013) ‘The Effect of Immigration along the Distribution of Wages”.
Europe Economics (2015) “How EU Wholesale Financial Regulation Differs from what the UK would Choose for Itself”, December 2014.
European Central Bank (2015) “Assessing European firms’ exports and productivity distributions: the CompNet trade module”, May 2015.
European Commission (2007) “Steps towards a deeper economic integration: the Internal Market in the 21st century A contribution to the Single Market Review”, European Economy Economic Papers No. 271, January 2007.
European Commission (2014) “EU Budget 2014: Financial Report”.
European Parliamentary Research Service (2014) “The Cost of Non- Europe in the Single Market”.
Fitch Ratings (2015) “Fitch: Brexit Vote Would Be Moderately Credit Negative for UK”, 14 December 2015.
Global Counsel (2015) “BREXIT: the impact on the UK and the EU”, June 2015.
Griffith, R. and Macartney, G. (2010) “Employment protection legislation, multinational firms and innovation", IFS Working Papers W10/01, Institute for Fiscal Studies.
Hertel, T., McDougall, R., Narayanan, B. and Aguiar, A. (2012) “Behavioural parameters”, in Global Trade Analysis, edited by Thomas Hertel.
HM Revenue and Customs (2013) “A disaggregation of HMRC tax receipts between England, Wales, Scotland and Northern Ireland: Methodology Note”.
HM Treasury (2010) “Treasury analysis of third party assessments of cost-benefit analyses of EU membership”.

PwC 76
HM Treasury (2015) “European Union Finances 2015: statement on the 2015 EU Budget and measures to counter fraud and financial mismanagement”, December 2015.
House of Commons briefing paper (2015) “EU obligations: UK implementing legislation since 1993”, edited by Vaughne Miller, June 2015.
House of Commons briefing paper (2016a) “Exiting the EU: impact in key policy areas”, edited by Vaughne Miller, 12 February 2016.
House of Commons briefing paper (2016b) “Migration Statistics”, edited by Oliver Hawkins, 25 February 2016.
House of Commons research paper (2013) “Leaving the EU”, Research paper 13/42, edited by Vaughne Miller, July 2013.
Hüttl, P. and Merler, S. (2016) "Fog In The Channel: Brexit Through The Eyes Of International Trade", Bruegel, 7 March 2016.
Institute of Directors (2013) “The Midas touch: Gold-plating of EU employment directives in UK law”, June 2016.
Invesco (2015) “Brexit – the pros and cons”, July 2015.
Investment Association (2016) “Europe offers glimmer of hope to fund buyers in choppy January”, February 2016.
Ita, A. (2015) “Credit Default Swap Spreads and Implied Cost of Equity”.
Jans, J.H. and Squitani, L. (2009) “‘Gold Plating’ of European Environmental Measures?”, Journal for European Environmental and Planning Law, Vol 6.
Juravle, C., Weber, T., Canetta, E., Tersch, E.F. and Kadunc, M. (2013) “A fact finding analysis on the impact on the Member States' social security systems of the entitlements of non-active intra-EU migrants to special non-contributory cash benefits and healthcare granted on the basis of residence”, ICF GHK in association with Milieu Ltd, December 2013.
Looi, K.H., Nicita, A. and Olarrega, M. (2009), “Estimating trade restrictiveness indices”, Economic Journal, Vol 119, pp. 172-199.
Manacorda, M. and Manning, A. (2011) “The impact of immigration on the structure of wages: theory and evidence from Britain”.
Markusen, J., Rutherford, T.F. and David, T. (2000) “Foreign Direct Investments in Services and the Domestic Market for Expertise”, NBER Working Papers 7700.
Mayor of London (2014) ‘The Europe Report: A win-win situation”, August 2014.
McIntosh, S. (2013) “Hollowing out and the future of the labour market”, BIS Research Paper Number 134, Department for Business, Innovation and Skills, October 2013.
Mejean, I. and Schwellnus, C. (2009) “Price convergence in the European Union: Within firms or composition of firms?".
Migration Observatory (2014) “Highly skilled migration to the UK 2007-2013”, 3 July 2014.
Migration Advisory Committee (2014) “Migrants in low-skilled work: The growth of EU and non-EU labour in low-skilled jobs and its impact on the UK”, 8 July 2014.

PwC 77
Moody's (2015) “EU exit would be negative for UK economy, but credit impact would depend on policy”, 3 December 2015.
Moser, C. and Rose, A.K. (2012), "Why Do Trade Negotiations Take So Long?". Vox EU., 8 June, 2012.
Novy, D. (2013), “Gravity redux: measuring international trade costs with panel data”, Economic Inquiry, Vol 51, pp. 101-121.
Office Budget Responsibility (2015) “Fiscal Sustainability Report 2015”, June 2015.
Office for National Statistics (2008), “Analysis of international trade and productivity, using the EUKLEMS database”, November 2008.
Office for National Statistics (2015) “United Kingdom population mid-year estimate”, June 2015.
Open Europe (2010) “Still out of control? Measuring eleven years of EU regulation”.
Open Europe (2015) “What if...? The consequences, challenges and opportunities facing Britain outside the EU”, March 2015.
Ottaviano, G. and Peri, G. (2005), “Rethinking the Gains from Immigration: Theory and Evidence from the U.S”.
Pain, N. and Lansbury, M (1997) “Regional economic integration and foreign direct investment: the case of German investment in Europe”, National Institute Economic Review, Vol 160.
Pain, N. and Young, G. (2004), “The macroeconomic impact of UK withdrawal from the EU”, NIESR.
Powell, A. A. and Gruen, F. (1968) “The constant elasticity of transformation production frontier and linear supply system”, International Economic Review, 9(3), pp. 315-328.
PwC (2015) “The World in 2050 – Will the shift in global economic power continue?”, February 2015.
Straathof, B., Linders, G-J., Lejour, A. and Möhlmann, J. (2008) “The Internal Market and the Dutch Economy”, CPB Document No. 168.
University of Kent Centre for Swiss Politics (2013) “Switzerland’s Approach to EU Engagement: A Financial Services Perspective”, report for the City of London Corporation.
Uzawa, H. (1961) “Neutral inventions and the stability of growth equilibrium”, the Review of Economic Studies, 28(2), pp. 117-124.

PwC 78
Contacts
To discuss the implications of this analysis for your organisation please contact any of the authors of the report:
Dr. Jonathan Gillham
Head of Econometrics and Economic
Modelling
David Lancefield
Partner
Andrew Sentance
Senior Economic Advisor
John Hawksworth
Chief Economist
Jing Teow
Manager
Mark Ambler
Director
Conor Lambe
Senior Associate
Edmond Lee
Senior Associate

PwC UK helps organisations and individuals create the value they’re looking for. We’re a member of the PwC network of firms in 157 countries with more than 184,000 people committed to delivering quality in assurance, tax and advisory services. Tell us what matters to you and find out more by visiting us at www.pwc.com/uk.
This publication has been prepared for general guidance on matters of interest only, and does not constitute professional advice. You should not act upon the information contained in this publication without obtaining specific professional advice. No representation or warranty (express or implied) is given as to the accuracy or completeness of the information contained in this publication, and, to the extent permitted by law, PricewaterhouseCoopers LLP, its members, employees and agents do not accept or assume any liability, responsibility or duty of care for any consequences of you or anyone else acting, or refraining to act, in reliance on the information contained in this publication or for any decision based on it.
© 2016 PricewaterhouseCoopers LLP. All rights reserved. In this document, “PwC” refers to the UK member firm, and may sometimes refer to the PwC network. Each member firm is a separate legal entity. Please see www.pwc.com/structure for further details.
160316-210916-BK-UK