Embed Size (px)
Citation preview

G L O B A L E C O N O MY & D E V E L O P ME N TWORKING PAPER 110 | FEBRUARY 2018
LEAVE NO COUNTRY BEHIND ENDING POVERTY IN THE TOUGHEST PLACES
Geoffrey Gertz and Homi Kharas


Geoffrey Gertz is a post-foctoral fellow at the Global Economy and Development Program at the Brookings Institution.
Homi Kharas is interim vice president and director of the Global Economy and Development Program at the Brookings Institution.
Acknowledgments:
We thank Brina Seidel for exceptional research assistance throughout this project.
The Brookings Institution is a nonprofit organization devoted to independent research and policy solutions. Its mission is to conduct high-quality, independent research and, based on that research, to provide innovative, practical recommendations for policymakers and the public. The conclusions and recommendations of any Brookings publication are solely those of its author(s), and do not reflect the views of the Institution, its manage-ment, or its other scholars.
Support for this publication was generously provided by the Norwegian Agency for Development Cooperation, with additional support from the Embassy of Denmark.
Brookings recognizes that the value it provides is in its absolute commitment to quality, independence, and im-pact. Activities supported by its donors reflect this commitment.

CONTENTSExecutive summary . . . . . . . . . . . . . . . . . . . . . . . . . . . . . . . . . . . . . . . . . . . . . . . . . . . . . . . . . . . . . . . . . . . . . i
Identifying severely off track countries. . . . . . . . . . . . . . . . . . . . . . . . . . . . . . . . . . . . . . . . . . . . . . . . . . . . i
Obstacles to development in SOTCs . . . . . . . . . . . . . . . . . . . . . . . . . . . . . . . . . . . . . . . . . . . . . . . . . . . . . ii
Action plans for SOTCs . . . . . . . . . . . . . . . . . . . . . . . . . . . . . . . . . . . . . . . . . . . . . . . . . . . . . . . . . . . . . . . . iii
Summary and conclusions . . . . . . . . . . . . . . . . . . . . . . . . . . . . . . . . . . . . . . . . . . . . . . . . . . . . . . . . . . . . . iv
Introduction . . . . . . . . . . . . . . . . . . . . . . . . . . . . . . . . . . . . . . . . . . . . . . . . . . . . . . . . . . . . . . . . . . . . . . . . . . .1
The SDGs and the principle of “leave no one behind” . . . . . . . . . . . . . . . . . . . . . . . . . . . . . . . . . . . . . . .1
Toward an action plan to leave no country behind . . . . . . . . . . . . . . . . . . . . . . . . . . . . . . . . . . . . . . . . . .1
Which countries are severely off track? . . . . . . . . . . . . . . . . . . . . . . . . . . . . . . . . . . . . . . . . . . . . . . . . . . . . 3
Projecting poverty in 2030 . . . . . . . . . . . . . . . . . . . . . . . . . . . . . . . . . . . . . . . . . . . . . . . . . . . . . . . . . . . . . 3
Identifying SOTCs . . . . . . . . . . . . . . . . . . . . . . . . . . . . . . . . . . . . . . . . . . . . . . . . . . . . . . . . . . . . . . . . . . . . 4
The heart of the development challenge . . . . . . . . . . . . . . . . . . . . . . . . . . . . . . . . . . . . . . . . . . . . . . . . . . 6
Obstacles to development in SOTCs . . . . . . . . . . . . . . . . . . . . . . . . . . . . . . . . . . . . . . . . . . . . . . . . . . . . . . . 8
Low government effectiveness . . . . . . . . . . . . . . . . . . . . . . . . . . . . . . . . . . . . . . . . . . . . . . . . . . . . . . . . . . 8
Improving government effectiveness . . . . . . . . . . . . . . . . . . . . . . . . . . . . . . . . . . . . . . . . . . . . . . . . . .12
Working around or working through governments? . . . . . . . . . . . . . . . . . . . . . . . . . . . . . . . . . . . . . .12
Weak private sector . . . . . . . . . . . . . . . . . . . . . . . . . . . . . . . . . . . . . . . . . . . . . . . . . . . . . . . . . . . . . . . . . . .13
What obstacles do businesses face in SOTCs? . . . . . . . . . . . . . . . . . . . . . . . . . . . . . . . . . . . . . . . . . . .13
Managing formal and informal sectors . . . . . . . . . . . . . . . . . . . . . . . . . . . . . . . . . . . . . . . . . . . . . . . . .14
How to catalyze foreign investment . . . . . . . . . . . . . . . . . . . . . . . . . . . . . . . . . . . . . . . . . . . . . . . . . . . .15
Conflict and violence . . . . . . . . . . . . . . . . . . . . . . . . . . . . . . . . . . . . . . . . . . . . . . . . . . . . . . . . . . . . . . . . . .17
Intra-state conflict . . . . . . . . . . . . . . . . . . . . . . . . . . . . . . . . . . . . . . . . . . . . . . . . . . . . . . . . . . . . . . . . . .17
Violence and crime . . . . . . . . . . . . . . . . . . . . . . . . . . . . . . . . . . . . . . . . . . . . . . . . . . . . . . . . . . . . . . . . .18
Can we effectively prevent conflict? . . . . . . . . . . . . . . . . . . . . . . . . . . . . . . . . . . . . . . . . . . . . . . . . . . . .19
Natural hazards and environmental risks . . . . . . . . . . . . . . . . . . . . . . . . . . . . . . . . . . . . . . . . . . . . . . . 20
Building resilience . . . . . . . . . . . . . . . . . . . . . . . . . . . . . . . . . . . . . . . . . . . . . . . . . . . . . . . . . . . . . . . . . .21
Improving humanitarian responses to disasters . . . . . . . . . . . . . . . . . . . . . . . . . . . . . . . . . . . . . . . . 23
Action plans for SOTCs . . . . . . . . . . . . . . . . . . . . . . . . . . . . . . . . . . . . . . . . . . . . . . . . . . . . . . . . . . . . . . . . 25
Reimagine scaling up . . . . . . . . . . . . . . . . . . . . . . . . . . . . . . . . . . . . . . . . . . . . . . . . . . . . . . . . . . . . . . . . 29
Redefine country ownership . . . . . . . . . . . . . . . . . . . . . . . . . . . . . . . . . . . . . . . . . . . . . . . . . . . . . . . . . . .31
Rethink results-focused metrics . . . . . . . . . . . . . . . . . . . . . . . . . . . . . . . . . . . . . . . . . . . . . . . . . . . . . . . 32
Summary and conclusions . . . . . . . . . . . . . . . . . . . . . . . . . . . . . . . . . . . . . . . . . . . . . . . . . . . . . . . . . . . . . . 35
Annex: Methodology . . . . . . . . . . . . . . . . . . . . . . . . . . . . . . . . . . . . . . . . . . . . . . . . . . . . . . . . . . . . . . . . . . 36

LIST OF FIGURESFigure A1 Severely Off Track Countries . . . . . . . . . . . . . . . . . . . . . . . . . . . . . . . . . . . . . . . . . . . . . . . . . ii
Figure 1 Severely Off Track Countries . . . . . . . . . . . . . . . . . . . . . . . . . . . . . . . . . . . . . . . . . . . . . . . . . 5
Figure 2 Poverty Trajectories, 2000-2030 . . . . . . . . . . . . . . . . . . . . . . . . . . . . . . . . . . . . . . . . . . . . . 5
Figure 3 2030 Poverty Projections . . . . . . . . . . . . . . . . . . . . . . . . . . . . . . . . . . . . . . . . . . . . . . . . . . . . .7
Figure 4 Overlapping Obstacles to Development in SOTCs . . . . . . . . . . . . . . . . . . . . . . . . . . . . . 10
Figure 5 What Share of Letters Did the National Postal Authority
Properly Return to Sender? . . . . . . . . . . . . . . . . . . . . . . . . . . . . . . . . . . . . . . . . . . . . . . . . . . 11
Figure 6 What is the Biggest Obstacle to Doing Business? . . . . . . . . . . . . . . . . . . . . . . . . . . . . . . .12
Figure 7 Some SOTCs attract lots of FDI, others very little . . . . . . . . . . . . . . . . . . . . . . . . . . . . . .16
Figure 8 On average, resource governance is worse in SOTCs
than in other developing countries . . . . . . . . . . . . . . . . . . . . . . . . . . . . . . . . . . . . . . . . . . .17
Figure 9 Do SOTCs Meet International Targets for Disaster Preparedness? . . . . . . . . . . . . . . 22
Figure 10 Country Programmable Aid to Severely Off Track Countries . . . . . . . . . . . . . . . . . . . 26
Figure 11 Some SOTCs Receive Lots of Aid, Others Barely Any . . . . . . . . . . . . . . . . . . . . . . . . . . 26
Figure 12 Aid to Off Track Countries is Very Volatile (select countries) . . . . . . . . . . . . . . . . . . . 27
Figure 13 The Gap in Project Evaluation Scores between SOTCs and
Other Countries has Narrowed . . . . . . . . . . . . . . . . . . . . . . . . . . . . . . . . . . . . . . . . . . . . . . 28
LIST OF TABLESTable 1 The Overlap between SOTCs and Fragile States . . . . . . . . . . . . . . . . . . . . . . . . . . . . . . . 27
Table 2 Natural Disasters in SOTCs Since 2000 . . . . . . . . . . . . . . . . . . . . . . . . . . . . . . . . . . . . . . .31
Table 3 Regression results . . . . . . . . . . . . . . . . . . . . . . . . . . . . . . . . . . . . . . . . . . . . . . . . . . . . . . . . . 37


LEAVE NO COUNTRY BEHINDENDING POVERTY IN THE TOUGHEST PLACES
Geoffrey Gertz and Homi Kharas
L E A V E N O C O U N T R Y B E H I N D : E N D I N G P O V E R T Y I N T H E T O U G H E S T P L A C E S i
EXECUTIVE SUMMARY
The past 15 years saw the most rapid decline in
global poverty ever, with the Millennium Devel-
opment Goal (MDG) of halving the global poverty rate
reached several years ahead of schedule. Building on
this, governments around the world committed to a
new set of Sustainable Development Goals (SDGs), in-
cluding ending extreme poverty everywhere by 2030.
The pathway to achieving the SDGs will be qualita-
tively different from that which worked for the MDGs.
In the MDG era, large, rapidly growing economies—in-
cluding China, India, Indonesia, Bangladesh, and Ethi-
opia—drove development advances. Indeed, the world
met the poverty MDG despite the fact that many of the
poorest countries made little to no progress. Success
during the SDG era, in contrast, depends precisely on
what happens in these poorest countries. To achieve
the goal of ending extreme poverty everywhere, we
need a strategy that ensures no country is left behind.
This paper outlines such a strategy. First, it identifies
those countries most at risk of being left behind: places
we refer to as Severely Off Track Countries (SOTCs).
Second, it diagnoses four core obstacles to develop-
ment in these countries: low government effectiveness,
weak private sector, conflict and violence, and natural
hazards and environmental risks. Third, it suggests
three ways in which partner country governments and
donors need to adapt their standard practices to help
countries get on track to ending poverty.
Identifying severely off track countries
To determine which countries are least likely to end
extreme poverty by 2030, we project poverty rates for
195 countries around the world using the poverty line
of $1.90 a day in 2011 purchasing power parity (PPP)
terms. Based on current trajectories, 31 countries will
have extreme poverty headcount ratios of at least 20
percent in 2030, our threshold for identification of
SOTCs (see Figure A1). This group includes countries
where poverty is falling, but from extremely high ini-
tial levels, as well as countries with moderate poverty
but who are expected to make only minimal progress
in coming years. We estimate that, by 2030, four out

i i G L O B A L E C O N O M Y A N D D E V E L O P M E N T P R O G R A M
of every five people living in extreme poverty will be in
the 31 SOTCs.
Obstacles to development in SOTCs
Are there common development challenges among
SOTCs? Of the 31 countries, 24 are on either one or
both of the World Bank’s Fragile States list and the
Fund for Peace’s Fragile States Index. Yet the term
“fragility” encapsulates many different concepts and
masks important variation across countries. For this
reason, rather than focusing on fragility, we look at
four underlying obstacles to development that contrib-
ute to persistent poverty in SOTCs.
• Low government effectiveness: 16 of the
SOTCs have low government effectiveness, de-
fined as the government’s inability to administer
and enforce rules and deliver services. Countries
with low government effectiveness are unable
to implement the policies that they have agreed
to in principle; their bureaucracies are rife with
absenteeism and corruption, and they struggle to
provide basic services.
• Weak private sector: 22 of the SOTCs have
weak private sectors, where firms face significant
obstacles to doing business, resulting in limited
domestic and foreign investment. While there
are often potentially profitable opportunities for
the private sector even in very poor countries—
in sectors including but not limited to natural
resources—a series of market and government
failures may make it difficult to realize these op-
portunities or translate them into financial gain
for the investor.
• Conflict and violence: 12 SOTCs have high
levels of conflict and violence. Organized vio-
lence often occurs in repeated cycles and at times
spills across borders, disrupting development,
destroying infrastructure, and breaking down
social trust. Given the high costs of violence—in
human, economic, and social terms—supporting
Figure A1. Severely Off Track Countries
▪ Severely Off Track CountriesSource: Authors’ Calculations

L E A V E N O C O U N T R Y B E H I N D : E N D I N G P O V E R T Y I N T H E T O U G H E S T P L A C E S i i i
conflict prevention is often a sound investment
for both governments and donors.
• Natural hazards and environmental risks:
Six SOTCs have significant natural hazards and
environmental risks. Those living in poverty
are often most vulnerable to natural disasters;
they are more likely to live in risky areas such as
alongside rivers and floodplains, and lack access
to social services, infrastructure, and political
processes that could mitigate or help them adapt
to hazards. Countries with high risks of natural
hazards face a dual challenge: enhancing resil-
ience before disasters hit and improving humani-
tarian responses in the aftermath of events.
Action plans for SOTCs
Our analysis suggests almost all SOTCs (28 of the 31)
have significant challenges in at least one of these four
areas, and 18 in multiple areas. To avoid being trapped
in cycles where short-term success against one obstacle
is offset by relapses in another, SOTCs must progress
along a broad front. Given the scope of this challenge,
the only way to achieve sustained development is
through partnerships between SOTC governments and
the international community. Working together, do-
nors and SOTC governments can develop action plans
for getting countries back on track to end extreme pov-
erty.
Yet current international assistance to SOTCs is not
commensurate with the scale of their development
needs, nor is it designed to maximize effectiveness.
SOTCs received 23 percent of global country program-
mable aid in 2015—a relatively small share when set
against our projection that 80 percent of the world’s
extreme poor will live in these countries by 2030. On
average, per capita aid is about the same in SOTCs as
other countries, but considering the far larger devel-
opment needs and lower scope for mobilizing non-aid
resources (domestic and foreign), this leaves SOTCs at
a financial disadvantage. Moreover, while some SOTCs
are “donor darlings,” others are “donor orphans,”
largely neglected by the international community.
Nevertheless, aid-financed projects in SOTCs appear to
be about as successful as projects in other countries.
This suggests it is not the case that it is simply too dif-
ficult to provide effective international assistance in
these challenging contexts. Yet there is a paradox be-
tween this project-level success at the micro level and
country-level stagnation at the macro level: successful
projects are not translating into sustained, broader
development progress. We suggest three ways donors
and governments should change their practices in
SOTCs to maximize development effectiveness:
• Reimagine scaling up. If a development in-
tervention is financially profitable, market forces
can be used to generate scale. If it aligns with a
government’s mandate and interests, the govern-
ment can roll out a program at scale by replicat-
ing across local, provincial, and national bureau-
cracies. In SOTCs, however, neither the market
nor the bureaucracy pathway is reliable. Private
markets are often shallow and inefficient, and
government bureaucracies are under-skilled and
ineffective. This means donors and governments
must reimagine how to scale up successful inter-
ventions, including through lowering transaction
costs for private investment, supporting domes-
tic resource mobilization and institutional capac-
ity building, and experimenting with how to in-
tegrate successful local programs into a national
network.
• Redefine country ownership. The New Deal
for Engagement in Fragile States, signed in 2011
by several endorsing organizations as well as

i v G L O B A L E C O N O M Y A N D D E V E L O P M E N T P R O G R A M
many countries, urged donors to partner more
closely with recipient governments and work
through their country systems whenever pos-
sible, even in difficult contexts. Partner countries
in turn promised to strengthen their systems and
build better state capabilities. In practice, how-
ever, donors have been reluctant to use country
systems that they view as corrupt or inefficient,
while partner countries’ efforts to improve capac-
ity have fallen short. This partly explains why the
New Deal has achieved only modest take-up to
date and why aid to fragile states has been falling.
To overcome this binary choice between (per-
ceived) inefficient reliance on country systems
versus bypassing government systems altogeth-
er, donors should experiment with new forms of
country ownership. For instance, in the transi-
tion period following Liberia’s civil war, donors
partnered with Liberia’s government through the
Governance and Economic Management Assis-
tance Program (GEMAP), an innovative model
where donors and government officials shared
responsibility and oversight for improving core
government functions. Similar compact-based
approaches might be applicable in other SOTCs.
• Rethink results-focused metrics. Over the
past decade, international development agen-
cies have embraced monitoring and evaluation
frameworks that emphasize measurable, time-
based metrics to track success and improve ac-
countability. While this more rigorous approach
to evaluation has produced many benefits, it can
backfire in SOTCs, where development progress
is often non-linear, success takes decades, and
it is impossible to define interim benchmarks
precisely based on international best practices.
Rather than evaluating projects against a pre-
determined set of time-based metrics, donors
should consider granting greater autonomy to
in-country offices, allowing them the flexibility
to respond to changing circumstances and tailor
their work to specific local contexts. Relatedly,
donors should review their risk management
strategies for SOTCs and make them less risk
averse. Given the scale of the development chal-
lenge in SOTCs and the need to experiment with
new approaches, some setbacks and failures are
to be expected; donors should adjust their inter-
nal policies to allow for this.
Summary and conclusions
The world is shifting from an era where poverty was
concentrated in large, rapidly growing economies to
an era where poverty will increasingly be concentrated
in a number of smaller economies facing deeper struc-
tural challenges. This shift has important implications
for international development prospects, as well as for
strategies to accelerate progress on the SDGs. SOTCs
are now the heart of the development challenge, and
should be the focus of the international community’s
attention.
The good news is that micro evidence—from both pub-
lic sector aid projects and private sector investments—
suggest development interventions in these contexts
can be successful and profitable, just as they are in
other developing countries. The challenge, for both do-
nors and governments, is how to move from individual
successful projects to sustained countrywide progress,
given the significant development obstacles in SOTCs.
This is arguably the most urgent question in develop-
ment today. This paper has outlined some principles
to guide strategies for ending poverty in SOTCs, but
much more research—particularly at the country level,
adapted to local contexts and reflective of country-
specific constraints and opportunities—is needed to
develop actionable country plans.

L E A V E N O C O U N T R Y B E H I N D : E N D I N G P O V E R T Y I N T H E T O U G H E S T P L A C E S 1
INTRODUCTION
In 2015, the members of the United Nations agreed
to end extreme poverty by 2030, the first of 17 SDGs.
For the world to achieve this, some 30 high poverty
countries that have seen little to no poverty reduction
in recent years will need to alter their current trajec-
tories. These are the places where development is the
most difficult, where entire countries and the people
who live in them are at risk of being left behind.
The SDGs and the principle of “leave no one behind”
The SDGs provide a focal point and organizing struc-
ture for global action on international development
through 2030. The SDGs, of course, are the successors
of the MDGs, the first set of international development
goals covering 2000-2015. Although the MDG era was
one of significant advances in international develop-
ment, these were uneven both within and across coun-
tries. Global poverty fell faster than ever, but with little
progress in fragile states.1 Similarly, impressive gains
in child and maternal health occurred across the globe,
but national averages concealed important within-
country differences.
The MDGs, then, looked at trends but not at distribu-
tions or inequalities. The SDGs were designed to rectify
this. Early on in the conceptualization and negotiation
of the SDGs, international officials, civil society, and
development experts coalesced around “leave no one
behind” as a key principle for the new goals. The prin-
ciple reflects the ambition of the goals—aiming for the
end of extreme poverty, not just a decline—as well as
a renewed concern with equity in international devel-
opment. For despite the widespread development ad-
vances of the past decade, there was a growing recogni-
tion that many of those facing the greatest deprivations
were missing out.
The concept of “leave no one behind” has generally
been conceived in individual terms, implying a special
focus on marginalized individuals and groups, includ-
ing women, children, the elderly, the disabled, and dis-
advantaged castes. Yet the concept could equally apply
to the importance of leaving no country behind. In-
deed, some of the poorest countries in the world made
only minimal development progress in recent years,
and their prospects for future growth are dim. This lack
of convergence implies worsening between-country in-
equalities: those that are starting out furthest behind
could see the smallest gains.
Toward an action plan to leave no country behind
The overall development successes of the MDG era
occurred despite the poorest countries languishing:
strong average performance in many of the world’s
most populous developing countries drove aggregate
gains. Success in the SDG era, however, depends large-
ly on what happens in the poorest countries. As more
and more individuals escape poverty in emerging econ-
omies, the global poverty challenge will increasingly be
concentrated in a small set of countries. The crucial
development challenge for the next 15 years is how to
change the development trajectories of these countries.
This reality suggests that, as development agencies
design strategies for contributing to the SDG target
of ending absolute poverty, they need to give special
1 See Laurence Chandy and Geoffrey Gertz, “Poverty in Numbers: The Changing State of Global Poverty from 2005 to 2015,” Brookings Institution, 2011; and Homi Kharas and Andrew Rogerson, “Horizon 2025: Creative Destruction in the Aid Indus-try,” Overseas Development Institution, 2012.

2 G L O B A L E C O N O M Y A N D D E V E L O P M E N T P R O G R A M
attention and effort to these countries. Rethinking how
to catalyze sustainable development in areas where
poverty has proven most intractable is an urgent prior-
ity for ensuring no one is left behind in the SDGs.
In this report, we make three contributions to current
policy debates on ending poverty. First, we seek to
identify which countries are most at risk of failing to
meet the international goal of ending poverty by 2030.
We refer to these places as Severely Off Track Coun-
tries (SOTCs). Our list is related to, but by no means
congruent with, existing lists of fragile states, such as
those compiled by the World Bank and the Fund for
Peace. Second, we diagnose four critical challenges
common to many of these countries: low government
effectiveness, weak private sectors, conflict and vio-
lence, and high risk of natural disasters. While each
country faces its own particular set of challenges, this
framework provides generalizable insights for inform-
ing country-specific strategies. Third, we discuss how
traditional aid practices need to adapt to be more effec-
tive in accelerating the end of poverty in SOTCs, while
noting the continued need for further research on what
works best in these contexts.

L E A V E N O C O U N T R Y B E H I N D : E N D I N G P O V E R T Y I N T H E T O U G H E S T P L A C E S 3
2 The methodological annex describes this approach in detail.3 For these countries, we model estimated poverty headcount ratios based on GDP per capita and regional effects; see full
description in methodology. There are six of these countries among the 31 SOTCs: Afghanistan, Equatorial Guinea, Eritrea, North Korea, Somalia, and South Sudan.
4 See John Gibson, Kathleen Beegle, Joachim De Weerdt, and Jed Friedman. “What does Variation in Survey Design Reveal about the Nature of Measurement Errors in Household Consumption?” Oxford Bulletin of Economics and Statistics 77, no. 3 (2015): 466-474.
5 Results from an earlier, preliminary wave of this survey were published earlier this year; see World Bank, “Somali Poverty Profile 2016: Findings from Wave 1 of the Somali High Frequency Survey,” June 2017.
WHICH COUNTRIES ARE SEVERELY OFF TRACK?
To identify countries at risk of failing to end extreme
poverty by 2030, we create country-level poverty
projections for 195 countries around the world. We
find that there are 31 countries which, based on cur-
rent trajectories, are extremely unlikely to end poverty
by 2030. This group includes countries where poverty
is falling but from extremely high initial levels, as well
as countries expected to make only minimal progress
on poverty in coming years. We estimate that by 2030
these 31 countries will account for four out of every five
people living in extreme poverty.
Projecting poverty in 2030
To project poverty headcounts for all countries be-
tween now and 2030, we combine existing household
poverty surveys with estimates and projections of fu-
ture household consumption growth and aggregate
population growth.2 Three caveats apply. First, while
the timeliness and quality of household surveys have
improved in recent years, considerable data gaps and
shortcomings in measuring poverty remain. We rely
on the World Bank’s PovcalNet database of household
surveys. While several countries—notably in Latin
America—now regularly conduct annual surveys, in
other countries there can be gaps of five years or more
between surveys. Some countries have never con-
ducted a nationally representative household poverty
survey, including several countries important for in-
ternational poverty analysis, such as Somalia, Eritrea,
and North Korea.3 Meanwhile, even when surveys ex-
ist, the data are not always reliable; for example, earlier
this year the World Bank decided that recent poverty
estimates for Cambodia were implausibly low, and re-
moved the related surveys from the database pending
further analysis. Nor are surveys always easily com-
parable across countries: for instance, some measure
household income, while others measure household
consumption. In many cases, household surveys have
large discrepancies when compared with national ac-
count measures of aggregate household consumption.
Research also suggests that differences in survey meth-
odologies can result in large differences in estimated
poverty rates.4
For a project focused on the world’s poorest countries,
these problems are particularly acute. Statistical ca-
pacity is lowest in countries with overall weak state ca-
pacity. Conducting household surveys is difficult if not
impossible in many conflict areas—partially explaining
why many fragile states have completed few, if any,
household surveys. The good news is that there have
been some notable advances in recent years; for in-
stance the first survey of poverty in Myanmar was com-
pleted in 2015, and the first representative survey of
Somalia was due to be carried out in 2017.5 Yet overall,
the state of poverty data remains poor, with significant
4 G L O B A L E C O N O M Y A N D D E V E L O P M E N T P R O G R A M
additional investments needed to measure poverty
with greater coverage, timeliness, and reliability.6
The second caveat relates to the GDP per capita projec-
tions we use to estimate future household consumption
growth. Such projections are subject to considerable
uncertainty. Most importantly for our analysis, these
projections cannot account for unforeseen shocks,
such as a war breaking out or extreme natural disas-
ters, which by definition are unpredictable. Yet over
the next 13 years, there will likely be some such shocks
among the world’s poorest countries, even if it is im-
possible to say in which country and which year. De-
pending on their gravity, such shocks could lead to
higher poverty rates than our projections suggest.
The third caveat relates to our assumption of distri-
butionally equal income growth in the future, a sim-
plification we adopt in the absence of any rigorous
methodology for predicting future changes in income
distribution. This assumption may lead us to under-
estimate future progress against poverty, given the
World Bank’s recent finding that, from 2008 to 2013,
income growth for the bottom 40 percent of the popu-
lation exceeded that for the richest 60 percent in 49
out of 83 countries.7 However, this relationship was
weakest in sub-Saharan Africa, the region home to the
majority of SOTCs. While the extent to which the poor
share in overall income gains will shape future poverty
trends, modeling such trajectories is beyond the scope
of this project.
To identify SOTCs, we focus on countries with pro-
jected 2030 poverty headcount ratios above 20 per-
cent, based on the international poverty line of $1.90/
day in PPP terms. While setting such a threshold is
inherently subjective, we believe this is a reasonable
baseline. This threshold is approximately twice today’s
global poverty rate. We are thus suggesting that, by the
end of the SDG period, those countries whose poverty
rates are still more than twice as high as the global rate
at the outset of the SDG period are severely off track.
The threshold is very conservative, as it excludes many
countries that will bring their poverty headcount ra-
tios under 20 percent while still falling short of ending
poverty by 2030. Yet it draws attention to the coun-
tries that, based on a business-as-usual scenario, will
not even come close to ending poverty. In other words,
these countries must substantially shift their poverty
trajectories.
Identifying SOTCs
Figure 1 shows a world map identifying all 31 SOTCs,
with 25 in sub-Saharan Africa and the remainder in the
Middle East and Asia. Today, the poverty headcount
ratio among the SOTCs averages 47 percent.
Figure 2 compares the 2000-2030 poverty trajecto-
ries of the 31 SOTCs to those of 108 other low- and
middle-income countries. Almost all SOTCs have had
high poverty rates for a long time. Notably, all but six
of these countries had poverty headcount ratios above
40 percent in 2000: unsurprisingly, one correlate of
future poverty is a history of high poverty. Yet equally,
it is worth stressing that dramatic success in reducing
poverty is possible—not all countries that had high
poverty in 2000 remain extremely poor today. Indeed,
countries such as India, Indonesia and Ethiopia all
had extreme poverty rates close to 40 percent in 2000,
and our estimates suggest all three will have effectively
eliminated poverty by 2030.
6 For an overview of these issues, see Laurence Chandy, “Counting the Poor,” Brookings Institution, 2013.7 World Bank, “Poverty and Shared Prosperity 2016: Taking on Inequality,” 2016.

L E A V E N O C O U N T R Y B E H I N D : E N D I N G P O V E R T Y I N T H E T O U G H E S T P L A C E S 5
Figure 1. Severely Off Track Countries
▪ Severely Off Track CountriesSource: Authors’ Calculations
Figure 2. Poverty Trajectories, 2000-2030
100
80
60
40
20
0 2000 2010 2020 2030
Year
____ Severely off track countries ____ Other developing countries
Pove
rty
Hea
dcou
nt ($
1.90
/day
, 201
1 PP
P)
Source: Authors’ Calculations
6 G L O B A L E C O N O M Y A N D D E V E L O P M E N T P R O G R A M
A second key finding that emerges from Figure 2 is
that there is not necessarily any clear trend of falling
poverty in SOTCs, even over extended periods. Of the
31 countries, we estimate 12 have higher poverty rates
today than they did a decade ago; seven have higher
poverty rates today than they did in 2000. Two SOTCs,
Yemen and Zimbabwe, had poverty rates below 15
percent in 2000; each has suffered in major but un-
predictable ways. Looking forward, on current trajec-
tories, nine of the 31 SOTCs will have higher poverty
rates in 2030 than they do today, as population growth
outpaces modest (or even negative) income growth.
The heart of the development challenge
During the MDG era, poverty was concentrated in
countries where the poverty rate was declining quickly.
In 2000, the ten countries with the largest number
of poor people—collectively accounting for over three
quarters of global poverty—were China, India, Nigeria,
Indonesia, Democratic Republic of the Congo, Bangla-
desh, Myanmar, Pakistan, Tanzania, and Ethiopia (in
descending order based on absolute numbers of poor
people). We estimate that between 2000 and 2015,
seven of these ten countries cut their poverty head-
count ratios by at least 70 percent. The success of these
countries drove aggregate progress against global pov-
erty.
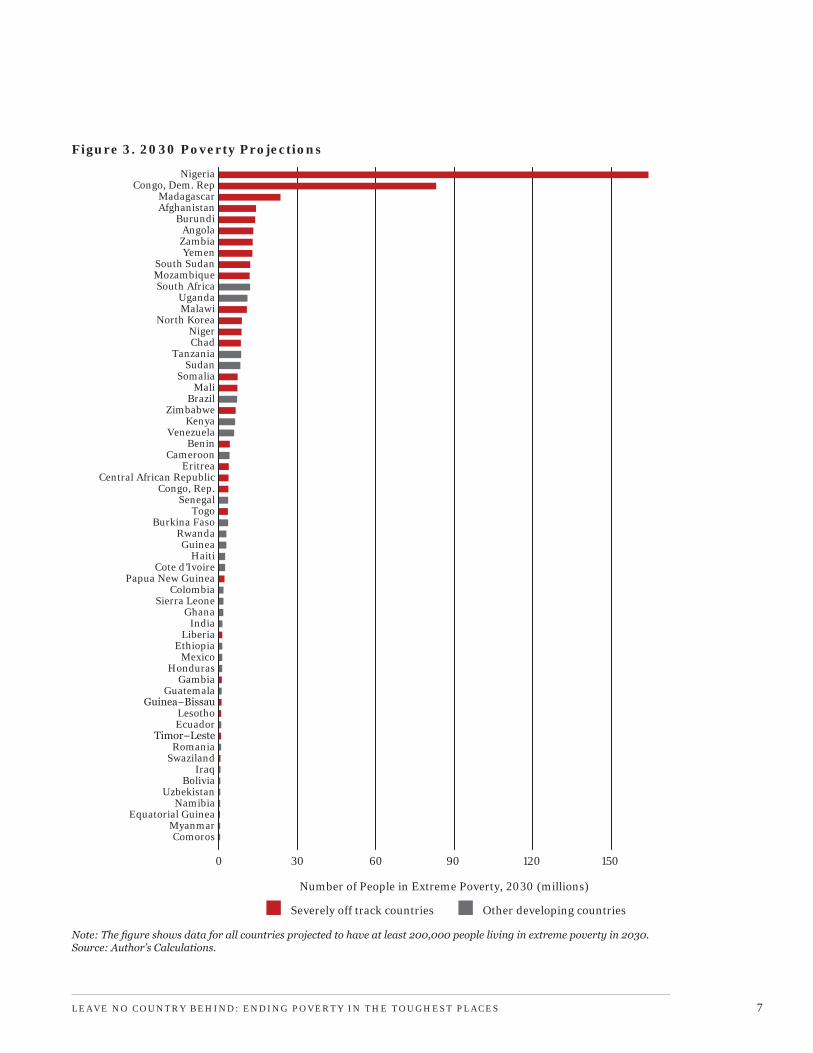
During the SDG era, by contrast, poverty will increas-
ingly be concentrated in a set of countries without es-
tablished track records in fighting poverty. We estimate
that by 2030, 82 percent of all people living in absolute
poverty will be in the 31 SOTCs. The ten countries with
the largest poor populations are all among these coun-
tries (see Figure 3). Thus, the nature of the poverty
challenge will be fundamentally different in the com-
ing years. Unless SOTCs substantially shift their pov-
erty trajectories, the rate of global poverty reduction is
likely to slow considerably, as poverty is concentrated
in lagging economies rather than in rapidly expanding
economies.
This is why SOTCs are at the heart of the development
challenge in the years ahead. Diagnosing their core
vulnerabilities and identifying successful strategies for
fighting poverty in these locations should be a top pri-
ority for the international development community.
L E A V E N O C O U N T R Y B E H I N D : E N D I N G P O V E R T Y I N T H E T O U G H E S T P L A C E S 7
Figure 3. 2030 Poverty Projections
Number of People in Extreme Poverty, 2030 (millions)▪ Severely off track countries ▪ Other developing countries
NigeriaCongo, Dem. Rep
MadagascarAfghanistan
BurundiAngola
ZambiaYemen
South SudanMozambiqueSouth Africa
UgandaMalawi
North KoreaNigerChad
TanzaniaSudan
SomaliaMali
BrazilZimbabwe
KenyaVenezuela
BeninCameroon
EritreaCentral African Republic
Congo, Rep.Senegal
TogoBurkina Faso
RwandaGuinea
HaitiCote d’Ivoire
Papua New GuineaColombia
Sierra LeoneGhana
IndiaLiberia
EthiopiaMexico
HondurasGambia
GuatemalaGuinea−Bissau
LesothoEcuador
Timor−LesteRomania
SwazilandIraq
BoliviaUzbekistan
NamibiaEquatorial Guinea
MyanmarComoros
0 30 60 90 120 150
Note: The figure shows data for all countries projected to have at least 200,000 people living in extreme poverty in 2030.Source: Author’s Calculations.

8 G L O B A L E C O N O M Y A N D D E V E L O P M E N T P R O G R A M
OBSTACLES TO DEVELOPMENT IN SOTCs
This section identifies some of the core vulnerabili-
ties and challenges common to SOTCs.
One starting point is the fact that the majority of
SOTCs frequently appear on lists of fragile states. Table
1 shows that, of the 31 countries, 24 are on either one
or both of the World Bank’s Fragile States list and the
Fund for Peace’s Fragile States Index.
Yet in and of itself, understanding that many of these
countries are fragile states tells us little about their
underlying challenges and vulnerabilities. Indeed, the
term “fragile state” itself encapsulates many differ-
ent concepts (and means different things to different
people).8
For this reason, it is more helpful to look at various
underlying obstacles to development that contribute
to persistent poverty in SOTCs. Here we focus on four
such obstacles: low government effectiveness, weak
private sectors, conflict and violence, and risk of natu-
ral disasters.
As an initial diagnostic, we assess how the 31 SOTCs
fare compared to other developing countries on each
obstacle. We rely on quantitative indices to measure
the severity of each obstacle: the Economist Intelli-
gence Unit’s government effectiveness measure,9 the
World Bank’s Doing Business Indicators,10 the Small
Arms Survey’s data on violent deaths,11 and INFORM’s
risk of natural disasters index.12 We consider an ob-
stacle to be a priority development challenge in a given
country if it ranks in the bottom third of all low- and
middle-income countries on the respective index.
Figure 4 maps the overlap of these obstacles across
the 31 SOTCs. The figure reveals significant variation
among the countries, underlining the importance of
looking beyond headline measures of fragility.
Two countries—Afghanistan and Somalia—have sig-
nificant vulnerabilities across all four obstacles, while
three—Malawi, Niger, and Zambia—are not vulnerable
in any of the four. Notably, 18 of the countries have
multi-dimensional obstacles, suggesting a need to
make progress on multiple fronts. For instance, of the
22 countries with a weak private sector, 15 also have
low government effectiveness; of those 15, seven also
have high levels of conflict and violence.
The remainder of this section examines each of these
four obstacles in detail.
Low government effectiveness
Sixteen of the SOTCs have low government effective-
ness. While this is a term with many different meanings,
we define it as the government’s ability to administer
and enforce rules and deliver services. We are primar-
ily interested in the ability of the executive and bu-
reaucracy to implement its chosen policy preferences,
8 See related discussion in OECD, “States of Fragility 2016: Understanding Violence,” 2016.9 This is an average of the EIU’s “Quality of bureaucracy / institutional effectiveness” and “Excessive bureaucracy / red tape”
measures, sourced from the World Governance Indicators. Data available at http://info.worldbank.org/governance/wgi/index.aspx#doc-sources.
10 Data available at http://www.doingbusiness.org/.11 This combines data on intentional homicides and deaths in conflict; data are 2010-2015 averages. Data available at http://
www.smallarmssurvey.org/tools/interactive-map-charts-on-armed-violence.html.12 Data available at http://www.inform-index.org/.

L E A V E N O C O U N T R Y B E H I N D : E N D I N G P O V E R T Y I N T H E T O U G H E S T P L A C E S 9
Table 1. The Overlap between SOTCs and Fragile States
Country World Bank List Fragile States Index
Afghanistan
Angola
Benin
Burundi
Central African Republic
Chad
Congo, Dem. Rep.
Congo, Rep.
Equatorial Guinea
Eritrea
Gambia, The
Guinea-Bissau
Korea, Dem. People’s Rep.
Lesotho
Liberia
Madagascar
Malawi
Mali
Mozambique
Niger
Nigeria
Papua New Guinea
Solomon Islands
Somalia
South Sudan
Swaziland
Timor-Leste
Togo
Yemen, Rep.
Zambia
X
X
X
X
X
X
X
X
X
X
X
X
X
X
X
X
X
X
X
X
X
X
X
X
X
X
X
X
X
X
X
X
X
X
X
X
Zimbabwe X X
Note: For Fragile States Index, includes all countries classified as ‘Alert’ (index score above 90).Source: Authors’ calculations based on World Bank, Fund for Peace data.

1 0 G L O B A L E C O N O M Y A N D D E V E L O P M E N T P R O G R A M
Figure 4. Overlapping Obstacles to Development in SOTCs
SolomonIslands*
MozambiquePNG
AfghanistanSomalia
Madagascar
LesothoMali
Swaziland
Congo
AngolaBeninBerundiEritreaNorth Korea+
MalawiNigerZambia
CARDRC
NigeriaS. Sudan*
Yemen
ChadTogoGambia
LiberiaEq. GuineaTimor-LesteZimbabwe
Guinea Bissau*
▪Low government effectiveness▪Weak private sector▪Conflict and violence▪Natural disaster risk
Notes: See text for explanation of country placement. * Government Effectiveness score unavailable in the EIU dataset; scores instead based on Worldwide Governance Indicators. + Doing Business Indicators score unavailable; estimated position.Source: Authors’ Calculations.
rather than “thicker” definitions of good governance
that include aspects such as democratic accountability,
transparency, and voice. Countries with high govern-
ment effectiveness are able to implement complex poli-
cies at scale, on time, and at reasonable cost; countries
with low government effectiveness are not.
Low government effectiveness takes many forms,
manifesting in the day-to-day operations of basic gov-
ernment service delivery, including health care, educa-
tion, and utilities. It occurs when government offices
are incapable of delivering in practice what in principle
they have agreed to do. Inefficient bureaucracies tend
to face absenteeism and corruption, and incentives to
encourage the rational, impartial execution of policy
are absent.
Measuring government effectiveness can be tricky and
subject to bias. If a country is performing poorly, it is
all too easy to believe that its government is ineffective.
For this reason, indicators of government effectiveness
based on expert surveys and judgments cannot clearly
determine a causal link from government effectiveness
to development progress. One recent study gets around
this empirical problem by providing a direct measure
of government effectiveness for 159 countries around

L E A V E N O C O U N T R Y B E H I N D : E N D I N G P O V E R T Y I N T H E T O U G H E S T P L A C E S 1 1
the world that is independent of expert views. There is
an international consensus among postal systems that
undeliverable mail should be returned to the sender’s
address. To test government bureaucracies’ ability to
implement this policy, Chong et al (2014) mailed ten
deliberately misaddressed letters to every country,
and tracked whether and how long it took for national
postal authorities to send the letters back to a return
address in the United States.13 The results showed
substantial variation in postal systems’ ability to ex-
ecute this basic function. Several countries—includ-
ing rich countries such as Finland, New Zealand, and
Canada, but also developing countries such as El Sal-
vador, Uruguay, and Morocco—returned all the letters,
while others did not return even one. Notably, SOTCs
were significantly less likely to return the letters than
other low- and middle-income countries; across the 24
13 Alberto Chong, Rafael La Porta, Florencio Lopez-de-Silanes, and Andrei Shleifer, “Letter Grading Government Efficiency.” Journal of the European Economic Association 12, no. 2: 277–299, 2014.
Figure 5. What Share of Letters Did the National Postal Authority Properly Return to Sender?
Note: Difference in means for letters returned within 90 days is statistically significant at the 1 percent level; difference in means for letters ever returned is significant at the 5 percent level.Source: Authors’ Calculations based on Chong et al (2014) data.
60
50
40
30
20
10
0
Perc
enta
ge o
f let
ters
ret
urne
d
▪ Severely off track countries ▪ Other developing countries
Returned within 90 days Ever returned
SOTCs included in the study, on average only 7.5 per-
cent of the letters were returned within 90 days (see
Figure 5), compared to 29 percent in the other 86 low-
and middle-income countries under study.
Of course, it is difficult to know if the low effectiveness
of SOTCs’ postal systems is indicative of their effective-
ness in other areas of public administration. Variation
occurs both across different ministries within coun-
tries and across geographic areas; for instance, there
may be effectively administered cities even within
countries with overall low government effectiveness.
Yet in general, this objective indicator of government
effectiveness broadly aligns with the expert survey in-
dicators more commonly used to measure government
effectiveness.

1 2 G L O B A L E C O N O M Y A N D D E V E L O P M E N T P R O G R A M
Improving government effectiveness
Given that low government effectiveness is a core vul-
nerability in many SOTCs, what do we know about how
to improve it? Useful research is ongoing, yet much of
the emerging literature suggests we should modulate
our expectations about what development interven-
tions can achieve in this area. To begin with, history
shows that developing government capabilities is an
extremely long and slow process; indeed, for most de-
veloping countries, there is little evidence of any prog-
ress in improving government effectiveness.14 Thus,
any development actors aiming to improve govern-
ment effectiveness should prepare for a decades-long
endeavor.
Additionally, no clear template or policy prescription
exists for how to improve government effectiveness.
Historically, interventions to promote capacity devel-
opment typically take the form of trainings, conceived
as the transfer of technical skills. Matt Andrews, Lant
Pritchett, and Michael Woolcock describe this as a
problem of “isomorphic mimicry”: the practice of at-
tempting to replicate the form of effective govern-
ment institutions in developed Western states, rather
than focusing on achieving functioning institutions.15
Instead of mimicking Western institutions, countries
with low government capacity need to experiment,
adapt, and iterate to build their own institutional capa-
bilities fitted to their own contexts. There are no short
cuts or quick fixes to this problem.
This experimental approach to building government
effectiveness succeeds most often when carried out at
the local level. Community-driven development (CDD)
practices seek to empower local actors to identify their
own priorities and design their own solutions to these
challenges, putting resources under the direct control
of local communities. This flexible method capital-
izes on local knowledge and citizen participation to
improve accountability. When national governments
integrate CDD programs into a cohesive national strat-
egy, they can often deliver basic services at scale more
effectively than centralized government bureaucracies
can. For instance, in Afghanistan, the National Solidar-
ity Program worked through 35,000 community-elect-
ed Community Development Councils in 34 provinces
to implement 88,000 community-level infrastructure
programs.16 Though overall government capacity in
Afghanistan remains low, the National Solidarity Pro-
gram demonstrated that local communities can deliver
effective services, even in very difficult conditions.
Working around or working through governments?
Given modest expectations for improving government
effectiveness in the short and medium term, aid agen-
cies working in these countries face a dilemma: is it
better to rely on ineffective governments to implement
projects or to administer projects by working around
the government? The latter option may be more like-
ly to achieve satisfactory project outcomes, at least
judged by the relatively narrow and technical defini-
tions of success used in project evaluation. For urgent
projects to meet basic human needs—including most
notably humanitarian assistance—this may be the best
approach.
14 Matt Andrews, Lant Pritchett and Michael Woolcock, Building State Capacity: Evidence, Analysis, Action, Oxford Univer-sity Press, 2017, p14-24.
15 Ibid, p 29-52. 16 See World Bank, “Community Driven Development: Results,” available at
http://www.worldbank.org/en/topic/communitydrivendevelopment.

L E A V E N O C O U N T R Y B E H I N D : E N D I N G P O V E R T Y I N T H E T O U G H E S T P L A C E S 1 3
Yet in the end, working around ineffective governments
will hinder the state’s own capacity to deliver services
to the population. It is only through implementing pol-
icies that the public sector will develop greater capac-
ity; the more governments experiment and learn, the
quicker they will improve.
Weak private sector
Twenty-two of the SOTCs have weak private sectors.
The private sector is the primary engine of economic
expansion, and ultimately, sustainable private sector
growth will be necessary to achieve widespread and
lasting poverty reduction. While there are often po-
tentially profitable opportunities for the private sector
even in very poor countries—in sectors including but
not limited to natural resources—a series of market
and government failures may make it difficult for these
opportunities to be realized.
What obstacles do businesses face in SOTCs?
To assess constraints to private sector growth, Figure
6 compares firms’ self-reported constraints to do-
ing business in SOTCs relative to all other developing
countries, using data from the World Bank’s Enter-
prise Surveys.
Three obstacles are particularly important in SOTCs:
political instability, electricity, and corruption. Foreign
businesses operating in SOTCs rank these as the top
three obstacles, while domestic businesses rank them
between second and fourth. (Access to finance is the
Figure 6. What is the Biggest Obstacle to Doing Business?
0 2 4 6 8 10 12 14 16 18 0 2 4 6 8 10 12 14 16 18
Access to finance
Policital instability
Electricity
Corruption
Practices of the informal sector
Tax rates
Access to land
Crime, theft and disorder
Tax administration
Transportation
Customs and trade regulations
Busines licensing and permits
Inadequately educated workforce
Labor regulations
Courts
Policital instability
Electricity
Corruption
Practices of the informal sector
Access to finance
Tax rates
Customs and trade regulations
Tax administration
Crime, theft and disorder
Access to land
Inadequately educated workforce
Transportation
Busines licensing and permits
Labor regulations
Courts
Domestic Enterprises Foreign-owned Enterprises
▪ Severely off track countries ▪ Other developing countries
Note: Y-Axis measures percentage of firms identifying given constraint as most important obstacle to doing business.Source: Authors’ Calculations based on World Bank Enterprise Surveys data.

1 4 G L O B A L E C O N O M Y A N D D E V E L O P M E N T P R O G R A M
17 For more on this issue, see Carol Newman, John Page, John Rand, Abebe Shimeles, Måns Söderbom, and Finn Tarp, “Why Industry Matters for Africa,” in Newman et al, Made in Africa: Learning to Compete in Industry, Brookings Institution Press, 2016.
18 Based on data from Food and Agricultural Organization’s FAOStat.
top obstacle of domestic businesses, in both SOTCs and
other developing countries.) Across all businesses, 16.7
percent cite political instability as their top obstacle in
SOTCs, relative to just 9.8 percent in all other develop-
ing countries. These results underline the importance
of an effective and legitimate state as a foundation for
private sector growth.
It is also notable what challenges appear less impor-
tant in SOTCs: tax rates, inadequate workforces, and
labor regulations. This suggests that government at-
tempts to lure businesses by cutting taxes or weaken-
ing labor regulations are unlikely to significantly spur
greater investment in these contexts. Similarly, devel-
opment interventions focused on worker training may
not address the binding constraints to private sector
growth; well-educated and trained workers will still
not be productive if their employers face a litany of
other obstacles, and interventions may end up training
workers for jobs that do not exist.
Managing formal and informal sectors
One particular challenge in many SOTCs is a large in-
formal sector. Informal enterprises are not incorpo-
rated or registered with the government; often do not
pay (at least some) taxes, may not abide by labor or
environmental regulations, and lack access to some
public services. They operate largely beyond the reach
and observation of the state. Informal sector employ-
ees have highly precarious jobs and lack social security
coverage and workplace protections. Most important-
ly, informal firms do not innovate or grow fast, nor do
they invest in the human capital of their workers. This
makes it all but impossible for countries with large in-
formal sectors to transform into higher value-added,
higher productivity economies.17
The persistence of large informal sectors is evidence of
the breakdown in the social contract between govern-
ments and business. That contract broadly states that
firms agree to be regulated and taxed by the state, in re-
turn for which the state provides various benefits (such
as infrastructure and stable regulatory frameworks)
and protections (from expropriation by the state or
predatory practices and contract breaches by private
parties) to businesses. When governments are unable
to provide these benefits and protections, firms see lit-
tle benefit to formalizing. Yet without greater formal-
ization of the private sector, governments are unable
to build up the resources and capabilities necessary to
provide the benefits and protections in the first place.
Firms and governments are thus stuck in a bad equi-
librium, forgoing a relationship that could be mutually
beneficial and is imperative for successful long-run de-
velopment.
In most SOTCs, agriculture continues to make up a
substantial share of both economic output and employ-
ment. Many of the same challenges that urban informal
workers and firms face also hold back small family-run
farms and rural enterprises. These challenges include
a lack of access to capital, low savings rates, and mini-
mal progress in innovation and productivity. Indeed,
agricultural productivity tends to be particularly low in
SOTCs: of the 29 SOTCs with available data, 25 have
cereal yields below 2 tons per hectare.18 If SOTCs are
able to increase agricultural productivity, this could
help spur economic activity in adjacent industries,
such as food processing and trade.

L E A V E N O C O U N T R Y B E H I N D : E N D I N G P O V E R T Y I N T H E T O U G H E S T P L A C E S 1 5
In countries with large informal sectors, there are
two—at times competing—policy objectives for im-
proving the private sector: encourage informal firms
to formalize, and alleviate obstacles to firm growth
and entrepreneurship within both formal and infor-
mal sectors. For the first objective, recent research
suggests that interventions designed to encourage
formalization are rarely successful (and often come
at high cost).19 In general, informal firms very rarely
formalize.20 Although average productivity levels are
much higher in the formal sector than the informal, it
is unclear whether formalizing has a significant causal
effect on firm performance.21 While there are social/
public benefits to firm formalization—both from higher
taxes received by the government, and more generally
by bringing more economic activity under the scope of
government regulation—for most informal firms the
costs of formalization appear to outweigh the private
benefits.
The question thus remains regarding what, if anything,
governments and other actors can do to create more
jobs, boost productivity, increase wages, and improve
working conditions in the informal sector. Limited ac-
cess to finance is one of the most important business
obstacles for many informal firms, and new technolo-
gies in mobile banking could help alleviate this con-
straint.22 Similarly, cash transfer programs may pro-
vide the necessary start-up capital to allow informal
firms to invest in productive assets. Finally, it is also
important to remember that, while unregulated, infor-
mal markets are nonetheless subject to existing social
and political norms and institutions. Interventions to
make these institutions more inclusive and effective—
such as by decreasing crime and improving gender eq-
uity—will benefit informal firms.
How to catalyze foreign investment
Many SOTCs have relatively low domestic savings
rates, and thus outside sources of capital may be nec-
essary to finance new investments. One such source of
capital is foreign direct investment (FDI) from multi-
national corporations. FDI can create jobs and gener-
ate tax revenue, and create positive spillovers for local
domestic firms. Figure 7 shows that FDI inflows as a
share of GDP are substantial in several SOTCs, par-
ticularly in Liberia, Mozambique, and Congo. At the
same time, many other SOTCs receive little to no FDI,
including Afghanistan, Swaziland, South Sudan, and
Yemen.
One key constraint to FDI in SOTCs is political risk,
particularly in countries with unstable governments
just recovering from conflict (where the threat of a re-
lapse into conflict is high). To catalyze FDI into risky
areas, both host governments and international de-
velopment agencies are introducing new mechanisms
to de-risk investments. For example, the World Bank
recently launched its new Private Sector Window
(PSW) for low-income countries, a joint initiative of
the International Development Association (IDA), the
19 Najy Benhassine, David McKenzie, Victor Pouliquen, and Massimiliano Santini. “Can Enhancing the Benefits of Formaliza-tion Induce Informal Firms to Become Formal? Experimental Evidence from Benin.” World Bank Policy Research Working Paper 7900, November 2016.
20 Rafael La Porta and Andrei Shleifer. “Informality and Development.” Journal of Economic Perspectives 28, no. 3 (2014), pp 109-126.
21 See Rafael La Porta and Andrei Shleifer. “The Unofficial Economy in Africa.” NBER Working Paper No. 16821, 2011; and Benhassine et al (2016).
22 Peer Stein, Oya Pinar Ardic, and Martin Hommes. “Closing the Credit Gap for Formal and Informal MSMEs.” IFC Advisory Services Report, 2013.

1 6 G L O B A L E C O N O M Y A N D D E V E L O P M E N T P R O G R A M
23 Caroline T. Witte, Martijn J. Burger, Elena I. Ianchovichina, and Enrico Pennings. “Dodging Bullets: The Heterogeneous Ef-fect of Political Violence on Greenfield FDI.” World Bank Policy Research Working Paper 7914, December 2016.
Figure 7. Some SOTCs attract lots of FDI, others very little
Afg
hani
stan
Ang
ola
Ben
in
Bur
undi
Cen
tral
Afr
ican
Rep
ublic
Cha
d
Con
go, D
em. R
ep.
Con
go, R
ep.
Equ
ator
ial G
uine
a
Gam
bia,
The
Gui
nea-
Bis
sau
Leso
tho
Libe
ria
Mad
agas
car
Mal
awi
Mal
i
Moz
ambi
que
Nig
er
Nig
eria
Papu
a N
ew G
uine
a
Solo
mon
Isl
ands
Som
alia
Sout
h Su
dan
Swaz
iland
Tim
or-L
este
Togo
Yem
en, R
ep.
Zam
bia
Zim
babw
e
Dev
elop
ing
Cou
ntry
Ave
rage
35
30
25
20
15
10
5
0
Net
FD
I In
flow
s, %
of G
DP
(201
2-16
ave
rage
)
Source: Authors’ Calculations based on World Bank World Development Indicators.
International Finance Corporation (IFC), and the Mul-
tilateral Investment Guarantee Agency (MIGA). The
PSW offers guarantees and blended financing that
mitigate some of the risks and uncertainties hindering
private investment in low-income countries. While it
remains to be seen how successful this program will be,
the PSW’s creation underlines the new appreciation for
the contribution private investment can make to sus-
tainable development.
The natural resource sector has consistently attracted
FDI despite high levels of political risk. Investor sur-
veys reveal that multinational firms in extractive in-
dustries tend to be less sensitive to political risk, as they
base their locational decisions more on the availability
of reserves than governance quality.23 FDI in natural
resources typically generates fewer jobs and economic
linkages than investment in manufacturing and ser-
vices, thus its direct contributions to development are
limited. Yet the taxes and royalty payments received by
governments from foreign natural resource companies
can be a crucial revenue source used to finance public
investments, service delivery, or even cash transfers di-
rectly to the public.
To maximize the benefits countries receive for their
natural resources, governments need to negotiate con-
tracts and licensing agreements favorable to the state.

L E A V E N O C O U N T R Y B E H I N D : E N D I N G P O V E R T Y I N T H E T O U G H E S T P L A C E S 1 7
This demands a high level of legal and regulatory ex-
pertise often lacking in countries with low government
effectiveness. Indeed, according to the Natural Re-
source Governance Index, which rates the regulatory
environment in jurisdictions with natural resources,
SOTCs have significantly worse natural resource regu-
latory frameworks than other low- and middle-income
countries (See Figure 8).
Given legal and regulatory capacity constraints in
many countries, there is a case for subsidizing outside
legal advice and training for governments negotiating
with multinational natural resource companies. Initia-
tives such as the African Legal Support Facility, hosted
at the African Development Bank, help African gov-
ernments negotiate complex commercial transactions
with foreign investors. Given the stakes in such nego-
tiations for many SOTCs, donor agencies may want to
invest further in assisting governments in their rela-
tions with multinational companies.
Conflict and violence
Twelve SOTCs have high levels of conflict and violence.
This includes both countries experiencing civil wars
Figure 8. On average, resource governance is worse in SOTCs than in other developing countries
Note: Index scores reflect the quality of resource governance. Based on data for 19 SOTCs and 48 other low- and middle-income countries. Difference in means significant at the 5 percent level.Source: Authors’ Calculations based on NRGI (2017).
0 20 40 60 80 100
Natural Resource Government Index Score
Severely off track countries
Other developing countries
and violent political conflicts, as well as those with
high levels of homicides and other criminal violence.
(Moreover, in many instances, these forms of conflict
overlap and sustain each other, blurring any distinc-
tion between the two.) Organized violence often occurs
in repeated cycles and at times spills across borders,
disrupting development, destroying infrastructure,
and breaking down social trust. Given the human,
economic, and social toll of such violence, supporting
conflict prevention may be a sound investment, though
more research is needed on which strategies are most
likely to succeed.
Intra-state conflict
Following the end of the Cold War, inter-state conflict
declined sharply, and today is extremely rare. Intra-
state military conflicts, however, are on the rise. Intra-
state conflicts, or civil wars, are sustained political vio-
lence between an armed group representing the state
and one or more non-state actors. At present, nine of
the SOTCs have ongoing intra-state conflicts (defined
as those with at least 25 battle deaths per year): Af-
ghanistan, DRC, Mali, Mozambique, Nigeria, Niger,
Somalia, South Sudan, and Yemen. Several others—

1 8 G L O B A L E C O N O M Y A N D D E V E L O P M E N T P R O G R A M
24 Bruce Jones, “No Development Without Peace: Laying the Political and Security Foundations.” In Laurence Chandy, Hiroshi Kato, and Homi Kharas, editors, The Last Mile in Ending Extreme Poverty, Brookings Institution Press, 2015.
25 Ibid.26 World Bank, World Development Report 2011: Conflict, Security, and Development.
including Central African Republic, Eritrea, Solomon
Islands, and Timor-Leste—had serious conflicts in the
relatively recent past.
Achieving significant development progress amidst
ongoing large-scale conflicts is all but impossible. Dur-
ing conflicts, warfare takes over productive economic
activity. Damage from fighting destroys productive
assets and infrastructure. Large populations are often
displaced, either internally or as refugees. Destruction
occurs very quickly, and rebuilding is difficult; econo-
mies frequently contract sharply during conflicts, and
recover very slowly (and sometimes never fully). For
instance, during the 1998-2003 conflict in Solomon Is-
lands, annual per capita income dropped by 29 percent,
from $2,141 to $1,521. Over the course of the 2012-2014
civil war in Central African Republic (CAR), annual per
capita income fell by 36 percent, from $946 to $602.
Income in Rwanda collapsed by 49 percent in 1994,
from $942 to $492. Rwanda took a full decade to regain
its pre-conflict level of GDP per capita; and this is an
oft-cited example of a successful post-conflict recovery.
Countries seeking to overcome intra-state conflict face
two challenges: first, they need an immediate end to
hostilities, and second they need to sustain peace and
avoid conflict relapse. How do wars end? There are
three typical paths: either one side achieves a near
total victory, the two sides fight to the point of ex-
haustion before reaching a stalemate compromise,
or mediators—often with the backing of internation-
al diplomats—encourage a negotiated settlement.24
Whatever form conflict settlement takes, evidence sug-
gests that agreements underpinned by inclusive elite
pacts will be more stable and long lasting.25 Ensuring
all politically powerful and relevant actors have a stake
in the political settlements that emerge in the wake of
conflict reduces incentives for any viable rivals to chal-
lenge the legitimacy of a peace agreement.
Looking to the longer term, recent research identi-
fies three priorities to help countries escape cycles of
conflict: citizen security, justice, and jobs.26 Countries
that can build legitimate institutions to provide these
three foundational building blocks to peaceful societ-
ies are less likely to see relapses into conflict. Yet as
always, this institution building is slow and difficult,
often lasting a generation. During this precarious re-
covery period, external shocks—particularly conflict
and stresses from neighboring countries—can reignite
dormant conflicts.
Violence and crime
While civil wars and conflicts attract more headlines,
much of the worst violence in the world occurs in non-
conflict contexts. Indeed, far more deaths that are vio-
lent occur outside of conflict than in conflict each year,
and only a minority of the countries with the highest
rates of violent death are in active conflict. Like civil
conflict, high levels of violence and crime also impose
substantial development burdens on poor populations.
In addition to the lives lost, the direct costs of high
violence include spending on health care, police and
prison costs, as well as private spending on security,
which often serves as an additional tax on firms. Indi-
rect costs include lower investment in human capital
and labor force participation, if fears of violence and
crime keep people from school or work. Where the
threats of violence and crime fall disproportionately on
L E A V E N O C O U N T R Y B E H I N D : E N D I N G P O V E R T Y I N T H E T O U G H E S T P L A C E S 1 9
27 Matthew Schwartz, “Policing and (in)security in fragile and conflict-affected settings.” Global Center on Cooperative Security Working Paper, May 2015.
28 Peter Albrecht and Helene Maria Kyed, “Introduction: Non-state and Customary Actors in Development Programs.” In Peter Albrecht, Helene Maria Kyed, Deborah Isser, and Erica Harper, editors, Perspectives on Involving Non-State and Custom-ary Actors in Justice and Security Reform, International Development Law Organization, 2011.
29 For an example of the expectations of violence and unrest in the run-up to the election, see Aryn Baker, “Why Nigeria’s Elec-tions Could Trigger Renewed Violence,” Time, March 26, 2015.
girls and women, this exacerbates underlying gender
inequities. The prevalence of violence can deter both
foreign investors and tourists. Where high violence is
driven by large-scale transnational criminal activity—
such as drug cartels—these organized criminal net-
works can undermine effective governance and trust in
local institutions. In extreme cases, criminal networks
compete with the state in providing services and secu-
rity to local populations.
Effective and legitimate police and judicial services
are necessary for countering high levels of crime and
violence. Yet building up effective formal national po-
lice forces is difficult, particularly in divided and post-
conflict societies. In many places, the police are viewed
by local populations with suspicion and fear—more as
a threat of violence than an antidote to it. In countries
with weak governments, hybrid approaches to polic-
ing—which combine state and non-state actors, such
as community and tribal elders as well as unarmed lo-
cal informal policing groups—are prevalent.27 Interna-
tional interventions to promote security and justice are
often more effective when they build off these locally le-
gitimate institutions, reflecting a preference for expedi-
ent solutions that work for people on the ground, rather
than seeking to impose formal, state-run systems.28
Can we effectively prevent conflict?
As the sections above make clear, the development
costs of ongoing conflict are extreme. For this rea-
son, successful investments in conflict prevention can
provide the highest rate of return of any development
spending. In practice, however, successfully identify-
ing and intervening to prevent incipient conflicts from
escalating has proven difficult. In this decade alone,
the international community struggled to respond to
the Arab uprisings, conflict in the CAR and South Su-
dan, and the current refugee crisis in Myanmar.
There are, however, also several recent volatile politi-
cal clashes which could have deteriorated into violent
conflict but did not; occasionally efforts to avoid poten-
tial violence do succeed. Nigeria, for instance, navigat-
ed a highly contested election in 2015, amidst ongoing
conflict with Boko Haram and rising tension between
the north and south of the country. Ultimately the
challenger won the election and the country achieved
a peaceful, democratic transfer of power (though Boko
Haram remains a serious threat). While there were
several limited violent episodes related to the election,
the dire outcomes many international observers feared
did not materialize.29 While it is extremely difficult to
draw any clear causal conclusions from such “dogs that
didn’t bark,” it does appear that the international com-
munity’s work to prevent crisis escalation played at
least some part in this successful outcome. A full year
before Nigeria’s election was initially scheduled to take
place, the International Crisis Group—the leading in-
ternational NGO working on crisis prevention—began
prominently warning both local and international lead-
ers of the risks inherent in this election, and pushing
all sides to commit to peace. In the run-up to the elec-
tion both U.S. Secretary of State John Kerry and for-
mer U.N. Secretary-General Kofi Annan visited Nigeria

2 0 G L O B A L E C O N O M Y A N D D E V E L O P M E N T P R O G R A M
30 See International Crisis Group, “Against the Clock in Nigeria: Preventing election violence in Nigeria,” April 22, 2016. 31 International Crisis Group, “Seizing the Moment: From Early Warning to Early Action,” Special Report No. 2, June 2016.
to encourage a peaceful election; Annan oversaw the
signing of the “Abuja Accord” between the presidential
candidates, pledging them to prevent political violence
before, during, and after the elections. Ultimately,
these efforts to build strong domestic and international
constituencies committed to a peaceful election appear
to have helped convince the defeated incumbent to
concede the result.30
What does Nigeria’s experience tell us about what
works in conflict prevention? First, deep political anal-
ysis and research is crucial for early warning systems;
while quantitative risk assessments are useful, in-
depth, context-specific political, social, and economic
knowledge are a vital complement. Second, where risks
are present, inclusive, high-level political dialogue and
diplomacy can be effective. By engaging with a broad
spectrum of political elites as well as civil society and
marginalized groups, early-warning interventions can
help build consensus around preserving peace.31 Third,
international efforts to prevent conflict will likely be
most successful when the international community
presents a united front. In the Nigerian case, the U.S.,
EU, and African Union all clearly expressed their in-
terest in a peaceful election, and no outside power had
strong incentives to see any particular leader stay in
power. Conversely, geopolitical rivalries are likely to
make conflict prevention far more difficult in the Mid-
dle East, Eastern Europe and the South China Sea.
Ultimately, it remains difficult to predict conflict, and
even when early warning signs detect it, the interna-
tional community has not always been willing or able
to act. Yet even if the odds of success is slim, given the
stakes, increased investment in conflict prevention is
likely a sound proposal.
Natural hazards and environmental risks
Six SOTCs face significant natural hazards and envi-
ronmental risks. Natural disasters can compound ex-
isting development challenges, and set back progress
for decades. Disasters result in lost lives, damaged
homes and infrastructure, closed businesses, and chil-
dren out of school. Those living in poverty are often
most vulnerable to natural disasters; they are more
likely to live in risky areas such as alongside rivers and
floodplains, and are excluded from social services, in-
frastructure, and political processes that could mitigate
or help them adapt to hazards. Urbanization—particu-
larly the growth of unplanned slums—is concentrat-
ing populations in smaller areas, increasing the risk of
high-impact natural disasters.
Since 2000, the 31 SOTCs have experienced over 400
natural disasters, including droughts, earthquakes,
floods, landslides, and wildfires (see Table 2). Collec-
tively, these disasters affected over 175 million people;
droughts and floods account for the vast majority of
this impact.
Moreover, looking forward, the incidence of natural
disasters is likely to increase. Climate change is expect-
ed to cause more extreme weather events, and many
SOTCs are among those likely to be hardest hit. This is
particularly the case for small island countries (Solo-
mon Islands, Papua New Guinea) and for sub-Saharan
African countries already in arid and drought-prone
areas.
Countries with high risks of natural hazards face a dual
challenge. First, they must act now to increase resilience

L E A V E N O C O U N T R Y B E H I N D : E N D I N G P O V E R T Y I N T H E T O U G H E S T P L A C E S 2 1
Table 2. Natural Disasters in SOTCs Since 2000
Number of Events People Impacted
Droughts
Earthquakes
Floods
Landslides
Wildfires
Total
81
27
272
25
7
412
140,189,268
237,543
34,710,887
329,059
58,503
175,525,260
before disasters hit so they are better prepared for the
next shock. Second, they need to improve their human-
itarian response practices and policies to minimize suf-
fering in the aftermath of events. These two priorities
are interlinked: investments in resilience will make
post-disaster response easier and more cost effective.
Building resilience
Countries facing the greatest threat of natural disasters
are not necessarily the same as those facing the great-
est natural hazards. Natural hazards are determined
by geological, physical forces; natural disasters, on the
other hand, occur when natural catastrophe strikes in
countries lacking the preparation and resilience to re-
cover.32 Notably, there are several countries with very
high risks of natural hazard—such as Japan—that nev-
ertheless experience far less loss of life and destruction
of infrastructure from natural disasters than countries
with lower natural hazards. Strong governance and
investments in prevention allow countries like Japan
to avoid severe disasters, despite their high underlying
risk of natural hazards.
In 2005, the members of the U.N. adopted the Hyogo
Framework for Action (HFA), a 10-year agreement to
strengthen disaster preparedness. The HFA identified
five key actions for improving disaster preparedness:
ensure that disaster risk reduction is a national and lo-
cal priority; improve risk assessment and early warn-
ing systems; increase education, information and pub-
lic awareness about disasters; reduce underlying risk
factors; and strengthen preparedness for response.
While data are limited, national progress reports on
implementation of the HFA suggest SOTCs are falling
behind. In the most complete reporting cycle, using
2009-2011 data, six SOTCs—Afghanistan, Malawi, Mo-
zambique, Niger, Papua New Guinea, and Yemen—re-
ported on their progress toward the HFA indicators and
targets. Of these six, only Mozambique received scores
above the average for all other low and middle-income
countries (see Figure 9). Among all 101 countries with
available data, Afghanistan, Papua New Guinea, and
Yemen, were all in the bottom 10. The HFA has since
been succeeded by the Sendai Framework for Disaster
Risk Reduction, which sets international priorities and
targets for the 2015-2030 period; the HFA experience
suggests SOTCs will have significant work to do to real-
ize the Sendai Framework vision.
32 World Bank, Natural Hazards, UnNatural Disasters: The Economics of Effective Prevention, 2010.
Source: Authors’ calculations based on the Emergency Events Database (EM-DAT).

2 2 G L O B A L E C O N O M Y A N D D E V E L O P M E N T P R O G R A M
One key area of disaster preparedness is investing in
resilient infrastructure systems, including roads, ports,
power, telecommunications, water, and sanitation.
Crucially, investments in resilience must not only ac-
count for existing risks but also expected changes in
the environment in the years and decades ahead. Cli-
mate-proofing infrastructure may add to upfront con-
struction costs, but ultimately incorporating climate-
proof concerns into initial design will be far cheaper
than ignoring resilience risks and later needing to ret-
rofit already built infrastructure.
Figure 9. Do SOTCs Meet International Targets for Disaster Preparedness?
Source: Authors’ Calculations based on data from the HFA National Progress Query Tool.
Ave
rage
Pro
gres
s In
dica
tor
Scor
e
5
4
3
2
1
0Priority 1:
Prioritization of Disaster Risk in
Policymaking
Priority 2: Creation of Early Warning Systems and Risk
Assessments
Priority 3: Public Disaster Education
& Awareness
Priority 4: Reduction of
Underlying Disaster Risks
Priority 5: Preparedness to
Respond to Disaster
▪ Afghanistan ▪ Malawi ▪ Mozambique ▪ Niger ▪ Papua New Guinea ▪ Yemen ▪ Other developing countries
A challenge for many SOTCs in providing resilient
infrastructure is ensuring ongoing maintenance and
repair. Countries with low government effectiveness
may struggle with upkeep of infrastructure networks;
governments facing budget pressures may opt to forgo
maintenance costs, as such spending cuts are not imme-
diately felt and may be less politically painful than other
austerity measures. Yet letting maintenance lapse can
severely undermine resilience over the long run, and
any cost savings on foregone repairs are minimal rela-
tive to potential losses. There is a risk that governments

L E A V E N O C O U N T R Y B E H I N D : E N D I N G P O V E R T Y I N T H E T O U G H E S T P L A C E S 2 3
33 See, for instance, Edward Tsui, Review of the Potential for Assessed Funding for the Central Emergency Response Fund (CERF), February 2015. Available at http://www.unocha.org/cerf/sites/default/files/CERF/Funding%20CERF%20through%20UN%20assessed%20contributions.pdf
34 David Speckhard, “World Humanitarian Summit: Laudable, but short on hard political commitments,” Brookings’ Future Development Blog, June 1 2016. Available at https://www.brookings.edu/blog/future-development/2016/06/01/world-humanitarian-summit-laudable-but-short-on-hard-political-commitments/
35 See “Doing Cash Differently: How cash transfers can transform humanitarian aid,” Report of the High Level Panel on Hu-manitarian Cash Transfers, Overseas Development Institute and Center for Global Development, September 2015.
and donors focus their attention primarily on new
projects and initiatives, and pay insufficient attention
to proper maintenance of existing infrastructure.
Improving humanitarian responses to disasters
Strong disaster preparedness can mitigate many of the
worst impacts of disasters. Yet even with effective pre-
paredness, disasters will still hit SOTCs, and how gov-
ernments and international donors respond to these di-
sasters can have both immediate and long term effects
on a country’s development trajectory. Current prac-
tices could be improved in several ways to ensure disas-
ters do not undermine SOTCs’ development prospects.
The rapid diffusion of accurate and up-to-date informa-
tion in the immediate aftermath of a disaster is crucial
for organizing and executing humanitarian responses.
SOTCs’ information strategies can be rapidly improved
in the aftermath of disasters via the use of new tech-
nology. For instance, mobile phone penetration is high
even in many very poor societies, improving the spread
of information to otherwise unconnected and hard-to-
reach places. Similarly, satellite data can provide rapid
updates on flooding and crops in areas that are difficult
to reach on the ground, speeding the distribution of re-
sources to areas where they are most needed.
Additionally, the current financing system for disaster
responses—centered around ad hoc, voluntary appeals
in the aftermath of disasters, where pledges of support
are often fulfilled only very slowly if at all—is woefully
inadequate. An alternative approach would involve as-
sessed contributions to a permanent financing facility,
which could more quickly disburse funds in the event
of disasters.33 Another option is extending the use of
insurance mechanisms so that households, commu-
nities, and sovereign governments could claim insur-
ance payouts following disasters. The InsuResilience
initiative, launched by the G-7 at their summit in El-
mau, Germany in 2015, aims to offer insurance against
climate risks to an additional 400 million poor and
vulnerable people in developing countries by 2020. In-
suResilience members have committed $550 million to
this program.
Beyond sources and mechanisms for financing disaster
recovery, a related question is what processes are most
effective for disbursing humanitarian funds. Recent re-
search suggests spending money through local, rather
than international, organizations maximizes develop-
ment effectiveness. Local organizations typically best
understand what is happening on the ground, and have
established networks and connections that allow them
to act more quickly. At the 2016 World Humanitarian
Summit, governments pledged to allocate at least 25
percent of humanitarian funding to local organiza-
tions by 2020, compared to a paltry 2 percent at pres-
ent.34 Similarly, a new consensus is emerging in favor
of spending a greater share of humanitarian aid in the
form of cash transfers, rather than delivering commod-
ities such as food, shelter, and water.35 Cash is often
the most efficient and transparent means of providing

2 4 G L O B A L E C O N O M Y A N D D E V E L O P M E N T P R O G R A M
36 World Bank, “Moving Away from Humanitarian Appeals to Managing Droughts in Ethiopia,” May 2, 2017. Available at http://www.worldbank.org/en/news/feature/2017/05/02/moving-away-from-humanitarian-appeals-to-managing-droughts-in-ethiopia.
support, giving affected populations greater choice and
control over their own recovery spending.
The ultimate challenge for SOTCs is how to integrate
disaster responses and humanitarian relief into longer-
term development strategies. For instance, in Ethiopia
the government has successfully developed a safety net
program targeted at communities living in drought-
affected areas, which has built in contingency plans to
scale up during drought periods, bringing new benefi-
ciaries into the program.36 The project simultaneously
helps populations adjust to shocks from natural disas-
ters while also investing in communities’ long-term
development. Greater integration and coordination
of development and humanitarian aid would better
reflect the on the ground realities and perspectives of
beneficiaries, who in practice often perceive little dif-
ference between humanitarian aid and other develop-
ment interventions.

L E A V E N O C O U N T R Y B E H I N D : E N D I N G P O V E R T Y I N T H E T O U G H E S T P L A C E S 2 5
37 The OECD defines CPA as: “the proportion of aid that is subjected to multi-year programming at country level, and hence represent a subset of ODA outflows. It takes as a starting point data on gross ODA disbursements by recipient but excludes spending which is: (1) inherently unpredictable (humanitarian aid and debt relief); or (2) entails no flows to the recipient country (administration costs, student costs, development awareness and research and refugee spending in donor countries); or (3) is usually not discussed between the main donor agency and recipient governments (food aid, aid from local govern-ments, core funding to NGOs, aid through secondary agencies, ODA equity investments and aid which is not allocable by country). (4) CPA does not net out loan repayments, as these are not usually factored into aid allocation decisions.”
38 All aid figures in this paragraph are in constant 2015$, and averages for the 2011-2015 period.39 Of course, there are often very legitimate reasons why donors may not want to engage with certain governments, and aid may
not be allowed in closed off regimes like North Korea.
ACTION PLANS FOR SOTCs
As the Venn diagram in Figure 4 revealed, many
SOTCs face multiple obstacles to development
and must progress on multiple fronts simultaneous-
ly; otherwise, they risk being trapped in cycles where
short-term success against one obstacle is offset by re-
lapses in another. For instance, even if a country sub-
stantially improves its investment climate, businesses
are not going to invest if they believe the threat of con-
flict is high. Similarly, a government may have a sound
strategy for responding to environmental emergencies
in principle, but it will be impossible to implement
such a plan without an effective government bureau-
cracy. Obstacles to development are often overlapping
and reinforcing.
Given the scale of the development challenges in most
SOTCs, thus, the only way to achieve persistent prog-
ress is through sustained partnerships between SOTC
governments and the international community. Na-
tional governments, of course, will remain the key
actors responsible for driving their country’s develop-
ment. Yet the international community can and should
play a significant supporting role in helping SOTCs get
on track to ending poverty.
To date, however, international support for SOTCs has
been modest. Country-programmable aid (CPA) to the
SOTCs increased only moderately over the last decade,
from $15.1 billion in 2007 to $20.8 billion in 2015 (the
latest year for which full data is available; see Figure
10).37 About half of this financing goes to just four coun-
tries—Afghanistan, Nigeria, Mozambique, and DRC (in
decreasing order of funds received). As a share of aid to
all countries, CPA to SOTCs has barely increased, from
22 percent in 2007 to 23 percent in 2015. In addition
to CPA, donors disbursed $3.5 billion in humanitarian
assistance in SOTCs in 2015, accounting for 33 percent
of global humanitarian assistance in that year.
This relative stability in CPA to SOTCs masks signifi-
cant variation both across and within countries. First,
there is huge variation across SOTCs in per capita aid
levels: some are “donor darlings,” swamped with aid
financing, while others are “donor orphans,” largely
neglected by the aid community. Figure 11 shows the
distribution of per capita aid levels in SOTCs, as well
as that for all other developing countries. The median
developing country receives $47 per capita in CPA.38
Fourteen SOTCs receive more than this median, includ-
ing Solomon Islands ($382), Timor-Leste ($175), Af-
ghanistan ($152), Liberia ($118), and Lesotho ($103).
Meanwhile, 17 SOTCs receive less than the median for
all developing countries, including Eritrea ($17), Equa-
torial Guinea ($14), Nigeria ($13), Angola ($12), and
North Korea ($2). Despite the fact that all SOTCs face
substantial development needs, the international aid
community engages with them quite differently.39

2 6 G L O B A L E C O N O M Y A N D D E V E L O P M E N T P R O G R A M
Figure 10. Country Programmable Aid to Severely Off Track Countries
Source: Authors’ Calculations based on OECD data.
2007 2008 2009 2010 2011 2012 2013 2014 2015
▪ Afghanistan ▪ Nigeria ▪ Mozambique ▪ DRC ▪ All other SOTCs
Con
stan
t 201
5$, b
illio
ns
25
20
15
10
5
0
Figure 11. Some SOTCs Receive Lots of Aid, Others Barely Any
Note: Each dot represents a country. Axis is in logarithmic scale.Source: Authors’ Calculations based on OECD data.
1 10 100 1000
CPA per capita, 2011-2015 Average (constant 2015 USD)
Severely off track countries Other developing countries

L E A V E N O C O U N T R Y B E H I N D : E N D I N G P O V E R T Y I N T H E T O U G H E S T P L A C E S 2 7
Figure 12. Aid to Off Track Countries is Very Volatile (select countries)
Source: Authors’ Calculations based on OECD data.
2007 2008 2009 2010 2011 2012 2013 2014 2015
300
250
200
150
100
50
▪ Central African Republic ▪ DRC ▪ Lesotho ▪ Malawi ▪ Yemen ▪ Zambia
CPA
Dis
burs
emen
ts (R
eal I
ndex
, 200
7=10
0)
Second, within individual countries, aid flows are often
highly volatile from one year to the next. Year-on-year
increases and decreases of 25 percent or more are not
uncommon (see Figure 12). In some cases, aid volatil-
ity is linked to political instability in recipient coun-
tries, and aid will peak or wane as a particular regime
falls into or out of favor with Western governments. In
other cases, however, aid volatility is driven more by
unstable aid programming and domestic donor politics
and is completely out of recipient countries’ control.
High aid volatility makes it difficult for countries to
implement long term strategies, a particular problem
in SOTCs given the timeframes needed to improve in-
stitutions.
Has international aid been effective in promoting de-
velopment in SOTCs? The answer largely depends
on the definition of “effective.” In a narrow sense, in-
dividual aid projects in these countries are about as
likely to achieve their stated objectives as projects in
other countries. For example, Figure 13 looks at the
percent of World Bank projects rated as unsatisfac-
tory in ex post evaluations, comparing the three-year
rolling average in SOTCs to that of all other developing
countries. During the 1990s, a much higher share of
projects in SOTCs received unsatisfactory evaluations,
relative to projects in other countries. Since the early
2000s, however, this gap has narrowed considerably,
and today there is only a modest difference in project
evaluations between the two groups.

2 8 G L O B A L E C O N O M Y A N D D E V E L O P M E N T P R O G R A M
50
40
30
20
10
0 1990 1995 2000 2005 2010 2015
Year
____ Severely off track countries ____ Other developing countries
% o
f Pro
ject
s D
ecla
red
Uns
atis
fact
ory
Note: Data are first averaged at the country level using three-year rolling averages, then averaged across countries.Source: Authors’ Calculations based on World Bank Independent Evaluation Group data.
Figure 13. The Gap in Project Evaluation Scores between SOTCs and Other Countries has Narrowed
Aid experts continue to debate the drivers and meaning
of this shift.40 Has aid performance actually improved
in difficult contexts? Has the portfolio of projects in
these countries shifted to simpler, easier to execute
tasks? Have project evaluators begun grading on a
curve, more willing to overlook faults in some countries
than others? In any case, at a minimum these findings
complicate the narrative that aid can only be effective
in “good governance” countries, that it is too difficult
to execute projects in countries with low government
capacity and high risks of conflict and instability.41 This
view justified devoting a larger share of aid portfolios
to well-governed countries, even though poorly gov-
erned countries often faced the greatest development
challenges. However, if today’s donors are doing as
good a job implementing projects in SOTCs as in other
countries, we should not a priori assume aid will neces-
sarily be less effective in these difficult settings.
40 See, for instance, Joel Hellman, “Surprising Results from Fragile States,” Future Development Blog, October 15, 2013. Avail-able at http://blogs.worldbank.org/futuredevelopment/surprising-results-fragile-states.
41 See discussion in Laurence Chandy, “Ten Years of Fragile States: What Have We Learned?” Brookings Institution, 2011.

L E A V E N O C O U N T R Y B E H I N D : E N D I N G P O V E R T Y I N T H E T O U G H E S T P L A C E S 2 9
Yet the fact that individual projects are completed suc-
cessfully in SOTCs does not tell us much about whether
international assistance in these countries is actually
contributing meaningfully to their long-term devel-
opment. Indeed, using this broader conception of aid
effectiveness, support to SOTCs has been much less
successful. While individual projects are completed
satisfactorily, for the most part this hasn’t added up
to macro results—governance is improving very slowly
if at all in most countries, and there is little evidence
of any fundamental shifts in development trajectories
that will be needed for SOTCs to achieve the SDG pov-
erty goal. In other words, while foreign assistance in
off track countries is achieving many important micro
successes, there is little evidence this support is help-
ing these countries get back on track.
This paradox, between project-level success and
country-level stagnation, has sparked two contrasting
viewpoints on the role and usefulness of aid in diffi-
cult contexts. On the one hand, optimists look at the
record of successful individual projects and conclude
that the normal way of doing business is working, and
the aid community should continue with existing prac-
tices. While there is perhaps a need to increase funding
levels to be commensurate with the needs of SOTCs,
a significant rethink of how aid is delivered in these
countries is not warranted. On the other hand, pessi-
mists look at the broader macro failures and conclude
development assistance in these places is too difficult
and unlikely ever to have substantial effects. Aid can
help alleviate suffering in some specific contexts, but
it is not worth trying to catalyze broader development.
Challenging both of these narratives, we argue that
development aid can be effective even in difficult con-
texts, and can accomplish more than the mere success-
ful execution of individual projects. Working together,
donors and SOTC governments can develop action
plans to help countries overcome the linked obstacles
of low government effectiveness, weak private sectors,
conflict and violence, and natural hazards and environ-
mental risks.
Our focus is not on identifying particular develop-
ment interventions to address these four obstacles, as
the question of which specific intervention is likely to
be most effective will vary by country, based on local
economic and political contexts. For this reason, it is
impossible to generalize across all SOTCs when defin-
ing and evaluating menus of potential development in-
terventions to tackle these obstacles. Rather, we focus
on three meta-challenges to successful, transformative
development that are common across interventions
to address all four obstacles. We argue that, to get
the most out of a sustained development partnership,
donors and SOTC governments must do three things
differently, across their development portfolios: they
must reimagine scaling up, redefine country owner-
ship, and rethink results-focused metrics.
Reimagine scaling up
In all development contexts, scaling up—the expan-
sion, replication, adaption, and endurance of successful
projects and policies in space and over time, to reach a
greater number of beneficiaries42—is vital to maximiz-
ing effectiveness. Too many development interven-
tions are one-off, short-term, and limited in scale; thus,
even successful projects have only minimal impact
on their societies. Scaling up is how successful indi-
vidual interventions can translate into transformative
42 This definition is adopted from that used in Artaud Hartmann and Johannes Linn, “Scaling Up: A Framework and Lessons for Development Effectiveness from Literature and Practice.” Wolfensohn Center for Development Working Paper No. 5, Brookings Institution, 2008

3 0 G L O B A L E C O N O M Y A N D D E V E L O P M E N T P R O G R A M
43 Raj M. Desai, Homi Kharas, and Magdi Amin. “Combining Good Business and Good Development: Evidence from IFC Op-erations.” Global Economy and Development Working Paper No. 103, Brookings Institution, 2017.
44 See Ashraf Ghani and Clare Lockhart, Fixing Failed States: A Framework for Rebuilding a Fractured World, Oxford Uni-versity Press, 2008, p206-08, as well as World Bank, “Fifth National Consultative Conference of Community Development Councils” November 25, 2015, available at http://www.worldbank.org/en/news/feature/2015/11/25/fifth-national- consultative-conference-of-community-development-councils.
outcomes. While not all interventions are suited for
scaling up, donor agencies are beginning to think more
rigorously about the scaling process, and consider
plans for scaling up during the initial project design
phase.
Yet scaling up in SOTCs poses special challenges. The
two primary pathways to scaling up are through the
market or through government bureaucracies. If a de-
velopment intervention is financially profitable, mar-
ket forces can be used to generate scale; demonstration
effects will allow private actors to replicate and spread
successful interventions. Alternatively, if a develop-
ment intervention aligns with a government’s mandate
and interests, the government can roll out a program
at scale by replicating across local, provincial, and na-
tional bureaucracies. In SOTCs, however, neither the
market nor the bureaucracy pathway is reliable. Private
markets are often shallow and inefficient, and govern-
ment bureaucracies are under-skilled and ineffective.
In light of this, donors and governments should look
for ways to strengthen both market and bureaucracy
pathways to scaling up in SOTCs. For instance, one
reason pathways involving the private sector often fail
in SOTCs is that transaction costs for participating in
markets are prohibitively high. In the case of the Inter-
national Finance Corporation (IFC), the World Bank’s
private sector arm, there is no evidence that activities
in fragile states have worse financial profitability than
similar activities in other countries, but the financial
returns to IFC are far lower in fragile states than in oth-
er places. That is because projects tend to be far small-
er in scale, so total profits do not cover higher up-front
costs of preparing projects in difficult environments,
undertaking adequate due diligence, and supervising
projects during implementation.43 Donors wishing to
strengthen scaling up through markets, then, could
reasonably focus on subsidizing some of these transac-
tion costs, perhaps working through their development
finance institutions (DFIs); they can also use various
instruments to de-risk projects to augment their ex-
pected profitability.
Similarly, donors and governments can work together
to make it easier for bureaucracies to scale up success-
ful interventions. This might include donor support for
domestic resource mobilization (DRM), which would
provide governments with the financial resources
necessary to take programs to scale, as well as insti-
tutional capacity building. Donors and governments
should also experiment with how to integrate suc-
cessful local programs into a national network, which
may involve hybrid forms of governance. For instance,
Afghanistan’s National Solidarity Program kept key
decision-making power at the local, community level,
but linked community-driven interventions into a na-
tional network in which the government set the overall
legal framework and managed financing. The central
government also organized national conferences con-
vening community representatives to share ideas and
lessons with one another, and with national leaders.44
This provides one example of how to strengthen gov-
ernment effectiveness at scale.
Whether scaling through markets or bureaucracies,
donors may need to take a longer-term outlook when
scaling up in SOTCs. While in other contexts donors

L E A V E N O C O U N T R Y B E H I N D : E N D I N G P O V E R T Y I N T H E T O U G H E S T P L A C E S 3 1
43 For an analysis on measuring aid effectiveness in fragile states, see Laurence Chandy, Brina Seidel, and Christine Zhang, “Aid Effectiveness in Fragile States: How bad is it and how can it improve?” Brooke Shearer Series Working Paper No. 5, Brook-ings Institution, 2016.
may be able to demonstrate the potential of pilot proj-
ects and then hand off development interventions to
local actors, in SOTCs, donors should prepare to en-
gage directly throughout the scaling up process.
Ultimately, in SOTCs as in other countries, successful
scaling up requires leadership and political commit-
ment. Donors and governments should think through
how to put in place incentives to encourage local and
national political leaders to embrace taking successful
development interventions to scale.
Redefine country ownership
Country ownership—the principle that recipient coun-
tries should set their own development strategies with
donors working through local institutions and systems
rather than implementing interventions themselves—
is a cornerstone of aid effectiveness, enshrined in both
the Paris Declaration and the Accra Agenda for Action.
For many years, however, there have been debates
about whether country ownership could and should be
applied in weak governance contexts. Experts worried
that many governments were unprepared or unwilling
to take on ownership, and donors were unprepared or
unwilling to cede control. The New Deal for Engage-
ment in Fragile States, agreed between the g7+ group
of conflict-affected states and international donors in
2011, sought to advance country ownership even in
fragile and weakly governed contexts. The New Deal
calls on donors to support nationally-owned and led
development plans in fragile states, working through
their country systems whenever possible. Partner gov-
ernments, in turn, promised to strengthen their sys-
tems and to build better state capabilities.
Six years on, the New Deal has achieved only mod-
est take-up in its quest to bring country ownership to
weakly governed countries. In practice, donors have
been reluctant to use country systems that they view
as corrupt or inefficient. Meanwhile, partner countries
have fallen short in their efforts to improve capacity.45
This ongoing impasse partially explains why aid to
fragile states fell in recent years, even as international
attention to fragile states as a shared global priority has
increased.
To overcome this binary choice between (perceived) in-
efficient reliance on country systems versus bypassing
government systems altogether, donors and govern-
ments should experiment with new forms of country
ownership. One example of such an approach comes
from Liberia’s post-conflict transition, where donors
partnered with Liberia’s government to share respon-
sibility and oversight for improving core government
functions through the Governance and Economic
Management Assistance Program (GEMAP). GEMAP
emerged in response to donor concerns regarding en-
demic corruption in Liberia’s transition government,
and the threat that such corruption could simultane-
ously squander donor resources and undermine the
nascent peace process. Following months of difficult
negotiation, international partners and Liberia’s tran-
sitional government reached an agreement that em-
bedded outside experts in key government agencies,
and granted these experts co-signatory authority on
significant financial transactions, including budget
and procurement contracts. GEMAP also featured
a steering committee, co-chaired by Liberia’s Presi-
dent and the American ambassador, which provided
a structured forum for discussing governance and

3 2 G L O B A L E C O N O M Y A N D D E V E L O P M E N T P R O G R A M
corruption concerns among Liberian officials and in-
ternational partners. GEMAP was controversial, both
inside and outside of Liberia, for infringing on the
country’s sovereignty; yet it did achieve at least some
success in strengthening controls over public spend-
ing, increasing government revenues, and improving
transparency.46
Does GEMAP provide a model for international en-
gagement in other SOTCs, where donors may be re-
luctant to turn over control to government officials?
Perhaps, although there were particular circumstances
that led to GEMAP’s success. Most importantly, Li-
beria’s government under President Ellen Johnson
Sirleaf was deeply committed to the reform agenda
supported by international donors. Without similar
political leadership from the top, GEMAP likely would
have been far less successful. (Indeed, the program
achieved only minimal results before Sirleaf came to
power, as donors and the Liberian transitional govern-
ment clashed over the country’s priorities.) So credible
political leadership is likely a necessary condition for
similar arrangements.
More generally, however, the GEMAP experience
demonstrates that donors and governments can find
creative ways to implement country ownership that
balance government-led policymaking with input
and influence of international experts. In Liberia’s
case, this allowed the international community to be
significantly involved in the country’s rebuilding, de-
spite deep initial concerns about corruption and weak
institutions. Ultimately, the goal of such partnerships
must be to build up country systems, and this requires
providing governments the space to experiment and
implement policy. Nevertheless, there is scope to cali-
brate how involved donors and international experts
are in these processes.
Rethink results-focused metrics
Over the past decade, both donors and governments
have begun to more rigorously monitor and evaluate
their development programming, to maximize value-
for-money in development spending. The outcome has
been an important shift away from tracking simply
how much money is spent and toward measuring re-
sults. This has contributed to improving effectiveness
and accountability in development.
Yet in many SOTCs, measuring development success
against time-based metrics may paint a misleading pic-
ture of effectiveness, and could in fact discourage do-
nors and governments from pursuing the most needed
projects. As former USAID Administrator Andrew
Natsios has noted, development agencies’ organiza-
tional emphasis on measurable results “ignores a cen-
tral principle of development theory—that those devel-
opment programs that are most precisely and easily
measured are the least transformational, and those
programs that are most transformational are the least
measurable.”47 In SOTCs, the most transformational
interventions are typically related to building local in-
stitutions and capacity attuned to SOTCs’ particular
contexts and challenges.
The reasons why such interventions are ill suited to
time-based, results-focused metrics are threefold:
46 Raymond Gilpin and Emily Hsu, “Is Liberia’s Governance and Economic Management Assistance Program a “Necessary Intrusion?” US Institute of Peach Briefing, May 2008.
47 Andrew Natsios, “The Clash of the Counter-bureaucracy and Development.” Center for Global Development Essay, July 2010, p 3.

L E A V E N O C O U N T R Y B E H I N D : E N D I N G P O V E R T Y I N T H E T O U G H E S T P L A C E S 3 3
48 See Dan Honig, “When Reporting Undermines Performance: The Costs of Politically Constrained Organizational Autonomy in Foreign Aid Implementation.” Unpublished Working Paper, June 2017, as well as Dan Honig,
First, the timeframes for success are typically ex-
tremely long. Building institutions can take decades
or longer. Thus, reporting that focuses on monthly,
quarterly, or even annual indicators will be unable to
distinguish between success and failure. And if bureau-
cratic reporting requirements limit development agen-
cies’ work to projects that can be scored over short- or
medium-term time frames, then agencies may be un-
able to effectively partner with governments for the
decades-long process of building local capacity.
Second, in addition to simply taking a long time, prog-
ress in institution building may be non-linear and non-
incremental. That is, successful institution building
does not follow a straightforward trajectory organized
into clear, discrete measurable steps. Long periods may
go by with little obvious signs of progress, even though
behind-the-scenes political structures may be subtly
shifting to be more open to reform initiatives. Simi-
larly, while reforms may be introduced and even ad-
opted, the key long-term challenge is whether reforms
will be sustained over time. In this context, attempts
to measure results at any point along this timeline may
present a misleading picture of the overall project and
its potential impact.
Third, there is no clear blueprint or best practice ap-
proach for institution building in SOTCs, making it
difficult to define measurable ex ante output indica-
tors for tracking progress. Institution building relies
on experimentation and iteration, not checking a list of
predetermined boxes. Donors and governments need
the freedom to adapt their approaches as they go; top-
down, results-focused metrics may limit this freedom.
For all these reasons, traditional results-based moni-
toring frameworks are often inapplicable in SOTCs.
The challenge, then, is how to maintain accountability
and effectiveness in development interventions while
rethinking at least some aspects of results-focused
metrics. One solution is to move away from “naviga-
tion by measurement” and toward “navigation by
judgment”—that is, shift power and autonomy toward
development agents in the field, and let them rely on
their tacit knowledge in implementing and adapting
projects.48 Rather than setting a pre-determined list of
targets and measuring success against these metrics,
aid agencies should empower their local staff to make
decisions responding to changing circumstances and
tailoring their work to specific local contexts. Such flex-
ibility is particularly important in contexts with high
uncertainty and greater environmental volatility—pre-
cisely the conditions present in many SOTCs.
Rethinking results-focused metrics does not mean giv-
ing up altogether on measuring the outcomes of devel-
opment interventions, of course. Rather than using the
resultant data to control and evaluate performance,
measurement should focus on learning and improve-
ment, i.e. feedback for iterative, adaptive approaches.
As governments and donors experiment, they must
study which variations lead to improvements, and then
replicate these successes. Data systems should be de-
signed to strengthen these feedback and learning pro-
cesses, rather than evaluate whether projects achieved
a pre-determined set of indicator targets.
Ultimately, working in SOTCs will demand a new ap-
proach to the fiduciary risk concerns that underlie
evaluation frameworks used by development agencies.
Fearful of the political and reputational cost of “failed”
projects—particularly when funds are diverted to cor-
rupt politicians—donors have shied away from high
risk, high reward projects. Today’s donor agencies tend

3 4 G L O B A L E C O N O M Y A N D D E V E L O P M E N T P R O G R A M
to favor projects with a high likelihood of achieving de-
fined, measurable results—even though there may be
riskier projects that would have a more transforma-
tional impact on a country’s development. Given the
scale of the development challenge in SOTCs and the
need to experiment, some setbacks and failures are in-
evitable. Donors should review their internal risk man-
agement strategies to be less risk averse and incentiv-
ize projects that could have the greatest development
impact, even when the risk of failure is higher.

L E A V E N O C O U N T R Y B E H I N D : E N D I N G P O V E R T Y I N T H E T O U G H E S T P L A C E S 3 5
SUMMARY AND CONCLUSIONS
After the past 15 years witnessed the most rapid de-
cline in poverty in history, today the development
landscape is distinctively shifting. We are moving from
an era where poverty was concentrated in large, rapidly
growing economies to one where poverty will increas-
ingly be concentrated in a number of smaller econo-
mies facing deeper structural challenges. This shift has
important implications for international development
prospects, as well as for strategies to accelerate prog-
ress on the SDGs.
An estimated 31 countries are at the heart of today’s
development challenge. Based on current trajectories,
they are likely to have extreme poverty rates of at least
20 percent in 2030. Since they are at risk of lagging
furthest behind in the effort to attain the SDGs, they
should be the primary focus of the international com-
munity’s attention. We need a global strategy for ac-
celerating development progress in the places where
poverty has proven most intractable.
In this paper, we diagnose four critical development
obstacles common to many of these countries: low
government effectiveness, weak private sectors, con-
flict and violence, and high risk of natural disasters.
Because most SOTCs face multiple obstacles, they need
to make progress along a broad front. Given the scale
of this development challenge, partnerships between
SOTC governments and the international community
will be necessary to deliver sustained, widespread
progress.
The good news is that micro evidence—from both pub-
lic sector aid projects and private sector investments—
suggest development interventions in these contexts
can be successful and profitable, just as they are in
other developing countries. The challenge, for both do-
nors and governments, is how to move from individual
successful projects to sustained countrywide progress,
given the significant development obstacles in SOTCs.
This is arguably the most urgent question in develop-
ment today.
We propose three principles to guide strategies for end-
ing poverty in SOTCs, and help individual successful
projects deliver transformational change: reimagine
scaling up, redefine country ownership, and rethink
results-focused metrics. Embracing these principles
will allow governments and donors to maximize the ef-
fectiveness of their development interventions.
This paper has focused on common challenges across
countries and broad principles of development prac-
tice. Ultimately, of course, research and policy need to
move from such generalized analyses to more specific
and particular country-level strategies. If the interna-
tional community were serious about leaving no coun-
try behind in the SDGs, a good starting place would
be actionable country plans for each of the 31 SOTCs.
Such plans would need to be adapted to local contexts
and reflective of country-specific constraints and op-
portunities.
While the SOTCs all face deep, structural challenges,
progress is possible. Countries that are currently off
track are not destined to fail. Countries like Laos and
Rwanda demonstrate that even places with long histo-
ries of social division and weak governance can achieve
dramatic, sustained development progress. These are
examples of countries which, not too long ago, were se-
verely off track, but which have managed to get back on
track. Success on the SDGs will depend on donors and
SOTC governments, working in partnership, achieving
similar transformations.

3 6 G L O B A L E C O N O M Y A N D D E V E L O P M E N T P R O G R A M
49 Due to missing data on GDP per capita, Afghanistan, Nauru, Somalia, and West Bank & Gaza enter the sample in 2002, 2004, 2011, and 2004 respectively. South Sudan also enters our sample upon its creation in 2008.
50 For countries with negative growth from 2014 to 2022, we assume growth from 2023 to 2030 is zero. 51 We do not use PovcalNet’s Survey for St. Lucia, which is more than 30 years old and implies a high poverty rate that is incon-
sistent with other development indicators.
ANNEX: METHODOLOGY
This paper draws on a database of projected pov-
erty rates in each country. To create these projec-
tions, we use data on 1) income and consumption dis-
tributions, 2) household consumption per capita, and
3) GDP per capita. Our dataset covers the 195 countries
and territories with data on GDP per capita in purchas-
ing power parity (PPP) from 2000 to 2030.49
We first collect data on income and consumption dis-
tributions from the World Bank’s PovcalNet. We use
distributional data from household consumption sur-
veys if available and household income surveys oth-
erwise. While income and consumption are clearly
distinct concepts, data limitations require us to draw
upon both types of surveys in order to obtain near-
global survey coverage. Combining income and con-
sumption surveys has become standard in the field of
poverty measurement (Ferreira et al 2015).
From these same PovcalNet surveys, we construct a se-
ries of mean income or consumption per capita for all
countries with survey data. For years in between sur-
vey years, we take the average of the two closest sur-
veys’ means weighted by the relative distance between
that year and each survey year.
Before the first survey and after the last survey, we
apply a series of growth rates compiled from several
sources to project income or consumption. Wherever
possible we use the growth of household final con-
sumption expenditure (HFCE) per capita in 2011 PPP
for all countries with data in the World Bank’s World
Development Indicators (WDI). This is because HFCE
is conceptually closest to income and consumption as
measured by household surveys. For countries without
HFCE data, we use growth rates of GDP per capita in
2011 PPP from WDI. We supplement this with values
from the IMF’s World Economic Outlook (WEO) for
countries and years that are not included in WDI, in-
cluding the projected growth rates for 2017 through
2022. To extend these growth rates out an addition-
al eight years to 2030, we use the compound annual
growth rate of GDP per capita for the preceding eight
years, from 2014 to 2022.50 For countries that are not
included in the WEO, we use the growth rate of GDP
per capita projections from Scenario 2 of the OECD’s
Shared Socioeconomic Pathways. This gives us a com-
plete series of survey means for 173 countries.
With this data, we use the methods described in Datt
(1998) to calculate poverty rates at a poverty line of
$1.90 per day for the 163 countries with household sur-
veys.51 This method involves fitting a Lorenz curve to
the distributional data using a Beta model and a Gen-
eralized Quadratic model, and selecting the model that
yields the best fit. Using the selected model, we then
calculate what percent of the population falls beneath
the $1.90 per day line. Multiplying these poverty rates
by population numbers from the UN gives us a head-
count of the poor in each country in each year.
Finally, we estimate poverty in the countries that do
not have a reliable household survey by modelling the
relationship between poverty and GDP per capita. We
ran a regression model that uses GDP per capita, re-
gional dummies, and other relevant factors to predict

L E A V E N O C O U N T R Y B E H I N D : E N D I N G P O V E R T Y I N T H E T O U G H E S T P L A C E S 3 7
the headcount rate. This model includes only pov-
erty rates from developing countries in actual survey
years.52 Observations are weighted by the inverse of
the number of surveys conducted in the country so that
countries that conduct surveys more frequently do not
dominate the results. The results from this regression
are as follows.
We use the predicted values from this model to esti-
mate poverty in the countries without survey data. This
requires a series of GDP per capita data for all countries
from 2000 through 2030. This series begins with data
from 2000 through 2016 from WDI for all available
52 Developing countries are defined as lower, lower middle, and upper middle income countries according to the World Bank’s 2017 classifications.
53 The growth rate series used to project GDP per capita does differ in that we never use HFCE growth rates to fill in data be-tween missing years.
countries. Next, we add data from the WEO for coun-
tries and years without data in WDI. Finally, we add
estimates from the CIA’s World Factbook for North
Korea in all years, which we assume has constant GDP
per capita, and for Syria in 2013 through 2015. We then
project these values out to 2030 by applying the same
series of GDP per capita growth rates used above to
project income and consumption values.53 Using this
GDP per capita series for out-of-sample predictions,
we estimate the poverty rate for countries without sur-
vey data.
Table 3. Regression results
ln (GDP per capita, 2011 PPP) -0.152*** 0.016
Europe & Central Asia -0.022 0.022
Latin America & Caribbean 0.023 0.018
Middle East & North Africa -0.071** 0.021
South Asia 0.01 0.029
Sub-Saharan Africa 0.144*** 0.023
Small Island Developing State (UNCTAD List) -0.125*** 0.023
Least Developed Country (2015 list) 0.02 0.03
Oil Exporters (IMF Fuel Exporters List) 0.074*** 0.018
Constant 1.449*** 0.142
N 683R2 0.774
Source: Authors’ calculations.

3 8 G L O B A L E C O N O M Y A N D D E V E L O P M E N T P R O G R A M

The views expressed in this working paper do not necessarily reflect the official position of Brookings, its board or theadvisory council members.
© 2018 The Brookings Institution
ISSN: 1939-9383

1775 Massachusetts Avenue, NWWashington, DC 20036202-797-6000www.brookings.edu/global