Embed Size (px)
Citation preview

Least Cost Analysis for Solar Photovoltaic Maintenance of the WMU Miller Auditorium Array
Honors Thesis
Western Michigan University
Kelsey Pitschel Department of Mechanical and Aerospace Engineering
Dr. Harold Glasser
Thesis Committee Chair Department of Environmental and Sustainability Studies
Spring 2016 April 21, 2016
Special thanks to: Dr. Harold Glasser, Chris Caprara, Anand Sankey, WMU Facilities Management, WMU Office for Sustainability.

I. Abstract The solar photovoltaic array at Miller Auditorium is a 50 kW DC system that has relied on five seasonal angle adjustments and no cleaning measures to reach an average of 64.7 MWh annual energy generation since 20121 . This amount of energy generation yields $7,046 in annual energy savings based on current market pricing for end use electricity of $0.1089/kWh2 . The current adjustment schedule based on seasonal tilts accounts for an annual costs between $760 and $848, but actual adjustments have historically not taken place according to the existing schedule. The analysis focuses on optimizing net energy savings of the Miller Array by studying least cost approaches to tilt schedules and panel cleaning. Cleaning test groups are designed to measure viability and costeffectiveness of panel cleaning with respect to pollen, dust, and soiling accumulation. Industry standard practices for preventative panel maintenance often neglect panel cleaning and thus do not consider the potential impacts on system performance. According to a full year of testing, the study determined that panels fixed at 35 degrees provide the least cost solution for the WMU Miller Array due to its relatively high net cost savings and projected consistency. Each panel group achieved comparable annual energy generation, however the seasonal panel group requires $760 annually to adjust, thus reducing its net annual savings. The 20 degree fixed panel group is a viable option based on its absence of adjustment costs, however energy production losses are subject to variations in snow and weather.
1

II. Table of Contents
Section Page No.
I. Abstract 1
II. Table of Contents 2
III. Background Information 3
IV. Problem Statement 5
V. Best Practice Research 6
VI. Hypotheses and Expectations 8
VII. Methodology 9
VIII. Maintenance Procedures 12
IX. Results, Panel Adjustments 14
X. Results, Panel Cleaning 16
XI. Conclusions and Recommendations 18
XII. References 19
XIII. Appendices A. Monthly Data for Each Pole B. Weather Data
20
2
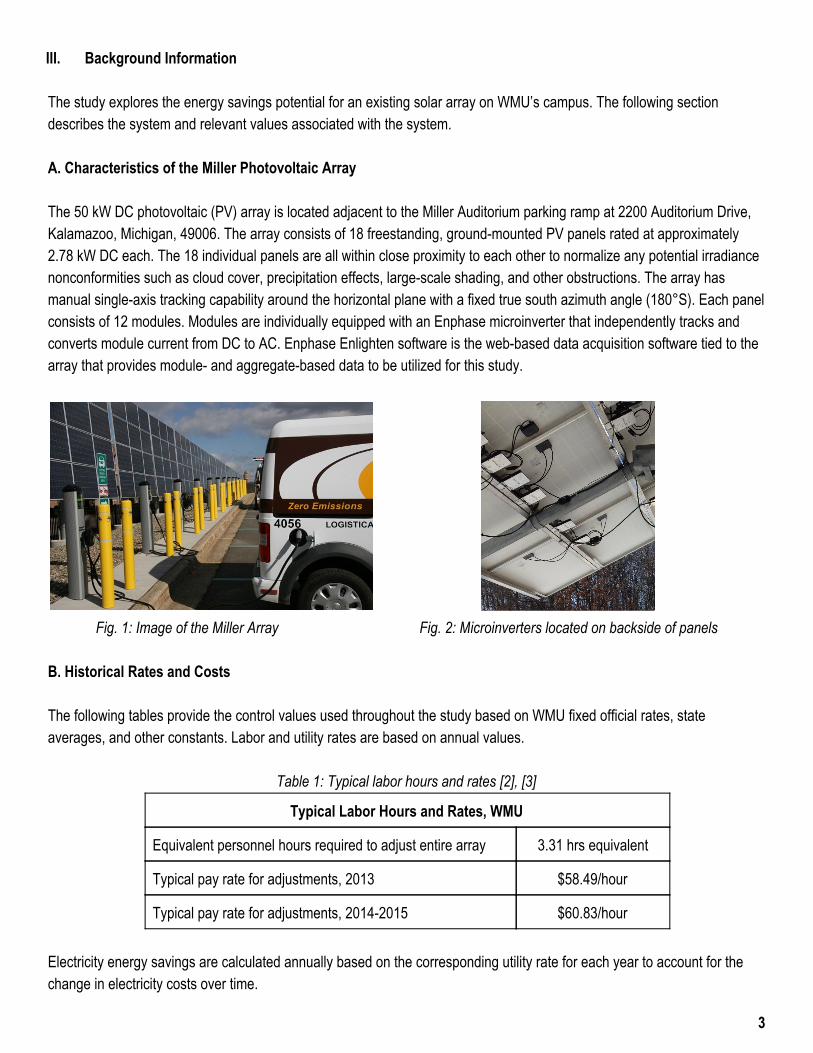
III. Background Information The study explores the energy savings potential for an existing solar array on WMU’s campus. The following section describes the system and relevant values associated with the system. A. Characteristics of the Miller Photovoltaic Array The 50 kW DC photovoltaic (PV) array is located adjacent to the Miller Auditorium parking ramp at 2200 Auditorium Drive, Kalamazoo, Michigan, 49006. The array consists of 18 freestanding, groundmounted PV panels rated at approximately 2.78 kW DC each. The 18 individual panels are all within close proximity to each other to normalize any potential irradiance nonconformities such as cloud cover, precipitation effects, largescale shading, and other obstructions. The array has manual singleaxis tracking capability around the horizontal plane with a fixed true south azimuth angle (180°S). Each panel consists of 12 modules. Modules are individually equipped with an Enphase microinverter that independently tracks and converts module current from DC to AC. Enphase Enlighten software is the webbased data acquisition software tied to the array that provides module and aggregatebased data to be utilized for this study.
Fig. 1: Image of the Miller Array Fig. 2: Microinverters located on backside of panels
B. Historical Rates and Costs The following tables provide the control values used throughout the study based on WMU fixed official rates, state averages, and other constants. Labor and utility rates are based on annual values.
Table 1: Typical labor hours and rates [2], [3]
Typical Labor Hours and Rates, WMU
Equivalent personnel hours required to adjust entire array 3.31 hrs equivalent
Typical pay rate for adjustments, 2013 $58.49/hour
Typical pay rate for adjustments, 20142015 $60.83/hour Electricity energy savings are calculated annually based on the corresponding utility rate for each year to account for the change in electricity costs over time.
3

Table 2: Annual Electricity Utility Rates [4], [10]
Year Utility Rate ($/kWh)
2013 0.1106
2014 0.1087
2015 0.1005 The energy savings and maintenance costs are analyzed on an annual basis to account for monthly fluctuations in energy production and leniency in panel adjustment schedules.
4
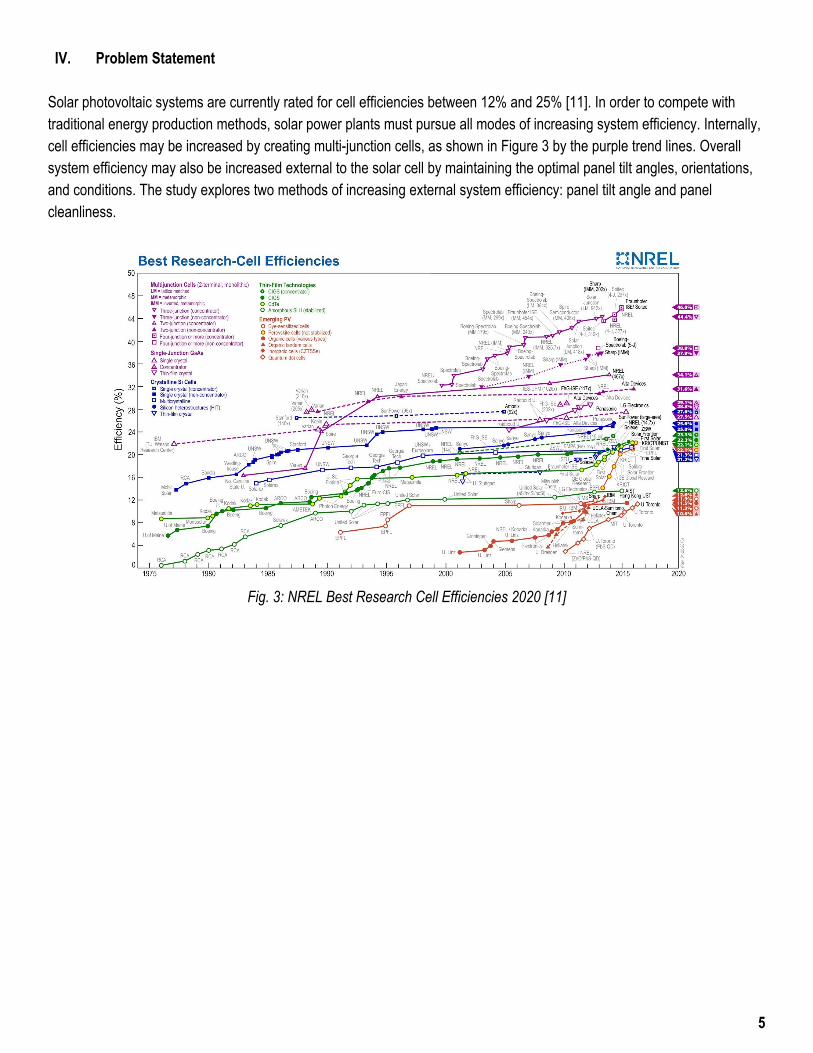
IV. Problem Statement Solar photovoltaic systems are currently rated for cell efficiencies between 12% and 25% [11]. In order to compete with traditional energy production methods, solar power plants must pursue all modes of increasing system efficiency. Internally, cell efficiencies may be increased by creating multijunction cells, as shown in Figure 3 by the purple trend lines. Overall system efficiency may also be increased external to the solar cell by maintaining the optimal panel tilt angles, orientations, and conditions. The study explores two methods of increasing external system efficiency: panel tilt angle and panel cleanliness.
Fig. 3: NREL Best Research Cell Efficiencies 2020 [11]
5
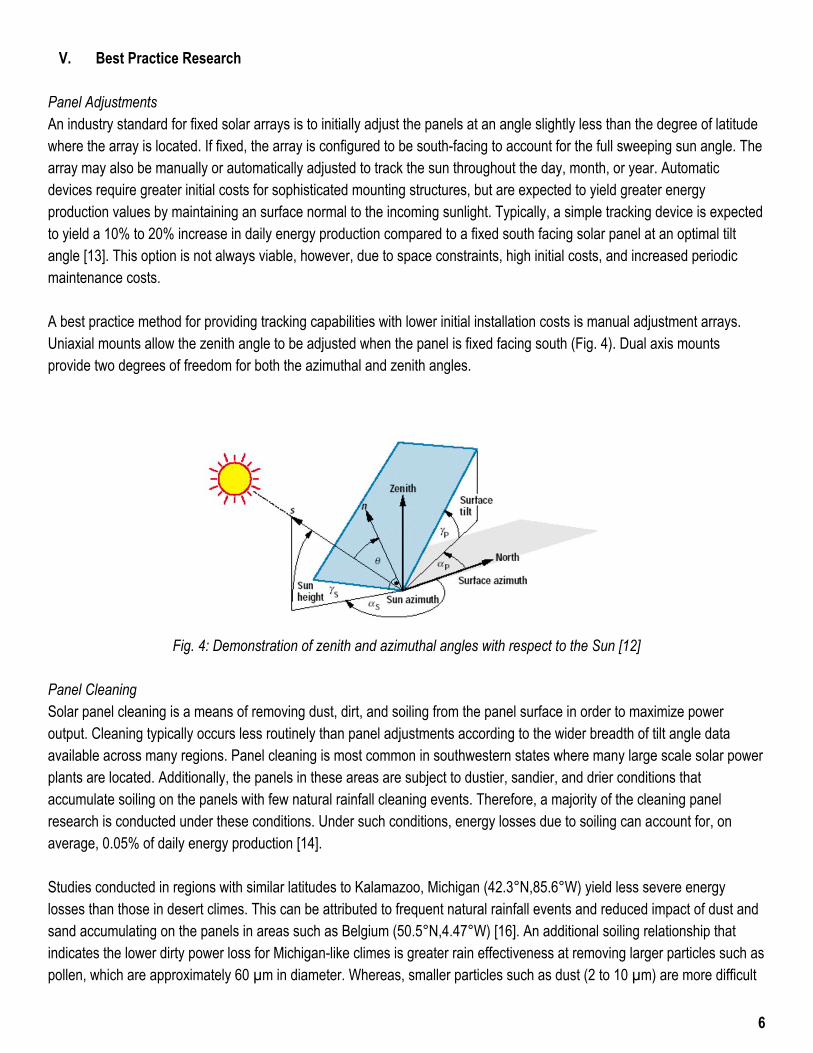
V. Best Practice Research Panel Adjustments An industry standard for fixed solar arrays is to initially adjust the panels at an angle slightly less than the degree of latitude where the array is located. If fixed, the array is configured to be southfacing to account for the full sweeping sun angle. The array may also be manually or automatically adjusted to track the sun throughout the day, month, or year. Automatic devices require greater initial costs for sophisticated mounting structures, but are expected to yield greater energy production values by maintaining an surface normal to the incoming sunlight. Typically, a simple tracking device is expected to yield a 10% to 20% increase in daily energy production compared to a fixed south facing solar panel at an optimal tilt angle [13]. This option is not always viable, however, due to space constraints, high initial costs, and increased periodic maintenance costs. A best practice method for providing tracking capabilities with lower initial installation costs is manual adjustment arrays. Uniaxial mounts allow the zenith angle to be adjusted when the panel is fixed facing south (Fig. 4). Dual axis mounts provide two degrees of freedom for both the azimuthal and zenith angles.
Fig. 4: Demonstration of zenith and azimuthal angles with respect to the Sun [12]
Panel Cleaning Solar panel cleaning is a means of removing dust, dirt, and soiling from the panel surface in order to maximize power output. Cleaning typically occurs less routinely than panel adjustments according to the wider breadth of tilt angle data available across many regions. Panel cleaning is most common in southwestern states where many large scale solar power plants are located. Additionally, the panels in these areas are subject to dustier, sandier, and drier conditions that accumulate soiling on the panels with few natural rainfall cleaning events. Therefore, a majority of the cleaning panel research is conducted under these conditions. Under such conditions, energy losses due to soiling can account for, on average, 0.05% of daily energy production [14]. Studies conducted in regions with similar latitudes to Kalamazoo, Michigan (42.3°N,85.6°W) yield less severe energy losses than those in desert climes. This can be attributed to frequent natural rainfall events and reduced impact of dust and sand accumulating on the panels in areas such as Belgium (50.5°N,4.47°W) [16]. An additional soiling relationship that indicates the lower dirty power loss for Michiganlike climes is greater rain effectiveness at removing larger particles such as pollen, which are approximately 60 µm in diameter. Whereas, smaller particles such as dust (2 to 10 µm) are more difficult
6
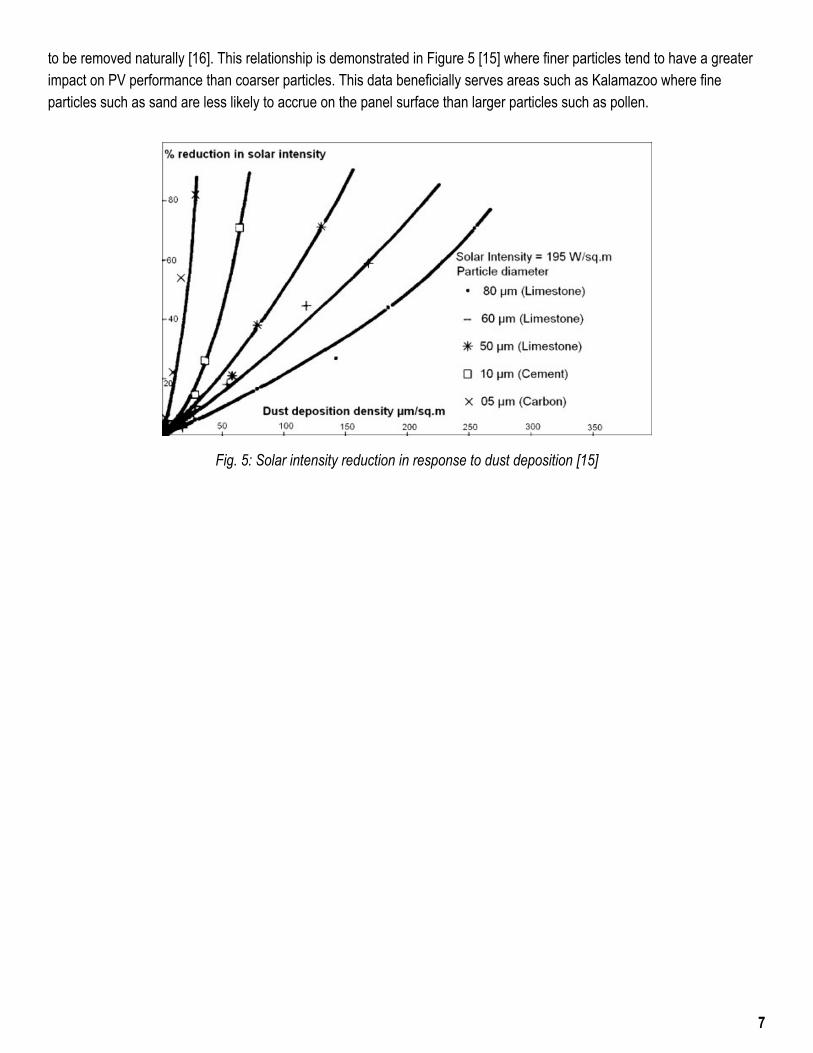
to be removed naturally [16]. This relationship is demonstrated in Figure 5 [15] where finer particles tend to have a greater impact on PV performance than coarser particles. This data beneficially serves areas such as Kalamazoo where fine particles such as sand are less likely to accrue on the panel surface than larger particles such as pollen.
Fig. 5: Solar intensity reduction in response to dust deposition [15]
7
VI. Hypotheses and Expectations The study was explored to debunk or validate the following hypotheses. A. Tilt Adjustment Hypothesis Based on the National Renewable Energy Lab (NREL) PVWatts Calculator [5], seasonally adjusted panels yield annual energy production averages of 64.7 MWh for five seasonal adjustments per year. This study considers panel configurations competitive with the seasonal schedule if annual energy production (MWh) is within 15% of the aforementioned expected seasonal schedule. Therefore, the entire Miller array would need to produce at least 55 MWh each year in order to be competitive. Based on PVWatts [5], a fixed array at 35 degrees may yield 57.8 kWh per year; therefore fixed panels are expected to provide a least cost solution for angle adjustments of the Miller Array competitive to energy production of the seasonal schedule. Table 3 shows expected energy production values based on PVWatts. B. Cleaning Hypothesis The cost of cleaning twice per year, nearly $600 annually including supplies, in June and October is not expected to offset the margin of increased panel performance from cleaned panels not laden with dirt and pollen based on the marginal increase in energy production from best practice review. The entire array would need to increase its margin of energy generation by 4,000 kWh each year in order to offset the annual cost for cleaning based on current market pricing. C. Snow Accumulation Considerations In order to increase viability of fixed panels at 35 degrees, snow removal measures may be necessary. Considering snow removal occurrences of four times per winter (December, January, February, March) with rates comparable to cleaning, the fixed array would require an increase in energy production of about 7 MWh during winter irradiance levels. Projection calculations based on no snow cover during winter months yield ideal energy generation for December, January, February, and March combined to be about 14.7 MWh. For simplicity of this study, panels will not be cleaned for snow accumulation, but if the fixed panels do not reach competitive levels of seasonally adjusted panels, then additional hypotheses regarding snow conditions may be considered.
8
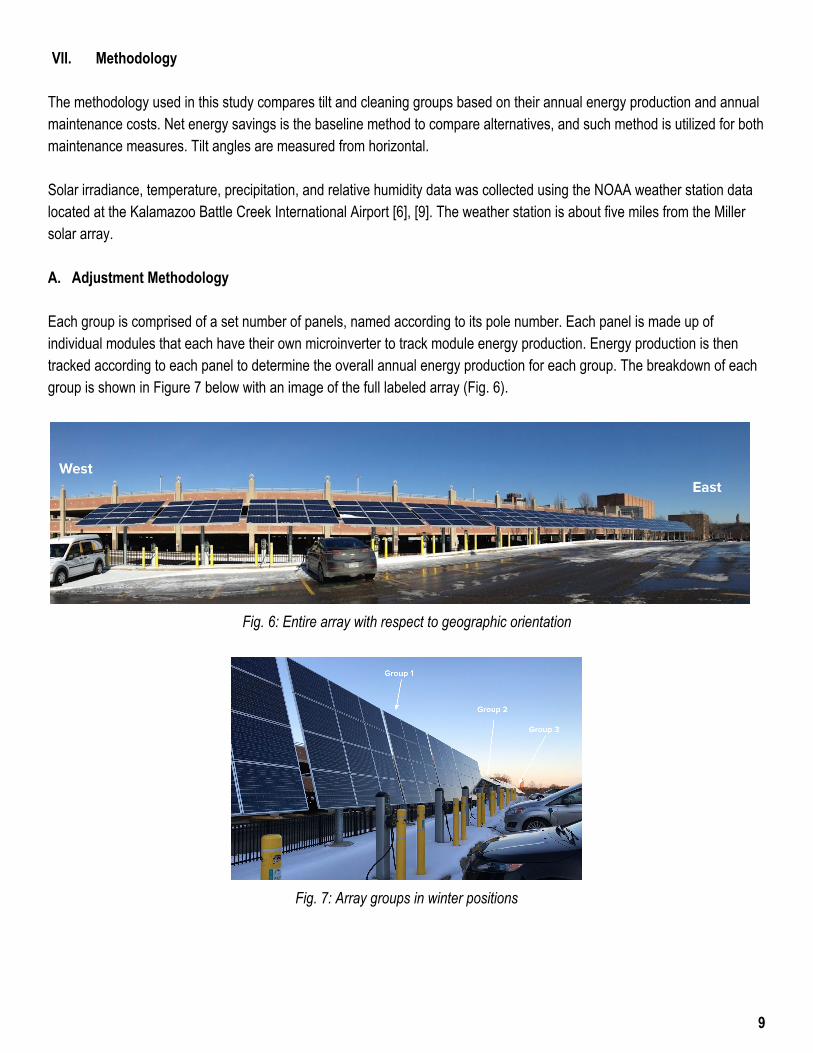
VII. Methodology The methodology used in this study compares tilt and cleaning groups based on their annual energy production and annual maintenance costs. Net energy savings is the baseline method to compare alternatives, and such method is utilized for both maintenance measures. Tilt angles are measured from horizontal. Solar irradiance, temperature, precipitation, and relative humidity data was collected using the NOAA weather station data located at the Kalamazoo Battle Creek International Airport [6], [9]. The weather station is about five miles from the Miller solar array. A. Adjustment Methodology Each group is comprised of a set number of panels, named according to its pole number. Each panel is made up of individual modules that each have their own microinverter to track module energy production. Energy production is then tracked according to each panel to determine the overall annual energy production for each group. The breakdown of each group is shown in Figure 7 below with an image of the full labeled array (Fig. 6).
Fig. 6: Entire array with respect to geographic orientation
Fig. 7: Array groups in winter positions
9
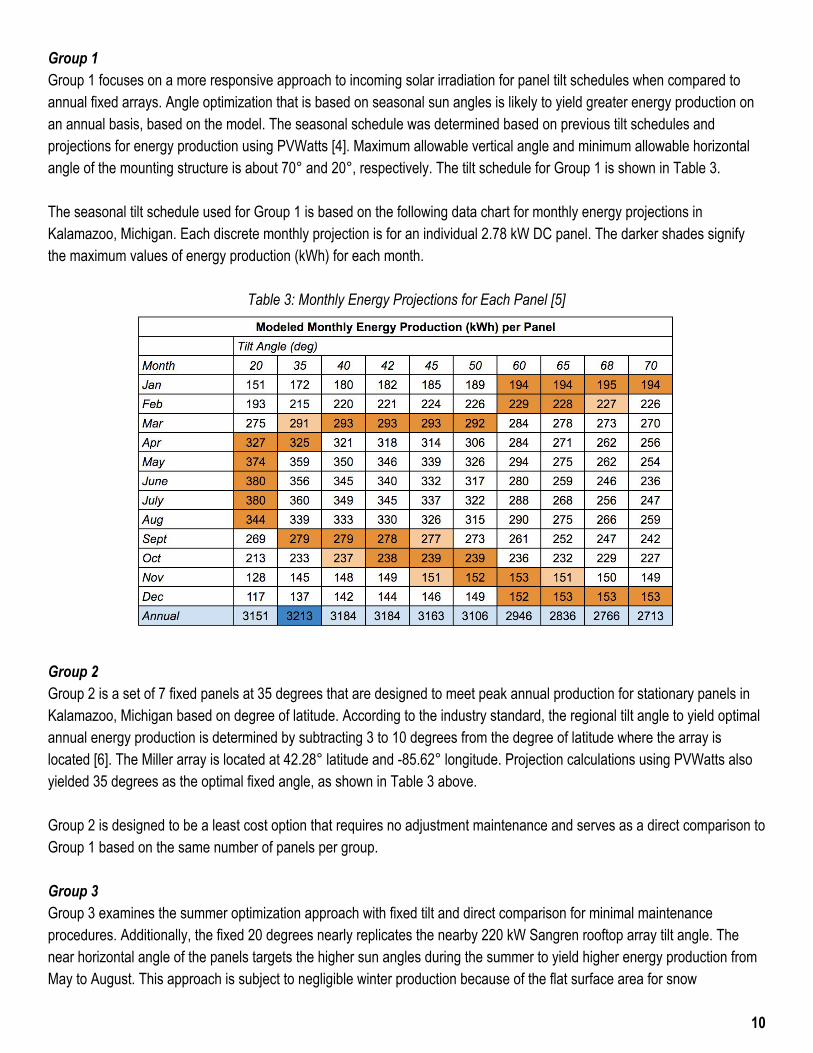
Group 1 Group 1 focuses on a more responsive approach to incoming solar irradiation for panel tilt schedules when compared to annual fixed arrays. Angle optimization that is based on seasonal sun angles is likely to yield greater energy production on an annual basis, based on the model. The seasonal schedule was determined based on previous tilt schedules and projections for energy production using PVWatts [4]. Maximum allowable vertical angle and minimum allowable horizontal angle of the mounting structure is about 70° and 20°, respectively. The tilt schedule for Group 1 is shown in Table 3. The seasonal tilt schedule used for Group 1 is based on the following data chart for monthly energy projections in Kalamazoo, Michigan. Each discrete monthly projection is for an individual 2.78 kW DC panel. The darker shades signify the maximum values of energy production (kWh) for each month.
Table 3: Monthly Energy Projections for Each Panel [5]
Group 2 Group 2 is a set of 7 fixed panels at 35 degrees that are designed to meet peak annual production for stationary panels in Kalamazoo, Michigan based on degree of latitude. According to the industry standard, the regional tilt angle to yield optimal annual energy production is determined by subtracting 3 to 10 degrees from the degree of latitude where the array is located [6]. The Miller array is located at 42.28° latitude and 85.62° longitude. Projection calculations using PVWatts also yielded 35 degrees as the optimal fixed angle, as shown in Table 3 above. Group 2 is designed to be a least cost option that requires no adjustment maintenance and serves as a direct comparison to Group 1 based on the same number of panels per group. Group 3 Group 3 examines the summer optimization approach with fixed tilt and direct comparison for minimal maintenance procedures. Additionally, the fixed 20 degrees nearly replicates the nearby 220 kW Sangren rooftop array tilt angle. The near horizontal angle of the panels targets the higher sun angles during the summer to yield higher energy production from May to August. This approach is subject to negligible winter production because of the flat surface area for snow
10

accumulation, but is designed to offset this subperformance with greater summer outputs. The results were scaled up to be normalized across Group 1, Group 2, and Group 3. It shall be noted that the four panels in Group 3 are located the farthest east because they require no adjusting after the initial tilt adjustment. The pole mounts at this location are much higher and more dangerous to adjust on a routine basis. B. Cleaning Methodology The annual costs for cleaning maintenance (cleaning crew labor, supplies, etc.) will be subtracted from the annual cost savings of the cleaned panels to determine the net cost savings for cleaning. The net cost savings will then be compared to the annual cost savings of the dirty panels. Values will be analyzed on an annual basis due to the high level of fluctuations in seasonal solar irradiance. Conclusions will be drawn on a cost basis and the panel group with greater annual cost savings will be deemed the most costeffective solution for panel cleaning occurrences.
11
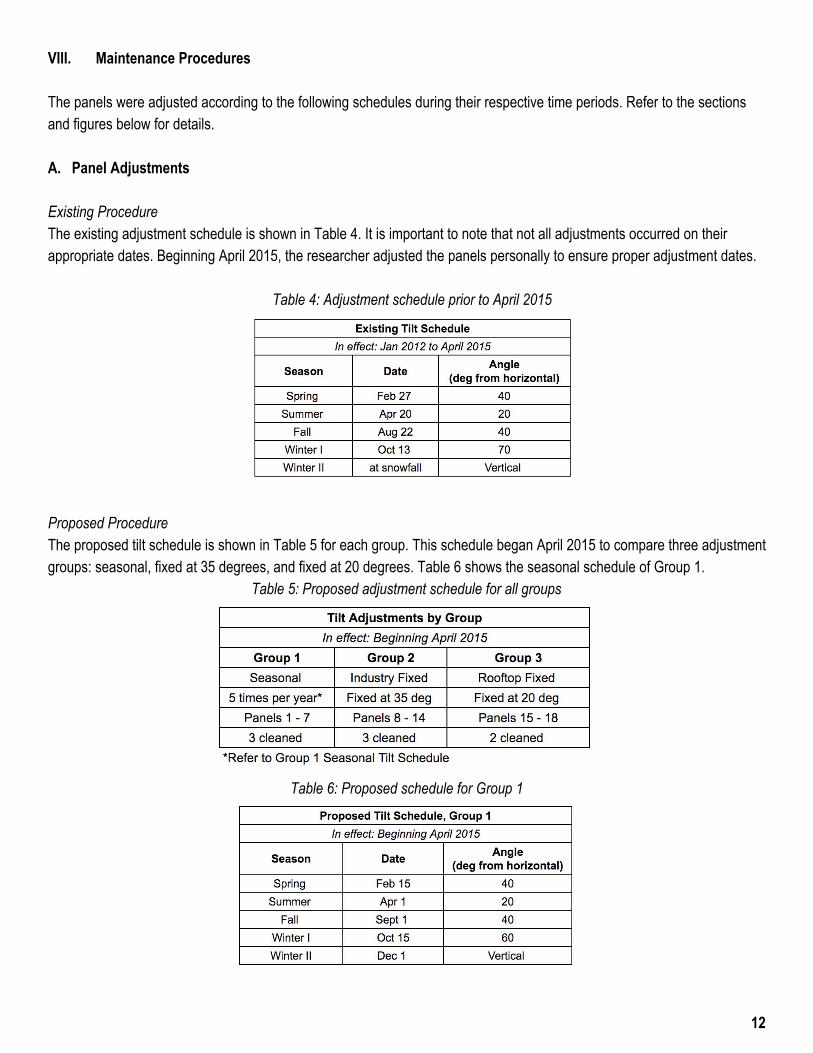
VIII. Maintenance Procedures The panels were adjusted according to the following schedules during their respective time periods. Refer to the sections and figures below for details. A. Panel Adjustments
Existing Procedure The existing adjustment schedule is shown in Table 4. It is important to note that not all adjustments occurred on their appropriate dates. Beginning April 2015, the researcher adjusted the panels personally to ensure proper adjustment dates.
Table 4: Adjustment schedule prior to April 2015
Proposed Procedure The proposed tilt schedule is shown in Table 5 for each group. This schedule began April 2015 to compare three adjustment groups: seasonal, fixed at 35 degrees, and fixed at 20 degrees. Table 6 shows the seasonal schedule of Group 1.
Table 5: Proposed adjustment schedule for all groups
Table 6: Proposed schedule for Group 1
12

The panel numbering convention is shown in Figure 8 for the entire array. Panel 1 is the westernmost panel (also known as Pole 1). The adjustment groups are also split into cleaning groups, as shown below the panel numbering system.
Fig. 8: Proposed Schedule Array Schematic
B. Cleaning Measures The array was proposed to be cleaned according to the following schedule and procedure. The original maintenance plan of the array did not include cleaning measures. Proposed Cleaning Procedure Panels that were subject to cleaning are shown in the array schematic in Figure 8. The schedule for panel cleanings is shown in Table 7.
Table 7: Cleaning Schedule
13
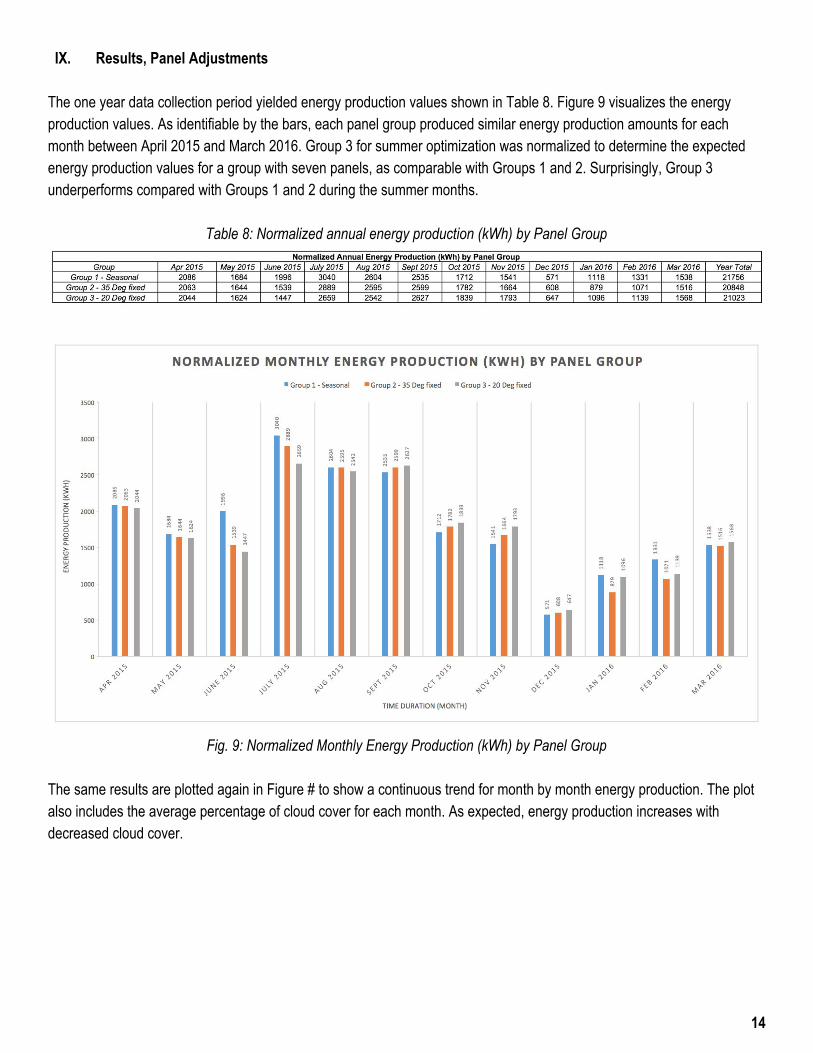
IX. Results, Panel Adjustments The one year data collection period yielded energy production values shown in Table 8. Figure 9 visualizes the energy production values. As identifiable by the bars, each panel group produced similar energy production amounts for each month between April 2015 and March 2016. Group 3 for summer optimization was normalized to determine the expected energy production values for a group with seven panels, as comparable with Groups 1 and 2. Surprisingly, Group 3 underperforms compared with Groups 1 and 2 during the summer months.
Table 8: Normalized annual energy production (kWh) by Panel Group
Fig. 9: Normalized Monthly Energy Production (kWh) by Panel Group
The same results are plotted again in Figure # to show a continuous trend for month by month energy production. The plot also includes the average percentage of cloud cover for each month. As expected, energy production increases with decreased cloud cover.
14
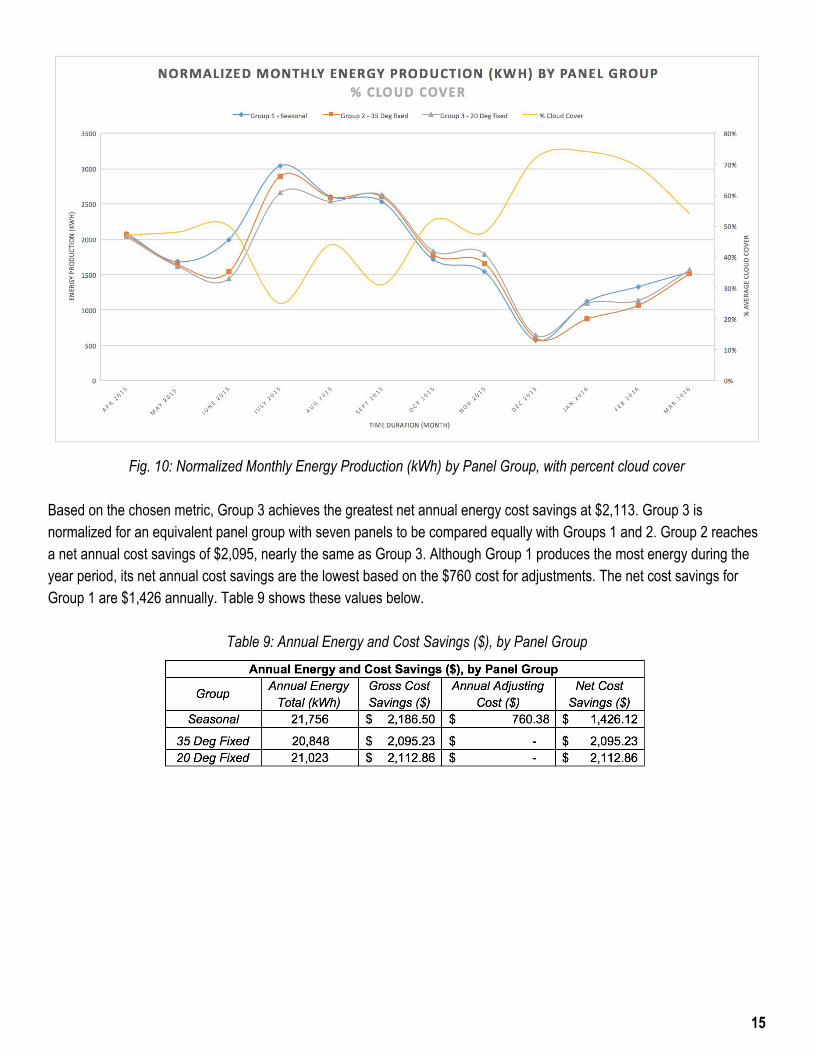
Fig. 10: Normalized Monthly Energy Production (kWh) by Panel Group, with percent cloud cover
Based on the chosen metric, Group 3 achieves the greatest net annual energy cost savings at $2,113. Group 3 is normalized for an equivalent panel group with seven panels to be compared equally with Groups 1 and 2. Group 2 reaches a net annual cost savings of $2,095, nearly the same as Group 3. Although Group 1 produces the most energy during the year period, its net annual cost savings are the lowest based on the $760 cost for adjustments. The net cost savings for Group 1 are $1,426 annually. Table 9 shows these values below.
Table 9: Annual Energy and Cost Savings ($), by Panel Group
15
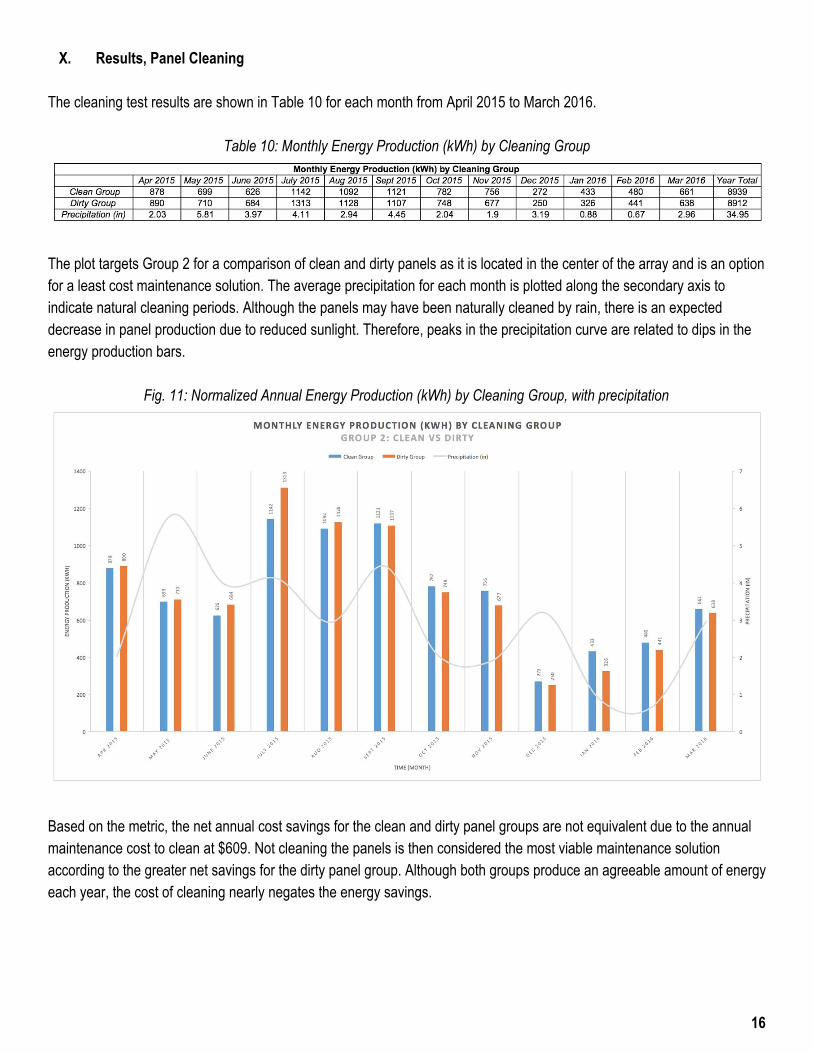
X. Results, Panel Cleaning The cleaning test results are shown in Table 10 for each month from April 2015 to March 2016.
Table 10: Monthly Energy Production (kWh) by Cleaning Group
The plot targets Group 2 for a comparison of clean and dirty panels as it is located in the center of the array and is an option for a least cost maintenance solution. The average precipitation for each month is plotted along the secondary axis to indicate natural cleaning periods. Although the panels may have been naturally cleaned by rain, there is an expected decrease in panel production due to reduced sunlight. Therefore, peaks in the precipitation curve are related to dips in the energy production bars.
Fig. 11: Normalized Annual Energy Production (kWh) by Cleaning Group, with precipitation
Based on the metric, the net annual cost savings for the clean and dirty panel groups are not equivalent due to the annual maintenance cost to clean at $609. Not cleaning the panels is then considered the most viable maintenance solution according to the greater net savings for the dirty panel group. Although both groups produce an agreeable amount of energy each year, the cost of cleaning nearly negates the energy savings.
16

Table 11: Annual Energy and Cost Savings ($), by Cleaning Group
17

Table 11: Annual Energy and Cost Savings ($), by Cleaning Group
17
XI. Conclusion and Recommendations Based on the test period from April 2015 to March 2016, Group 2 is the ideal least cost solution. All panel groups demonstrated competitive energy production rates, however, Group 2 and Group 3 require no adjustment maintenance costs. The net annual energy savings for Group 2 yield a successful maintenance option at $2,095. Group 3 provides a competitive net annual energy savings amount as well with $2,113. However, due to its near horizontal angle and the relatively moderate snow accumulation during the test period, it is expected to experience inconsistent energy production values for future years. Group 2 is selected as a more viable option than Group 3 based on its projected consistency and agreement with the industry standard. The recommendation for the WMU Physical Plant is to avoid adjustment and cleaning maintenance of the WMU Miller Array. Fixed adjustment schedules yield greater net savings cost annually, and uncleaned panels produce equivalent amounts of energy annually compared to clean panels. Once the panels are adjusted to 35 degrees, WMU is expected to achieve $6,160 in cost savings each year by avoiding maintenance adjustment costs ($760) and by producing electricity for the entire solar array ($5,400). The scaled values for the entire array are shown in Table 12.
Table 12: Values for Recommendation of 35 deg fixed array, Future Savings
18
Facilities Management at Western Michigan University has decided to utilize the 35 degree fixed recommendation for the entire Miller Photovoltaic Array. All panels have been adjusted as such beginning May 23, 2016.
XII. References [1] Enphase Energy Inc., Enlighten Manager, Maintained by The Green Panel. ‘Western Michigan University System.’ 2015.
<https://enlighten.enphaseenergy.com/systems/52723/arrays?range=today&view=energy_production>. [2] Cosby, Kevin, Western Michigan University, Official PM Work Order, S3201775, 12 March 2014. [3] National Renewable Energy Laboratory, ‘PV Solar Radiation Maps, Static’, 2015, <http://www.nrel.gov/gis/solar.html/>. [4] U.S. Energy Information Administration, U.S. Department of Energy, ‘Table 2.10. Average Price of Electricity to Ultimate
Customers by EndUse Sector,” February 2016, <http://www.eia.gov/electricity/annual/ >. [5] National Renewable Energy Laboratory, ‘ PVWatts Calculator’, Operated by Alliance for Sustainable Energy, 2014,
<http://pvwatts.nrel.gov/>. [6] The Weather Channel, Inc., Weather Underground, ‘Weather History for KAZO’, 2015,
<http://www.wunderground.com/history/airport/KAZO/2015/1/13/MonthlyHistory.html&reqdb.zip=&reqdb.magic=&reqdb.wmo=?MR=1>.
[7] American Academy of Allergy Asthma and Immunology, ‘National Allergy Bureau Pollen and Mold Report’, St. Clair Shores, Michigan, 201415, <http://pollen.aaaai.org/nab/index.cfm?p=AllergenCalendar&stationid=148&qsFullDate=09/25/2014>.
[8] Electric Power Institute, National Renewable Energy Laboratory, U.S. Department of Energy, ‘PV O&M Best Practices’, Nov 2010, <http://nextphasesolar.com/wpcontent/uploads/2011/12/NRELepriOMbestpractices.pdf>
[9] NOAA, National Weather Service, Kalamazoo, ‘Kalamazoo/Battle Creek International Airport Weather .Station Data’, <http://w1.weather.gov/obhistory/KAZO.html>.
[10] U.S. Energy Information Administration, U.S. Department of Energy, ‘Table 5.6.A. Average Price of Electricity to Ultimate Customers by EndUse Sector,” 25 March 2016, <https://www.eia.gov/electricity/monthly/epm_table_grapher.cfm?t=epmt_5_6_a>.
[11] National Renewable Energy Lab. “Research Cell Efficiency Records.” US Department of Energy, Office of Energy Efficiency and Renewable Energy. 25 February 2016. <http://www.nrel.gov/ncpv/>.
[12] Volker Quaschning. “The Sun as an Energy Resource.” Technology Fundamentals. Renewable Energy World. May 2003. Pages. 9093. <http://www.volkerquaschning.de/articles/fundamentals1/index_e.php>.
[13] Hossein Mousazadeh, Alireza Keyhani, Arzhang Javadi, Hossein Mobli, Karen Abrinia, Ahmad Sharifi. “A review of principle and suntracking methods for maximizing solar systems output.” Renewable and Sustainable Energy Reviews. Elsevier. Volume 13, Issue 8, Pages 18001818. October 2009. <http://www.sciencedirect.com/science/article/pii/S1364032109000318>.
[14] Felipe A Mejia, Jan Kleissl. “Soiling losses for solar photovoltaic systems in California.” Center for Renewable Resources and Integration, Department of Mechanical and Aerospace Engineering, University of California, San Diego. Elsevier. Solar Energy. Volume 95, September 2013, Pages 357363. 25 June 2013. <http://www.sciencedirect.com/science/article/pii/S0038092X13002582>.
[15] Monto Mani, Rohit Pillai. “Impact of dust on solar photovoltaic (PV) performance: Research status, challenges and recommendations.” Centre for Sustainable Technologies, Indian Institute of Science, Bangalore, India. Elsevier. Renewable and Sustainable Energy Reviews. Volume 14, Issue 9, December 2010, Pages 31243131. 21 July 2010. <http://www.sciencedirect.com/science/article/pii/S1364032110002455>.
[16] Reinhart Appels, Buvaneshwari Lefevre, Bert Herteleer, Hans Goverde, Alexander Beerten, Robin Paesen, Klaas De Medts, Johan Driesen, Jef Poortmans. “Effect of soiling on photovoltaic modules.” ESAT/ELECTA, KU Lewen, Heverlee, Belgium. Elsevier. Solar Energy. Volume 96, 2013, Pages 283291. 2 July 2013.
19
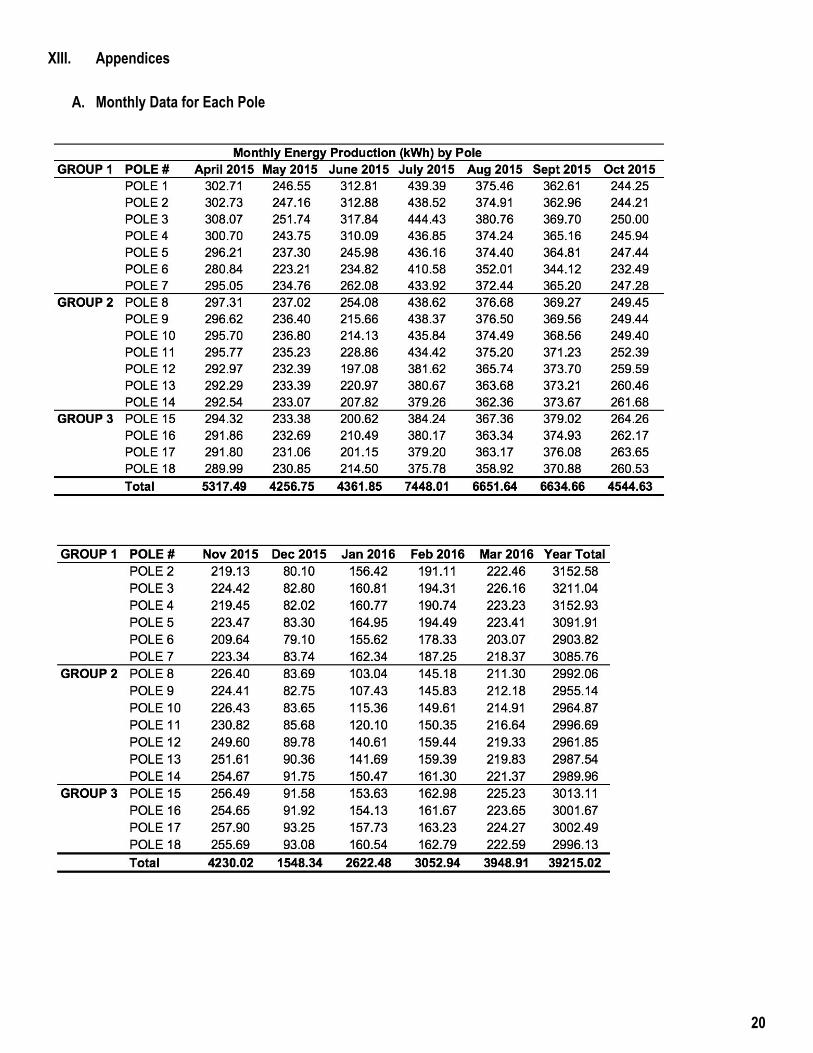
XIII. Appendices
A. Monthly Data for Each Pole
20
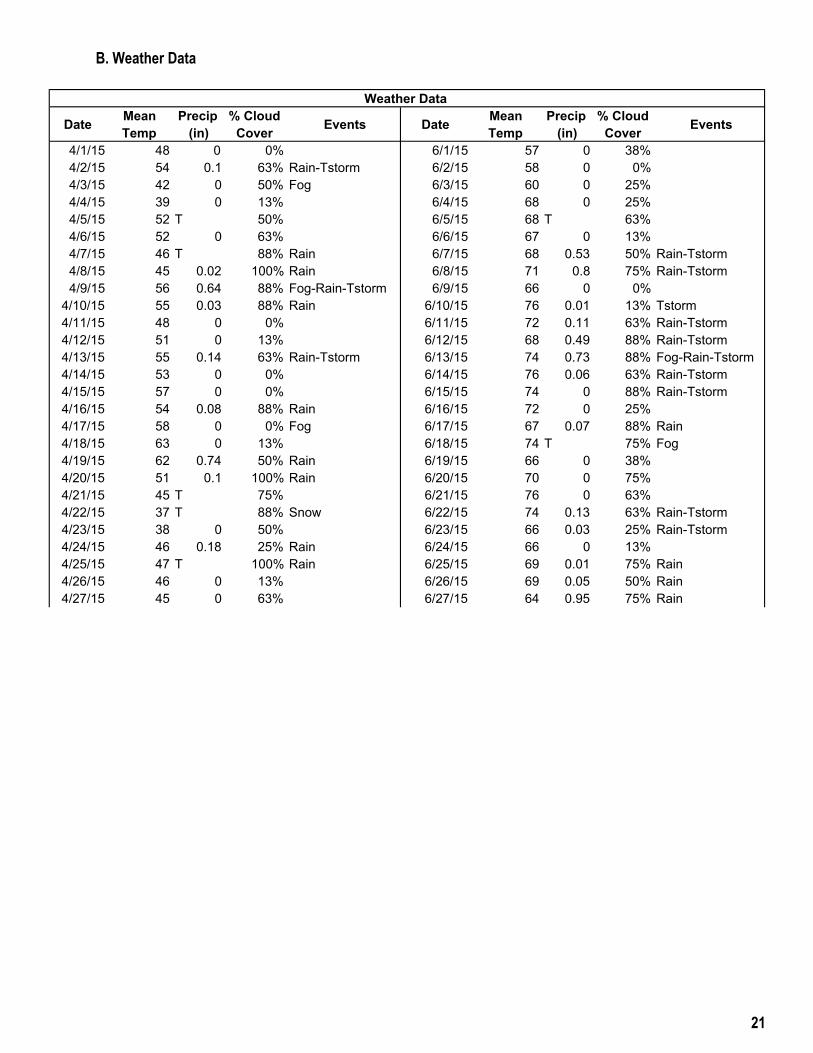
B. Weather Data
21
Date Mean Temp
Precip (in)
% Cloud Cover Events Date Mean
Temp Precip
(in)% Cloud
Cover Events
4/1/15 48 0 0% 6/1/15 57 0 38%4/2/15 54 0.1 63% Rain-Tstorm 6/2/15 58 0 0%4/3/15 42 0 50% Fog 6/3/15 60 0 25%4/4/15 39 0 13% 6/4/15 68 0 25%4/5/15 52 T 50% 6/5/15 68 T 63%4/6/15 52 0 63% 6/6/15 67 0 13%4/7/15 46 T 88% Rain 6/7/15 68 0.53 50% Rain-Tstorm4/8/15 45 0.02 100% Rain 6/8/15 71 0.8 75% Rain-Tstorm4/9/15 56 0.64 88% Fog-Rain-Tstorm 6/9/15 66 0 0%4/10/15 55 0.03 88% Rain 6/10/15 76 0.01 13% Tstorm4/11/15 48 0 0% 6/11/15 72 0.11 63% Rain-Tstorm4/12/15 51 0 13% 6/12/15 68 0.49 88% Rain-Tstorm4/13/15 55 0.14 63% Rain-Tstorm 6/13/15 74 0.73 88% Fog-Rain-Tstorm4/14/15 53 0 0% 6/14/15 76 0.06 63% Rain-Tstorm4/15/15 57 0 0% 6/15/15 74 0 88% Rain-Tstorm4/16/15 54 0.08 88% Rain 6/16/15 72 0 25%4/17/15 58 0 0% Fog 6/17/15 67 0.07 88% Rain4/18/15 63 0 13% 6/18/15 74 T 75% Fog4/19/15 62 0.74 50% Rain 6/19/15 66 0 38%4/20/15 51 0.1 100% Rain 6/20/15 70 0 75%4/21/15 45 T 75% 6/21/15 76 0 63%4/22/15 37 T 88% Snow 6/22/15 74 0.13 63% Rain-Tstorm4/23/15 38 0 50% 6/23/15 66 0.03 25% Rain-Tstorm4/24/15 46 0.18 25% Rain 6/24/15 66 0 13%4/25/15 47 T 100% Rain 6/25/15 69 0.01 75% Rain4/26/15 46 0 13% 6/26/15 69 0.05 50% Rain4/27/15 45 0 63% 6/27/15 64 0.95 75% Rain
Weather Data
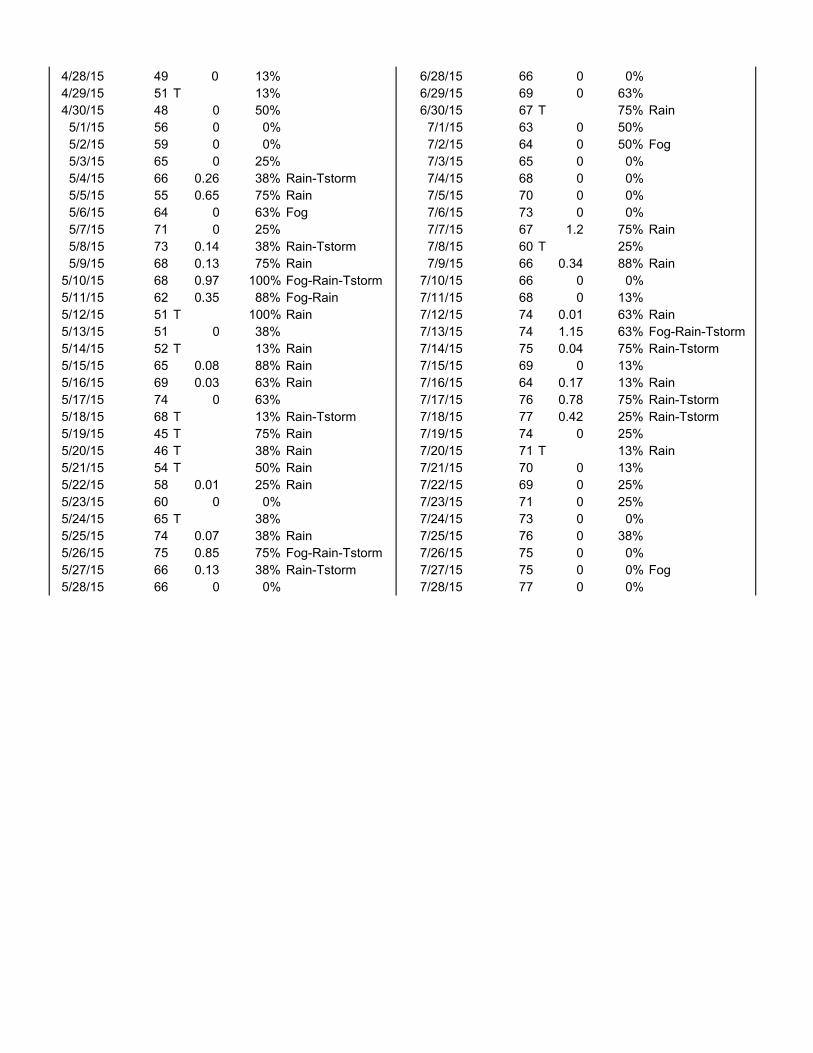
4/28/15 49 0 13% 6/28/15 66 0 0%4/29/15 51 T 13% 6/29/15 69 0 63%4/30/15 48 0 50% 6/30/15 67 T 75% Rain5/1/15 56 0 0% 7/1/15 63 0 50%5/2/15 59 0 0% 7/2/15 64 0 50% Fog5/3/15 65 0 25% 7/3/15 65 0 0%5/4/15 66 0.26 38% Rain-Tstorm 7/4/15 68 0 0%5/5/15 55 0.65 75% Rain 7/5/15 70 0 0%5/6/15 64 0 63% Fog 7/6/15 73 0 0%5/7/15 71 0 25% 7/7/15 67 1.2 75% Rain5/8/15 73 0.14 38% Rain-Tstorm 7/8/15 60 T 25%5/9/15 68 0.13 75% Rain 7/9/15 66 0.34 88% Rain5/10/15 68 0.97 100% Fog-Rain-Tstorm 7/10/15 66 0 0%5/11/15 62 0.35 88% Fog-Rain 7/11/15 68 0 13%5/12/15 51 T 100% Rain 7/12/15 74 0.01 63% Rain5/13/15 51 0 38% 7/13/15 74 1.15 63% Fog-Rain-Tstorm5/14/15 52 T 13% Rain 7/14/15 75 0.04 75% Rain-Tstorm5/15/15 65 0.08 88% Rain 7/15/15 69 0 13%5/16/15 69 0.03 63% Rain 7/16/15 64 0.17 13% Rain5/17/15 74 0 63% 7/17/15 76 0.78 75% Rain-Tstorm5/18/15 68 T 13% Rain-Tstorm 7/18/15 77 0.42 25% Rain-Tstorm5/19/15 45 T 75% Rain 7/19/15 74 0 25%5/20/15 46 T 38% Rain 7/20/15 71 T 13% Rain5/21/15 54 T 50% Rain 7/21/15 70 0 13%5/22/15 58 0.01 25% Rain 7/22/15 69 0 25%5/23/15 60 0 0% 7/23/15 71 0 25%5/24/15 65 T 38% 7/24/15 73 0 0%5/25/15 74 0.07 38% Rain 7/25/15 76 0 38%5/26/15 75 0.85 75% Fog-Rain-Tstorm 7/26/15 75 0 0%5/27/15 66 0.13 38% Rain-Tstorm 7/27/15 75 0 0% Fog5/28/15 66 0 0% 7/28/15 77 0 0%
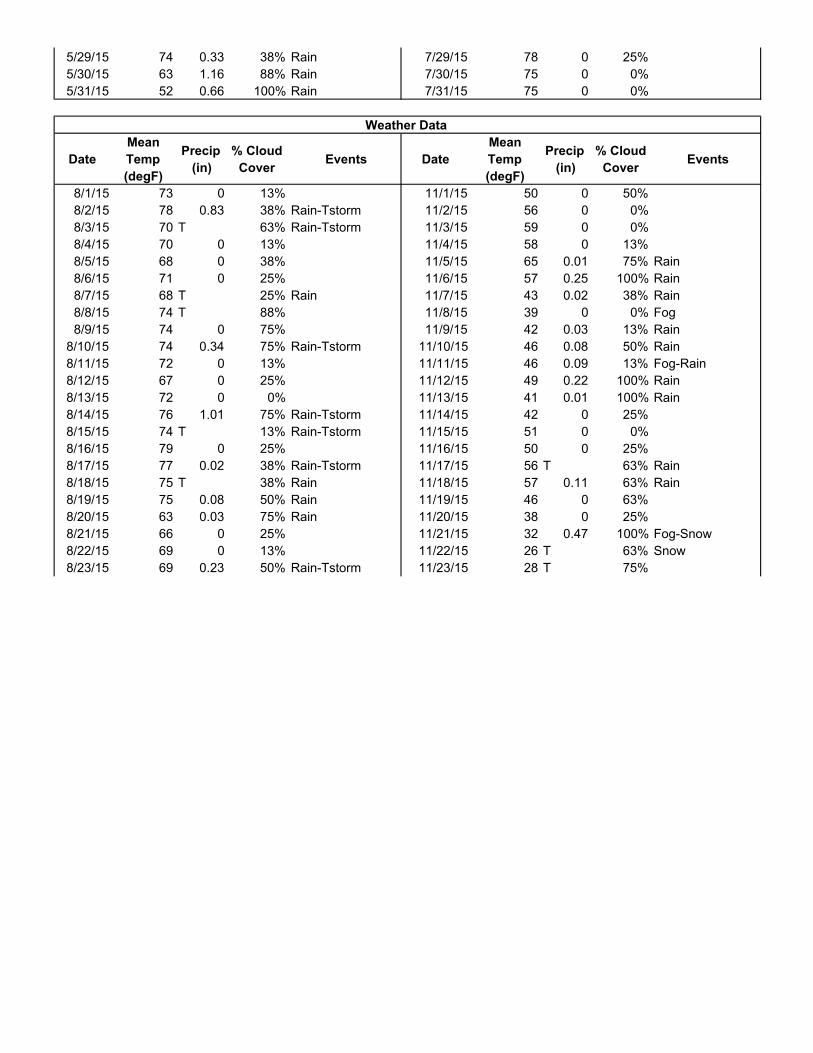
5/29/15 74 0.33 38% Rain 7/29/15 78 0 25%5/30/15 63 1.16 88% Rain 7/30/15 75 0 0%5/31/15 52 0.66 100% Rain 7/31/15 75 0 0%
DateMean Temp (degF)
Precip (in)
% Cloud Cover Events Date
Mean Temp (degF)
Precip (in)
% Cloud Cover Events
8/1/15 73 0 13% 11/1/15 50 0 50%8/2/15 78 0.83 38% Rain-Tstorm 11/2/15 56 0 0%8/3/15 70 T 63% Rain-Tstorm 11/3/15 59 0 0%8/4/15 70 0 13% 11/4/15 58 0 13%8/5/15 68 0 38% 11/5/15 65 0.01 75% Rain8/6/15 71 0 25% 11/6/15 57 0.25 100% Rain8/7/15 68 T 25% Rain 11/7/15 43 0.02 38% Rain8/8/15 74 T 88% 11/8/15 39 0 0% Fog8/9/15 74 0 75% 11/9/15 42 0.03 13% Rain8/10/15 74 0.34 75% Rain-Tstorm 11/10/15 46 0.08 50% Rain8/11/15 72 0 13% 11/11/15 46 0.09 13% Fog-Rain8/12/15 67 0 25% 11/12/15 49 0.22 100% Rain8/13/15 72 0 0% 11/13/15 41 0.01 100% Rain8/14/15 76 1.01 75% Rain-Tstorm 11/14/15 42 0 25%8/15/15 74 T 13% Rain-Tstorm 11/15/15 51 0 0%8/16/15 79 0 25% 11/16/15 50 0 25%8/17/15 77 0.02 38% Rain-Tstorm 11/17/15 56 T 63% Rain8/18/15 75 T 38% Rain 11/18/15 57 0.11 63% Rain8/19/15 75 0.08 50% Rain 11/19/15 46 0 63%8/20/15 63 0.03 75% Rain 11/20/15 38 0 25%8/21/15 66 0 25% 11/21/15 32 0.47 100% Fog-Snow8/22/15 69 0 13% 11/22/15 26 T 63% Snow8/23/15 69 0.23 50% Rain-Tstorm 11/23/15 28 T 75%
Weather Data
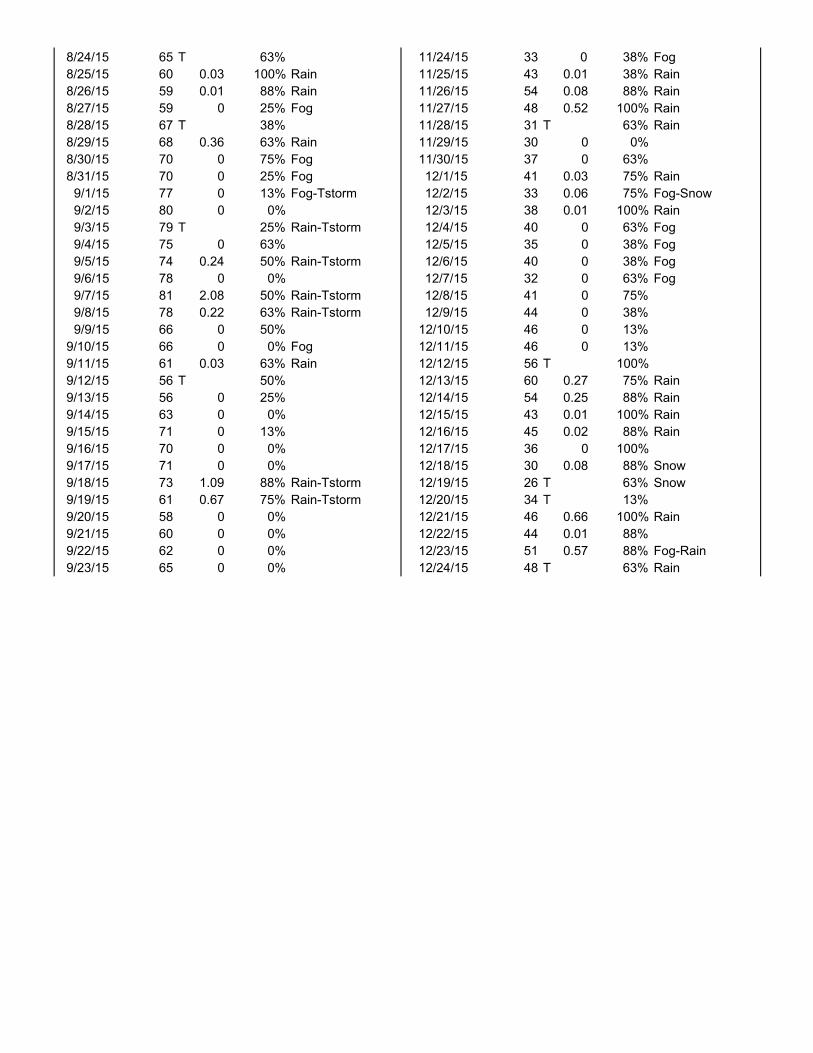
8/24/15 65 T 63% 11/24/15 33 0 38% Fog8/25/15 60 0.03 100% Rain 11/25/15 43 0.01 38% Rain8/26/15 59 0.01 88% Rain 11/26/15 54 0.08 88% Rain8/27/15 59 0 25% Fog 11/27/15 48 0.52 100% Rain8/28/15 67 T 38% 11/28/15 31 T 63% Rain8/29/15 68 0.36 63% Rain 11/29/15 30 0 0%8/30/15 70 0 75% Fog 11/30/15 37 0 63%8/31/15 70 0 25% Fog 12/1/15 41 0.03 75% Rain9/1/15 77 0 13% Fog-Tstorm 12/2/15 33 0.06 75% Fog-Snow9/2/15 80 0 0% 12/3/15 38 0.01 100% Rain9/3/15 79 T 25% Rain-Tstorm 12/4/15 40 0 63% Fog9/4/15 75 0 63% 12/5/15 35 0 38% Fog9/5/15 74 0.24 50% Rain-Tstorm 12/6/15 40 0 38% Fog9/6/15 78 0 0% 12/7/15 32 0 63% Fog9/7/15 81 2.08 50% Rain-Tstorm 12/8/15 41 0 75%9/8/15 78 0.22 63% Rain-Tstorm 12/9/15 44 0 38%9/9/15 66 0 50% 12/10/15 46 0 13%9/10/15 66 0 0% Fog 12/11/15 46 0 13%9/11/15 61 0.03 63% Rain 12/12/15 56 T 100%9/12/15 56 T 50% 12/13/15 60 0.27 75% Rain9/13/15 56 0 25% 12/14/15 54 0.25 88% Rain9/14/15 63 0 0% 12/15/15 43 0.01 100% Rain9/15/15 71 0 13% 12/16/15 45 0.02 88% Rain9/16/15 70 0 0% 12/17/15 36 0 100%9/17/15 71 0 0% 12/18/15 30 0.08 88% Snow9/18/15 73 1.09 88% Rain-Tstorm 12/19/15 26 T 63% Snow9/19/15 61 0.67 75% Rain-Tstorm 12/20/15 34 T 13%9/20/15 58 0 0% 12/21/15 46 0.66 100% Rain9/21/15 60 0 0% 12/22/15 44 0.01 88%9/22/15 62 0 0% 12/23/15 51 0.57 88% Fog-Rain9/23/15 65 0 0% 12/24/15 48 T 63% Rain
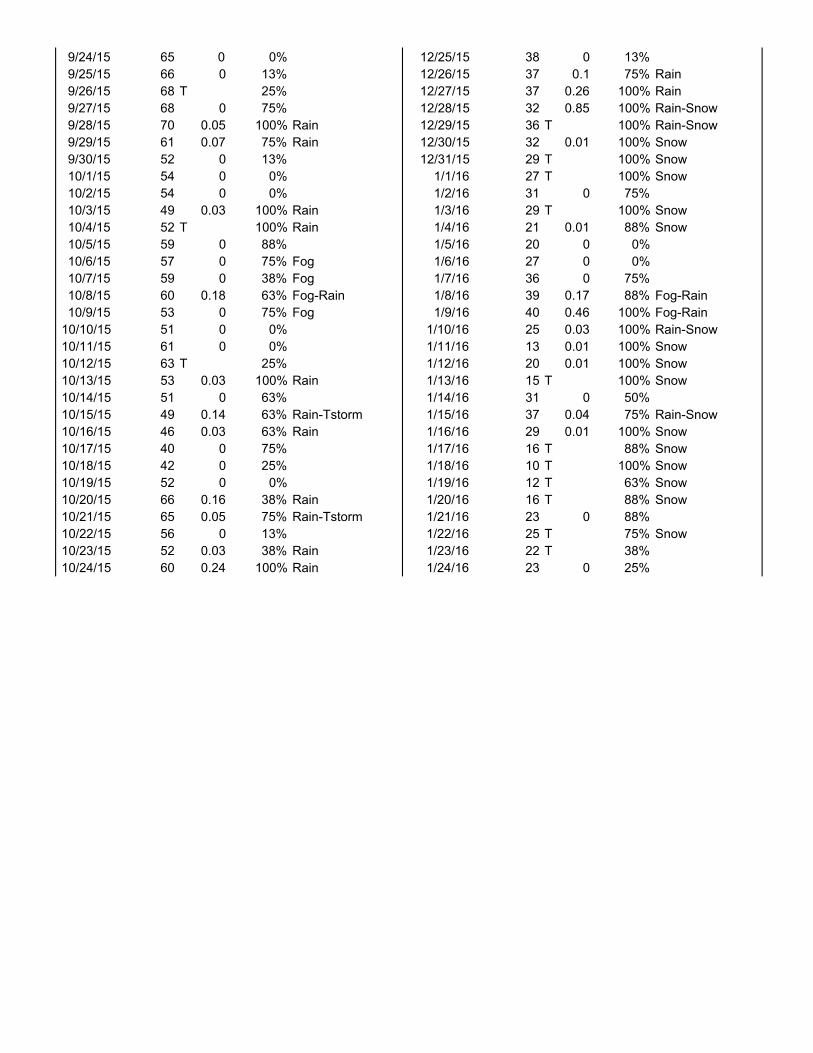
9/24/15 65 0 0% 12/25/15 38 0 13%9/25/15 66 0 13% 12/26/15 37 0.1 75% Rain9/26/15 68 T 25% 12/27/15 37 0.26 100% Rain9/27/15 68 0 75% 12/28/15 32 0.85 100% Rain-Snow9/28/15 70 0.05 100% Rain 12/29/15 36 T 100% Rain-Snow9/29/15 61 0.07 75% Rain 12/30/15 32 0.01 100% Snow9/30/15 52 0 13% 12/31/15 29 T 100% Snow10/1/15 54 0 0% 1/1/16 27 T 100% Snow10/2/15 54 0 0% 1/2/16 31 0 75%10/3/15 49 0.03 100% Rain 1/3/16 29 T 100% Snow10/4/15 52 T 100% Rain 1/4/16 21 0.01 88% Snow10/5/15 59 0 88% 1/5/16 20 0 0%10/6/15 57 0 75% Fog 1/6/16 27 0 0%10/7/15 59 0 38% Fog 1/7/16 36 0 75%10/8/15 60 0.18 63% Fog-Rain 1/8/16 39 0.17 88% Fog-Rain10/9/15 53 0 75% Fog 1/9/16 40 0.46 100% Fog-Rain10/10/15 51 0 0% 1/10/16 25 0.03 100% Rain-Snow10/11/15 61 0 0% 1/11/16 13 0.01 100% Snow10/12/15 63 T 25% 1/12/16 20 0.01 100% Snow10/13/15 53 0.03 100% Rain 1/13/16 15 T 100% Snow10/14/15 51 0 63% 1/14/16 31 0 50%10/15/15 49 0.14 63% Rain-Tstorm 1/15/16 37 0.04 75% Rain-Snow10/16/15 46 0.03 63% Rain 1/16/16 29 0.01 100% Snow10/17/15 40 0 75% 1/17/16 16 T 88% Snow10/18/15 42 0 25% 1/18/16 10 T 100% Snow10/19/15 52 0 0% 1/19/16 12 T 63% Snow10/20/15 66 0.16 38% Rain 1/20/16 16 T 88% Snow10/21/15 65 0.05 75% Rain-Tstorm 1/21/16 23 0 88%10/22/15 56 0 13% 1/22/16 25 T 75% Snow10/23/15 52 0.03 38% Rain 1/23/16 22 T 38%10/24/15 60 0.24 100% Rain 1/24/16 23 0 25%

10/25/15 50 0.01 25% Rain 1/25/16 34 0.01 50% Rain10/26/15 48 0 0% 1/26/16 35 0.02 100% Rain-Snow10/27/15 51 0.05 25% Rain 1/27/16 27 T 88% Snow10/28/15 51 0.63 100% Rain 1/28/16 32 0.04 100% Rain-Snow10/29/15 41 T 100% Rain-Snow 1/29/16 28 T 63% Snow10/30/15 43 T 50% Fog-Rain 1/30/16 39 0 0%10/31/15 48 0.46 88% Rain 1/31/16 44 0.07 88% Rain
Date Mean Temp
Precip (in)
% Cloud Cover Events
2/1/16 35 0 63%2/2/16 32 0.24 63% Rain-Tstorm2/3/16 37 0.08 100% Fog-Rain-Snow2/4/16 25 0.02 88% Snow2/5/16 27 0.01 75% Snow2/6/16 28 0 38%2/7/16 38 0 50%2/8/16 32 0.01 75% Snow2/9/16 27 0.02 100% Snow2/10/16 18 T 100% Snow2/11/16 16 T 88% Snow2/12/16 15 T 88% Snow2/13/16 6 T 88% Snow2/14/16 9 T 63% Snow2/15/16 22 0.01 100% Snow2/16/16 30 0.02 100% Snow2/17/16 23 0 75%2/18/16 21 0 13%2/19/16 50 0 50%2/20/16 46 0 0%
Weather Data
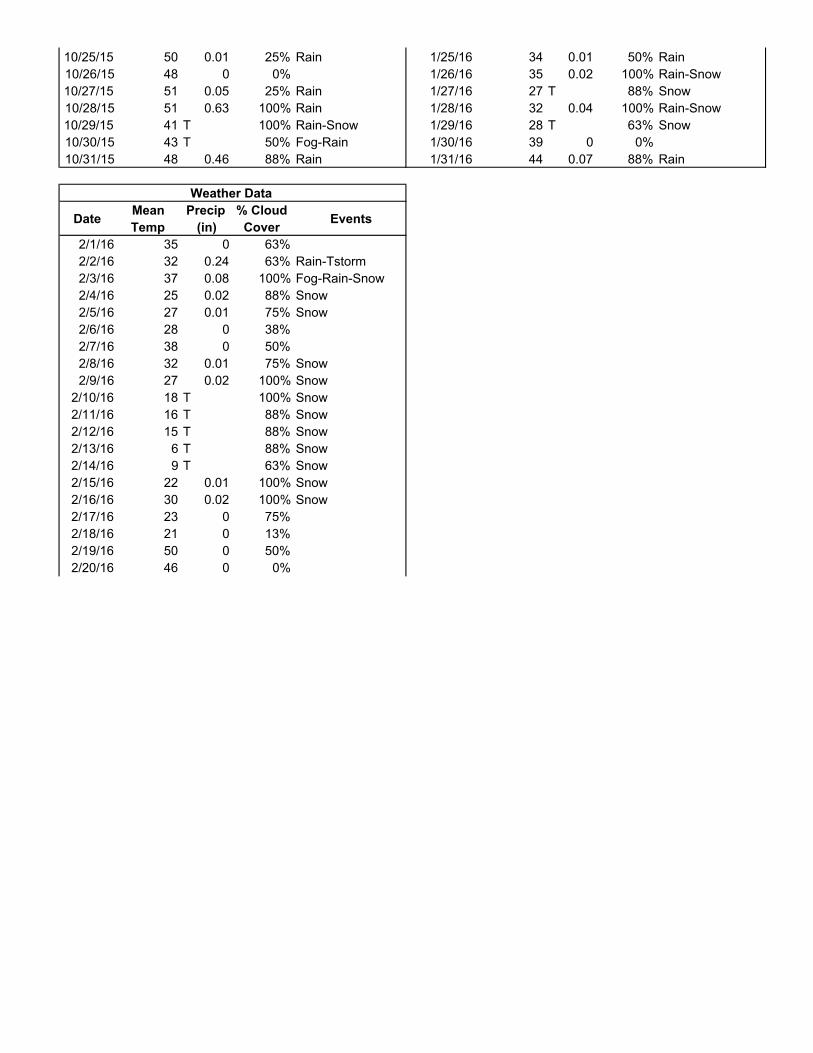
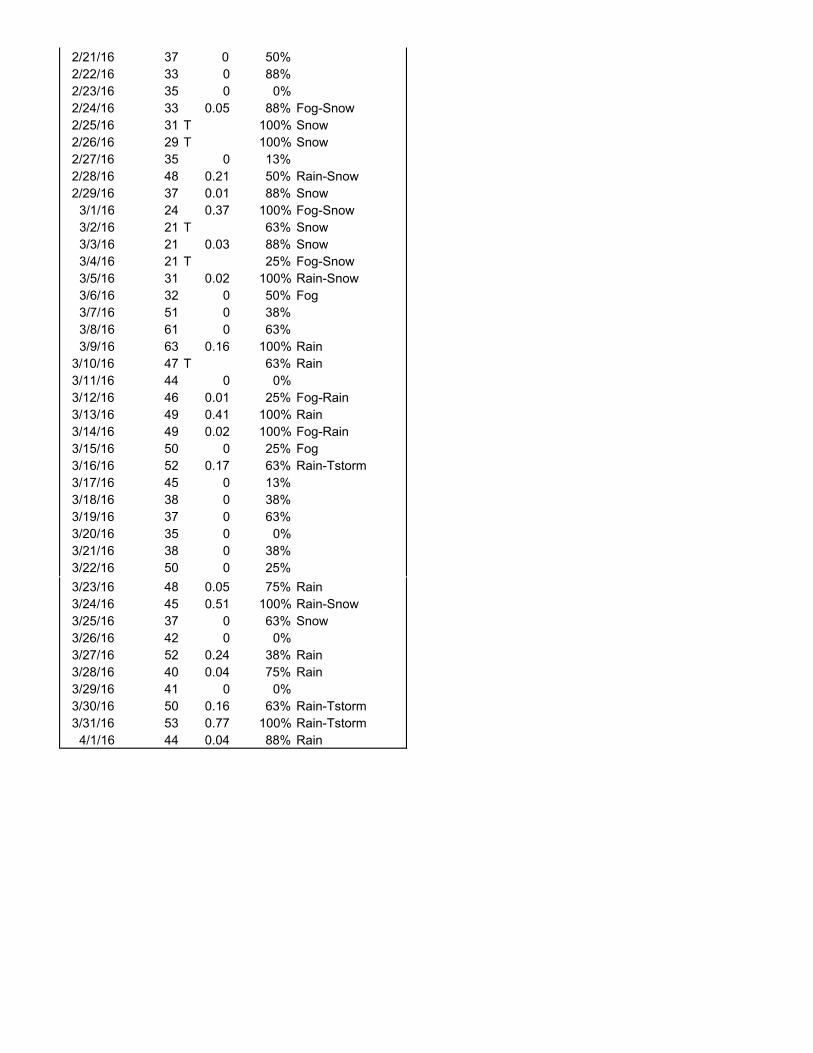
2/21/16 37 0 50%2/22/16 33 0 88%2/23/16 35 0 0%2/24/16 33 0.05 88% Fog-Snow2/25/16 31 T 100% Snow2/26/16 29 T 100% Snow2/27/16 35 0 13%2/28/16 48 0.21 50% Rain-Snow2/29/16 37 0.01 88% Snow3/1/16 24 0.37 100% Fog-Snow3/2/16 21 T 63% Snow3/3/16 21 0.03 88% Snow3/4/16 21 T 25% Fog-Snow3/5/16 31 0.02 100% Rain-Snow3/6/16 32 0 50% Fog3/7/16 51 0 38%3/8/16 61 0 63%3/9/16 63 0.16 100% Rain3/10/16 47 T 63% Rain3/11/16 44 0 0%3/12/16 46 0.01 25% Fog-Rain3/13/16 49 0.41 100% Rain3/14/16 49 0.02 100% Fog-Rain3/15/16 50 0 25% Fog3/16/16 52 0.17 63% Rain-Tstorm3/17/16 45 0 13%3/18/16 38 0 38%3/19/16 37 0 63%3/20/16 35 0 0%3/21/16 38 0 38%3/22/16 50 0 25%3/23/16 48 0.05 75% Rain3/24/16 45 0.51 100% Rain-Snow3/25/16 37 0 63% Snow3/26/16 42 0 0%3/27/16 52 0.24 38% Rain3/28/16 40 0.04 75% Rain3/29/16 41 0 0%3/30/16 50 0.16 63% Rain-Tstorm3/31/16 53 0.77 100% Rain-Tstorm4/1/16 44 0.04 88% Rain