Embed Size (px)
Citation preview
Leveraging digital tools and shared digital assets to address rural
water security in India
March 2021
Learnings from use case interviews
1
Ashoka Trust for Research in Ecology and the Environment (ATREE)
Centre for Social and Environmental Innovation (CSEI)
Ashoka Trust for Research in Ecology and the Environment (ATREE) is a global non-profit organisation which generates interdisciplinary knowledge to inform policy and practice in the areas of conservation and sustainability.
ATREE envisions a society committed to environmental conservation, and sustainable and socially just development.
For over two decades, ATREE has worked on issues like biodiversity and conservation, climate change mitigation and development, land and water resources, forests and governance, and ecosystem services and human well-being.
ATREE has consistently ranked in the top 20 Environment and Water Security think-tanks in the world.
ATREE’s Centre for Social and Environmental Innovation (CSEI) aims to translate research to enhance human well-being, while also conserving the natural environment.
CSEI aims to co-create scalable solutions working with partners. We hope to build impact ecosystems to address the problems we work on.
Our solutions are rooted in scientific research. CSEI currently focuses on three problems: water & foods, invasive plant species, and climate resilient/green cities.
The Centre’s focus is on empowering the ‘first mile’- in their role as citizens, producers, or consumers. Our goal is to enable a transition to a more sustainable and fair system.
CONTEXT INSIGHTS SOLUTIONS ANNEXUREOVERVIEW
2
About India Climate Collaborative
The India Climate Collaborative (ICC) is a first-of-its kind India-led, India-focused initiative bringing together leading private and corporate philanthropies to enable a collective response to climate change in India.
The ICC seeks to connect and strengthen the Indian climate community, build a compelling India-focused climate narrative, and drive solutions that help people and nature thrive.
Mandated to amplify and spread local solutions, ICC aims to inspire and connect governments, businesses, impact investors, research institutions and civil society to work together to solve India’s climate crisis with the support of the international climate community.
CONTEXT INSIGHTS SOLUTIONS ANNEXUREOVERVIEW
3
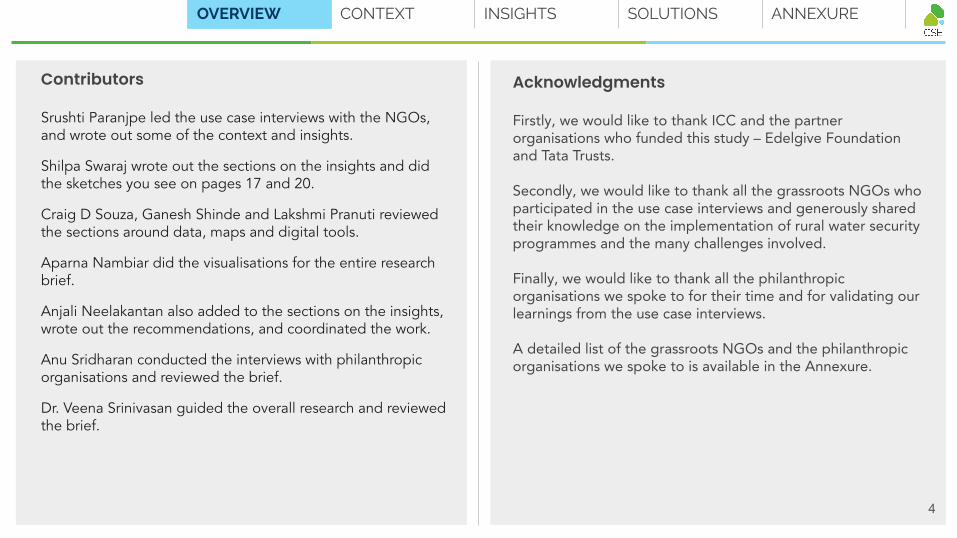
Acknowledgments
Firstly, we would like to thank ICC and the partner organisations who funded this study – Edelgive Foundation and Tata Trusts.
Secondly, we would like to thank all the grassroots NGOs who participated in the use case interviews and generously shared their knowledge on the implementation of rural water security programmes and the many challenges involved.
Finally, we would like to thank all the philanthropic organisations we spoke to for their time and for validating our learnings from the use case interviews.
A detailed list of the grassroots NGOs and the philanthropic organisations we spoke to is available in the Annexure.
CONTEXT INSIGHTS SOLUTIONS ANNEXUREOVERVIEW
4
Contributors
Srushti Paranjpe led the use case interviews with the NGOs, and wrote out some of the context and insights.
Shilpa Swaraj wrote out the sections on the insights and did the sketches you see on pages 17 and 20.
Craig D Souza, Ganesh Shinde and Lakshmi Pranuti reviewed the sections around data, maps and digital tools.
Aparna Nambiar did the visualisations for the entire research brief.
Anjali Neelakantan also added to the sections on the insights, wrote out the recommendations, and coordinated the work.
Anu Sridharan conducted the interviews with philanthropic organisations and reviewed the brief.
Dr. Veena Srinivasan guided the overall research and reviewed the brief.
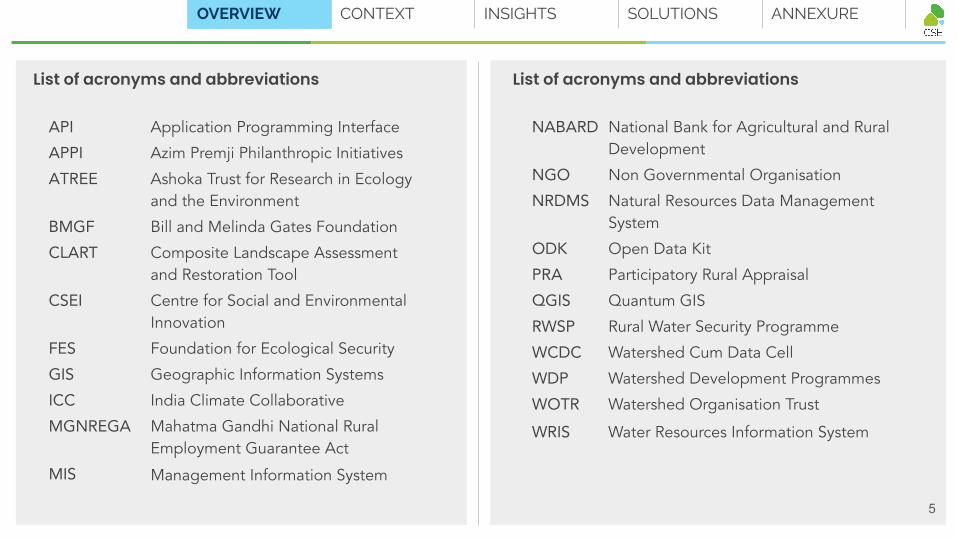
NABARD National Bank for Agricultural and Rural Development
NGO Non Governmental Organisation
NRDMS Natural Resources Data Management System
ODK Open Data Kit
PRA Participatory Rural Appraisal
QGIS Quantum GIS
RWSP Rural Water Security Programme
WCDC Watershed Cum Data Cell
WDP Watershed Development Programmes
WOTR Watershed Organisation Trust
WRIS Water Resources Information System
API Application Programming Interface
APPI Azim Premji Philanthropic Initiatives
ATREE Ashoka Trust for Research in Ecology and the Environment
BMGF Bill and Melinda Gates Foundation
CLART Composite Landscape Assessment and Restoration Tool
CSEI Centre for Social and Environmental Innovation
FES Foundation for Ecological Security
GIS Geographic Information Systems
ICC India Climate Collaborative
MGNREGA Mahatma Gandhi National Rural Employment Guarantee Act
MIS Management Information System
List of acronyms and abbreviations List of acronyms and abbreviations
CONTEXT INSIGHTS SOLUTIONS ANNEXUREOVERVIEW
5
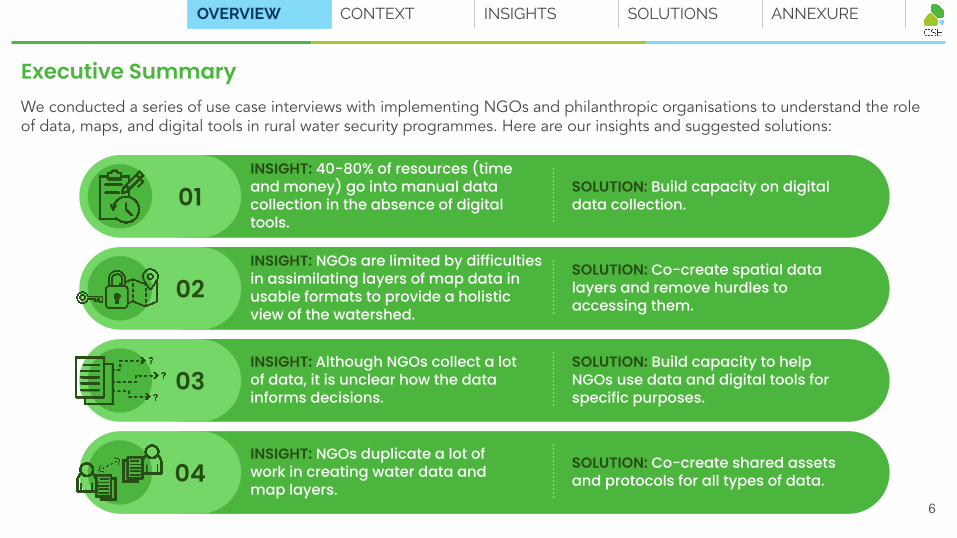
Executive SummaryWe conducted a series of use case interviews with implementing NGOs and philanthropic organisations to understand the role of data, maps, and digital tools in rural water security programmes. Here are our insights and suggested solutions:
SOLUTION: Co-create shared assets and protocols for all types of data.
INSIGHT: NGOs duplicate a lot of work in creating water data and map layers.
04
SOLUTION: Build capacity to help NGOs use data and digital tools for specific purposes.
INSIGHT: Although NGOs collect a lot of data, it is unclear how the data informs decisions.
03
SOLUTION: Co-create spatial data layers and remove hurdles to accessing them.
INSIGHT: NGOs are limited by difficulties in assimilating layers of map data in usable formats to provide a holistic view of the watershed.
02
SOLUTION: Build capacity on digital data collection.
INSIGHT: 40-80% of resources (time and money) go into manual data collection in the absence of digital tools.
01
CONTEXT INSIGHTS SOLUTIONS ANNEXUREOVERVIEW
6
CONTEXT
7
Rural India faces a water security crisis.
To tackle the rural water crisis, many agencies have implemented a number of Rural Water Security Programmes (RWSPs). These programmes focus on maximising farmer income and agricultural productivity. The role of climate change in the variability of monsoon rainfall over India is not clear.4 Crop-climate relationships in India are also confounded by other biophysical and socio-economic components,5 which makes it difficult to build consensus around climate action.Hence, building climate resilience has not been a focus of RWSPs.
Of the 160 million ha of India’s arable land, 54% is rain-fed.2 The majority of cultivated land requires irrigation and massive extraction of groundwater. Over the last 15 years, excessive groundwater extraction has resulted in a 61% decline in water levels in wells in India.1 This has reduced water availability for some farmers and/or made it expensive to get and use water. Groundwater depletion has reduced farmer’s buffers against climate variability. Water use is also highly inequitable. For instance, sugarcane uses about 70% of Marathwada’s irrigation water despite covering a mere 4% of cultivated land.3
Thus, water for agriculture is scarce, fast depleting and distributed in highly skewed and inequitable ways.
CONTEXT INSIGHTS SOLUTIONS ANNEXUREOVERVIEW
8
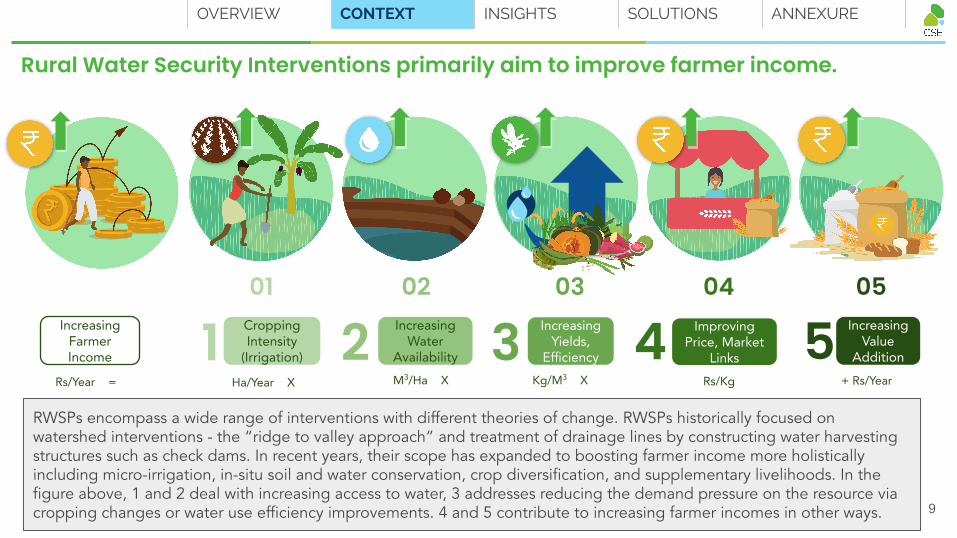
In India, agriculture is important in terms of ● Livelihoods: over 50% of
the population is dependent on agriculture and allied activities.1
● Economy: contributes over 15% to the GDP.1
● Water usage: consumes over 80% of the total water available in the country.2
Increasing Water
Availability
M3/Ha X
IncreasingFarmer Income
Rs/Year =
Cropping Intensity
(Irrigation)
Ha/Year X
Increasing Yields,
Efficiency
Kg/M3 X
Improving Price, Market
Links
Rs/Kg
Increasing Value
Addition
+ Rs/Year
CONTEXT INSIGHTS SOLUTIONS ANNEXUREOVERVIEW
01 02 03 04 05
1 2 3 4 5
9
RWSPs encompass a wide range of interventions with different theories of change. RWSPs historically focused on watershed interventions - the “ridge to valley approach” and treatment of drainage lines by constructing water harvesting structures such as check dams. In recent years, their scope has expanded to boosting farmer income more holistically including micro-irrigation, in-situ soil and water conservation, crop diversification, and supplementary livelihoods. In the figure above, 1 and 2 deal with increasing access to water, 3 addresses reducing the demand pressure on the resource via cropping changes or water use efficiency improvements. 4 and 5 contribute to increasing farmer incomes in other ways.
Rural Water Security Interventions primarily aim to improve farmer income.
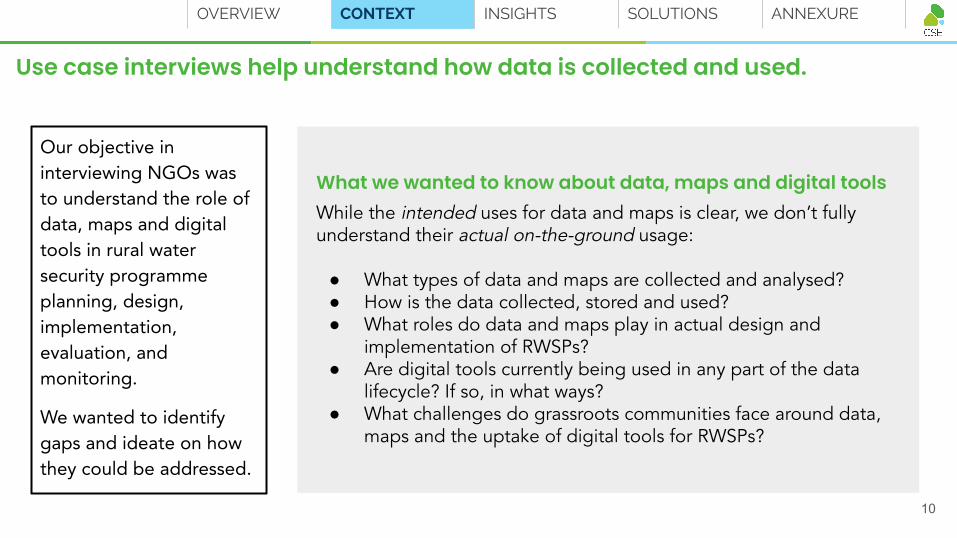
What we wanted to know about data, maps and digital toolsWhile the intended uses for data and maps is clear, we don’t fully understand their actual on-the-ground usage:
● What types of data and maps are collected and analysed? ● How is the data collected, stored and used? ● What roles do data and maps play in actual design and
implementation of RWSPs? ● Are digital tools currently being used in any part of the data
lifecycle? If so, in what ways? ● What challenges do grassroots communities face around data,
maps and the uptake of digital tools for RWSPs?
CONTEXT INSIGHTS SOLUTIONS ANNEXUREOVERVIEW
10
Use case interviews help understand how data is collected and used.
Our objective in interviewing NGOs was to understand the role of data, maps and digital tools in rural water security programme planning, design, implementation, evaluation, and monitoring.
We wanted to identify gaps and ideate on how they could be addressed.

INSIGHTS
11
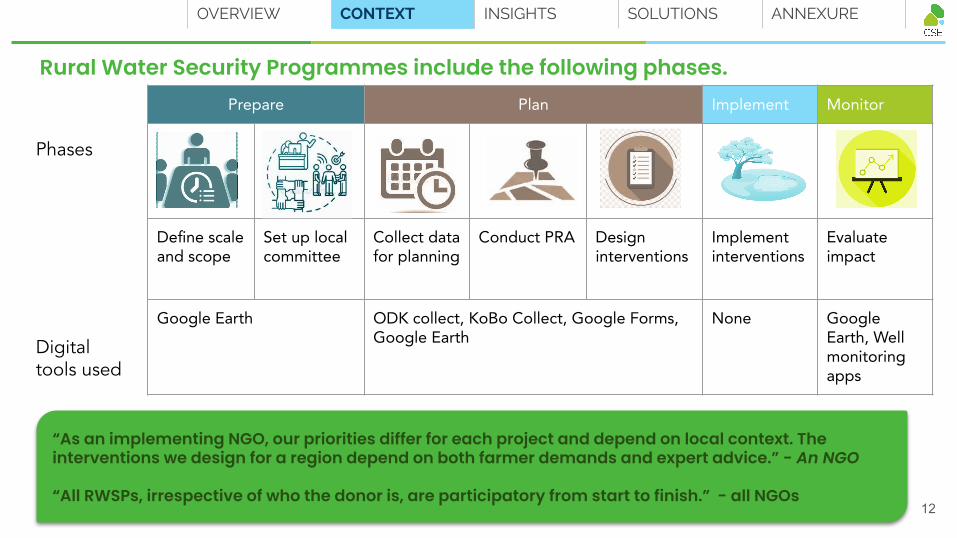
Prepare Plan Implement Monitor
Define scale and scope
Set up local committee
Collect data for planning
Conduct PRA Design interventions
Implement interventions
Evaluate impact
Google Earth ODK collect, KoBo Collect, Google Forms, Google Earth
None Google Earth, Well monitoring apps
Rural Water Security Programmes include the following phases.
CONTEXT INSIGHTS SOLUTIONS ANNEXUREOVERVIEW
“As an implementing NGO, our priorities differ for each project and depend on local context. The interventions we design for a region depend on both farmer demands and expert advice.” - An NGO
“All RWSPs, irrespective of who the donor is, are participatory from start to finish.” - all NGOs12
Phases
Digital tools used
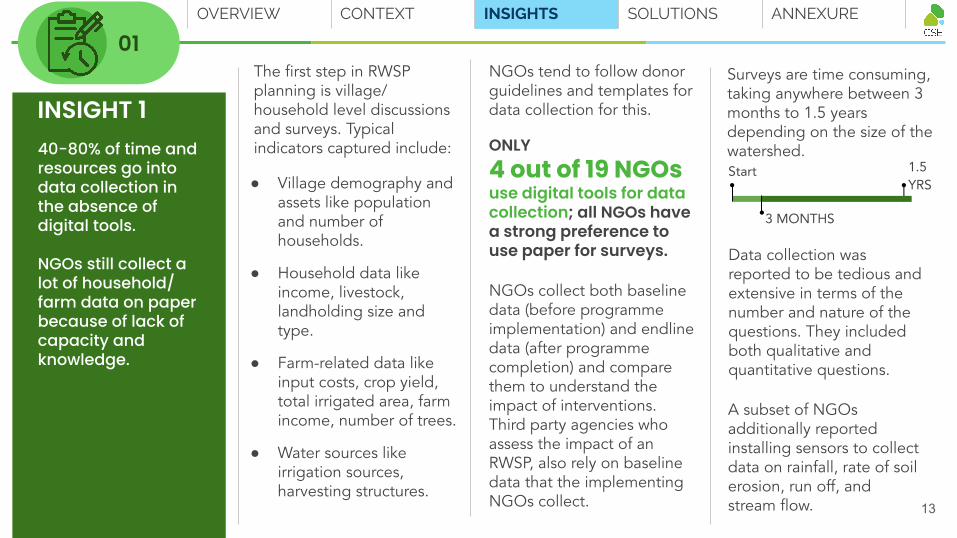
ONLY4 out of 19 NGOsuse digital tools for data collection; all NGOs have a strong preference to use paper for surveys.
INSIGHT 1The first step in RWSP planning is village/ household level discussions and surveys. Typical indicators captured include:
● Village demography and assets like population and number of households.
● Household data like income, livestock, landholding size and type.
● Farm-related data like input costs, crop yield, total irrigated area, farm income, number of trees.
● Water sources like irrigation sources, harvesting structures.
Surveys are time consuming, taking anywhere between 3 months to 1.5 years depending on the size of the watershed.40-80% of time and
resources go into data collection in the absence of digital tools.
NGOs still collect a lot of household/ farm data on paper because of lack of capacity and knowledge.
NGOs collect both baseline data (before programme implementation) and endline data (after programme completion) and compare them to understand the impact of interventions. Third party agencies who assess the impact of an RWSP, also rely on baseline data that the implementing NGOs collect.
Data collection was reported to be tedious and extensive in terms of the number and nature of the questions. They included both qualitative and quantitative questions.
1.5 YRS
Start
3 MONTHS
CONTEXT INSIGHTS SOLUTIONS ANNEXUREOVERVIEW
13
NGOs tend to follow donor guidelines and templates for data collection for this.
A subset of NGOs additionally reported installing sensors to collect data on rainfall, rate of soil erosion, run off, and stream flow.
01
Most NGOs seem to prefer paper-based surveys. NGOs reported two reasons for this strong preference:
1) Lack of capacity and knowledge among surveyors: teams that conduct these household/farm surveys also include individuals from within the community. They often have no experience with conducting surveys and require trainings, which is time-consuming.
2) Fear of information loss and comfort with legacy systems:
Data collection tools that NGOs use
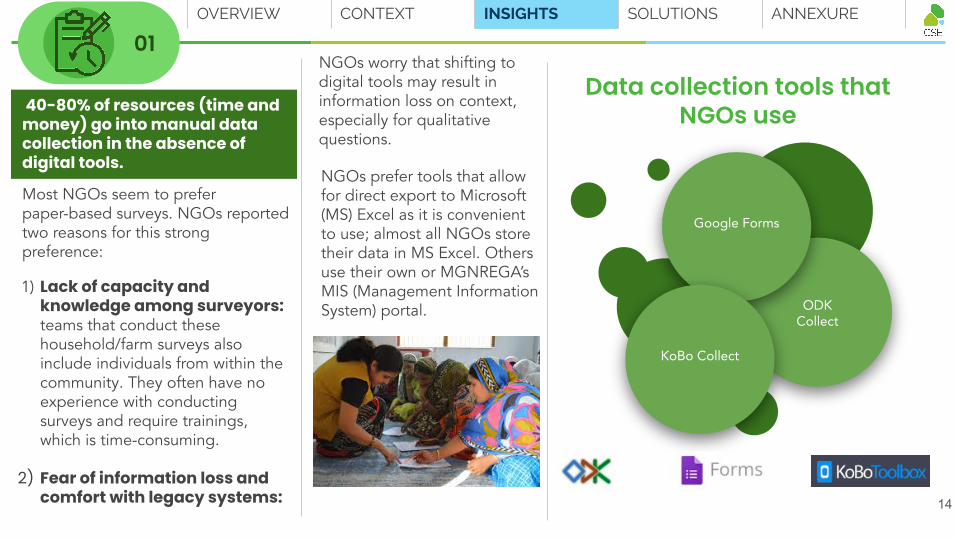
NGOs prefer tools that allow for direct export to Microsoft (MS) Excel as it is convenient to use; almost all NGOs store their data in MS Excel. Others use their own or MGNREGA’s MIS (Management Information System) portal.
NGOs worry that shifting to digital tools may result in information loss on context, especially for qualitative questions.
ODK Collect
Google Forms
KoBo Collect
CONTEXT INSIGHTS SOLUTIONS ANNEXUREOVERVIEW
14
40-80% of resources (time and money) go into manual data collection in the absence of digital tools.
01
Most NGOs reported use of mobile smart phones in rural areas, indicating that there is a ready audience for wider use of mobile applications in rural water security programmes.
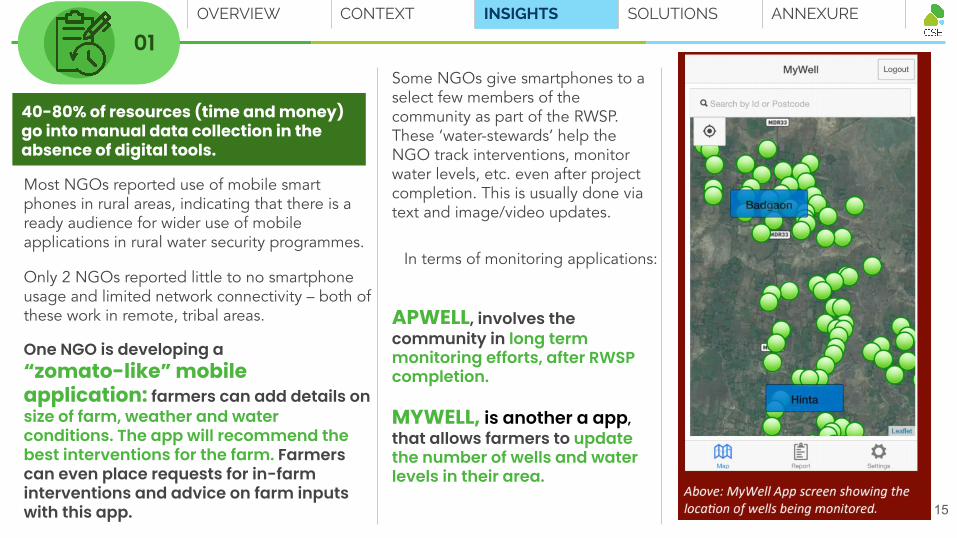
Only 2 NGOs reported little to no smartphone usage and limited network connectivity – both of these work in remote, tribal areas. APWELL, involves the
community in long term monitoring efforts, after RWSP completion.
MYWELL, is another a app, that allows farmers to update the number of wells and water levels in their area.
CONTEXT INSIGHTS SOLUTIONS ANNEXUREOVERVIEW
One NGO is developing a “zomato-like” mobile application: farmers can add details on size of farm, weather and water conditions. The app will recommend the best interventions for the farm. Farmers can even place requests for in-farm interventions and advice on farm inputs with this app. 15
Some NGOs give smartphones to a select few members of the community as part of the RWSP. These ‘water-stewards’ help the NGO track interventions, monitor water levels, etc. even after project completion. This is usually done via text and image/video updates.
In terms of monitoring applications:
40-80% of resources (time and money) go into manual data collection in the absence of digital tools.
01
Common map types used include:
● Cadastral maps● Topography sheets● Contour maps● Land Use/Land Cover● Hydrology maps● Drainage line maps
Primary sources of data for these maps: Bhuvan, Bhukosh, NRDMS.
ONLY4 out of 19 NGOsuse digital mapping tools for community engagement.
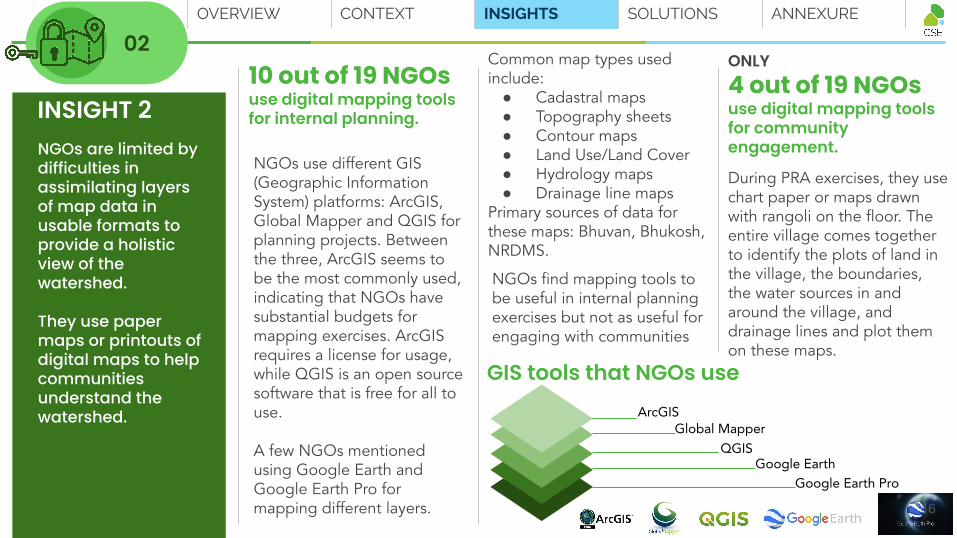
ArcGISGlobal Mapper
QGIS
Google Earth ProGoogle Earth
GIS tools that NGOs use
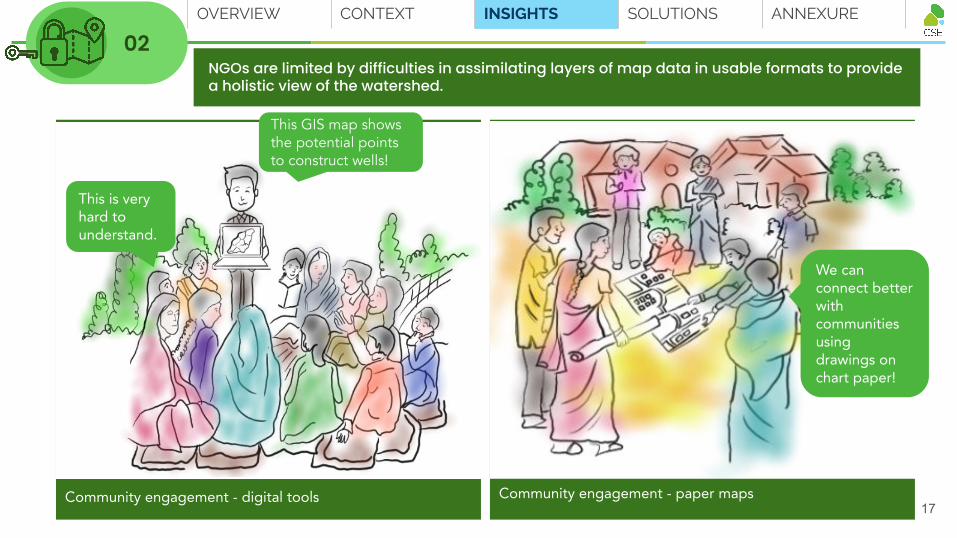
INSIGHT 2NGOs are limited by difficulties in assimilating layers of map data in usable formats to provide a holistic view of the watershed.
They use paper maps or printouts of digital maps to help communities understand the watershed.
NGOs use different GIS (Geographic Information System) platforms: ArcGIS, Global Mapper and QGIS for planning projects. Between the three, ArcGIS seems to be the most commonly used, indicating that NGOs have substantial budgets for mapping exercises. ArcGIS requires a license for usage, while QGIS is an open source software that is free for all to use.
A few NGOs mentioned using Google Earth and Google Earth Pro for mapping different layers.
During PRA exercises, they use chart paper or maps drawn with rangoli on the floor. The entire village comes together to identify the plots of land in the village, the boundaries, the water sources in and around the village, and drainage lines and plot them on these maps.
10 out of 19 NGOsuse digital mapping tools for internal planning.
NGOs find mapping tools to be useful in internal planning exercises but not as useful for engaging with communities
CONTEXT INSIGHTS SOLUTIONS ANNEXUREOVERVIEW
16
02
02
Community engagement - digital tools Community engagement - paper maps
This is very hard to understand.
This GIS map shows the potential points to construct wells!
We can connect better with communities using drawings on chart paper!
CONTEXT INSIGHTS SOLUTIONS ANNEXUREOVERVIEW
17
NGOs are limited by difficulties in assimilating layers of map data in usable formats to provide a holistic view of the watershed.
NGOs intend to use the data they collect in the following ways:
b) Intervention design
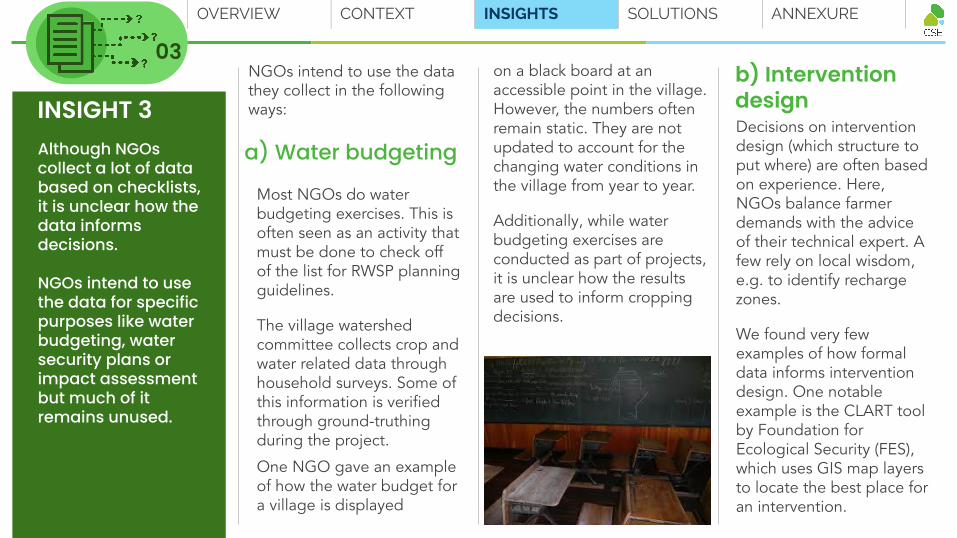
on a black board at an accessible point in the village. However, the numbers often remain static. They are not updated to account for the changing water conditions in the village from year to year.
Additionally, while water budgeting exercises are conducted as part of projects, it is unclear how the results are used to inform cropping decisions.
Most NGOs do water budgeting exercises. This is often seen as an activity that must be done to check off of the list for RWSP planning guidelines.
The village watershed committee collects crop and water related data through household surveys. Some of this information is verified through ground-truthing during the project.
Decisions on intervention design (which structure to put where) are often based on experience. Here, NGOs balance farmer demands with the advice of their technical expert. A few rely on local wisdom, e.g. to identify recharge zones.
We found very few examples of how formal data informs intervention design. One notable example is the CLART tool by Foundation for Ecological Security (FES), which uses GIS map layers to locate the best place for an intervention.
INSIGHT 3Although NGOs collect a lot of data based on checklists, it is unclear how the data informs decisions.
NGOs intend to use the data for specific purposes like water budgeting, water security plans or impact assessment but much of it remains unused.
One NGO gave an example of how the water budget for a village is displayed
CONTEXT INSIGHTS SOLUTIONS ANNEXUREOVERVIEW
a) Water budgeting
03
c) Impact evaluationEvaluating the impact of RWSPs is important to NGOs since it helps demonstrate the benefits of the RWSPs to the village. Some NGOs report that donors require external agencies to be hired for impact assessment of RWSPs, while some others carry out the evaluations themselves.
The timeline challenge:
The outcomes or direct benefits are typically measured 1-2 years after the completion of the project. However, the impact of many RWSP interventions is visible only years after implementation, according to experienced NGOs.
All NGOs collect baseline and endline data. But this is often not sufficient to assign attribution as there are a number of confounding factors. For example, one NGO built check dams in multiple places. They used Google Earth to identify changes in the surrounding greenery pre and post construction. However, they are unsure if the increase in greenery is due to the check dam or due to good rains in the 2-3 years preceding programme completion.
CONTEXT INSIGHTS SOLUTIONS ANNEXUREOVERVIEW
19
The hydrologic data challenge:
While household survey data is easily collected, other types of data are more difficult to obtain; for instance, spatial data; on ground, surface water quality and quantity. These involve technical skills, which both NGOs and impact assessment organisations lack.
Without scientific backing via data that track resource sustainability over time, there is a concern that the changes may not be sustainable as farmers change cropping over time.
The co-evolution challenge:
History suggests outcomes are not static. Farmers in turn change their cropping patterns when new water is made available. Thus even if groundwater levels rise initially, they may decline later, requiring a longer evaluation time frame.
The attribution challenge:
NGOs face some major challenges when assessing the impact of RWSP interventions.
Although NGOs collect a lot of data based on checklists, it is unclear how the data informs decisions.
03
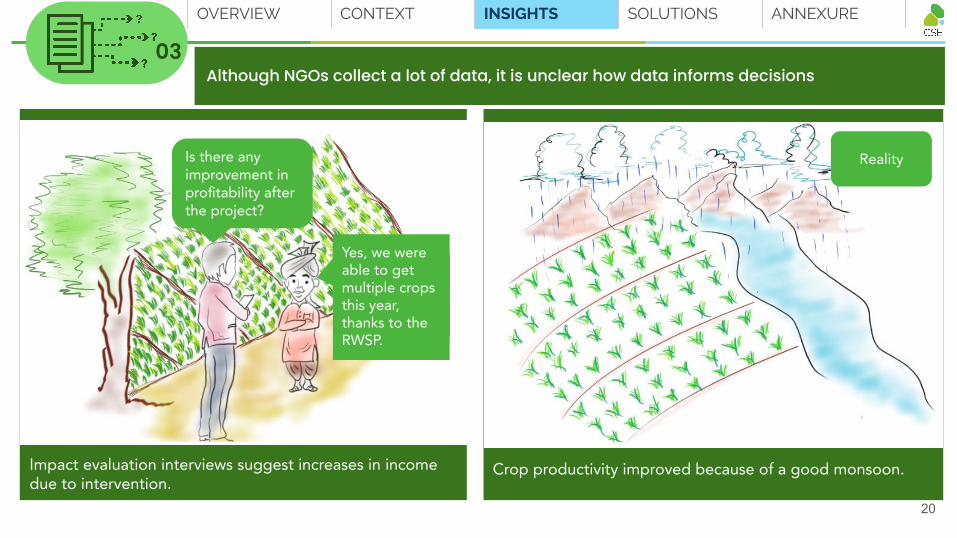
Is there any improvement in profitability after the project?
Yes, we were able to getmultiple crops this year, thanks to the RWSP.
Reality
Impact evaluation interviews suggest increases in income due to intervention.
Crop productivity improved because of a good monsoon.
CONTEXT INSIGHTS SOLUTIONS ANNEXUREOVERVIEW
20
Although NGOs collect a lot of data, it is unclear how data informs decisions03
NGOs are working in isolation, and this results in multiple challenges:
1. Lack of convergence – There are no shared assets or references for data collection and processing.
2. Lack of accountability – Since there are no external audits of data collected, the credibility of data is often questionable.
3. Lack of liquidity – There are no cross learnings between NGOs, preventing data collected in one programme to be useful for another programme in the same geographical area and/or for similar interventions.
4. Lack of participation - There are not enough NGOs participating in collective learning. Platforms either don’t exist or have not offered the necessary conditions for NGOs to interact.
INSIGHT 4NGOs duplicate a lot of work in creating water data.
This results in loss of time, money and opportunity for cross learning.
CONTEXT INSIGHTS SOLUTIONS ANNEXUREOVERVIEW
21
These challenges have been echoed by the philanthropic community as well. Philanthropic organisations also have varied data across different grassroots communities, indicators, geographical units and templates. This makes it difficult to make cross-programme comparisons. For example, one of the organisations spoke about how Human Development Indicators (HDI) were available for some districts but not others.
Hence, there is a strong need for more collaborative work in the water ecosystem through platforms with shared protocols and formats that can host all maps and data in one place. This will avoid duplication of effort and offer significant savings in time and resources to the larger community.
This requires a ‘meta-investment’ in the sector, rather than just project-level investments.
04
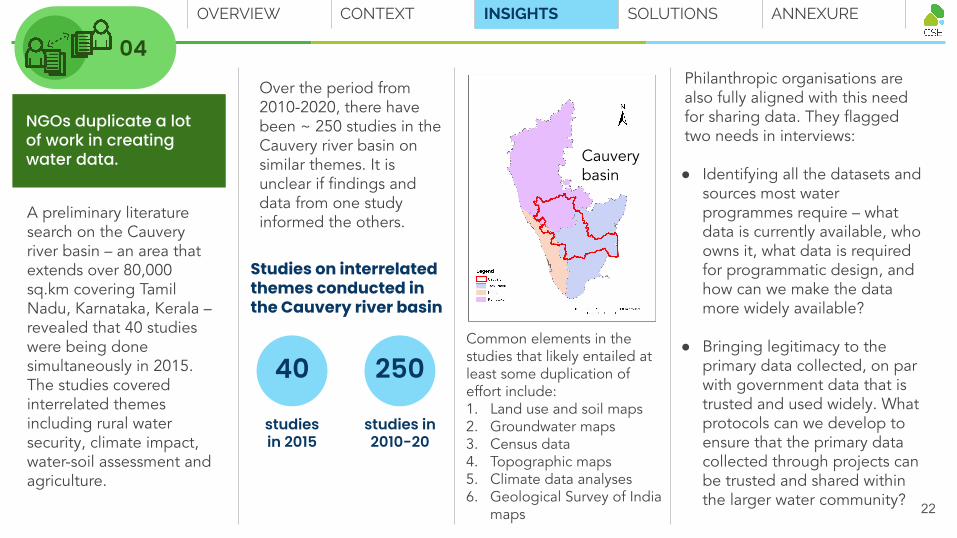
A preliminary literature search on the Cauvery river basin – an area that extends over 80,000 sq.km covering Tamil Nadu, Karnataka, Kerala – revealed that 40 studies were being done simultaneously in 2015. The studies covered interrelated themes including rural water security, climate impact, water-soil assessment and agriculture.
Over the period from 2010-2020, there have been ~ 250 studies in the Cauvery river basin on similar themes. It is unclear if findings and data from one study informed the others.
40 250
studies in 2015
studies in 2010-20
Studies on interrelated themes conducted in the Cauvery river basin
Common elements in the studies that likely entailed at least some duplication of effort include:1. Land use and soil maps2. Groundwater maps3. Census data4. Topographic maps5. Climate data analyses6. Geological Survey of India
maps
CONTEXT INSIGHTS SOLUTIONS ANNEXUREOVERVIEW
Cauvery basin
22
Philanthropic organisations are also fully aligned with this need for sharing data. They flagged two needs in interviews:
● Identifying all the datasets and sources most water programmes require – what data is currently available, who owns it, what data is required for programmatic design, and how can we make the data more widely available?
● Bringing legitimacy to the primary data collected, on par with government data that is trusted and used widely. What protocols can we develop to ensure that the primary data collected through projects can be trusted and shared within the larger water community?
NGOs duplicate a lot of work in creating water data.
04
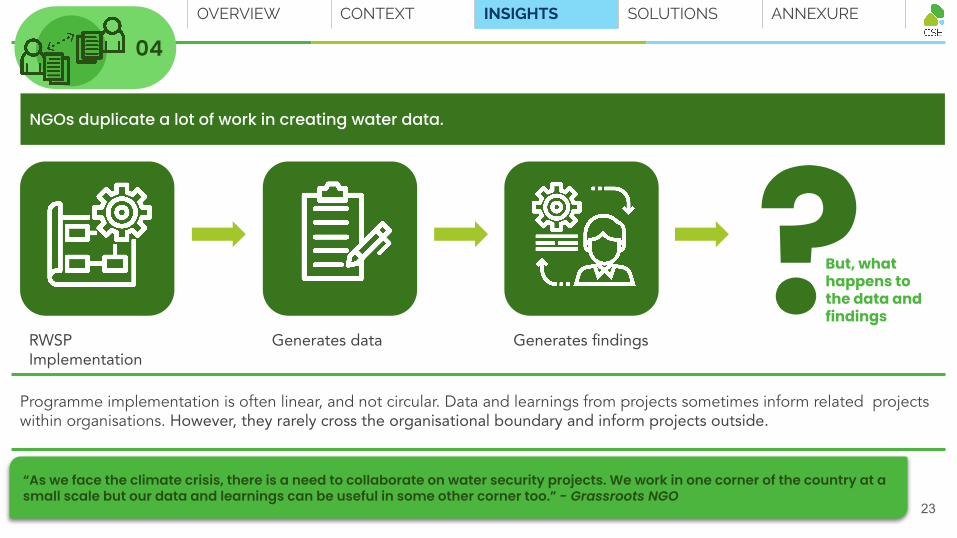
RWSP Implementation
Generates data Generates findings
But, what happens to the data and findings?
Programme implementation is often linear, and not circular. Data and learnings from projects sometimes inform related projects within organisations. However, they rarely cross the organisational boundary and inform projects outside.
CONTEXT INSIGHTS SOLUTIONS ANNEXUREOVERVIEW
23
NGOs duplicate a lot of work in creating water data.
“As we face the climate crisis, there is a need to collaborate on water security projects. We work in one corner of the country at a small scale but our data and learnings can be useful in some other corner too.” - Grassroots NGO
04

SOLUTIONS
24
Data Reuse
Data Processing
Data Preservation
Data Creation
Data Access
Data Analysis
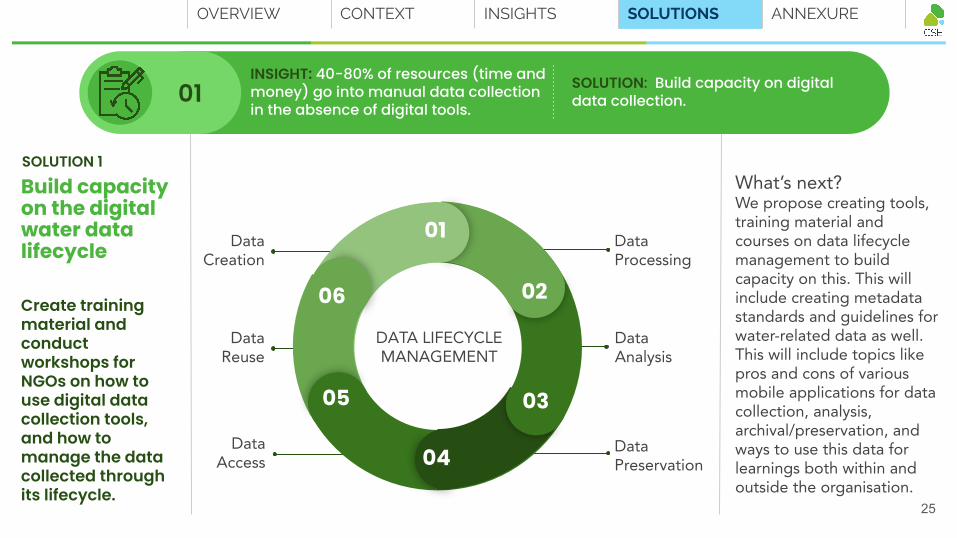
Build capacity on the digital water data lifecycle
Create training material and conduct workshops for NGOs on how to use digital data collection tools, and how to manage the data collected through its lifecycle.
What’s next?We propose creating tools, training material and courses on data lifecycle management to build capacity on this. This will include creating metadata standards and guidelines for water-related data as well. This will include topics like pros and cons of various mobile applications for data collection, analysis, archival/preservation, and ways to use this data for learnings both within and outside the organisation.
SOLUTION 1
0305
01
06
04
02
DATA LIFECYCLE MANAGEMENT
CONTEXT INSIGHTS SOLUTIONS ANNEXUREOVERVIEW
25
SOLUTION: Build capacity on digital data collection.
INSIGHT: 40-80% of resources (time and money) go into manual data collection in the absence of digital tools.
01
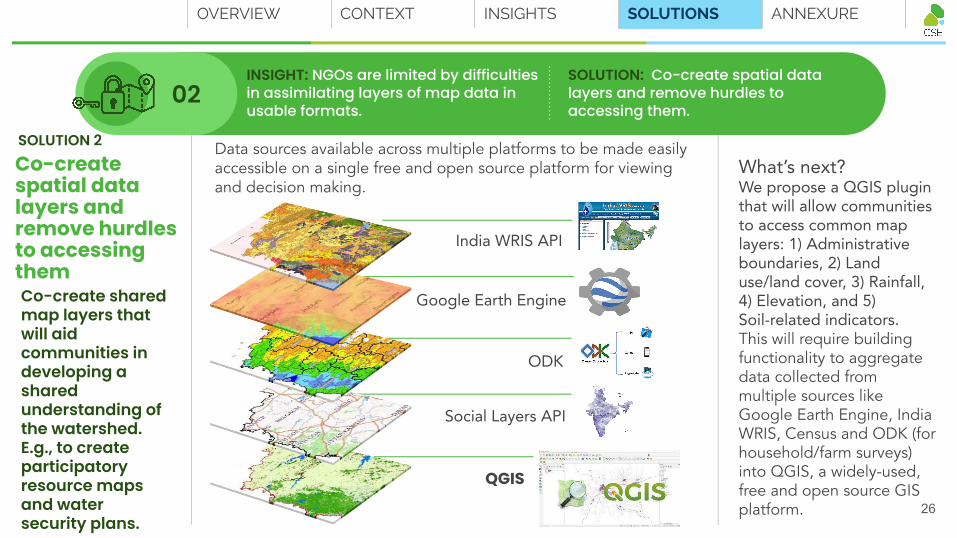
Data sources available across multiple platforms to be made easily accessible on a single free and open source platform for viewing and decision making.
Co-create spatial data layers and remove hurdles to accessing themCo-create shared map layers that will aid communities in developing a shared understanding of the watershed. E.g., to create participatory resource maps and water security plans.
SOLUTION 2
What’s next?We propose a QGIS plugin that will allow communities to access common map layers: 1) Administrative boundaries, 2) Land use/land cover, 3) Rainfall, 4) Elevation, and 5) Soil-related indicators. This will require building functionality to aggregate data collected from multiple sources like Google Earth Engine, India WRIS, Census and ODK (for household/farm surveys) into QGIS, a widely-used, free and open source GIS platform.
Google Earth Engine
ODK
India WRIS API
Social Layers API
QGIS
CONTEXT INSIGHTS SOLUTIONS ANNEXUREOVERVIEW
26
SOLUTION: Co-create spatial data layers and remove hurdles to accessing them.
INSIGHT: NGOs are limited by difficulties in assimilating layers of map data in usable formats.
02
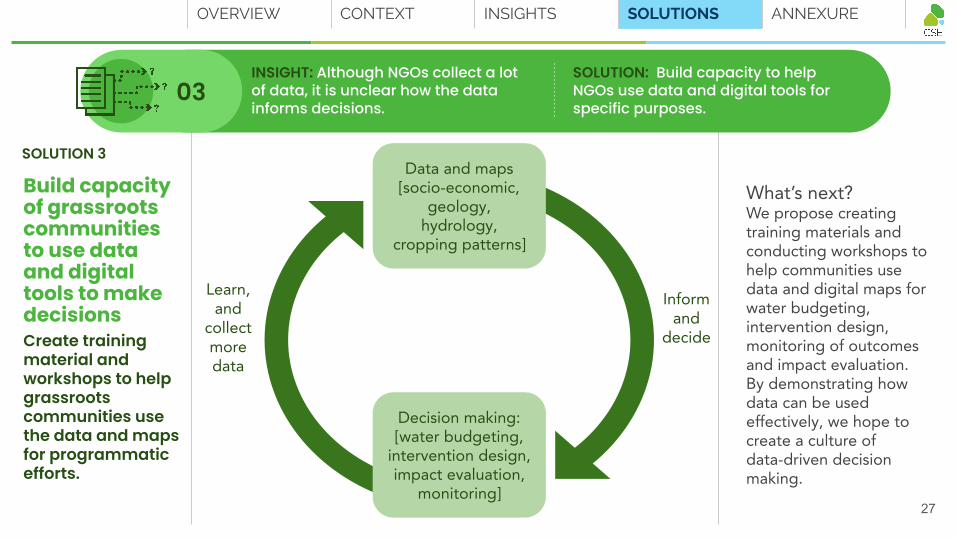
Build capacity of grassroots communities to use data and digital tools to make decisionsCreate training material and workshops to help grassroots communities use the data and maps for programmatic efforts.
SOLUTION 3
What’s next?We propose creating training materials and conducting workshops to help communities use data and digital maps for water budgeting, intervention design, monitoring of outcomes and impact evaluation. By demonstrating how data can be used effectively, we hope to create a culture of data-driven decision making.
Data and maps[socio-economic,
geology, hydrology,
cropping patterns]
Decision making:[water budgeting,
intervention design, impact evaluation,
monitoring]
Learn, and
collect more data
Inform and
decide
CONTEXT INSIGHTS SOLUTIONS ANNEXUREOVERVIEW
27
SOLUTION: Build capacity to help NGOs use data and digital tools for specific purposes.
INSIGHT: Although NGOs collect a lot of data, it is unclear how the data informs decisions.
03
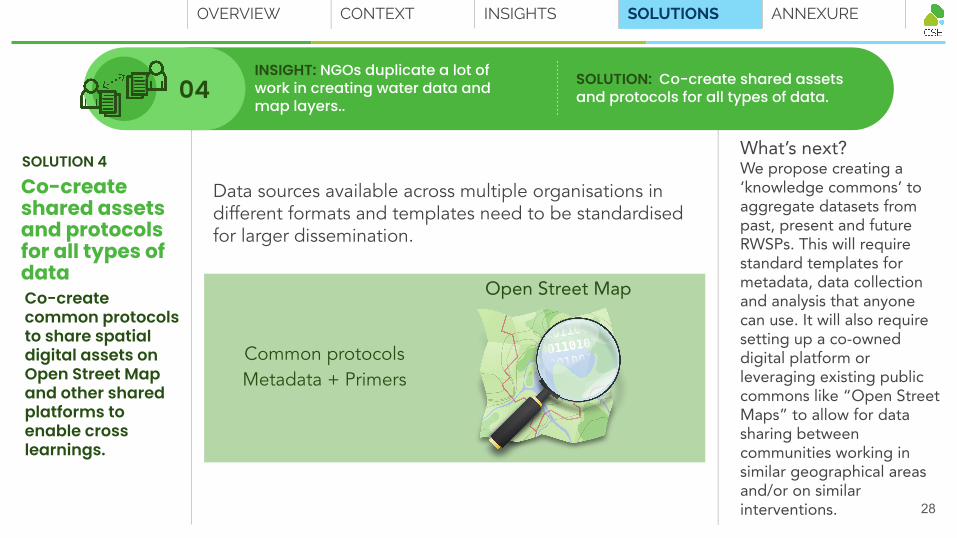
Open Street Map
Common protocolsMetadata + Primers
Data sources available across multiple organisations in different formats and templates need to be standardised for larger dissemination.
Co-create shared assets and protocols for all types of dataCo-create common protocols to share spatial digital assets on Open Street Map and other shared platforms to enable cross learnings.
SOLUTION 4What’s next?We propose creating a ‘knowledge commons’ to aggregate datasets from past, present and future RWSPs. This will require standard templates for metadata, data collection and analysis that anyone can use. It will also require setting up a co-owned digital platform or leveraging existing public commons like “Open Street Maps” to allow for data sharing between communities working in similar geographical areas and/or on similar interventions.
CONTEXT INSIGHTS SOLUTIONS ANNEXUREOVERVIEW
28
SOLUTION: Co-create shared assets and protocols for all types of data.
INSIGHT: NGOs duplicate a lot of work in creating water data and map layers..
04
ANNEXURE
29
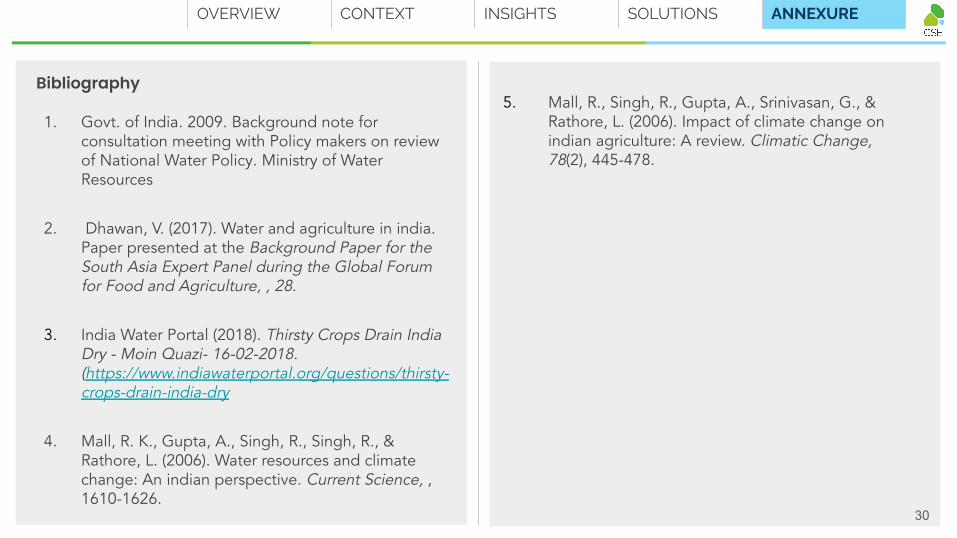
1. Govt. of India. 2009. Background note for consultation meeting with Policy makers on review of National Water Policy. Ministry of Water Resources
2. Dhawan, V. (2017). Water and agriculture in india. Paper presented at the Background Paper for the South Asia Expert Panel during the Global Forum for Food and Agriculture, , 28.
3. India Water Portal (2018). Thirsty Crops Drain India Dry - Moin Quazi- 16-02-2018. (https://www.indiawaterportal.org/questions/thirsty-crops-drain-india-dry
4. Mall, R. K., Gupta, A., Singh, R., Singh, R., & Rathore, L. (2006). Water resources and climate change: An indian perspective. Current Science, , 1610-1626.
Bibliography
CONTEXT INSIGHTS SOLUTIONS ANNEXUREOVERVIEW
30
Mall, R., Singh, R., Gupta, A., Srinivasan, G., & Rathore, L. (2006). Impact of climate change on indian agriculture: A review. Climatic Change, 78(2), 445-478.
5.
30
Methodology
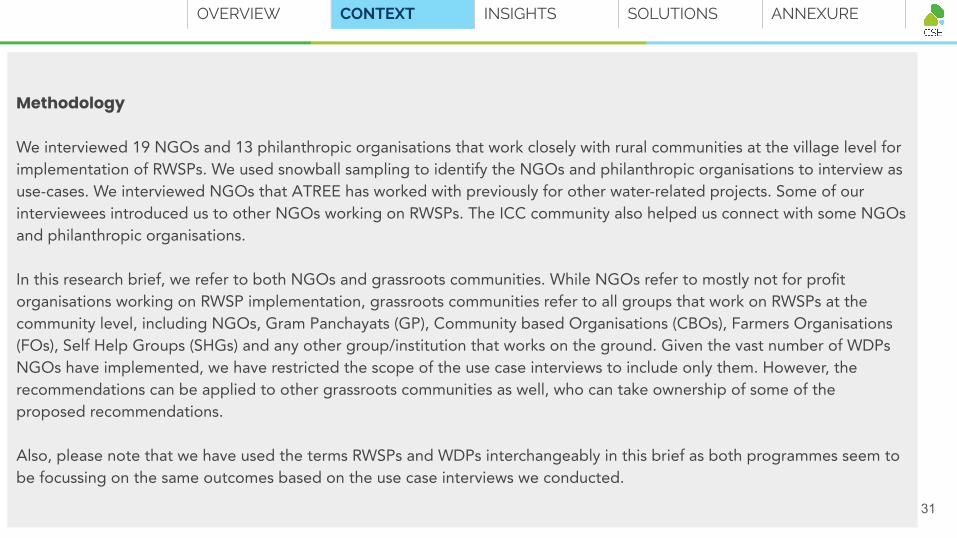
We interviewed 19 NGOs and 13 philanthropic organisations that work closely with rural communities at the village level for implementation of RWSPs. We used snowball sampling to identify the NGOs and philanthropic organisations to interview as use-cases. We interviewed NGOs that ATREE has worked with previously for other water-related projects. Some of our interviewees introduced us to other NGOs working on RWSPs. The ICC community also helped us connect with some NGOs and philanthropic organisations.
In this research brief, we refer to both NGOs and grassroots communities. While NGOs refer to mostly not for profit organisations working on RWSP implementation, grassroots communities refer to all groups that work on RWSPs at the community level, including NGOs, Gram Panchayats (GP), Community based Organisations (CBOs), Farmers Organisations (FOs), Self Help Groups (SHGs) and any other group/institution that works on the ground. Given the vast number of WDPs NGOs have implemented, we have restricted the scope of the use case interviews to include only them. However, the recommendations can be applied to other grassroots communities as well, who can take ownership of some of the proposed recommendations.
Also, please note that we have used the terms RWSPs and WDPs interchangeably in this brief as both programmes seem to be focussing on the same outcomes based on the use case interviews we conducted.
CONTEXT INSIGHTS SOLUTIONS ANNEXUREOVERVIEW
31
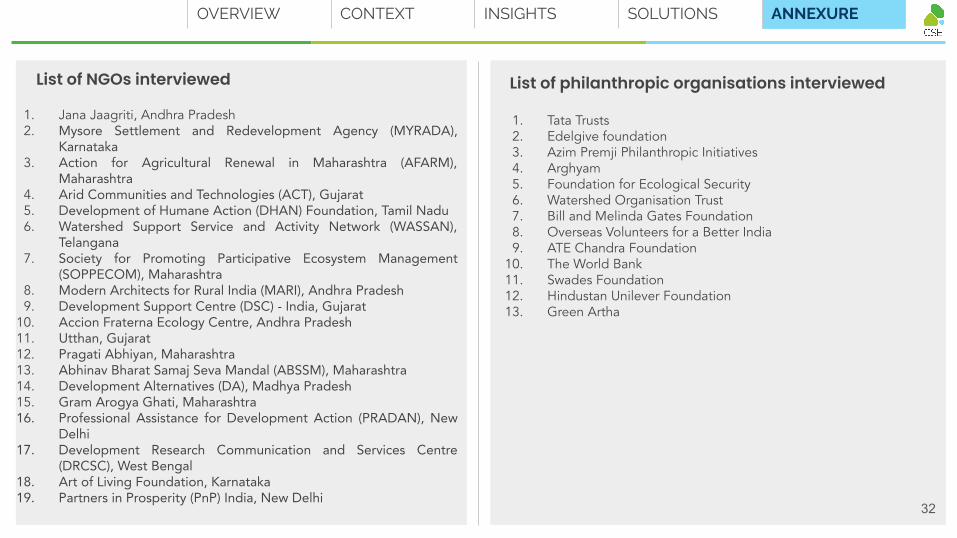
1. Jana Jaagriti, Andhra Pradesh2. Mysore Settlement and Redevelopment Agency (MYRADA),
Karnataka3. Action for Agricultural Renewal in Maharashtra (AFARM),
Maharashtra4. Arid Communities and Technologies (ACT), Gujarat5. Development of Humane Action (DHAN) Foundation, Tamil Nadu6. Watershed Support Service and Activity Network (WASSAN),
Telangana7. Society for Promoting Participative Ecosystem Management
(SOPPECOM), Maharashtra8. Modern Architects for Rural India (MARI), Andhra Pradesh9. Development Support Centre (DSC) - India, Gujarat
10. Accion Fraterna Ecology Centre, Andhra Pradesh11. Utthan, Gujarat12. Pragati Abhiyan, Maharashtra13. Abhinav Bharat Samaj Seva Mandal (ABSSM), Maharashtra14. Development Alternatives (DA), Madhya Pradesh15. Gram Arogya Ghati, Maharashtra16. Professional Assistance for Development Action (PRADAN), New
Delhi17. Development Research Communication and Services Centre
(DRCSC), West Bengal18. Art of Living Foundation, Karnataka19. Partners in Prosperity (PnP) India, New Delhi
List of NGOs interviewed
CONTEXT INSIGHTS SOLUTIONS ANNEXUREOVERVIEW
List of philanthropic organisations interviewed
1. Tata Trusts2. Edelgive foundation3. Azim Premji Philanthropic Initiatives4. Arghyam5. Foundation for Ecological Security6. Watershed Organisation Trust7. Bill and Melinda Gates Foundation8. Overseas Volunteers for a Better India9. ATE Chandra Foundation
10. The World Bank11. Swades Foundation12. Hindustan Unilever Foundation13. Green Artha
32
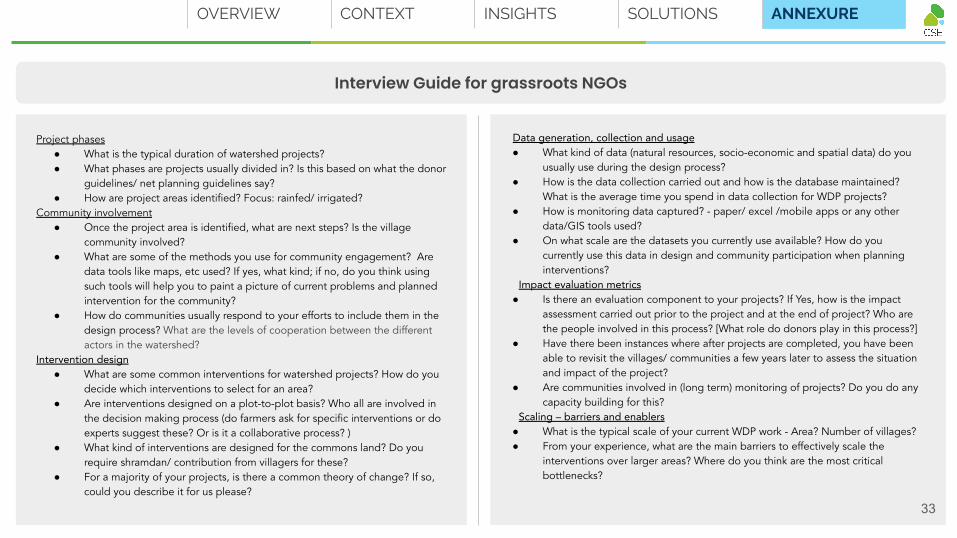
Interview Guide for grassroots NGOs
Project phases● What is the typical duration of watershed projects?● What phases are projects usually divided in? Is this based on what the donor
guidelines/ net planning guidelines say? ● How are project areas identified? Focus: rainfed/ irrigated?
Community involvement● Once the project area is identified, what are next steps? Is the village
community involved?● What are some of the methods you use for community engagement? Are
data tools like maps, etc used? If yes, what kind; if no, do you think using such tools will help you to paint a picture of current problems and planned intervention for the community?
● How do communities usually respond to your efforts to include them in the design process? What are the levels of cooperation between the different actors in the watershed?
Intervention design● What are some common interventions for watershed projects? How do you
decide which interventions to select for an area? ● Are interventions designed on a plot-to-plot basis? Who all are involved in
the decision making process (do farmers ask for specific interventions or do experts suggest these? Or is it a collaborative process? )
● What kind of interventions are designed for the commons land? Do you require shramdan/ contribution from villagers for these?
● For a majority of your projects, is there a common theory of change? If so, could you describe it for us please?
Data generation, collection and usage● What kind of data (natural resources, socio-economic and spatial data) do you
usually use during the design process? ● How is the data collection carried out and how is the database maintained?
What is the average time you spend in data collection for WDP projects?● How is monitoring data captured? - paper/ excel /mobile apps or any other
data/GIS tools used?● On what scale are the datasets you currently use available? How do you
currently use this data in design and community participation when planning interventions?
Impact evaluation metrics● Is there an evaluation component to your projects? If Yes, how is the impact
assessment carried out prior to the project and at the end of project? Who are the people involved in this process? [What role do donors play in this process?]
● Have there been instances where after projects are completed, you have been able to revisit the villages/ communities a few years later to assess the situation and impact of the project?
● Are communities involved in (long term) monitoring of projects? Do you do any capacity building for this?
Scaling – barriers and enablers● What is the typical scale of your current WDP work - Area? Number of villages?● From your experience, what are the main barriers to effectively scale the
interventions over larger areas? Where do you think are the most critical bottlenecks?
CONTEXT INSIGHTS SOLUTIONS ANNEXUREOVERVIEW
33
If you have any questions, or if you would like to collaborate with us on this project, please contact:
Anjali [email protected] for Social and Environmental Innovation (CSEI)
34