Embed Size (px)
Citation preview

Learning where to look for a hidden targetLeanne Chukoskiea, Joseph Snidera, Michael C. Mozera,b,c, Richard J. Krauzlisd, and Terrence J. Sejnowskia,e,f,g,1
aInstitute for Neural Computation and gDivision of Biological Sciences, University of California at San Diego, La Jolla, CA 92093; bDepartment of ComputerScience and cInstitute of Cognitive Science, University of Colorado, Boulder, CO 80309; dLaboratory of Sensorimotor Research, National Eye Institute, NationalInstitutes of Health, Bethesda, MD 20892; and eHoward Hughes Medical Institute and fComputational Neurobiology Laboratory, Salk Institute forBiological Studies, La Jolla, CA 92037
Edited by Francisco J. Ayala, University of California, Irvine, CA, and approved May 1, 2013 (received for review February 16, 2013)
Survival depends on successfully foraging for food, for whichevolution has selected diverse behaviors in different species.Humans forage not only for food, but also for information. Wedecide where to look over 170,000 times per day, approximatelythree times per wakeful second. The frequency of these saccadiceye movements belies the complexity underlying each individualchoice. Experience factors into the choice of where to look and canbe invoked to rapidly redirect gaze in a context and task-appropri-ate manner. However, remarkably little is known about howindividuals learn to direct their gaze given the current context andtask. We designed a task in which participants search a novel scenefor a target whose location was drawn stochastically on each trialfrom a fixed prior distribution. The target was invisible on a blankscreen, and the participants were rewarded when they fixated thehidden target location. In just a few trials, participants rapidly foundthe hidden targets by looking near previously rewarded locationsand avoiding previously unrewarded locations. Learning trajectorieswere well characterized by a simple reinforcement-learning (RL)model that maintained and continually updated a reward map oflocations. The RL model made further predictions concerning sensi-tivity to recent experience that were confirmed by the data. Theasymptotic performance of both the participants and the RL modelapproached optimal performance characterized by an ideal-observertheory. These two complementary levels of explanation show howexperience in a novel environment drives visual search in humansand may extend to other forms of search such as animal foraging.
ideal observer | oculomotor | reinforcement learning | saccades
The influence of evolution can be seen in foraging behaviors,which have been studied in behavioral ecology. Economic
models of foraging assume that decisions are made to maximizepayoff and minimize energy expenditure. For example, a beesetting off in search of flowers that are in bloom may travel kilo-meters to find food sources. Seeking information about an envi-ronment is an important part of foraging. Bees need to identifyobjects at a distance that are associated with food sources.Humans are also experts at searching for items in the world, and inlearning how to find them. This study explores the problem of howhumans learn where to look in the context of animal foraging.Our daily activities depend on successful search strategies for
finding objects in our environment. Visual search is ubiquitous inroutine tasks: finding one’s car in a parking lot, house keys ona cluttered desk, or the button you wish to click on a computerinterface. When searching common scene contexts for a targetobject, individuals rapidly glean information about where targetsare typically located (1–9). This ability to use the “gist” of an image(3, 4) enables individuals to perform flexibly and efficiently in fa-miliar environments. Add to that the predictable sequence of eyemovements that occurs when someone is engaged in a manual task(10) and it becomes clear that despite the large body of researchon how image salience guides gaze (2, 11), learned spatial asso-ciations are perhaps just as important for effectively engaging ourvisual environment (10, 12, 13). Surprisingly, however, little re-search has been directed to how individuals learn to direct gaze ina context and task-appropriate manner in novel environments.
Research relevant to learning where to look comes from theliterature on eye movements, rewards, and their expected value.Like all motor behavior, saccades are influenced by reward, oc-curring at shorter latency for more valued targets (14). In fact,finding something you seek may be intrinsically rewarding (15).Refining the well-known canonical “main sequence” relationshipbetween saccade amplitude and velocity, the value of a saccadetarget can alter details of the motor plan executed, either speedingor slowing the saccade itself depending upon the value of thattarget for the subject (16, 17). This result is especially interesting inlight of the research indicating that the low-level stimulus features,which have an expected distribution of attracting fixations (18), aredifferent (19) and perhaps also differently valuable (20) dependingon their distance from the current fixation location. Taken to-gether these results underscore the complex interplay of externaland internal information in guiding eye movement choice.Two early foundational studies from Buswell (21) and Yarbus
(22) foreshadowed modern concepts of a priority or saliencemap by showing that some portions of an image are fixated withgreater likelihood than others. Both researchers also provided earlyevidence that this priority map effectively changes depending onthe type of information sought. Yarbus observed that the patternsof gaze that followed different scene-based questions or tasks givento the observer were quite distinct, suggesting that the observerknew where to find information in the scene to answer the questionand looked specifically to areas containing that information when itwas needed. Henderson and coworkers (23) have replicated thisresult for the different tasks of visual search and image memori-zation. However, Wolfe and coworkers (24), using a slightly dif-ferent question and task paradigm, failed to find evidence thatsaccade patterns were predictive of specific mental states. Re-gardless of specific replications of Yarbus’s demonstration, it isclear that scene gist—context-specific information about whereobjects are typically found—emerges very quickly and guidestarget search of a scene with a known context (4). For ex-ample, when shown a street scene, an observer would imme-diately know where to look for street signs, cars, and pedestrians(Fig. 1A).Castelhano and Heaven (9) have also shown that in addition to
scene gist itself, learned spatial associations guide eye movementsduring search. Subjects use these learned associations as well asother context-based experience, such as stimulus probability, andpast rewards and penalties (25–27) to hone the aim of a saccadic
This paper results from the Arthur M. Sackler Colloquium of the National Academy ofSciences, “In the Light of Evolution VII: The Human Mental Machinery,” held January 10–12, 2013, at the Arnold and Mabel Beckman Center of the National Academies of Sciencesand Engineering in Irvine, CA. The complete program and audio files of most presenta-tions are available on the NAS Web site at www.nasonline.org/evolution_vii.
Author contributions: L.C., J.S., M.C.M., R.J.K., and T.J.S. designed research; L.C., J.S., andM.C.M. performed research; L.C., J.S., M.C.M., R.J.K., and T.J.S. analyzed data; and L.C.,J.S., M.C.M., R.J.K., and T.J.S. wrote the paper.
The authors declare no conflict of interest.
This article is a PNAS Direct Submission.1To whom correspondence should be addressed. E-mail: [email protected].
This article contains supporting information online at www.pnas.org/lookup/suppl/doi:10.1073/pnas.1301216110/-/DCSupplemental.
www.pnas.org/cgi/doi/10.1073/pnas.1301216110 PNAS Early Edition | 1 of 8

eye movement. A recent review and commentary fromWolfe et al.(28) explores the notion of “semantic” guidance in complex, nat-uralistic scenes as providing knowledge of the probability of findinga known object in a particular part of a scene. This perspectiverelates work on scene gist together with more classic visual searchtasks, offering a framework for considering how individuals mightuse past experience to direct gaze in both real-world scenes as wellas in the contrived scenarios of our laboratories.Quite distinct from the literature on visual search is the litera-
ture on another sort of search that is commonly required of ani-mals and people: foraging. Foraging agents seek food, which isoften hidden in the environment in which they search (Fig. 1B).The search for hidden food rewards changes not only with theposition of the reward, but also with the size of the distribution ofrewards (29). Other work has cast foraging behavior in terms ofoptimal search (30). What distinguishes foraging from visualsearch tasks is that visual search tasks have visible cues that drivesearch, in addition to contextual information that specifies prob-able target location. To make visual search more like foraging, wecan strip the visible cues from visual search. A visual search taskdevoid of visual cues would allow us to determine whether thereare underlying commonalities between these two types of searchand whether general principles of search might emerge from suchan investigation.The importance of searching for hidden and even invisible
targets is underscored by human participants engaged in large-scale exploration approximating animal foraging (31, 32). In onesuch paradigm (32), children were told to explore a room with afloor composed of box-like floor tiles, one of which contained a
reward item. Interestingly, children explored the environmentdifferently when they were instructed to search with their non-dominant hand than with their dominant hand. Specifically, more“revisits” were necessary in the nondominant hand condition. Thisresult suggests that learning and motor effort factor into perfor-mance on tasks that might seem to be automatic, which suggestsmethods for modeling foraging-like behavior. The additionalmotor effort that would be required to reduce metabolically ex-pensive revisits in a foraging scenario seemed to have engagedmemory systems to a greater degree than what is typically observedin traditional “visual” search tasks.The reinforcement-learning (RL) framework has become widely
accepted for modeling performance in tasks involving a series ofmovements leading to reward (33, 34). In addition, for organismsacross many levels of complexity, RL has been shown to be anappropriate framework to consider adaptive behavior in complexand changing environments (35, 36). Here we describe per-formance in our task in terms of a RL perspective. Participants’learning trajectories were well characterized by a simple RLmodel that maintained and continually updated a reward map oflocations. The RL model made further predictions concerningsensitivity to recent experience that were confirmed by the data.The asymptotic performance of both the participants and theRL model approached optimal performance characterized by anideal-observer theory assuming perfect knowledge of the statictarget distribution and independently chosen fixations. These twocomplementary levels of explanation show how experience in anovel environment drives visual search in humans.
Trial #54
Trial #4
Trial #15
M
3
2
1
-10 0 10
-10
0
10
Horizontal position (dva)
Ver
tical
pos
ition
(dv
a)
M
DC
A B
Fig. 1. Visible and hidden search tasks. (A) An experienced pedestrian has prior knowledge of where to look for signs, cars, and sidewalks in this street scene.(B) Ducks foraging in a large expanse of grass. (C) A representation of the screen is superimposed with the hidden target distribution that is learned over thesession as well as sample eye traces from three trials for participant M. The first fixation of each trial is marked with a black circle. The final and rewardedfixation is marked by a shaded grayscale circle. (D) The region of the screen sampled with fixation shrinks from the entire screen on early trials (blue circles; 87fixations over the first five trials) to a region that approximates the size and position of the Gaussian-integer distributed target locations (squares, colorproportional to the probability as given in A) on later trials (red circles; 85 fixations from trials 32–39). Fixation position data are from participant M.
2 of 8 | www.pnas.org/cgi/doi/10.1073/pnas.1301216110 Chukoskie et al.

ResultsHumans Rapidly Learn to Find Hidden Targets. In visual search,previous experiments failed to isolate completely the visual ap-pearance of a target from the learned location of the reward; in allcases a visual indication of a target, or amemory of amoments-agovisible target (26) and its surroundings, were available to guide themovement. To understand how participants learn where to look ina novel scene or context where no relationship exists between vi-sual targets and associated rewards or penalties, we designeda search task in which participants were rewarded for findinga hidden target, similar to the scenario encountered by a foraginganimal (Fig. 1C).Participants repeatedly searched a single unfamiliar scene
(context) for a target. However, to study the role of task knowl-edge in guiding search apart from the visual cues ordinarily used toidentify a target, the target was rendered invisible. The partic-ipants’ task was to explore the screen with their gaze and finda hidden target location that would sound a reward tone whenfixated. Unbeknownst to each participant, the hidden target po-sition varied from trial to trial and was drawn from a Gaussiandistribution with a centroid and spread (target mean and SD, re-spectively) that was held constant throughout a session (Fig. 1C).At the start of a session, participants had no prior knowledge
to inform their search; their initial search was effectively “blind.”As the session proceeded participants accumulated informationfrom gaining reward or not at fixation points and improved theirsuccess rate by developing an expectation for the distribution ofhidden targets and using it to guide future search (Fig. 1D).After remarkably few trials, participants gathered enough in-
formation about the target distribution to direct gaze efficientlynear the actual target distribution, as illustrated by one partic-ipant’s data in Fig. 1 C and D. We observed a similar pattern oflearning for all participants: Early fixations were broadly scatteredthroughout the search screen; after approximately a dozen trials,fixations narrowed to the region with high target probability.A characterization of this effect for all participants is shown in
Fig. 2A. The average distance from the centroid of the targetdistribution to individual fixations in a trial drops precipitouslyover roughly the first dozen trials. Fig. 2A shows this distance forall participants in the 2° target spread condition. The asymptoticdistance from centroid increased monotonically with the targetspread (Table 1).A measure of search spread is the SD of the set of fixations in
a trial. The search spread was initially broad and narrowed as thesession progressed, as shown in Fig. 2B for all participants in the2° target-spread condition. The asymptotic search spread mono-tonically increased with the target-spread condition (Table 1).These data suggest that participants estimated the spread of thehidden target distribution and adjusted their search spread ac-cordingly. Also, the median number of fixations that participantsmade to find the target (on target-found trials) decreased rapidlywithin a session to reach an asymptote (Fig. 2C).
Humans Approach Ideal-Observer Performance.Wenow consider thebehavior of participants once performance had stabilized. Takingtrials 31–60 to reflect asymptotic behavior, we examined the effi-ciency of human search in comparison with a theoretical optimum.An ideal observer was derived for the Hidden Target Search Taskassuming that fixations are independent of one another and thatthe target distribution is known, and the expected number of trialsis minimized (Fig. S1 and Table S1). The dashed lines in Fig. 2mark ideal-observer performance. Ideal search performancerequires a distribution of planned fixation “guesses” that is √2broader than the target distribution itself (37). As seen in Fig. 2 Band C, the performance of participants hovered around thisideal search distribution after about a dozen trials.
10 30 502
4
6
8
10humanRL modelideal obs
Dis
tanc
e (
)o
A
10 30 501
3
5
7
9
Dis
trib
utio
n S
td D
ev (
)o
10 30 50
0
10
20
30
Med
ian
# F
ixat
ions
B
C
Trial #
Fig. 2. Learning curves for hidden-target search task. (A) The distance be-tween the mean of the fixation cluster for each trial to the target centroid,averaged across participants, is shown in blue and green and indicates theresult of 200 simulations of the reinforcement-learning model for eachparticipant’s parameters. The SEM is given for both. The ideal-observerprediction is indicated by the black dotted line. (B) The SD of the eye positiondistributions or “search spread” is shown for the average of all participants(blue) and the RL model (green) with SEM. The dashed line is the ideal-observer theoretical optimum in each case, assuming perfect knowledge ofthe target distribution. (C) The median number of fixations made to find thetarget on each trial is shown (blue) along with the RL model prediction(green) of fixation number. The SEM is shown for both.
Chukoskie et al. PNAS Early Edition | 3 of 8

Subjects showed a ∼1° bias toward the center of the screenrelative to the target distribution (Table S2), but the calculationof the ideal behavior assumed subjects searched symmetricallyaround the center of the target distribution. Although the additionof the bias makes the math untenable analytically, a simulatedsearcher approximated the expected number of saccades requiredto find a target with a systematic 1° bias (Fig. 3). There was es-sentially no change in the predicted number of saccades or thesearch spread (location of the minimum in Fig. 3), except for thecase of the 0.75° target distribution, where the optimum shiftedfrom a search spread of 0.56° to 0.85°. Intuitively, the effect of biaswas small because the bias was less than the 2° target radius.Nonetheless, at a 95% confidence level across the three targetdistributions, the number of steps, search spread, and step size allqualitatively and quantitatively match the predictions assumingthe number of saccades was minimized.
Reinforcement Learning Model Matches Human Learning. In additionto the ideal-observer theory, which characterizes the asymptoticefficiency of human search, we developed a complementary, mech-anistic account that captured the learning, individual differences,and dynamics of human behavior. RL theory, motivated by animallearning and behavioral experiments (38), suggests a simple andintuitive model that constructs a value function mapping locationsin space to expected reward. The value function is updated aftereach fixation based on whether or not the target is found and is usedfor selecting saccade destinations that are likely to be rewarded.We augmented this intuitive model with two additional as-
sumptions: First, each time a saccade is made to a location, thefeedback obtained generalized to nearby spatial locations; second,we incorporated a proximity bias that favored shorter saccades. Apreference for shorter saccades was present in the data (Fig. S2)and has been noted by other researchers (22, 39), some of whomhave shown that it can override knowledge that participants haveabout the expected location of a target (40). Incorporating aproximity bias into the model changed the nature of the task be-cause the choice of the next fixation became dependent on thecurrent fixation. Consequently, participants must plan fixation se-quences instead of choosing independent fixations.We modeled the task using temporal difference methods (33),
which are particularly appropriate for Markovian tasks in whichsequences of actions lead to reward (Reinforcement LearningModel and Figs. S2 and S3 give details). The model’s freeparameters were fit to each subject’s sequence of fixations foreach of the first 20 trials. Given these parameters, the model was
then run in generative mode from a de novo state to simulate thesubject performing the task.Fig. 2 shows the mean performance of the model side by side
with the mean human performance. The model also predicted anasymptotic search spread that increased with the target spread(Table 1), consistent with the participants’ aggregate performance.Similar to the human performance observed in Fig. 2A, the RLmodel approaches, but does not reach, the theoretical asymptote.Like the human participants, the RL model is responsive tononstationarity in the distribution, whereas the ideal-observertheory assumes that the distribution is static. In addition, the
Table 1. Performance at asymptote of learning for participants, the ideal-observer theory, anda reinforcement-learning model
Target spread condition, °Mean distance from target centroid
to fixations on trials 31–60, °Search spread ontrials 31–60, °
Participant data0.75 1.97 1.142.00 4.08 2.802.75 4.39 3.70
Ideal-observer theory0.75 0.70 0.562.00 3.36 2.682.75 4.74 3.78
Reinforcement-learning model0.75 3.21 1.562.00 4.46 2.612.75 6.07 4.29
Data, theory, and model statistics for the mean fixation distance and search spread for 0.75°, 2.0°, and 2.75°target distribution conditions.
Fig. 3. Optimal search model. Theoretical number of search steps to find thetarget for target distributions of size 0.75° (orange), 2° (red), and 2.75° (brown)was estimated by simulation (circles with mean and SEs from 100,000 trials perpoint) and from the theoretical calculation (solid lines) as detailed in Table S1and Supporting Information. The simulation included the observed 1° biasseen in the subjects, but the theory lines did not. Solid boxes indicate theobserved values for the subjects (mean and SE). With the added bias, theminimum moved slightly to the right but was only significant for the 0.75°target distribution. The cost in terms of extra saccades for nonoptimal searchspreads (away from the minimum) was higher for the larger target dis-tributions, and the comparatively shallow rise for search spreads above opti-mal meant that if subjects were to err, then they should tend toward largerspreads. Indeed, the tendency for larger spreads was evident as subjects star-ted with large spreads and decreased toward the minimum (Fig. 2). The extrasteps that subjects took to find the target for the 2.75° distribution (UpperRight) was consistent with the tendency toward small saccades even thoughthey were quite close to the correct minimum (Fig. S2): The largest saccadesmay have been broken up into multiple short saccades.
4 of 8 | www.pnas.org/cgi/doi/10.1073/pnas.1301216110 Chukoskie et al.
model accounted for individual differences (Reinforcement Learn-ingModel). There are several reasons why the observed consistencybetween participants and simulations may be more than an exis-tence proof and could provide insight into the biological mecha-nisms of learning (41). TheRLmodel itself had emergent dynamicsthat were reflected in the human behavior (Fig. 4 and sequentialeffects discussed below). Also the criterion used to train the modelwas the likelihood of a specific fixation sequence. A wide range ofstatistical measures quite distinct from the training criterion wereused to compare human and model performance: mean distancefrom target centroid, SD of the distribution of eye movements, andthe median number of fixations (Fig. 2). Finally, only the first 20trials were used to train the model, but all of the comparisonsshown in Table 1 were obtained from trials 31–60.Fig. 2 suggests that participants acquire the target distribution
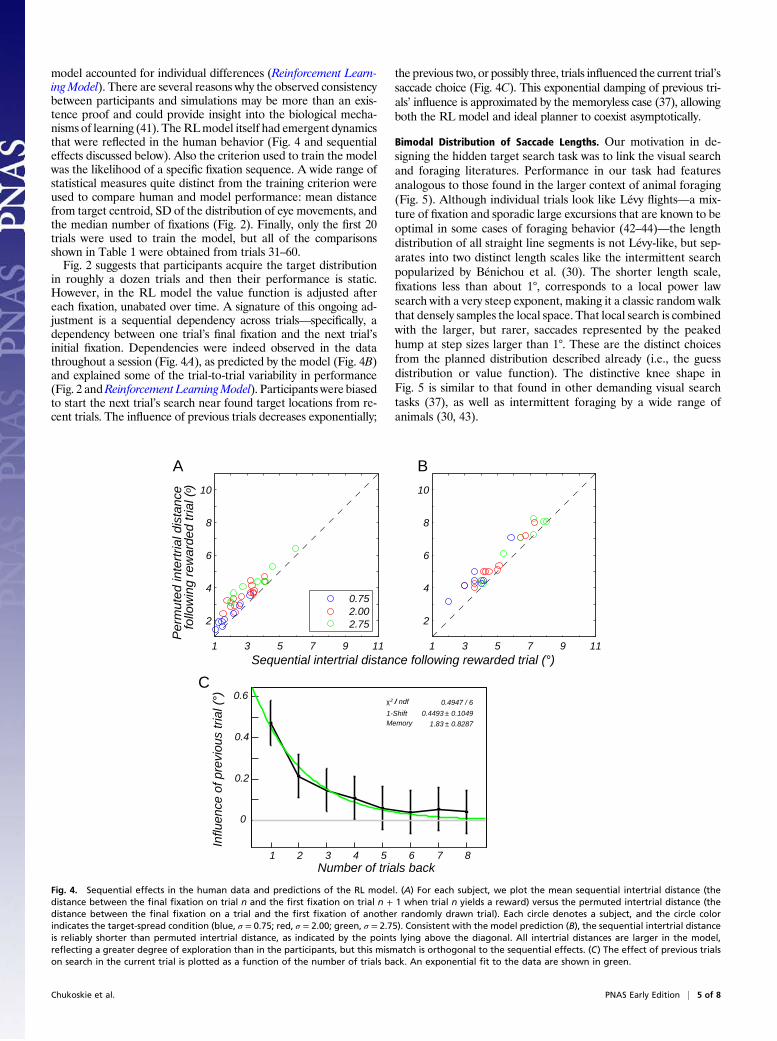
in roughly a dozen trials and then their performance is static.However, in the RL model the value function is adjusted aftereach fixation, unabated over time. A signature of this ongoing ad-justment is a sequential dependency across trials—specifically, adependency between one trial’s final fixation and the next trial’sinitial fixation. Dependencies were indeed observed in the datathroughout a session (Fig. 4A), as predicted by the model (Fig. 4B)and explained some of the trial-to-trial variability in performance(Fig. 2 andReinforcement LearningModel). Participants were biasedto start the next trial’s search near found target locations from re-cent trials. The influence of previous trials decreases exponentially;
the previous two, or possibly three, trials influenced the current trial’ssaccade choice (Fig. 4C). This exponential damping of previous tri-als’ influence is approximated by the memoryless case (37), allowingboth the RL model and ideal planner to coexist asymptotically.
Bimodal Distribution of Saccade Lengths. Our motivation in de-signing the hidden target search task was to link the visual searchand foraging literatures. Performance in our task had featuresanalogous to those found in the larger context of animal foraging(Fig. 5). Although individual trials look like Lévy flights—a mix-ture of fixation and sporadic large excursions that are known to beoptimal in some cases of foraging behavior (42–44)—the lengthdistribution of all straight line segments is not Lévy-like, but sep-arates into two distinct length scales like the intermittent searchpopularized by Bénichou et al. (30). The shorter length scale,fixations less than about 1°, corresponds to a local power lawsearch with a very steep exponent, making it a classic random walkthat densely samples the local space. That local search is combinedwith the larger, but rarer, saccades represented by the peakedhump at step sizes larger than 1°. These are the distinct choicesfrom the planned distribution described already (i.e., the guessdistribution or value function). The distinctive knee shape inFig. 5 is similar to that found in other demanding visual searchtasks (37), as well as intermittent foraging by a wide range ofanimals (30, 43).
1 3 5 7 9 11
2
4
6
8
10
1 3 5 7 9 11
2
4
6
8
10
Sequential intertrial distance following rewarded trial (°)
Per
mut
ed in
tert
rial d
ista
nce
follo
win
g re
war
ded
tria
l ( )o
0.752.002.75
A B
Number of trials back1 2 3 4 5 6 7 8
Influ
ence
of p
revi
ous
tria
l (°)
0
0.2
0.4
0.6 / ndf / 2χ 0.4947 / 6
1-Shift 0.1049± 0.4493 Memory 0.8287± 1.83
C
Fig. 4. Sequential effects in the human data and predictions of the RL model. (A) For each subject, we plot the mean sequential intertrial distance (thedistance between the final fixation on trial n and the first fixation on trial n + 1 when trial n yields a reward) versus the permuted intertrial distance (thedistance between the final fixation on a trial and the first fixation of another randomly drawn trial). Each circle denotes a subject, and the circle colorindicates the target-spread condition (blue, σ = 0.75; red, σ = 2.00; green, σ = 2.75). Consistent with the model prediction (B), the sequential intertrial distanceis reliably shorter than permuted intertrial distance, as indicated by the points lying above the diagonal. All intertrial distances are larger in the model,reflecting a greater degree of exploration than in the participants, but this mismatch is orthogonal to the sequential effects. (C) The effect of previous trialson search in the current trial is plotted as a function of the number of trials back. An exponential fit to the data are shown in green.
Chukoskie et al. PNAS Early Edition | 5 of 8

DiscussionHuman search performance can be put into the more generalcontext of animal foraging, which has close connections with RLmodels (36) and optimal search theory (29). The hidden targetsearch task introduced here has allowed us to separate the in-fluence of external cues from internal prior information forseeking rewards in a novel environment (45). In our hidden targetsearch task, participants explored a novel environment and quicklylearned to align their fixations with the region of space over whichinvisible targets were probabilistically distributed. After abouta dozen trials, the fixation statistics came close to matching thoseobtained by an ideal-observer theory. This near-match allowed usto cast human performance as optimal memory-free search withperfect knowledge of the target distribution. As a complement tothe ideal-observer theory that addresses asymptotic performance,we developed a mechanistic account of trial-to-trial learning fromreinforcement. Our RL model characterized the time course oflearning, attained an asymptote near ideal-observer performance,and tied the problem of visual search to a broader theory ofmotivated learning.
Natural Environments. The ideal-observer and reinforcement-learning frameworks provide the foundation for a broader theo-retical perspective on saccade choice during natural vision, inwhich people learn to search in varied contexts for visible targets,where visual features of the scene are clearly essential. In aBayesian framework, the subjects in our task learned the priordistribution of the hidden targets. In a natural environment, theprior distribution would be combined with visual information todetermine the posterior distribution, from which saccadic targetsare generated.Naturalistic environments are nonstationary. For example, an
animal foraging for food may exhaust the supply in one neighbor-hood and have to move on to another. A searcher must be sensitiveto such changes in the environment. Sequential dependencies (Fig.
4) are a signature of this sensitivity (46–48): Recent targets in-fluence subsequent behavior, even after the searcher has seeminglylearned the target distribution, as reflected in asymptotic perfor-mance. Sequential dependencies were predicted by the RL model,which generated behavior remarkably close to that of the partic-ipants as a group, and also captured individual idiosyncrasies(Reinforcement Learning Model). Sensitivity to nonstationary envi-ronments can explain why our participants and the RL modelattained an asymptotic search distribution somewhat further fromthe target centroid than is predicted by an ideal-observer theorypremised on stationarity.One of the most impressive feats of animal foraging is matching
behavior. Herrnstein’s matching law (49) describes how foraginganimals tend to respond in proportion to the expected value ofdifferent patches. Matching behavior has been studied in multiplespecies from honey bees to humans (50–53). However, many ofthese laboratory studies effectively remove the spatial element offoraging from the task by looking at different intervals of re-inforcement on two levers or buttons; in this setting, animalsquickly detect changes in reinforcement intervals (54) and themotor effort in switching between spatial patches has been ex-amined (55). In nature, foraging is spatially extended, and thehidden-target search paradigm could serve as an effective envi-ronment for examining an explicitly spatial foraging task in thecontext of matching behavior. For example, a version of our hid-den-target search paradigm with a bimodal distribution could ex-plore changeover behavior and motor effort by varying the sizes ofthe two distributions and distance between them (55).
Neural Basis of Search.The neurobiology of eye movement behavioroffers an alternative perspective on the similarities of visual searchbehavior and foraging. The question of where to look next has beenexplored neurophysiologically, and cells in several regions of themacaque brain seem to carry signatures of task components re-quired for successful visual search. The lateral interparietal (LIP)area and the superior colliculus (SC) are two brain regions thatcontain a priority map representing locations of relevant stimulithat could serve as the target of the next saccade. Recordings inmacaque area LIP and the SC have shown that this priority mapintegrates information from both external (“bottom-up”) and in-ternal (“top-down”) signals in visual search tasks (56, 57).Recently, Bisley and coworkers (58) have used a foraging-like
visual search task to show that area LIP cells differentiated be-tween targets and distracters and kept a running estimate of likelysaccade goal payoffs. Area LIP neurons integrate informationfrom different foraging-relevant modalities to encode the valueassociated with a movement to a particular target (59, 60). Theneural mechanisms serving patch stay-leave foraging decisionshave recently been characterized in a simplified visual choice task(61), providing a scheme for investigations of precisely how priorinformation and other task demands mix with visual informationavailable in the scene. Subthreshold microstimulation in area LIP(62) or the SC (63) also biases the selection saccades toward thetarget in the stimulated field. Taken together, these results suggestthat area LIP and the SCmight be neural substrates mediating themap of likely next saccade locations in our task, akin to the valuemap in our RL model.We asked how subjects learn to choose valuable targets in a
novel environment. Recent neurophysiological experiments in thebasal ganglia provide some suggestions on how prior informationis encoded for use in choosing the most valuable saccade target ina complex environment (64). Hikosaka and coworkers (65) haveidentified signals related to recently learned, and still labile, valueinformation for saccade targets in the head of the caudate nucleusand more stable value information in the tail of the caudate andsubstantia nigra, pars reticulata. Because the cells carrying thisstable value information seem to project preferentially to the SC,these signals are well-placed to influence saccade choices through
−4
−3
−2
−1
0
1
−0.5 0.0 0.5 1.0 1.5
Step size (log10 °)
Den
sity
(lo
g10
scal
e)
sigma
0.75
2
2.75
Fig. 5. Length distributions of saccades in the hidden target task. A turningpoint algorithm applied to raw eye movement data yields a distribution ofstep sizes for all participants (Reinforcement Learning Model gives details).Very small “fixational” eye movements comprise the left side of the plot andlarge larger saccadic jumps on the right for three different sizes of targetdistribution. The points and lines (Loess fits with 95% confidence intervalshading) for each search distribution size, all share a similar shape, particu-larly a bend at step sizes approaching 1° of visual angle.
6 of 8 | www.pnas.org/cgi/doi/10.1073/pnas.1301216110 Chukoskie et al.

a fast and evolutionarily conserved circuit for controlling orientingbehavior. These results provide a neurophysiological basis forunderstanding how experience is learned and consolidated in theservice of the saccades we make to gather information about ourenvironment about three times each second.
ConclusionsIn our eye-movement search task, subjects learned to choose sac-cade goals based on prior experience of reward that is divorcedfrom specific visual features in a novel scene. The resulting searchperformance was well described by an RL model similar to thatused previously to examine both foraging animal behavior andneuronal firing of dopaminergic cells. In addition, the search per-formance approached the theoretical optimum for performance onthis task. By characterizing how prior experience guides eyemovement choice in novel contexts and integrating it with bothmodel and theory, we have created a framework for consideringhow prior experience guides saccade choice during natural vision.The primate oculomotor system has been well studied, which willmake it possible to uncover the neural mechanisms underlying thelearning and performance of the hidden-target task, which may beshared with other search behaviors.
MethodsWe defined a spatial region of an image as salient by associating it withreward to examine how participants used their prior experience of findingtargets to direct future saccades. We took advantage of the fact that the goalof saccadic eye movements is to obtain information about the world andasked human participants to “conduct an eye movement search to finda rewarded target location as quickly as possible.” Participants were alsotold that they would learn more about the rewarded targets as the sessionprogressed and that they should try to find the rewarded target location asquickly as possible. The rewarded targets had no visual representation onthe screen and were thus invisible to the subject. The display screen was thesame on each trial within a session and provided no information about thetarget location. The location and the spread of the rewarded target distri-bution were varied with each session.
Each trial began with a central fixation cross on a neutral gray screen withmean luminance of 36.1 cd/m2 (Fig. 1). The search screen spanned the central25.6° of the subject’s view while seated with his or her head immobilizedby a bite bar.
Participants initiated each trial with a button press indicating that theywere fixating the central cross. The same neutral gray screen served as thesearch screen after 300 ms of fixation of the cross. Once the fixation crossdisappeared, participants had 20 s to find the rewarded location for that trialbefore the fixation screen returned. On each trial an invisible target wasdrawn from a predefined distribution of possible targets. The shape of thedistribution was Gaussian with the center at an integer number of degrees
from the fixation region (usually ±6° in x and y) and spread held fixed overeach experimental session. The targets only occurred at integer values of theGaussian. The probability associated with a rewarded target location variedbetween 4% and 0.1% and was given by the spread of the distribution(0.75°, 2°, and 2.75° SD). When a subject’s gaze landed within 2° of thetarget in both the x and y directions, a reward tone marked the successfulend of the trial. For the target to be “found,” fixation (monitored in realtime as detailed below) needed to remain steady within the target windowfor at least 50 ms. This duration ensured that the target was never foundsimply by sweeping through during a saccade. If at the end of 20 s the targetwas not found, the trial ended with no tone and a fixation cross appearedindicating the beginning of a new trial.
Trial timing and data collection were managed by the TEMPO softwaresystem (Reflective Computing) and interfaced with the stimulus display usingan extension of the Psychophysics Toolbox (66) running under MATLAB(MathWorks). Eye movement data were obtained using a video-based eyetracker (ISCAN), sampled at 240 Hz for humans. Eye data were calibrated byhaving the participants look at stimuli at known locations. Eye movementswere analyzed offline in MATLAB. We detected saccades and blinks by usinga conservative velocity threshold (40°/s with a 5-ms shoulder after each sac-cade) after differentiating the eye position signals. Periods of steady fixationduring each trial were then marked and extracted for further analyses. Eyepositions off of the search screen were discounted from analysis. Visual in-spection of individual trials confirmed that the marked periods of fixationwere indeed free from saccades or blinks.
Turning Points. In addition to saccades identified by speed criteria, the eyetracking data were processed to estimate the step-size distribution of all eyemovements, even within a fixation. To that end, blinks were first removed byremoving samples off the screen. Next, we considered the data points threeat a time, xt−1, xt, and xt+1, where x are the 2D data points and t indexesthe time samples, to construct two segments of the eye track a = xt−1 − xtand b = xt − xt+1. We then tested whether the cosine of the angle betweenthese two was greater or less than 0.95. If the cosine was greater than 0.95,then the center point, xt, was marked as a “turning” point. In addition, someof the large steps slowly curved and this introduced extraneous points (i.e.,dividing a long step into two short steps). To overcome this problem, wetook advantage of the fact that two long steps almost never occur one afterthe other without a dense fixation region in between, and any point with noneighbors within 0.5° was assumed to be extraneous and was removed. Thisresulted in points at which the eye made a significant deviation from ballisticmotion and was used to generate the step size distributions in Fig. 5.
ACKNOWLEDGMENTS. We thank Krista Kornylo and Natalie Dill for technicalassistance. This work was supported in part by National Science Foundation(NSF) Grant SBE 0542013 to the Temporal Dynamics of Learning Center,an NSF Science of Learning Center grant (to L.C., J.S., M.C.M., and T.J.S.),a Blasker Rose-Miah grant from the San Diego Foundation (to L.C.), Office ofNaval Research Multidisciplinary University Research Initiative Award N00014-10-1-0072 (to J.S. and T.J.S.), and Howard Hughes Medical Institute (T.J.S.).
1. Potter MC (1975) Meaning in visual search. Science 187(4180):965–966.2. Itti L, Koch C (2000) A saliency-based search mechanism for overt and covert shifts of
visual attention. Vision Res 40(10-12):1489–1506.3. Oliva A, Torralba A (2006) Building the gist of a scene: The role of global image
features in recognition. Prog Brain Res 155:23–36.4. Torralba A, Oliva A, Castelhano MS, Henderson JM (2006) Contextual guidance of eye
movements and attention in real-world scenes: The role of global features in objectsearch. Psychol Rev 113(4):766–786.
5. Neider MB, Zelinsky GJ (2006) Scene context guides eye movements during visualsearch. Vision Res 46(5):614–621.
6. Rayner K, Castelhano MS, Yang J (2009) Eye movements when looking at unusual/weird scenes: Are there cultural differences? J Exp Psychol Learn Mem Cogn 35(1):254–259.
7. Võ ML, Henderson JM (2010) The time course of initial scene processing for eyemovement guidance in natural scene search. J Vis 10(3):11–13.
8. Castelhano MS, Heaven C (2010) The relative contribution of scene context and targetfeatures to visual search in scenes. Atten Percept Psychophys 72(5):1283–1297.
9. Castelhano MS, Heaven C (2011) Scene context influences without scene gist: Eyemovements guided by spatial associations in visual search. Psychon Bull Rev 18(5):890–896.
10. Hayhoe M, Ballard D (2005) Eye movements in natural behavior. Trends Cogn Sci 9(4):188–194.
11. Parkhurst DJ, Niebur E (2003) Scene content selected by active vision. Spat Vis 16(2):125–154.
12. Tatler BW, Vincent BT (2009) The prominence of behavioural biases in eye guidance.Vis Cogn 17(6–7):1029–1054.
13. Chun MM, Jiang Y (1998) Contextual cueing: Implicit learning and memory of visual
context guides spatial attention. Cognit Psychol 36(1):28–71.14. Milstein DM, Dorris MC (2007) The influence of expected value on saccadic prepa-
ration. J Neurosci 27(18):4810–4818.15. Xu-Wilson M, Zee DS, Shadmehr R (2009) The intrinsic value of visual information
affects saccade velocities. Exp Brain Res 196(4):475–481.16. Shadmehr R (2010) Control of movements and temporal discounting of reward. Curr
Opin Neurobiol 20(6):726–730.17. Shadmehr R, Orban de Xivry JJ, Xu-Wilson M, Shih TY (2010) Temporal dis-
counting of reward and the cost of time in motor control. J Neurosci 30(31):
10507–10516.18. Reinagel P, Zador AM (1999) Natural scene statistics at the centre of gaze. Network
10(4):341–350.19. Tatler BW, Baddeley RJ, Vincent BT (2006) The long and the short of it: Spatial sta-
tistics at fixation vary with saccade amplitude and task. Vision Res 46(12):1857–1862.20. Açık A, Sarwary A, Schultze-Kraft R, Onat S, König P (2010) Developmental changes in
natural viewing behavior: Bottom-up and top-down differences between children,
young adults and older adults. Front Psychol 1:207.21. Buswell GT (1935) How People Look at Pictures: A Study of the Psychology of Per-
ception in Art (Univ of Chicago Press, Chicago).22. Yarbus AL (1967) Eye Movements and Vision (Plenum, New York).23. Castelhano MS, Mack ML, Henderson JM (2009) Viewing task influences eye move-
ment control during active scene perception. J Vis 9(3):1–15.24. Greene MR, Liu T, Wolfe JM (2012) Reconsidering Yarbus: A failure to predict ob-
servers’ task from eye movement patterns. Vision Res 62:1–8.
Chukoskie et al. PNAS Early Edition | 7 of 8

25. Schütz AC, Trommershäuser J, Gegenfurtner KR (2012) Dynamic integration of in-formation about salience and value for saccadic eye movements. Proc Natl Acad SciUSA 109(19):7547–7552.
26. Stritzke M, Trommershäuser J (2007) Eye movements during rapid pointing underrisk. Vision Res 47(15):2000–2009.
27. Geng JJ, Behrmann M (2005) Spatial probability as an attentional cue in visual search.Percept Psychophys 67(7):1252–1268.
28. Wolfe JM, Võ ML, Evans KK, Greene MR (2011) Visual search in scenes involves se-lective and nonselective pathways. Trends Cogn Sci 15(2):77–84.
29. Charnov EL (1976) Optimal foraging, the marginal value theorem. Theor Popul Biol9(2):129–136.
30. Bénichou O, Coppey M, Moreau M, Suet P-H, Voituriez R (2005) Optimal searchstrategies for hidden targets. Phys Rev Lett 94(19):198101–198104.
31. Gilchrist ID, North A, Hood B (2001) Is visual search really like foraging? Perception30(12):1459–1464.
32. Smith AD, Gilchrist ID, Hood BM (2005) Children’s search behaviour in large-scalespace: Developmental components of exploration. Perception 34(10):1221–1229.
33. Sutton RS (1988) Learning to predict by the method of temporal differences. MachLearn 3(1):9–44.
34. Montague PR, Sejnowski TJ (1994) The predictive brain: Temporal coincidence andtemporal order in synaptic learning mechanisms. Learn Mem 1(1):1–33.
35. Lee D, Seo H, Jung MW (2012) Neural basis of reinforcement learning and decisionmaking. Annu Rev Neurosci 35:287–308.
36. Niv Y, Joel D, Meilijson I, Ruppin E (2002) Evolution of reinforcement learning inuncertain environments: A simple explanation for complex foraging beaviors. AdaptBehav 10(1):5–24.
37. Snider J (2011) Optimal random search for a single hidden target. Phys Rev E StatNonlin Soft Matter Phys 83(1 Pt 1):011105.
38. Yu AJ, Cohen JD (2008) Sequential effects: Superstition or rational behavior?,eds Koller D, Schuurmans D, Bengio Y, Bottou L Advances in Neural InformationProcessing Systems (MIT Press, Cambridge, MA), Vol. 21, pp 1873–1880.
39. Sutton RS, Barto AG (1998) Reinforcement Learning: An Introduction (MIT Press,Cambridge, MA), p xviii.
40. Rayner K (1998) Eye movements in reading and information processing: 20 years ofresearch. Psychol Bull 124(3):372–422.
41. Araujo C, Kowler E, Pavel M (2001) Eye movements during visual search: The costs ofchoosing the optimal path. Vision Res 41(25–26):3613–3625.
42. Schultz W, Dayan P, Montague PR (1997) A neural substrate of prediction and reward.Science 275(5306):1593–1599.
43. Humphries NE, et al. (2010) Environmental context explains Lévy and Brownianmovement patterns of marine predators. Nature 465(7301):1066–1069.
44. James A, Plank MJ, Edwards AM (2011) Assessing Lévy walks as models of animalforaging. J R Soc Interface 8(62):1233–1247.
45. Viswanathan GM, et al. (1999) Optimizing the success of random searches. Nature 401(6756):911–914.
46. Adams GK, Watson KK, Pearson J, Platt ML (2012) Neuroethology of decision-making.Curr Opin Neurobiol 22(6):982–989.
47. Fecteau JH, Munoz DP (2003) Exploring the consequences of the previous trial. NatRev Neurosci 4(6):435–443.
48. Wilder MH, Mozer MC, Wickens CD (2011) An integrative, experience-based theory ofattentional control. J Vis 11(2), 10.1167/11.2.8.
49. Herrnstein RJ (1961) Relative and absolute strength of response as a function offrequency of reinforcement. J Exp Anal Behav 4:267–272.
50. Greggers U, Mauelshagen J (1997) Matching behavior of honeybees in a multiple-choice situation: The differential effect of environmental stimuli on the choice pro-cess. Anim Learn Behav 25(4):458–472.
51. Lau B, Glimcher PW (2005) Dynamic response-by-response models of matching be-havior in rhesus monkeys. J Exp Anal Behav 84(3):555–579.
52. Bradshaw CM, Szabadi E, Bevan P (1976) Behavior of humans in variable-intervalschedules of reinforcement. J Exp Anal Behav 26(2):135–141.
53. Gallistel CR, et al. (2007) Is matching innate? J Exp Anal Behav 87(2):161–199.54. Mark TA, Gallistel CR (1994) Kinetics of matching. J Exp Psychol Anim Behav Process
20(1):79–95.55. Baum WM (1982) Choice, changeover, and travel. J Exp Anal Behav 38(1):35–49.56. Bisley JW, Goldberg ME (2010) Attention, intention, and priority in the parietal lobe.
Annu Rev Neurosci 33:1–21.57. Fecteau JH, Munoz DP (2006) Salience, relevance, and firing: A priority map for target
selection. Trends Cogn Sci 10(8):382–390.58. Mirpour K, Arcizet F, Ong WS, Bisley JW (2009) Been there, seen that: A neural
mechanism for performing efficient visual search. J Neurophysiol 102(6):3481–3491.59. Klein JT, Deaner RO, Platt ML (2008) Neural correlates of social target value in ma-
caque parietal cortex. Curr Biol 18(6):419–424.60. Platt ML, Glimcher PW (1999) Neural correlates of decision variables in parietal cortex.
Nature 400(6741):233–238.61. Hayden BY, Pearson JM, Platt ML (2011) Neuronal basis of sequential foraging deci-
sions in a patchy environment. Nat Neurosci 14(7):933–939.62. Mirpour K, Ong WS, Bisley JW (2010) Microstimulation of posterior parietal cortex
biases the selection of eye movement goals during search. J Neurophysiol 104(6):3021–3028.
63. Carello CD, Krauzlis RJ (2004) Manipulating intent: Evidence for a causal role of thesuperior colliculus in target selection. Neuron 43(4):575–583.
64. Nakahara H, Hikosaka O (2012) Learning to represent reward structure: A key toadapting to complex environments. Neurosci Res 74(3-4):177–183.
65. Yasuda M, Yamamoto S, Hikosaka O (2012) Robust representation of stable objectvalues in the oculomotor Basal Ganglia. J Neurosci 32(47):16917–16932.
66. Brainard DH (1997) The Psychophysics Toolbox. Spat Vis 10(4):433–436.
8 of 8 | www.pnas.org/cgi/doi/10.1073/pnas.1301216110 Chukoskie et al.

Supporting InformationChukoskie et al. 10.1073/pnas.1301216110Ideal Observer ModelThe general problem to solve is given a target distribution Tð~xÞdescribing the probability a target is at location~x and a searchwindow with size R, estimate the guess distribution Gð~xÞ fromwhich random points are sampled until the target is within R ofthe random point. This has been solved previously (1), and wewill just reproduce a simplified version here.Along with existence of the guess and target distributions,Gð~xÞ
and Tð~xÞ, we assume the following:
1. The target distribution is known.2. The search points are independently chosen from the guess
distribution.3. The time required to move from guess point to guess point is
negligible.
These assumptions describe the experimental case quite wellafter learning has taken place. Respectively, the subject is fast andsuccessful, the correlations between eye positions (guesses) areweak in the sense that their length scale isK18 (Fig. 3), which isless than the length scale of the search, and the eye moves veryquickly compared with time spent fixating. The assumption ofuncorrelated steps likely fails as the length scale of the searchdecreases, that is, for σT = 0:75, where the problem stops beingabout search and more about moving the eye to a fixed, learnedlocation.Using these assumptions the general idea is to calculate the
probability that a guess will be successful and optimize that tominimize the total number of guesses. The probability that a guessis successful for finding a target at location~x is the integral of allpoints in the guess distribution that satisfy the range requirement:
Pð~xÞ=Z
~Cð~xÞ
d~yGð~yÞ;
where Cð~xÞ is the region where a target at position ~x wouldbe found.Then, the mean number of steps to find the target is one over
the probability; for example, the mean number of times a die isrolled before finding a 1 is 6= 1=pð1Þ, where p(1) is the proba-bility of rolling a 1 or 1=6. Averaging over the probability a targetis actually at position~x, Tð~xÞ, leaves
hni=Z
d~xTð~xÞR
~Cð~xÞd~yGð~yÞ;
and the optimum occurs at
0 =δ
δGð~yÞ�hni+ α
�1−
Zd~tG
�~t���
;
where α is a Lagrange multiplier associated with normaliza-tion of G. Under reasonable existence and compactness assump-tions, this optimization problem is solvable (1) and most generallysatisfies
Tð~xÞ�Z~Cð~xÞ
d~yGð~yÞ�2 ∝ 1;
where, intuitively, the functional derivative of 1=G gives 1=G2.This has an interesting expansion when Cð~xÞ is small enough thatthe integral over G can be approximated with the mean valuetheorem, leaving
Gð~xÞ ∝ffiffiffiffiffiffiffiffiffiffiTð~xÞ
p:
Optimum Guess Distribution for a 2D Gaussian TargetDistributionTo interface with the main text, the target distribution is alwaysa 2D Gaussian with a square window of ±R= 28 for finding thetarget. Here we will apply the search theory to calculate idealvalues of the measured quantities.
Guess Distribution.For the case of a 2DGaussian target distribution,
Gðx; yÞ∝ffiffiffiffiffiffiffiffiffiffiffiffiffiffiffiffiffiffiffiffiffiffiffiffiffiffiffiffiffiffiffiexp
−x2 + y2
2σ2T
!vuut
∝ exp
−
x2 + y2
2� ffiffiffi
2p
σT�2!:
In other words, for a Gaussian target distribution with SD σT , theoptimum guess distribution is also a Gaussian but with SDσG =
ffiffiffi2
pσT .
The square root rule holds only when the size of the searchwindow is very small, but a low-order correction taking into ac-count the window size has been derived elsewhere (1). The basicidea is that as the window size increases, the width of the guessdistribution decreases because the searcher sees the tails for freewhen looking near the center. The general result for Gaussiansand a search window of size ±R is that the optimum guessdistribution is also a Gaussian with SD
σG =ffiffiffi2
pffiffiffiffiffiffiffiffiffiffiffiffiffiffiffiffiσ2T −
R2
π2
s; [S1]
and that is the formula used to estimate the ideal behavior in themain text.
Mean Distance. The theory presented here predicts that the op-timum guess distribution is a 2DGaussian with the same center asthe target distribution with a specific SD. In that case the meandistance from the center of the target distribution is
hdi=ZdxZdy
ffiffiffiffiffiffiffiffiffiffiffiffiffix2 + y2
p2πσ2G
exp�−x2 + y2
2σ2G
�:
By switching to radial coordinates, the integral can be easily doneto give
hdi=ffiffiffiπ
2
rσG: [S2]
Number of Steps.The case of interest is 2D, and that happens to besolvable in the sense that we can derive the mean number of stepsto find the target in terms of the SD of the guess and targetdistributions. The average number of samples required to find thetarget is
Chukoskie et al. www.pnas.org/cgi/content/short/1301216110 1 of 7

hni= σ2Gσ2T
ZdxZ
dye− 1
2x2+y2
σ2TR x+R
x−R duR y+Ry−R dve
− 12u2+v2
σ2G
:
The double integral in the denominator represents the probabilityof contacting the target for a guess at position ðu; vÞ, and thenumerator weights the probability that the target is actually atthat location. Here the boundaries are taken to be at infinitybecause we will stay far away from them.The integral in the denominator can be represented in terms of
complementary error functions as
Id =14
�erf�R+ xffiffiffi2
pσG
�− erf
�x−Rffiffiffi2
pσG
��
�erf�R+ yffiffiffi2
pσG
�− erf
�y−Rffiffiffi2
pσG
��:
Each of the differences of erfs (one for x and one for y) can beapproximated as a Gaussian by matching the zeroth and secondmoments. Those are
I½0�d;x = erf�
Rffiffiffi2
pσG
�
and
I½2�d;x = −ffiffiffi2π
rRs3
e− x2
2σ2G :
Then, by matching moments, Id is well approximated as
Id ≈ erf2�
Rffiffiffi2
pσG
�e− x2+y2
2σ2H ;
where
σ2H =σ3GR
ffiffiffiπ
2
rerf�
Rffiffiffi2
pσG
�e
R2
2σ2G :
Finally, the double integral remaining for hni is just a Gaussianintegral:
hni≈ 12πσ2T
erf−2�
Rffiffiffi2
pσG
�
×RR
dxdy exp�−12
�1σ2T
−1σ2H
��x2 + y2
��:
The 2D Gaussian integral happens to be exactly solvable and is
hni≈ erf−2�
Rffiffiffi2
pσG
�σ2H
σ2H − σ2T: [S3]
This puts the average number of steps as a direct function of σGand the given parameters R and σT (Fig. S1).The measurement of the mean number of steps is difficult from
subject data because of the limited sample size. The agreement isreasonably good with subjects approaching the optimum numberof steps (Table S1). Subjects do not actually reach the optimum,but they get within a few steps of it. This may either be because thebehavior is good enough, or it may reflect errors due to the se-quential effects that overemphasize looking near the last foundtarget. In the actual case of the experiment with randomly placed
targets, a tendency to go back to a recently rewarded locationincreases the number of samples.
Simulated Step Number.To verify the calculation for the number ofsteps and incorporate potential biases of the guess distribution,we ran direct simulations of the experiment. A step of simulationwas as follows. For a given target distribution (Gaussians centeredat zero without loss of generality), we chose a random targetpoint. Then, from a given guess distribution (another Gaussian,centered either 0° or 1° away with fixed σG), we chose searchpoints until the search was within ± 28 of the target in both the xand y directions. The number of samples was then tabulated, andits average and SE for each choice of the guess and target dis-tributions estimated the average number of saccades required tofind the target. Note that in Fig. S1 the data points agree nearlyperfectly with the theory lines, although the approximations usedto generate the theory lines start to break down for the smallestσG as expected because there was an expansion in σT=σG.
Reinforcement Learning ModelReinforcement Learning. Participants’ behavior in the HiddenTarget Search Task is modeled within a reinforcement learningframework (2). In reinforcement learning (RL), an agent operatesin a finite-state environment and takes actions that move it fromone state to another, leading to states associated with reward. Inthe Hidden Target Search Task, the state space consists of the eyeposition in the 2D display. We discretize this eye position in unitsof 18; allowing eye position to vary from −128 to + 128, the statespace consists of 25× 25 locations. At the start of the trial, theinitial state of the model is at the fixation point in the center of thedisplay, ð0; 0Þ. The actions available to the model consist of sac-cades specifying relative movement of the eyes, also discretized.RL is concerned with discovering the action or action sequencesthat lead to a reward.The simplest RL approach is to define a value function, V ðsÞ,
that specifies the expected reward associated with each state s.The value function might be implemented as a look-up tableassociating each of the 25× 25 states with an expected reward.When the target is detected, the value associated with the cur-rent state is updated to reflect a rewarding event. The RL modelshould select an action, a, in state s that maximize the valueV ðs+ aÞ. Because the eyes can in principle move from any po-sition to any other position, decision making according to such amodel is independent of the current eye position: At each decisionpoint, the model should saccade to the most promising location onthe screen.This intuitive model is naive as an explanation of how people
learn in two regards.
1. A look-up table encodes space as a set of distinct, nonover-lapping locations. In contrast, neural representations in visualcortex are coarse-coded: Neurons have broad, overlappingreceptive fields. Consequently, any learning about one lo-cation will have a natural generalization gradient to nearbylocations. We incorporate this notion of generalization viaa kernel-based RL approach (3) in which the value function isrepresented by a look-up table, but instead of updating thevalue associated with the current state s, V ðsÞ, all states q areupdated with strength—or eligibility as it is called in the RLliterature—proportional to
expð−μks− qkÞ; [S4]
where μ is a free parameter of the model characterizing thegeneralization gradient.
2. Individuals performing Hidden Target Search Task showa strong proximity bias that favors shorter saccades, as illus-trated by the distribution of saccade vectors (shifts in position
Chukoskie et al. www.pnas.org/cgi/content/short/1301216110 2 of 7

from one fixation to the next) observed in our experiment(Fig. S2). This proximity bias could be an emergent conse-quence of some more fundamental cause, such as variabilityin saccade outcomes growing with saccade distance (4, 5)or representational inhomogeneities in the superior colli-culus (6). The bias has been noted by other researchers andcan override knowledge that subjects have about the ex-pected location of a target (7). However, we model the biasdirectly by assuming a cost that grows with saccade dis-tance, leading to an action selection rule in which the prob-ability of making a relative saccade, a, from some state s isproportional to
PðajsÞ∝ exp ðV ðs+ aÞ− ρkakÞ; [S5]
where ρ is a free parameter that scales the cost. This biastransforms a task that has no inherent sequential structure (suchas maze learning) into a sequential decision task—a task inwhich the model must plan sequences of actions to obtain areward. Thus, the temporal difference (TD) learning paradigm(2) is appropriate for modeling learning and performance.Withthese two extensions, our model can be cast in terms of traditionalTD value function learning, with an exploration policy specifiedby a slightly embellished version of Eq. S5 in which we incor-porate an exploration parameters β (for softmax action selec-tion) and « (for «-greedy action selection):
PðajsÞ∝ exp ðβV ðs+ aÞ− ρkakÞ+ e: [S6]
Both forms of exploration were included because we were notcertain a priori which form would better match participant be-havior. Softmax exploration turned out to be more important,but «-greedy exploration better accommodated occasional off-policy (random) actions. Our model included the standard TDtrace-decay parameter λ, usually notated as TD(λ), discount pa-rameter γ, and learning rate α, yielding the TD rule for updatingthe entire value function after each fixation:
ΔV�qjs; s′�= α
�r+ γV
�s′�−V ðsÞ�eligibilityðqÞ; [S7]
where s is the current state (fixation) of the model, s′ is the nextstate, r is the instantaneous reward (1 if target is found at s,0 otherwise), q is an index over all states, and eligibilityðqÞ isan additive eligibility trace associated with state q, updated fol-lowing each saccade according to TD(λ) with the additional spa-tial blurring function of Eq. S4:
Δeligibility ðqjsÞ= ðγλ− 1Þeligibility ðqÞ+ exp ð−μks− qkÞ: [S8]
Bayesian interpretation of model.The model can be interpreted froma Bayesian perspective in which the value function specifies thelog likelihood of reward given an action (saccade) and theproximity bias specifies log priors over actions given the currenteye position. Via Eq. S6, actions are then selected from a pos-terior distribution conditioned on the model’s current eye posi-tion and experience history.Training the model.The model has in total seven free parameters: α,β, γ, «, λ, μ, and ρ. For each session of each participant, wesearched for the parameters that yielded the maximum likeli-hood fit to the fixations of the first 20 trials of the session. Thelikelihood is based on the joint probability of the fixation se-quence over the first 20 trials, or, using the chain rule, the productof the probabilities of each fixation contingent on the historyleading up to that fixation. Given a set of parameters, the modelspecifies this probability. Over participants, there was a mean of473 fixations in the first 20 trials.
We used an L1 distance metric in both Eqs. S6 and S8. Wenoted in the data that many participants tended to producehorizontal and vertical saccades, suggesting a city block metric tobe more sensible as a measure of proximity of two screen loca-tions. Confirming this intuition, we found that the fixation like-lihoods were higher using an L1 than using an L2 metric.To assess the validity of our assumption that the reward signal
has spatial blurring, as embodied in μ, we constrained μ to a largevalue (meaning no blurring) and refit the model. Similarly, toassess the validity of our assumption of a saccade proximity bias,as embodied in the coefficient ρ, we constrained the coefficientto be zero and refit the model. In both cases, we found thatremoval of the assumption yielded a noticeable decrease in thegoodness of fit to the fixation sequences, suggesting that thesetwo assumptions are warranted.Fig. S3 depicts a sequence of saccades from one participant on
one trial, along with model predictions of where the participantwill look. This example follows 10 earlier successes at locating thetarget. As the example shows, the model does a reasonable job ofpredicting the participant’s specific eye movements.Fig. S4 shows an example of the evolution of the value function
across trials as estimated by the RL model for the specific fixationand reward sequence of one human participant.Testing the model. Following training, in which model parametersare determined from a participant’s fixation sequence, the param-eterized model can be run in generative mode from a de novo stateto simulate the participant performing the task over a session. Atthe start of the session, the value function is reset by assigning allentries the value zero. The model begins each trial with fixation atthe origin, and each subsequent fixation is drawn from the distri-bution specified by Eq. S6. Given feedback—success or failure inlocating the target—the eligibility trace and value function are up-dated (Eqs. S7 and S8). This cycle repeats until the target is foundor until the trial limit is reached. Because the limit during the ex-periments was defined by the passage of time (20 s) and the modeloperates in abstract simulation steps, we assumed the mean timeper fixation for the model was the same as for its correspondingparticipant and terminated the trial when the simulation time limitwas reached. Consequently, the model did not find the target onevery trial. The specific target location chosen on each trial was thesame as the location chosen for the corresponding participant onthat trial.To collect statistics on the model’s performance, we used the
maximum likelihood parameter estimate for each participant ineach condition and ran 200 replications of the parameterizedmodel in generative mode using the same target location se-quence over trials as was shown to the participant. The repli-cations differed from one another in stochastic action selection.Model statistics reported in the main text are means over the 200replications, and either means or medians over the participants.Individual differences in the emergent behavior of the model. Becauseonly the first 20 trials were used for training, and because thecriterion used to train the model (likelihood of a specific fixationsequence) is only loosely related to the various performancemeasures obtained from the model as it generated sequences ofdecisions (e.g., mean distance from target centroid), it is non-trivial that the model’s generated behavior matches the partic-ipants’. Thus, we consider the simulation results presented in themain text to be emergent predictions of the model.Nonetheless, the results are limited in that they merely show that
the aggregate behavior of individuals corresponds to the behavior ofthe model, averaged over multiple instantiations. The results saylittle about how well the model can account for individual differ-ences in performance. To explore how themodel—when trained onfixation sequences of a particular individual—characterizes thatindividual’s behavior, we examined two statistics of an individual’sperformance once behavior stabilized (trials 31–60): (i) meandistance of fixations to the target centroid and (ii) fixation spread.
Chukoskie et al. www.pnas.org/cgi/content/short/1301216110 3 of 7

These two measures are shown in aggregate across participants inFig. 2 A and B of the main text. Each of these measures correlateswell with the performance obtained by the model parameterizedfor the individual (distance: Spearman’s ρ = 0.40, 0.71, and 0.53 fortarget spreads 0.75, 2.00, and 2.75, respectively; spread: Spear-man’s ρ = 0.24, 0.62, and 0.68). Thus, the model characterizes therelative search distributions of individuals.In a further exploration of individual differences, we observed
that some participants tended to begin a trial by making a se-quence of fixations that gradually approached the target centroid,whereas others made a saccade to the centroid and then movedaway on subsequent fixations. We characterized the initial tra-jectory by computing the mean distance to the target centroid offixations 1–5 on trials 31–60 and computed the slope of theregression line. Negative and positive slopes indicate trajectoriestoward and away from the centroid, respectively. The Spearmancorrelation coefficient relating the model’s predicted slope tothe corresponding participant’s slope was ρ= :48, indicatingthat the model does a fair job of describing aspects of strategicperformance.
Sequential Dependencies. Based on observations of the RL model,we predicted that participants in the experiment would exhibitsequential dependencies—fixation behavior that was dependenton the recent history of fixations and reward. We showed in themain text that both model and participants showed reliable trial-to-trial dependencies. Fig. 3 shows that sequential dependenciesextend back beyond the previous trial, and there is a decayinginfluence of recent experience. The value-function update (Eq.S7) is consistent with this decay, with exponential rate related toα. Thus, performance is never static, but continually adapts tothe ongoing stream of experience. In both model and partic-ipants, sequential dependencies persist throughout the session;they are not merely a transient that occurs while the learner isstill trying to ascertain the target distribution.
Sequential dependencies occur in the RL model because thevalue function is updated after every fixation, and with a constantlearning rate the function does not converge (i.e., adjustments tothe value function do not go to zero over time). Consequently,there is a cost in performance because the true target distributionis never exactly learned. More experience does not guaranteea better representation of the target distribution. In contrast, theideal-observer theory is premised on perfect knowledge of thetarget distribution. It specifies the level of human performancethat can be attained in a stationary environment.Naturalistic environments are certainly nonstationary. In the
presence of nonstationarity, there is a benefit of continued sen-sitivity to recent experience: When the environment changes, theagent will rapidly adapt. The trade-off between performing wellin a fixed environment and rapidly learning a new environmentnaturally leads to sequential dependencies (8–10). It remainsa final piece in the puzzle to develop an ideal-observer theory ofsearch in environments with known nonstationary characteristics,combining both (1) and ideal-observer theories of change de-tection (11, 12).Addressing this puzzle may also help tackle a longstanding
question in visual search: What role does memory play? The roleof memory in visual search has been debated (13–15), and theconsensus is that the choice of the next saccade is informed bymemory for a small number of previously attended locations.The value function in our RL model provides the substrate bywhich this memory could be implemented. According to themodel, the memory is limited because (i) the value functionencodes long-term memory as well as short-term experience, andthe two are superimposed, (ii) the spatial generalization of re-ward (via the μ parameter) blurs the memory, and (iii) explo-ration (via the β parameter) weakens the guidance of memory onaction selection.
1. Snider J (2011) Optimal random search for a single hidden target. Phys Rev E StatNonlin Soft Matter Phys 83(1 Pt 1):011105.
2. Sutton RS (1988) Learning to Predict by the Methods of Temporal Differences(Kluwer, Boston), pp 9–44.
3. Ormoneit D, Sen S (2002) Kernel-based reinforcement learning.Mach Learn 49:161–178.4. Abrams RA, Meyer DE, Kornblum S (1989) Speed and accuracy of saccadic eye
movements: characteristics of impulse variability in the oculomotor system. J ExpPsychol Hum Percept Perform 15(3):529–543.
5. Engbert R, Nuthmann A, Richter EM, Kliegl R (2005) SWIFT: A dynamical model ofsaccade generation during reading. Psychol Rev 112(4):777–813.
6. Sparks DL, Holland R, Guthrie BL (1976) Size and distribution of movement fields inthe monkey superior colliculus. Brain Res 113(1):21–34.
7. Araujo C, Kowler E, Pavel M (2001) Eye movements during visual search: The costs ofchoosing the optimal path. Vision Res 41(25-26):3613–3625.
8. Mozer MC, Shettel M, Vecera S (2006) Top-down control of visual attention: Arational account. Advances in Neural Information Processing Systems, eds Weiss Y,Schoelkopf B, Platt J (MIT Press, Cambridge, MA), Vol. 18, pp 923–930.
9. Yu AJ, Cohen JD (2008) Sequential effects: Superstition or rational behavior?Advances in Neural Information Processing Systems, eds Koller D, Schuurmans D,Bengio Y, Bottou L (MIT Press, Cambridge, MA), Vol 21, pp 1873–1880.
10. Wilder MH, Jones M, Mozer MC (2010) Sequential effects reflect parallel learning ofmultiple environmental regularities. Advances in Neural Information Processing Systems,eds Bengio Y, Schuurmans D, Lafferty J, Williams C, Culotta A (Neural InformationProcessing Systems Foundation, La Jolla, CA), Vol. 22.
11. Adams RP, MacKay DJ (2007) Bayesian online changepoint detection. arXiv:0710.3742v1 [stat.ML].
12. Brown SD, Steyvers M (2009) Detecting and predicting changes. Cognit Psychol 58(1):49–67.
13. Beck MR, Peterson MS, Vomela M (2006) Memory for where, but not what, is usedduring visual search. J Exp Psychol Hum Percept Perform 32(2):235–250.
14. Horowitz TS, Wolfe JM (1998) Visual search has no memory. Nature 394(6693):575–577.
15. Horowitz TS, Wolfe JM (2001) Search for multiple targets: Remember the targets,forget the search. Percept Psychophys 63(2):272–285.
Chukoskie et al. www.pnas.org/cgi/content/short/1301216110 4 of 7

(degrees)G
0 0.5 1 1.5 2 2.5 3 3.5 4 4.5 5
Mea
n st
eps
0
5
10
15
20
25
30
Fig. S1. The theoretical mean number of steps required to find the target for σT = 0:75;2:00;and2:75, bottom line to top, respectively. The lines aretheoretical values, and the points are calculated with a direct simulation of the problem (1 million trials per point). The minimum point agrees well withthe calculated values.
Fig. S2. Histogram of the saccade vector (in degrees visual angle), computed across participants, sessions, trials, and fixations within a trial.
Chukoskie et al. www.pnas.org/cgi/content/short/1301216110 5 of 7

Fig. S3. Simulation showing model behavior on one trial for one participant. Each row depicts a single fixation within the trial. The four columns depict theeligibility trace, the value function, the penalty associated with an eye movement based on distance from the current location, and the model’s probability ofselecting a saccade destination. The open square in each panel indicates the target location for that trial, which is fixed. The open circle indicates the currentfixation (the trial starts with fixation at the center of the screen). The X indicates the participant’s next saccade destination. In all panels, values are indicated bycoloring, where low values are blue and high values are red. For example, in the final column, note that the actual fixation lies in the red region—the regionwhere the model predicts the next saccade to occur. The model correctly predicts that the participant will move their eyes to neighborhood of the targetcentroid in the first saccade, and then will make short fixations in that neighborhood.
Chukoskie et al. www.pnas.org/cgi/content/short/1301216110 6 of 7

Fig. S4. Value function learning: The RL model’s estimate of the value function given the fixation sequence of a particular individual in the experiment. Eachpanel depicts the value function at the start of a trial for trials 1–20. The color scale ranges from blue to red, for low to high reward expectation. The green Xindicates the target centroid. The target neighborhood is rapidly identified, although the value distribution shifts slightly from trial to trial based on recentexperience.
Table S1. Mean steps to find the target
σT ,° hnifound hniall medianfound medianall hnitheory0.75 2.6 (3) 2.6 (3) 2.0 (3) 2.0 (3) 1.012.00 8 (2) 18 (4) 6 (2) 6 (4) 6.262.75 17 (3) 22 (4) 13 (3) 15 (4) 11.86
Numbers in parentheses are the standard error in the last digit.
Table S2. Bias toward the center and its effect on the measuredquantities
σT ,° Measured bias, ° σG;theory, ° hnitheory0.75 0.6 (3) 0.85 (5) 1.58 (1)2.00 1.2 (3) 2.7 (5) 7.01 (2)2.75 1.0 (5) 3.85 (5) 12.63 (3)
Positive bias is toward the center. Numbers in parentheses are the stan-dard error in the last digit.
Chukoskie et al. www.pnas.org/cgi/content/short/1301216110 7 of 7