Embed Size (px)
Citation preview

LEARNING TO REPRODUCESYNTHETIC 2-D ACTIONS
Robert Sekuler1,2, Aafia Siddiqui1, Nikhil Goyal1 and Rohin Rajan3
1Volen Center for Complex Systems, Mailstop 013,
Brandeis University, Waltham MA 02454 USA
2Department of Neurosurgery
The Children’s Hospital
Boston MA 02115 USA
3Program in Neuroscience
Boston University, Boston MA 02215 USA
Address correspondence to:
Robert SekulerVolen Center for Complex Systems, Mailstop 013Brandeis University, Waltham MA 02454 USAOffice phone: [email protected]
Running Head: Learning to reproduce
2
Abstract. Subjects observed and then reproduced abstract, irregular stimulus models
generated by the steady movement of a disk across two-dimensional paths. The paths
comprised 3 to 7 randomly-oriented linear segments linked head-to-foot.
Reproductions were expressed by moving a stylus over the surface of a graphics
tablet while the disk was tracing its trajectory (Concurrent reproduction), or soon
after the disk had finished (Delayed reproduction). For both Concurrent and Delayed
conditions, fidelity of reproduction fell with increasing number of segments in the
model. Overall quality of reproduction did not differ between the two conditions.
When a few models were repeated, interspersed among non-repeated ones,
performance improved, but only when reproduction was delayed. This improvement
was stimulus-selective, not a general improvement with practice. Two additional
experiments showed that (i) memory for a seen model is well preserved for at least six
seconds, with relatively modest need for rehearsal, and (ii) successful reproduction is
possible with remarkably little information having been extracted from key points in
the model’s trajectory.

3
1 Introduction
The ability to view and then reproduce other people’s actions is important in the
everyday lives of Homo sapiens. It contributes to the acquisition and fine-tuning of
important skills, including aspects of sports, food preparation, surgery, glass
blowing, and lacing one’s shoes. The ability to reproduce seen actions is
intriguing from a theoretical perspective because it requires cooperation among
cognitive and brain systems, including systems that participate in vision,
attention, motor planning, and control (Schaal 1999). Additionally, reproduction
of seen actions requires neural systems that translate between sensory and motor
domains (Milner and Goodale 1995).
When visuomotor reproduction is used to teach some skill, the time at
which a student’s reproduction begins can vary. In one approach, exemplified by
knitting or tying shoelaces, novices may be encouraged to reproduce the action
while that action is being modeled. In another approach, exemplified by martial
arts such as Karate and Tai Chi Chuan, or by golf, beginners may be encouraged
to delay their performance until the entire model or significant portions of it have
been completed. Our experiments assessed reproduction of synthetic actions
(“models”) defined in spatial as well as temporal coordinates. One experiment
compared delayed and concurrent reproduction.
When the start of reproduction is delayed, performance also calls upon
memory circuits dedicated to storing and later retrieving the action that had been
seen (Grezes, Costes and Decety 1999). To examine the effects of delay, Weeks,
Hall and Anderson (1996) used hand shapes from the American manual alphabet1
as stimulus models. As measured by a coarse, “pass-fail,” scoring system, delay
initially hindered reproduction, but, with practice, delay actually promoted rapid
4
improvement in hand shape reproduction. By experiment’s end, delayed
performance was more successful than concurrent performance.
Reproduction of seen actions requires close collaboration among processes
that are normally studied in isolation from one another (Goodale 1998). In
particular, the quality of reproduction depends upon the visual encoding of each
model, and the fidelity with which visual information is preserved in memory.
Therefore, we designed experiments to evaluate the contributions that vision and
memory make to the quality of reproduction.
2 Experiment 1: Reproduction performance and learning
Volunteers viewed simple, computer-generated 2-dimensional synthetic “actions,”
and then tried to reproduce them with a stylus and a graphics tablet. Each action
comprised a sequence of movements along a trajectory made up of randomly-
directed linked, linear segments. These stimuli offered a number of advantages.
For example, linear segments minimzed the striking misperceptions that can occur
with more biological, curvilinear trajectories (Viviani and Stucchi 1989; Viviani
and Stucchi 1992). Also, these abstract models resisted verbal encoding, and
provided a natural way to manipulate task complexity of reproduction, by
varying the number of segments in a model.
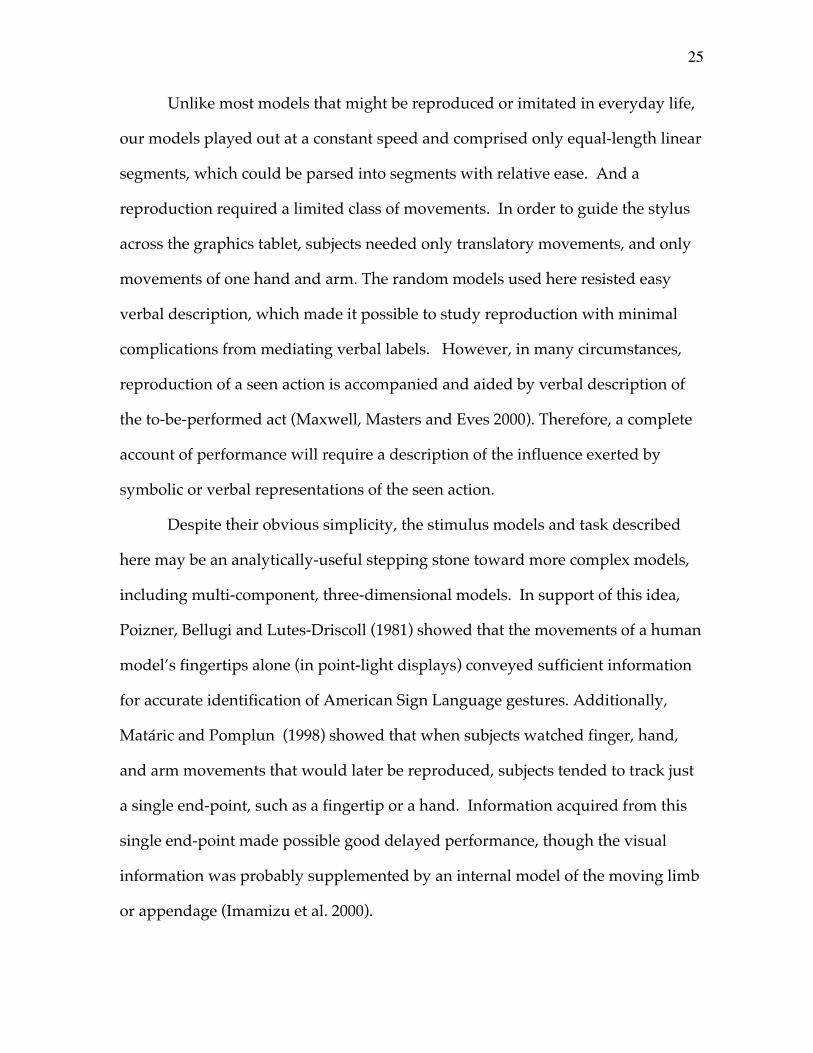
Figure 1 shows sample models. When looking at these samples, it is
important to remember that subjects never saw an entire trace at once; instead, at
any moment, they saw only the disk’s current position, which was updated at 60
Hz. In order for the entire path to be visualized, the mind’s eye has to knit
together momentary samples of disk positions in order to form oriented segments
(Jancke 2000).
5
With both Concurrent and Delayed reproduction, we measured initial
performance, as well as improvement with practice. The design of the experiment
made it possible to distinguish between (i) general effects of practice with the task,
and (ii) improvement that arose from the repetition of particular models. Most
studies of perceptual and motor learning have tended to use massed repetitions of
the same stimulus (Weeks et al. 1996; Grezes et al. 1999; Karni and Bertini 1997).
This experiment took a different approach, separating repetitions of particular
stimuli from one another by several minutes, and randomly interspersing those
repetitions among presentations of many other, non-repeated, novel models.
2.1 Method
2.1.1 Design
Our stimulus models were designed to promote perceptibility and to facilitate
execution of component movements. The stimulus-generation algorithm
embodied various constraints, which introduced some predictability into the
models’ trajectories. Table 1 summarizes the main constraints built into the
models.
Each to-be-reproduced trajectory comprised three, four, five, six, or seven
connected, linear segments, each 2.25 degrees visual angle long. A pale-red disk
defined the model by moving successively along each of the model’s linear
segments. The disk’s movements were constrained to directions ranging from 0 to
330 degrees, in steps of 30 degrees. The disk, which subtended 0.45 deg visual
angle, moved at 10 deg/sec (250 msec/segment), across a white background (97
cd/m2), and paused for 150 msec at the end of each segment. Preliminary testing
showed that without a pause, abrupt changes in direction tended to be
misperceived, appearing as smoothly curving paths in which successive segments
6
blended smoothly into one another. Similar perceptual smoothing of abrupt
changes in direction was reported by Brown and Voth (1937).
Finally, potential trajectories that formed closed figures were eliminated
before testing. Pilot work suggested that when subjects were shown a closed
trajectory, they tended to name it and then seemed to rely on that name when
reproducing what they had seen. Because a generic name (e.g., “bunny rabbit”)
failed to represent the model’s details, using that name to mediate performance
led to sub-optimal reproduction. This phenomenon is reminiscent of Carmichael,
Hogan and Walter’s (1932) demonstration that reliance on verbal mediators can
influence and even distort reproduction of static figures.
2.1.2 Participants
Twenty-eight paid volunteers, aged 17-32 years, were assigned randomly to two
groups.
2.1.3 Proceedure
Participants sat facing a 17” computer display that was approximately 75 cm
away. No chinrest or head support was used. A graphics tablet 50 cm from the
subject was mounted at 45 degrees relative to both the subjects’ line of sight and to
the vertical.2 Each trial began with a short beep heralding the stimulus disk’s
appearance at the display’s center. One second later, this disk began to move
along the model trajectory, which the subject reproduced by drawing with the
stylus on the graphics tablet. Subjects were encouraged to be as accurate as
possible, but no instructions were given about speed of reproduction. Subjects
controlled the stylus with their preferred hands. The stylus’ position was sampled
at a rate of 60 Hz, and stored for subsequent analysis offline.
7
One group of subjects’ visuomotor reproductions were concurrent with the
presentation of the stimulus model. Because Concurrent reproduction began very
soon after the start of the disk’s movement, the task resembled a classic pursuit-
tracking task (Adams 1987). In contrast, subjects in the second group delayed the
start of reproduction until they heard a distinctive beep, 500 msec after the
model’s completion.
In Delayed reproduction, a ‘response’ disk visible on the computer display
tracked the stylus’ position and movement; because the model had already been
completed, the model disk was no longer visible. For Concurrent reproduction,
no visible disk tracked the subject’s response; subjects saw only the model disk. A
tracking disk was omitted in order to avoid confusion that would arise from the
simultaneous presentation of two moving disks, one comprising the model and
one representing the response.3 Although there were good reasons to omit a
tracking disk from the Concurrent condition, that omission did introduce an
intentional confound into the experiment: Mode of reproduction (Concurrent vs.
Delayed) is confounded with the availability of visible feedback to the subject. We
discuss the consequences of this confound below, in the Discussion section.
2.1.4 Design
Participants practiced with 5-15 models of varying length, using the mode of
reproduction on which they would later be tested. None of the practice models
were used in subsequent testing. During the experiment, subjects observed and
reproduced 70 models distributed over three trial blocks, which were separated by
about 5 minutes rest. In each block, models of varying lengths — 3, 4, 5, 6, or 7
segments— occurred in random order and with equal frequency. Blocks 1, 2, and 3
comprised 30, 30, and 10 models respectively. In each of the three blocks of trials,
8
subjects imitated ten different models, two of each model length, that they had not
seen before. These novel models made it possible to measure general
improvement in performance that might result from practice. In addition, in order
to gauge model-specific improvement, some models were repeated. Within the
first two blocks (total 60 trials), ten models (two of each length) were repeated
three times, and ten other models were repeated twice. These repetitions occurred
both within a block and between blocks.
The order of models within a block was random, with the constraint that no
one model could appear on successive trials. The randomization meant that, on
average, many trials separated successive appearances of any model. For
stimulus models that were presented three times over the course of the
experiment, on average 11.8 trials (SD = 6.5) intervened between their first and
second appearances, and on average 24.4 trials (SD = 10.8) separated their second
and third appearances. These separations corresponded to intervals of about 2
and 5 minutes, respectively, not including rest times. For models that were
presented twice, an average of 29.9 trials (SD = 12.3) separated successive
appearances. This separation corresponded to an interval of about 6 minutes,
again, not including rest times.
For each subject stimulus models were sampled without replacement from
a library of 565 models. The identity of repeated models differed from subject to
subject. To equate model difficulty across conditions of reproduction, we yoked
pairs of subjects between the two groups: Each subject in the Delayed group
reproduced the same models and in the same order as a yoke mate in the
Concurrent group.
2.2 Results
9
2.2.1 Assessing Quality of Reproduction
Each reproduction was scored for similarity to the corresponding stimulus model.
To generate this similarity score, we used a visual pattern matching technique
(Burr 1981; Bajscy, Lieberson and Reivich, 1983; Burr 1983). A Matlab program
morphed the stimulus model to produce an approximate fit to the subject’s
reproduction. Any small wobbles in the reproductions were smoothed out with a
Gaussian filter during pre-processing. In addition, pre-processing equalized the
total lengths of the stimulus model and the corresponding reproduction.
The ultimate shape of each deforming model was governed by the positions
of n control points, which corresponded to the model’s start, end, and turning
points. A simplex search governed the movement of control points away from
their initial locations, minimizing the summed distances between the transformed
model and the reproduction. The fitting routine was free to rotate and change
scale, so long as it preserved the segments’ linearity and number. Normalization
for orientation and size rendered the fit invariant under rigid, in-plane rotations of
a reproduction relative to its model; the fit was also blind to overall size
differences between the stimulus model and the corresponding reproduction.
From the best-fitting deformed stimulus model, we computed several
measures that might characterize the quality of the match. These measures
included the mean distance in pixels between a model and its reproduction, the
mean difference between segment lengths in a model and in its reproduction, and
differences among segment orientations in a model and its reproduction. We
evaluated these candidate measures, gauging how each was affected by various
types of reproduction errors. Based on its relative insensitivity to adventitious
“kinks,” and its relatively uniform sensitivity to various types of reproduction

10
errors, our measure of choice was the mean absolute difference between the
orientations of segments in the model and segments in the resulting reproduction.
2.2.2 Quality of Reproduction Varies with Model Length
Figure 2 shows the mean quality of reproduction as a function of number of
segments in a model. Results are shown separately for Concurrent and Delayed
conditions. Overall, the two produced comparable levels of performance [F(1, 26)
= 1.00, p>.33]. Of course, the confound described in Section 2.1.3 must be taken
into account when interpreting this result.
In general, reproduction quality worsened as model length increased from
3 to 7 segments [F(4, 104) = 16.291, p <.01]. The significant slope difference
between curves in Figure 2 shows that segment length affected reproduction
quality more powerfully in the Delayed condition than in the Concurrent
condition (interaction between Group and Number of Segments, F(4, 104) =2.73,
p<.05). Pairwise comparisons using Tukey’s HSD test showed that Concurrent
and Delayed reproduction differed significantly only for the two longest models, 6
and 7 segments (p<.05).
2.2.3 Performance with Repeated Models: Improvement with Practice
To measure model-specific learning, we examined performance with models that
subjects had encountered three times during the experiment. As indicated before,
these repeated models differed from subject to subject.
Overall performance was not significantly different for the two modes of
reproduction [F(1,26) = 0.354, p>.50]. Confirming what was found for data from
all trials, performance with the sub-sample of repeated trials varied with model
length [F(4, 104) = 6.727, p<.01]. The overall effect of model length did not differ
between groups [F(4, 104) = 0.648, p>.50]. With repeated presentation of the

11
models, performance improved, F(2,52) = 6.405, p<.005. Models of varying
numbers of segment lengths showed this improvement in roughly equal measure
[interaction between repetition and segment number, F(8, 208) = .486, p>.50]. As
Figure 3 shows, the effect of repetition significantly differed between the two
modes of reproduction [interaction between Group and Repetition, F(2,52) = 4.757,
p<.02].
Pairwise comparisons showed that improvement with repetition was
reliable only when reproduction was delayed, and then only between a model’s
first and third occurrences (Tukey’s HSD test, p<.05); changes from first to second
or second to third occurrence were not reliably different. Results with models
presented only twice during the experiment confirmed that significant
improvement was not produced by just two occurrences, F(1,13) = 0.60, p>.50.
Returning to models that were shown three times, repetition produced
essentially no change in quality of Concurrent reproduction. Moreover, on a
model’s very first appearance, performance was slightly, but not significantly
better with Concurrent reproduction compared to Delayed reproduction (p<.10).
With subsequent occurrences of the models, Delayed performance improved. By a
model’s third appearance, Delayed performance with that model exceeded
Concurrent performance (p<.05). Learning —defined by improvement in
performance with practice— took place only in the Delayed condition.
2.2.4 Absence of general, stimulus-nonspecific improvement with practice
To determine whether the quality of subjects’ reproductions improved generally
over the course of the experiment, we focused on Delayed reproduction, the
condition that showed evidence of stimulus-selective improvement. From each
block of trials, we analyzed performance with all models that were shown just

12
once. We found no significant differences in quality over the three blocks of trials
[F(2,26) = 0.89, p>.40]. This null result suggests that learning seen with repeated
models did not reflect a general improvement, as might come from increased
familiarity with the task, or from familiarity with models’ general characteristics.
Instead, improvement with repetition was related to models whose repetition
afforded an opportunity for learning.
2.2.5 Characteristics of common errors
Our measure of reproduction quality represents the overall, global fidelity
of subjects’ reproduction performance, but does not capture details of subjects’
errors. As an initial step toward closing this gap, we catalogued what seemed to
be the most common errors. For this catalogue, we visually inspected a sample of
40 trials (20 different models, first and third repetition of each) from the Delayed
condition only. Figure 4 shows samples of the most common errors in our sample.
In the most common error, a single, more-or-less straight line was
substituted for two successive segments that differed by 150 deg. In our sample,
this error occurred 60% of the time when segments differed by 150 deg. A similar
error occurred about one-third of the time when successive segments differed by
120 degrees. In 45% of the cases sampled, when this error was made on a model’s
first appearance, the same error was also made on the final, third appearance of
that model. Another interesting, but less common error was the omission of a
small, 30 deg change between successive segments. In one sense, a model segment
that changes direction by 30 deg is equivalent to a model segment that changes by
150 deg: both are equally different from a straight line. This equivalence may
explain why both types of change in direction produced similar errors in
reproduction, but it can not explain why the two types produced the error with
13
such different frequency. Moreover, from a perceptual point of view, either type
of error is unexpected because a single 30 or 150 deg change in direction would
have been highly visible in a standard psychophysical setting (Ball and Sekuler,
1982; Sekuler, Sekuler and Sekuler, 1990; Blake, Cepeda and Hiris, 1997).
Another error type seemed to involve the apparent transposition of a
segment that had been omitted earlier in the reproduction to a position at
reproduction’s end. This transposition caused the number of segments in the
reproduction to match the number of segments in the model, but distorted the
reproduction’s overall shape. Most reproductions offer no unambiguous sign that
an error was actually a transposition instead of merely the insertion of a
misdirected segment. As a result, unless special constraints are introduced into
the models, effectively “tagging” certain distinctly different segments, the actual
frequency of transposition errors is impossible to determine.
2.3 Discussion
2.3.1 Initiation of Concurrent Reproduction
Additional insight into subjects’ performance was wrung from an analysis of the
timing of subjects’ attempts to reproduce what they had observed. We began by
determining the starting latency for each reproduction, and also the time at which
the reproduction ended. On average, Delayed reproduction began 461 msec after
the warning tone. For Concurrent reproduction, subjects began on average 381
msec after the disk had started to move, which means that Concurrent
reproduction tended to get under way about when the disk had traversed one, 250
msec stimulus-segment, and was about to complete the 150 msec pause that
separated segments. Assuming that the moving disk must be observed for 200-
300 msec in order to encode its direction with good precision (Sekuler et al. 1990;

14
Sekuler and Sekuler 1993; Land and MacLeod 2000), the observed starting latency
means subjects were operating nearly in real time. That is, they started to move
the stylus virtually as soon as sufficient visual stimulus information was available
to specify direction. This way, subjects could be minimizing the information that
had to be kept in working memory.
Individual subjects’ mean starting latencies ranged from 252 msec, for the
subject who was quickest off the mark, up to 719 msec, for the subject who was
slowest. We wondered whether subjects might have gained some performance
advantage by adjusting the delay between their own action and the start of the
model they were imitating. To test this, we computed the correlation between
subjects’ mean start latency and their average quality of performance. This
correlation did not differ significantly from zero, r = -0.18 (df=13, p>.20).
2.3.2 Selectivity of Learning with Repeated Models
Despite the many regularities built into our models (see Table 1), we saw no
evidence of general improvement in performance over trials. Improvement in
reproduction was confined to the stimulus models that subjects encountered
multiple times. Although general regularities and specific motor sequences seem
to be learned by different neural subsystems (Marsolek and Field 1999), the
apparent absence of general, model-independent improvement was surprising.
There are several possible explanations for this null result. First, general learning
might occur in our paradigm, but could require additional trials to become
manifest; alternatively, general improvement might have been very rapid,
reaching asymptote within the first block of trials or even during the few practice
trials. The design of our experiment forecloses a choice between these
alternatives.

15
Practice-related improvement in performance was seen only in the Delayed
condition, and then only with models that were repeated. This outcome suggests
that subjects can encode and store least some fraction of the distinctive sequence of
movements comprising each model. The ability to encode and store complex
dynamic features is consistent with results by Chun and Jiang (1999). When
subjects searched for a target in the midst of a field of moving elements, the
repetition of particular motion vectors allowed subjects to learn and exploit those
dynamic regularities. As a result, even though subjects did not explicitly
recognize that motion vectors had been repeated, search was sped up
substantially.
In our experiment, learning was not only stimulus-dependent, but was also
restricted to Delayed reproduction. This characteristic of selective learning is
consistent with Weeks, Hall and Anderson’s (1996) finding that delaying
reproduction of particular hand and finger postures produced better long-term
recall and recognition of particular, repeated postures, compared to performance
with postures not previously seen.
2.3.3 Performance versus Learning in Concurrent Reproduction
Concurrent reproduction tended to be slightly better than Delayed reproduction
(.05 < p < .10), particularly early in the experiment, when Delayed performance
had not yet begun to benefit from repetition of models. Several factors could
account for this difference between Delayed and Concurrent conditions. First, we
must note that on average, Concurrent reproduction began shortly after the
stimulus disk began to move, and ended shortly after the disk finished traversing
the model path. This temporal overlap between reproduction and stimulus means
that in Concurrent reproduction, subjects rarely had to retain more than one single
16
segment’s direction in working memory. In fact, so long as subjects did not fall
too far behind the model, the Concurrent condition created no incentive to encode
a complete model, or even more than just one segment at a time. It may be that in
order for a stimulus to be transferred into a longer-term, associative memory for
later recall, successive components have to be aggregated cognitively into a whole,
which probably did not happen in Concurrent reproduction.
There is an alternative explanation of differences between Concurrent and
Delayed reproduction. These differences could have arisen from the omission,
from the Concurrent condition, of a visible disk yoked to the stylus’ movements.
This omission deprived subjects of immediate visual feedback, which, had it been
available, could have facilitated learning. On this view, the evidence of learning in
Delayed reproduction, and the absence of such evidence in Concurrent
reproduction might reflect the differential availability of immediate visual
feedback. Although we did not take this step, in the future, the confound might
be resolved by omitting a yoked disk from the Delayed condition. Comparisons of
performance with and without the tracking disk might reveal how important or
unimportant immediate visual feedback actually is in Delayed reproduction.
3 Experiment 2: Short-term memory for model trajectories
We wondered about the sources of imprecision of reproduction in Experiment 1.
Reproduced trajectories did not perfectly match the models to which they
corresponded, and this mismatch grew with the number of segments in a model.
Because longer models took several seconds longer to display than shorter ones
did, it is possible that these length-dependent mismatches resulted from failures in
subjects’ short-term memory. In apparent contradiction to this speculation, Blake,

17
Cepeda and Hiris (1997) found that memory for a single direction of motion is
robust up to 30 seconds or more. But, models in Experiment 1 comprised a series
of successive directions rather than just a single direction. As a result, the robust
short-term memory reported by Blake and colleagues cannot be confidently
extrapolated with to memory for our multi-directional models.
To examine the temporal robustness of memory for a stimulus trajectory we
introduced varying delays between the end of the model and the start of
reproduction. Although all subjects were instructed to rehearse, during the delay,
the model that they had just seen, with one group of subjects we examined the
effect of undermining the ability to rehearse. Those subjects were required to
perform mental arithmetic during the delay, counting aloud backwards by seven
from a randomly assigned, two-digit number. This task was meant to undermine
rehearsal.
3.1 Methods
Reproduction was assessed with models comprising 3, 5 and 7 segments. Various
times after the disk finished tracing out its trajectory, a tone signaled the subject
initiate reproduction. This signal was delayed randomly from trial to trial, for 0.5,
2.5, 6, or 16 seconds following the model’s termination. The four delay values
occurred with equal frequency.
Eleven paid, college-age volunteers were tested; none had taken part in the
preceding experiment.4 Blocks of 24 trials each alternated between the two
conditions of interpolated activity, mental arithmetic or reproduction rehearsal. In
each block, various model lengths and pre-reproduction delays occurred
randomly, but equally often. The two conditions alternated either in ABBA (6
subjects) or BAAB (5 subjects).

18
3.2 Results
Figure 5 shows Experiment 2’s main results. As in the preceding experiment,
performance depended strongly on the number of segments in a model [F(2,20) =
49.80, p<.001]. In addition, reproduction quality was significantly worse when
subjects did mental arithmetic during the pre-reproduction delay than when they
rehearsed what they had seen [F(1,10) = 19.835, p<.002]. For all model lengths,
reproduction quality declined with increasing delay between the model and
ensuing reproduction [F(3,30) = 5.83, p<.001]. A post-hoc test showed only one
statistically reliable difference between delays, the difference between
reproduction after a two-second delay and reproduction after an 16-second delay
(Tukey HSD, p<.05). No interaction in the analysis was statistically significant (all
p>.20).
3.3 Discussion
Extending the pre-reproduction delay from 0.5 seconds to 2.5, or even 6 seconds,
had negligible effect on quality of reproduction. Although the results in Figure 5
do not foreclose the possibility that quality might fall more appreciably with still
longer delays, the non-significant change with delays up to 6 seconds suggests
that fading of information from memory was probably not an important cause in
Experiment 1 of performance’s decline with model length.
Reproduction was significantly affected by what subjects did in the
immediately preceding interval, but the effect was small. It seems that the
representation used in reproducing simple, no-longer visible models persists for at
least several seconds with only slight dependence on rehearsal. This hypothesis is
strengthened by the absence of a significant interaction between delay length and
number of components in a model (p>.50). If active rehearsal were crucial for
19
maintaining the representation in memory, reproduction should improve more
with shorter trajectories, which afforded additional rehearsal opportunity, than
with long. That was not the case.
4 Experiment 3: Information needed for visual encoding
When human observers’ performance is compared to that of a statistically-ideal
performer, humans rarely reach efficiencies greater than 50%. This reduced
efficiency often arises from the fact that humans extract and use only a fraction of
all the information available in the test stimuli. However, under-sampling can be
beneficial if it can be done strategically, as when some subset of stimulus elements
is particularly diagnostic (for example, Gold, Bennett, Sekuler 1999). For example,
Matáric and Pomplun (1998) found that subjects encoded the movements of
human arms largely by tracking the hand or a finger. Because of biomechanical
constraints, the movements of the hand were sufficient to define the
accompanying movements of the whole arm. Similarly, Parish, Sperling and
Landy (1990) showed that experienced users of American Sign Language sub-
sampled signs adaptively, extracting visual information mainly at spatio-temporal
boundaries that separate the major components of a sign. Although we have not
attempted to define an ideal performer for our task, it is appropriate to ask what
visual information subjects actually use when they view our stimulus models in
preparation for reproducing them.
With the results of Matáric et al. (1998) and of Parish et al. (1990) in mind,
we conjectured that subjects might be able to exploit the many spatio-temporal
constraints built into our stimulus models (see Table 1). When the stimulus disc
traced out models in the preceding experiments, it moved along each segment at a
20
steady rate and in a constant direction. This predictability made most of a model’s
trajectory redundant. As a result, subjects would be able to encode the stimulus
fully from a few, appropriately chosen sub-samples. To test this hypothesis, we
measured quality of reproduction with varying amounts of the model hidden
from view.
4.1 Methods
Stimulus models were presented in three different conditions of visibility. In all
three conditions, models matched the timing and equivalent velocities used in the
preceding experiments. In one condition, which we call “Points Only,” subjects
saw only the start, end, and turning points of each trajectory. Here, the stimulus
disk was flashed first at the trajectory’s starting point, was flashed again at each
location where trajectory direction changed, and then was flashed one last time at
the trajectory’s ending point. Each flash was 150 msec, and successive flashes
were separated by 250 msec. The spatial separation between successive
appearances of the disc was 2.25 degrees. The combination of this spatial
separation and the temporal interval between flashes meant that subjects would
not experience apparent motion between successively presented discs. A second
condition, designated “100%,” resembled the conditions of Experiments 1 and 2.
The disc moved steadily along an entire trajectory and was visible throughout.
Each segment lasted 250 msec, and, as in preceding experiments, the disc paused
for 150 msec at each turning point. To enhance comparability with the Points Only
condition, the stationary disc was presented for 150 msec at the beginning and end
of the entire trajectory. In the last condition, “20%,” the disc was visible only for
the first 20% of each segment; for the remainder of each segment, the computer
blanked the display of the disc.
21
After a model ended, a beep sounded and the computer display went blank
for one second. Then the disc reappeared in the center of the display, and the
subject used the stylus and graphics tablet in an effort to reproduce the stimulus.
The disc’s movements on the computer display were yoked to movements of the
stylus. No instructions were given about rehearsal.
Twelve paid, college-age volunteers were tested; none had participated in
the preceding experiments. Over six sessions, each subject was tested with a total
of 72 stimulus models, eight with each of the nine combinations of three trajectory
lengths (3, 5 and 7 segments) and three viewing conditions (Points Only, 20% and
100%). Within any block of trials, the viewing condition was constant; the order
with which the three viewing conditions were presented was randomized anew
for each subject. In order to orient subjects, each session was preceded by two
practice trials with the viewing condition for that session.
4.2 Results and Discussion
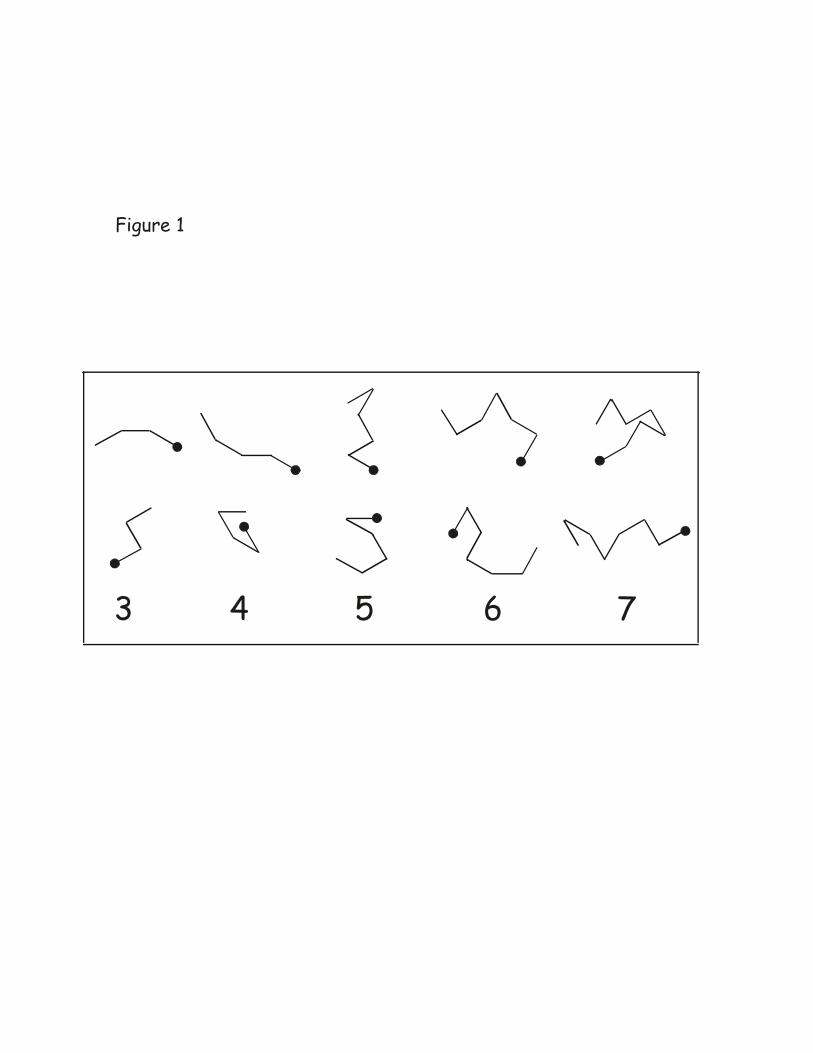
Figure 6 presents the mean reproduction accuracy for the three viewing
conditions, as a function of trajectory length. Different curves are shown for the
three viewing conditions, which seem not to have affected accuracy of
reproduction. This was confirmed by a two-factor, repeated-measures ANOVA,
which showed that the only significant effect was the number of segments, [F
(2,22) = 25.65 , p<.01]. Neither the overall effect of viewing condition, nor the
interaction between viewing condition and trajectory length significantly
influenced performance, [F (2,22) = 1.39, and F (4, 44) = 1.087, both p>.25]. The
gray line in Figure 6 represents the mean reproduction accuracies found earlier, in
Experiment 1. There is satisfactory agreement between those results and the
results of the current experiment.

22
The results demonstrate clearly that minimal information –derived from
seeing only the start, end and turning points of a model-- allows subjects to
encode the trajectory as well as they do when they view the complete trajectory.
Of course, this does not prove that when the complete trajectory is visible,
subjects’ reproductions are based only the start, end, and turning points. But it
does demonstrate that those diagnostic points are sufficient for adequate
reproduction.
5 General Discussion
The experiments reported here introduced a novel approach to studying
reproduction of observed actions. By using abstract two-dimensional stimulus
models, we tried to identify major influences on quality of performance. When
the start of reproduction was delayed until the model had disappeared, repeated
encounters with the same models produced improved accuracy of reproduction.
Improvement occurred even though repetitions were interspersed among many
other, non-repeated models, and even though successive repetitions were
separated by several minutes. Additionally, learning seemed to be implicit:
Subjects debriefed after Experiment 1 were not entirely aware that models had
been repeated.
The design of Experiment 1 made it impossible to gauge the specificity of
the model-dependent learning. In particular we cannot tell whether model-
dependent learning might manifest itself with a test-model that was similar to, but
not identical with, the model on which a subject had practiced. Hence, for now it
seems more appropriate to describe the learning as “stimulus dependent”, using a

23
neutral term, rather than with labels such “stimulus specific” or “stimulus
selective.”
Experiment 2 showed that once seen, a model is retained in memory for at
least six seconds with only negligible loss of information. Moreover, although
rehearsing the model helps to preserve the memory, rehearsal has a relatively
small influence. Experiment 3 showed that subjects needed only minimal visual
information to encode the trajectory. In fact, subjects appear to be quite good at
“connecting the dots,” as demonstrated by the success of reproduction in the
Points Only condition, where they had just a series of brief, widely separated
samples to work from.
One theoretically-important aspect of stimulus selectivity remains to be
addressed. Milner and Goodale (1995) have characterized the ventral and dorsal
visual streams as “vision-for-perception” and “vision-for-action.” Although
distinctions between these forms of vision comprise a useful, heuristic, we must
not overlook possible connections between the two. In particular, it would
valuable to know if reproduction (a form of vision for action) and discrimination
(a form of vision for perception) depended on the same, common perceptual
representation.
As noted earlier, changes between successive segments of our models were
exaggerated in both space and time. Spatial exaggeration was implemented by
requiring changes of direction to be 30 degrees or more; temporal exaggeration
was implemented by forcing the disk to pause briefly immediately before
changing direction. The pause was sufficiently brief to be imperceptible, but was
sufficiently long to reduce illusory smoothing of sharp changes in direction
(Brown and Voth 1937).
24
The analysis of subjects’ errors suggested that the pause was not entirely
successful in guaranteeing perceptibility of direction change. For example, on
some trials, when the change was 30 or 150 degrees, subjects’ reproductions
omitted the change (a single straight line was substituted for the two differently-
oriented line segments). These errors occurred despite that fact that such changes
in direction exceeded discrimination threshold for direction of movement by at
least tenfold (Ball and Sekuler 1982; Blake, Cepeda and Hiris 1997). It may be
relevant that direction discrimination thresholds were measured for just a single,
isolated change in direction, rather than for one change in a series of changes, as in
our reproduction paradigm. The errors we observed could have sprung from
visual interactions among successively seen segments, or from interactions among
stored and retrieved memories of the segments (Blake et al. 1997). Additional
experiments will be needed required to apportion the error among these and other
possibilities.
Among the issues our study did not address are some important practical
ones. For example, suppose that one’s goal were to teach a person to imitate some
complex action. Is it the case that the optimum model is one that most closely
approximates the action that one wants to promote? The models in our study
were distorted temporally, by the introduction of a brief pause after each segment.
Temporal exaggeration of a complex act can make it easier to recognize some
aspect of that act. For example, appropriate exaggeration of a tennis serve helps
viewers identify which one of several individuals made the serve (Hill and Pollick
1999). It remains to be seen whether spatio-temporal distortions would affect
reproduction, either by making it easier to encode and store the model, or by
facilitating motor output based on the stored model.
25
Unlike most models that might be reproduced or imitated in everyday life,
our models played out at a constant speed and comprised only equal-length linear
segments, which could be parsed into segments with relative ease. And a
reproduction required a limited class of movements. In order to guide the stylus
across the graphics tablet, subjects needed only translatory movements, and only
movements of one hand and arm. The random models used here resisted easy
verbal description, which made it possible to study reproduction with minimal
complications from mediating verbal labels. However, in many circumstances,
reproduction of a seen action is accompanied and aided by verbal description of
the to-be-performed act (Maxwell, Masters and Eves 2000). Therefore, a complete
account of performance will require a description of the influence exerted by
symbolic or verbal representations of the seen action.
Despite their obvious simplicity, the stimulus models and task described
here may be an analytically-useful stepping stone toward more complex models,
including multi-component, three-dimensional models. In support of this idea,
Poizner, Bellugi and Lutes-Driscoll (1981) showed that the movements of a human
model’s fingertips alone (in point-light displays) conveyed sufficient information
for accurate identification of American Sign Language gestures. Additionally,
Matáric and Pomplun (1998) showed that when subjects watched finger, hand,
and arm movements that would later be reproduced, subjects tended to track just
a single end-point, such as a fingertip or a hand. Information acquired from this
single end-point made possible good delayed performance, though the visual
information was probably supplemented by an internal model of the moving limb
or appendage (Imamizu et al. 2000).

26
In Experiment 3, our subjects performed quite well with only minimal
visual information to rely on. Of course, that minimal information defined the
spatio-temporal boundaries between components of our simple, highly-
constrained models. Representing everyday actions in terms of only a few key
visual samples would likely be more difficult, particularly if those actions lacked
distinct, meaningful spatio-temporal boundaries. However, human observers
have proven to be highly skilled at extracting perceptually-salient temporal
boundaries from ordinary, everyday events (Zacks et al. 2001).

27
References
Adams J A, 1987 “Historical review and appraisal of research on the learning,
retention, and transfer of human motor skills.” Psychological Bulletin 101 41-
74.
Bajscy R, Lieberson R, Reivich M, 1983 "A computerized system for the elastic
matching of deformed radiographic images to idealized images." Journal of
Computer Assisted Tomography 7 618-625
Ball K, Sekuler R, 1982 "A specific and enduring improvement of direction
discrimination" Science 218 697-698
Blake R, Cepeda N J, Hiris E, 1997 "Memory for visual motion" Journal of
Experimental Psychology: Human Perception & Performance 23 353-69
Brown J F, Voth A C, 1937 "The path of seen movement as a function of the vector-
field" American Journal of Psychology 49 543-563.
Burr D J, 1981 "Elastic matching of line drawings" IEEE Transactions on Pattern
Analysis and Machine Intelligence 3 708-713
Burr D J, 1983 "Matching elastic templates", in Physical and biological processing of
images Eds O J Braddick and A C Sleigh (Berlin: Berlin) pp 260-270
Carmichael L, Hogan H P, Walter A A, 1932 "An experimental study of the effect
of language on the reproduction of visually perceived form" Journal of
Experimental Psychology 15 73-86
Chun M M, Jiang Y, 1999 "Top-down attentional guidance based on implicit
learning of visual covariation" Psychological Science 10 360-365
Day, R H, Dickinson, R G, 1977 “Absence of color-selectivity in Duncker-type
induced visual movement” Perception & Psychophysics 22 313-320

28
Gold J, Bennett P J, Sekuler A B, 1999 “Identification of band-pass filtered letters
and faces by human and ideal observers” Vision Research 39 3537-3560
Goodale M A, 1998 "Visuomotor control: Where does vision end and action
begin?" Current Biology 8 R489-R491
Grezes J, Costes N, Decety J, 1999 "The effects of learning and intention on the
neural network involved in the perception of meaningless actions" Brain 122
1875-1887
Hill H C, Pollick F E, 1999 "Temporal exaggeration of human movements"
Investigative Ophthalmology & Visual Science 40 S413
Imamizu H, Miyauchi S, Tamada T, Sasaki Y, Takino R, Pütz B, Yoshioka T,
Kawato M, 2000 "Human cerebellar activity reflecting an acquired internal
model of a new tool" Nature 403 192-195
Jancke D, 2000 "Orientation formed by a spot's trajectory: A two-dimensional
population approach in primary visual cortex" Journal of Neuroscience 15
RC86:1-6
Karni A, Bertini G, 1997 "Learning perceptual skills: Behavioral probes into adult
cortical plasticity" Current Opinion in Neurobiology 7 530-535
Land M F, MacLeod P, 2000 "From eye movements to action: How batsmen hit the
ball" Nature Neuroscience 3 1340-1345
Marsolek C J, Field J E, 1999 "Perceptual-motor sequence learning of general
regularities and specific sequences" Journal of experimental Psychology: Human
Perception & Performance 25 815-836
Matáric M J, Pomplun M, 1998 "Fixation behavior in observation and imitation of
human movement" Cognitive Brain Research 7 191-202

29
Maxwell J P, Masters R S, Eves F, 2000 "From novice to know-how: A longitudinal
study of implicit motor learning" Journal of Sports Science 18 111-120
Milner A D, Goodale M A, 1995 The visual brain in action (Oxford: Oxford
University Press)
Parish D H, Sperling G, Landy M S, 1990 “Intelligent temporal subsampling of
American Sign Language using event boundaries” Journal of experimental
Psychology: Human Perception & Performance 16 282-294
Poizner H, Bellugi U, Lutes-Driscoll V, 1981 "Perception of American sign
language in dynamic point-light displays" Journal of Experimental Psychology:
Human Perception & Performance 7 430-440
Schaal S, 1999 "Is imitation learning the route to humanoid robots?" Trends in
Cognitive Science 3 233-242
Sekuler A B, Sekuler R, 1993 "Representational development of direction in motion
perception: a fragile process" Perception 22 899-915
Sekuler R, Sekuler A B, Sekuler E B, 1990 "How the visual system detects changes
in the direction of moving targets" Perception 19 181-196
Viviani P, Stucchi N, 1989 "The effect of movement velocity on form perception:
Geometric illusions in dynamic displays" Perception & Psychophysics 46 266-
274
Viviani P, Stucchi N, 1992 "Biological movements look uniform: Evidence of
motor-perceptual interactions" Journal of Experimental Psychology: Human
Perception & Performance 18 603-623
Weeks D L, Hall A K, Anderson L P, 1996 "A comparison of imitation strategies in
observational learning of action patterns" Journal of Motor Behavior 28 348-358

30
Zacks J M, Braver T S, Sheridan M A, Donaldson D I, Snyder A Z, Ollinger J M, Buckner
R L, Raichle M E, 2001 “Human brain activity time-locked to perceptual event
boundaries” Nature Neuroscience 4 651-655

31
TABLE 1. ATTRIBUTES OF STIMULUS MODELS
Stimulus Attribute Rationale / Benefit
Constant starting position Reduce positional uncertainty
Moves at constant speed Reduce speed uncertainty
Moves at 10 deg/sec Supports good perception of visual motion
Linear segments of constantlength
Reduce effects of positional uncertainty; aidefficient encoding of each segment; allowencoding as a sequence of segment direction; andminimize difficulty in execution
Thirty degree minimumdifference between successive
segments
Enhance perception of change in direction
A segment cannot retracepath of preceding segment
Facilitate analysis of subjects’ imitations
Model cannot be a closedfigure
Increase resistance to verbal encoding
Segments may not cross Facilitate use of deformable model in data analysis

32
Acknowledgements.
We thank Maja Matáric, Patrick J. Bennett, Allison B. Sekuler for encouragement
and advice at various stages of this work. We also thank Brendan Kitts for
developing the software used to quantify fidelity of reproduction. A. Siddiqui
collected Experiment 1’s data during her Masters degree research in Neuroscience;
data for Experiment 2 and 3 were collected by N. Goyal and R. Rajan as part of
their Neuroscience Senior Honors research.

33
Figure Captions
Figure 1: Some sample stimulus models that were used in the experiment. Each
small black disk represents the starting position of the model trajectory. The
numbers in each column signify the number of segments in the models.
Figure 2: Mean reproduction quality for Delayed and Concurrent reproductions.
Figure 3: Mean quality of Concurrent and Delayed reproduction as a function of
repetition. Data are shown only for models that were presented three times.
Figure 4: Sample common reproduction errors. A. Straightening of a 150 deg
change between segments (the model’s third change of direction). B. The model’s
second directional change (150 deg) was replaced with a straight line in both the
first and the third reproductions. A segment is added at the end of the first
imitation. C. The reproduction failed to capture the last change in the model’s
direction (30 deg). Note the improvement from the first reproduction to the third.
Figure 5. Mean reproduction quality as a function of model length, pre-
reproduction delay, and the activity that filled the pre-reproduction delay.

34
Figure 6. Mean reproduction quality as a function of model length. The parameter
of the family of curves is the amount of each trajectory that was actually visible to
subjects. The thick gray line represents results from Experiment 1’s Delayed
condition; the line’s thickness corresponds to plus and minus one standard error
of the mean from that experiment.

35
Footnotes
1 In the American manual alphabet, the positions of the signer’s arms, wrist and
fingers are combined to produce 26 different gestures, which correspond to the
letters of the English alphabet. In the experiment by Weeks et al., hand shapes
were presented on videotape for three seconds each. Because these models were
static poses of fingers and hand, temporal information was irrelevant; the
information essential for performance was purely spatial.
2 In retinal coordinates, the tilt of the graphics tablet relative to the display
monitor produced a symmetric, trapezoidal perspective difference (“keystoning”)
between the visual display and the motor output surface. Although we did no
systematic analysis, visual inspection of some sample reproductions showed no
effect of this perspective difference.
3 Measures that could have reduced confusion, such as rendering the two disks in
different colors, would have introduced additional problems. In Concurrent
reproduction, movements of a tracking disk, even one whose color differed from
the model disk’s, would have induced illusory motion of the stimulus disk (Day &
Dickinson, 1977), thereby distorting the perceived trajectory that the subject was
supposed to reproduce. In addition, this perceptual distortion would vary
unpredictably over time, depending on the distance separating the disks, as well
on the velocity of one disk relative to another.

36
4 In Experiment 1, 14 subjects were tested in each group. In Experiment 2, 11
subjects were tested in a within-subject design. We felt that this slightly smaller
number of subjects (11 vs. 14) was sufficient.
3 4 5 6 7
Figure 1

0.2
0.3
0.4
0.5
0.6
3 4 5 6 7Number of Segments in Model
Concurrentreproduction
Delayedreproduction
Figure 2.

0.2
0.3
0.4
0.5
0.6
1 2 3Stimulus Occurrence
DelayedReproduction
ConcurrentReproduction
Figure 3

StimulusModel
FirstImitation
ThirdImitation
Model A Model B Model C
Figure 4.

0.6
0.4
0.2
0.5
0.3
Figure 5
0.2
0.3
0.4
0.5
0.6
3 5 7
Points20%100%
Number of Segments in Model4 6
Figure 6


![untitled 2 [people.brandeis.edu]people.brandeis.edu/~sekuler/papers/SekulerNature1997.pdf · Presentation ofsound Figure I Percentage of reports of stimulus bouncing. In each trial,](https://img.pdfslide.us/doc/110x75/5f4e7aa9b6f9633f2c3bd2e4/untitled-2-sekulerpaperssekulernature1997pdf-presentation-ofsound-figure.jpg)