Embed Size (px)
Citation preview
�1�
Learning to perceive a smaller L2 vowel inventory:an Optimality Theory account
Paul Boersma & Paola Escudero, University of Amsterdam
June 30, 2007
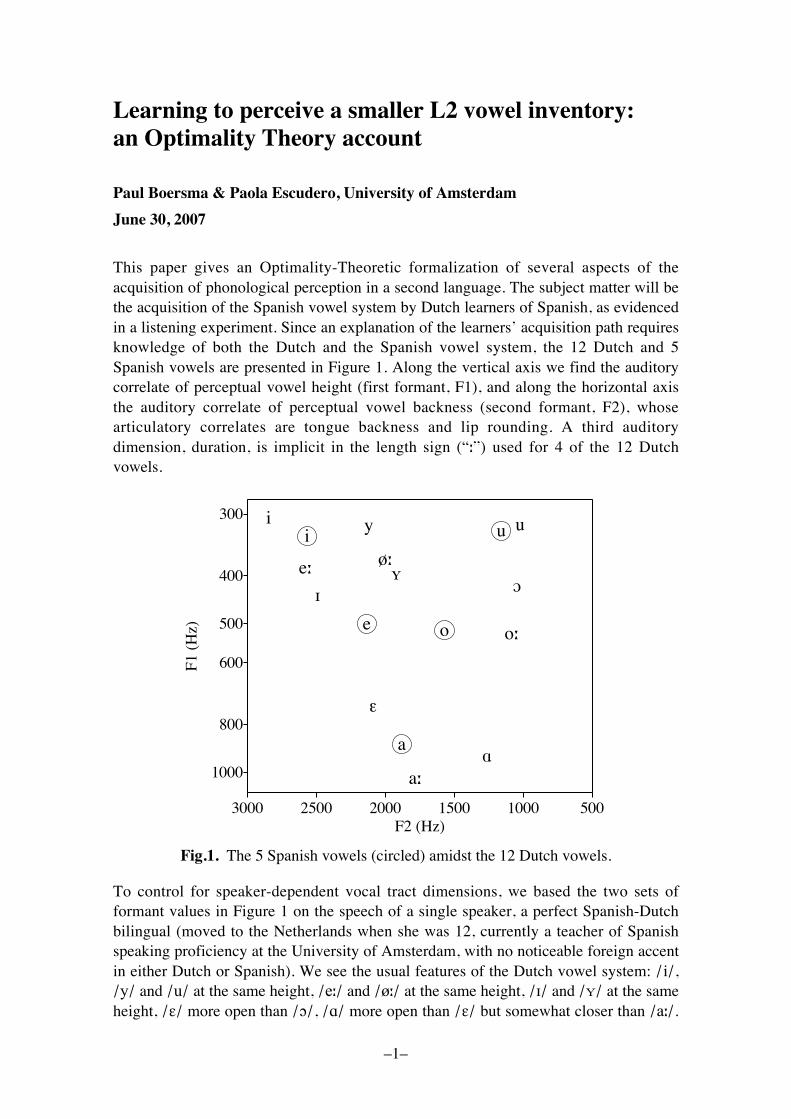
This paper gives an Optimality-Theoretic formalization of several aspects of theacquisition of phonological perception in a second language. The subject matter will bethe acquisition of the Spanish vowel system by Dutch learners of Spanish, as evidencedin a listening experiment. Since an explanation of the learners� acquisition path requiresknowledge of both the Dutch and the Spanish vowel system, the 12 Dutch and 5Spanish vowels are presented in Figure 1. Along the vertical axis we find the auditorycorrelate of perceptual vowel height (first formant, F1), and along the horizontal axisthe auditory correlate of perceptual vowel backness (second formant, F2), whosearticulatory correlates are tongue backness and lip rounding. A third auditorydimension, duration, is implicit in the length sign (�!�) used for 4 of the 12 Dutchvowels.
i u
e o
a
a:
A
ε
OI
Ye:ø:
o:
i y u300
400
500
600
800
1000
50010001500200025003000F2 (Hz)
F1 (
Hz)
Fig.1. The 5 Spanish vowels (circled) amidst the 12 Dutch vowels.
To control for speaker-dependent vocal tract dimensions, we based the two sets offormant values in Figure 1 on the speech of a single speaker, a perfect Spanish-Dutchbilingual (moved to the Netherlands when she was 12, currently a teacher of Spanishspeaking proficiency at the University of Amsterdam, with no noticeable foreign accentin either Dutch or Spanish). We see the usual features of the Dutch vowel system: /i/,/y/ and /u/ at the same height, /e!/ and /ø!/ at the same height, /"/ and /#/ at the sameheight, /$/ more open than /%/, /&/ more open than /$/ but somewhat closer than /a!/.
�2�
As for most speakers of Dutch, /a!/ is front and /"/ is back. As for many speakers, /#/and /$/ are a bit lower than /e!/ and /ø!/. The height of /%/ shows that this speaker isfrom one of those large areas that merge the reflexes of both historical /%/ and /&/ intoa single relatively high variant at the height of /#/ and /$/ (if this had been true of allspeakers of Dutch, a better symbol for the phoneme /%/ would have been /&/). A moreidiosyncratic feature of the speaker�s regional accent is the low position in the chart ofthe vowel /o!/, which is due to its large degree of diphthongization (i.e., the three highermid vowels are phonetically realized by this speaker as [ei], [øy], [%u]). As for thisspeaker�s Spanish vowel system, we see that /a/ is rather front, that /e/ and /o/ are notclose to any Dutch vowel, and that the extent of the Spanish vowel space is somewhatsmaller than that of the Dutch vowel space, with a notable centralization of /o/. Thepatterns are compatible with what is known about Dutch (Pols, Tromp, and Plomp1973; Koopmans-Van Beinum 1980), about Spanish (Bradlow 1995, 1996), and aboutthe crosslinguistic correlation between the size of a language�s auditory vowel spaceand the size of its vowel inventory (Liljencrants and Lindblom 1972; Lindblom 1986).
1. Ease and difficulty for Dutch learners of Spanish vowelsFor Dutch learners of Spanish who want to master the Spanish vowel system, there is
something easy as well as something difficult about it. The ease lies in creating lexicalrepresentations for Spanish vowels, while the difficulty lies in perception, i.e. in themapping from raw auditory data to discrete representations that can be used for lexicalaccess.
1.1. Easy: lexical symbols for L2 vowels
When native speakers of Dutch learn to use the vowel system of the Spanishlanguage, they seem to have the advantage that the target language has fewer vowelsthan their native language, so that they have the option of reusing a subset of theirnative vowel categories for the storage of Spanish lexemes. The phonologicalrepresentations of entries in the Spanish lexicon can get by with only five vowelcategories, which we will denote as |a|S, |e|S, |i|S, |o|S, and |u|S (in our notations, subscriptS is used for structures in the minds of native speakers of Spanish, and underlying formsare given within pipes).i Thus, the lexical representation of the word centrifugado�centrifugated� is |'ent(ifu)a*o|S for native speakers of (European) Spanish. Nativespeakers of Dutch have to maintain at least 12 vowel categories in their native lexicalrepresentations: |"|D, |a!|D, |+|D, |#|D, |e!|D, |i|D, |$|D, |ø!|D, |y|D, |%|D, |o!|D, |u|D (subscript D forstructures in the minds of native speakers of Dutch). When learning Spanish, then, theycould simplyii reuse five of these for representing their L2 Spanish lexemes; no categorysplit, no category creation would be necessary. As we will see when discussing theresults of our listening experiment (§1.5), this is what the learners indeed seem to do.The following simplified list shows which Dutch vowels are reused for which Spanishvowels in the interlanguage:
�3�
(1) Identification of lexical symbols for Dutch learners of Spanish
|!|D � |a|S|"|D � |e|S|i|D � |i|S|#|D � |o|S|u|D � |u|S
Note that this identification does not describe the knowledge of the learners; rather, it isan observation that we as linguists can infer from experimental tasks (as we do in §1.5).The identification in (1) means, for instance, that the Dutch learner�s underlyingrepresentation of Spanish centrifugado is |$"nt%ifu&!d#|D. Also note that our use ofvowel symbols is not meant to suggest crosslinguistic identity: |u|D is not a priori moresimilar to |u|S than |!|D is to |a|S.
iii
1.2. Difficult: perceptual boundaries of L2 vowels
While the reuse of existing categories is advantageous in itself, there is an additionalgain in the identifications in (1), which are far from arbitrary. This section first showsthat these identifications are largely based on language-specific perceived (auditory andstructural) similarity, and then shows why such an identification strategy isadvantageous.
Typical tokens of an intended native Spanish |a|S tend to sound like a short somewhatfront open vowel, which in a narrow auditory-phonetic transcription is [a] or [a ']. Thespectral quality (F1 and F2) of these tokens is close to that of typical tokens of Dutch|a(|D, which are phonetically realized like the long cardinal IPA open front vowel [a(];the duration of the Spanish tokens, however, is close to that of typical tokens of Dutch|!|D, which typically sound like the slightly rounded low back vowel [!)]. Since Dutchlisteners, when having to categorize sounds in the [a]-[!)]-[!)(]-[a(] region, weigh theduration cue much higher than the spectral cues (Gerrits 2001: 89), they will classify theSpanish [a]-like tokens as /!/D rather than as /a(/D.iv Another option is to perceive thesetokens as /"/D, whose typical realizations in Dutch sound like the cardinal IPA openmid front vowel ["]. In the listening experiment partly discussed below we found thatnon-Spanish-learning speakers of Dutch perceived Spanish |a|S as /!/D 60 percent of thetime, as /"/D 27 percent of the time, and as /a(/D 4 percent of the time. So it seems thatlanguage-specifically perceived similarity, with duration as the main determining cue,largely explains the identifications in (1).v
So why would learners choose to base their identifications on perceived similarity,i.e. what advantage does it give them to reuse Dutch categories whose auditorydistributions include the most typical tokens of the Spanish correspondents, as in (1)?To answer this, we have to consider what is involved in the listener�s comprehensiontask, i.e. her mapping from auditory information to lexical representations that makecontact with meaning. In several theories of phonological comprehension (for anoverview, see McQueen and Cutler 1997 and McQueen 2005), the process consists oftwo sequential levels, which can be called perception and recognition. The(�prelexical�) perception process maps auditory to phonological surface representationswithout accessing the lexicon, and the recognition process maps the phonological
�4�
surface representations to underlying forms in the lexicon and is heavily influenced bythe semantic and pragmatic context.
(2) Two-stage comprehension model
perception recognitionauditory
!phonological
!lexical
representation representation representation
e.g. [kæso] /k!s"/D |k#s"|D �case�
The advantage of reusing lexical categories now becomes clear: the learner will exhibitsome initial proficiency in her comprehension, at least if she transfers the perceptionsystem to her interlanguage system as well. Suppose, for instance, that the learner is in astage at which she has already correctly stored the Spanish words |kaso|S �case� and|keso|S �cheese� into her interlanguage lexicon as |k#s"|D �case� and |k!s"|D �cheese�. Ahundred native tokens of an intended |kaso|S will have a distribution of vowel formants(for the |a|S part) that is centred around values that are typical of a low front vowel. Assuggested above, Dutch monolinguals may hear 60 of these vowel tokens as /#/D, 27 as/!/D. If learners transfer this perception to their interlanguage, they will perceive 60instances of |kaso|S as /k#s"/D, 27 as /k!s"/D. In the majority of the cases, then, abeginning learner will perceive /k#s"/D, from which the lexical item |k#s"|D �case� canbe retrieved quite easily. Thus, comprehension is well served by an initial transfer ofnative perception (which presupposes an initial transfer of native lexical symbols) to theinterlanguage.
But an interlanguage perception system that is identical to the native perceptionsystem is not perfect yet. In the example above, 27 percent of intended |kaso|S tokens,perhaps the most fronted and raised ones, will be perceived as /k!s"/D, from which it isnot so easy to retrieve the lexical item |k#s"|D �case�.vi To improve, the learner will haveto learn to perceive tokens in the auditory [æ] region as /#/D rather than as /!/D whenlistening to Spanish. Preferably, though, tokens in that same region of auditory spaceshould continue to be perceived as /!/D if the learner is listening to Dutch. Thefollowing table sums up the ways in which [æ] would then be perceived in the fivecases we discussed:
(3) Five perceptions of the auditory form [æ]
Monolingual Spanish: [æ] ! /a/S
Monolingual Dutch: [æ] ! /!/D
Beginning learners when listening to Spanish: [æ] ! /!/D (transfer)Proficient learners when listening to Spanish : [æ] ! /#/D (native-like)All learners when listening to Dutch: [æ] ! /!/D (double perception systems)
The situation in (3) would require a duplication of the learner�s perception system,where the interlanguage perception system starts out as a clone of the native perceptionsystem but subsequently develops towards something more appropriate for thecomprehension of the target language, without affecting the L1 perception system(Escudero & Boersma 2002). The experiment described below, in which we show that
�5�
Dutch learners of Spanish exhibit different perceptual behaviour when they think theyare listening to Dutch than when they think they are listening to Spanish, providesevidence for two separate perception systems in L2 learners.
1.3. The listening experiment: method
The method (stimulus material, subjects, tasks) was described before in Escudero &Boersma (2002). We repeat here only what is relevant for the present paper.
Stimulus material. The same bilingual speaker as in Figure 1 read aloud a Spanishtext, from which we cut 125 CVC (consonant-vowel-consonant) tokens. The consonantswere selected in such a way that each of the 125 CVC tokens could pass for a licitDutch syllable (apart from the vowel).
Subjects. Thirty-eight Dutch learners of Spanish performed the three tasks describedbelow. The learners were from various parts of the Netherlands, so that their vowelsystems may differ from the one in Figure 1 mainly in the location of /!/ (which formany speakers has [!]- and ["]-like positional variants) and in the location of /o#/(which for many speakers has the same degree of diphthongization, and the sameheight, as /e#/ and /ø#/). There were two control groups: 11 Dutch non-learners ofSpanish performed the first and second tasks only, and 44 native speakers of Spanishperformed the third task only.
First task. In the first task the subjects were told that they were going to listen to anumber of Dutch CVC syllables and had to classify the vowel into the Dutch classes/$/, /a#/, /%/, /&/, /e#/, /i/, /'/, /ø#/, /y/, /!/, /o#/, /u/. But what the subjects actuallyheard was a randomized set of the 125 Spanish tokens. To enhance the Dutchperception mode, the tokens were interspersed with 55 CVC tokens that were cut from aDutch text spoken by the same bilingual speaker; many of these 55 tokens containedvery Dutch-sounding vowels and consonants, often corresponding to a recognizableDutch word, e.g. /(ø#s/ �really�. Also, the 180 CVC tokens were embedded within aDutch carrier phrase (luister naar...).
Second task. The second task differed from the first only in the perception mode thatwe wanted to bring the subjects in. So we told the subjects (correctly, this time) thatthey were going to listen to Spanish CVC sequences, and we interspersed the 125 CVCtokens (which were the same as in the first task) with 55 very Spanish-sounding tokens(e.g. /ro)/) and embedded the 180 stimuli within a Spanish carrier phrase (lapalabra...). Importantly, though, we told the listeners to try to �listen with Dutch ears�to these stimuli and to classify the 180 tokens into the 12 Dutch vowel classes.
Third task. The third task differed from the second only in that we told the listenersto listen with Spanish ears and to classify the 180 tokens into the 5 Spanish vowelclasses. This task, then, simply tested the learners� proficiency in the perception of thetarget language.
1.4. The listening experiment: results
When the subjects thought that the language they were hearing was Dutch (Task 1),they responded differently from when they thought the language was Spanish (Task 2):they turned out not to be able to completely �listen with Dutch ears� in Task 2. Fordetails, see Escudero & Boersma (2002, to appear). We now describe the three maindifferences between the results of the two tasks. In Task 2, the group of 38 listeners
�6�
avoided responding with �!�. Although most tokens that were scored as �!� in the firsttask were still scored as �!� in the second (namely 599), many tokens that were scoredas �!� in the first task were scored as �i� or �"� in the second (namely, 120 and 101,respectively). The reverse drift was much smaller: the number of tokens that werescored as �i� or �"� in the first task but as �!� in the second were only 27 and 57,respectively. Since the differences between 120 and 27 and between 101 and 57 aresignificantly greater than zero (see Escudero & Boersma to appear for the statisticaltests), we can reliably say that the listener group shied away from the �!� response in thesecond task. The learners showed an analogous behaviour for �#� responses, whichwere avoided in the second task, where many of them were replaced with �u� and �$�responses. A third reliable effect was the shift of the �%� response: many tokens thatwere scored as �"� when the listeners were fooled into thinking the language was Dutchwere scored as �%� when the listeners knew it was Spanish, and many tokens that werescored as �%� in the first task were scored as �$� in the second. Finally, the long vowels�a&�, �e&�, �o&� and �ø&� were generally avoided in the responses in Task 2.
The learners showed developmental effects. The degree of �!� avoidance in Task 2relative to Task 1 correlated with the experience level of the learners (who were dividedinto 11 beginners, 18 intermediate, and 9 advanced on the basis of an independentlanguage background questionnaire) as well as with the perceptual proficiency level asmeasured in Task 3 (Escudero & Boersma 2002).
1.5. The listening experiment: interpretation
The shift from �"� responses in the first task toward �%� responses in the secondshows that the learners reused their Dutch /%/D category for perceiving Spanish /a/S.We can explain this shift by assuming that for [æ]-like auditory forms some of thelearners follow the mode-dependent strategies predicted in (3) for proficient learners:
(4) Two separate language modes for a proficient Dutch learner of Spanish
Language mode Token Perception ResponseDutch [æ] /"/D �"�
Spanish [æ] /%/D �%�
For the Spanish vowel /i/S, which could in principle have been identified with Dutch/!/D or with Dutch /i/D, the avoidance of �!� in the second task shows that in factSpanish /i/S was identified with Dutch /i/D. This shows that (1) is correct. Theavoidance of the four long vowels in both the first and second tasks confirms theexpectation mentioned in §1.2 that duration is a strong auditory cue that can overrideany spectral similarity.
The developmental effects can be explained by an initial transfer of the nativeperception system to the interlanguage, followed by lexicon-guided learning. Thus, theDutch-appropriate perception of [æ ] as /"/D is transferred to the initial state of thelearner�s interlanguage, so that a beginning Dutch learner of Spanish will perceive [æ]as /"/D, regardless of whether she listens to Dutch or to Spanish. When she is listeningto Spanish, however, the lexicon will often issue an error message. If the learnerperceives an incoming [kæso] as /k"s$/D, for instance, higher conceptual processingmay force the lexicon to recognize /k"s$/D as |k%s$|D �case�. If that happens, the lexicon
�7�
can �tell� the perception system to modify itself in such a way that a /k!s"/D perceptionbecomes more likely in the future (note that the existence of minimal pairs is notrequired). Both the perception system and lexicon-guided learning are formallymodelled in the following sections.
2. An explicit phonological model of perceptionPerception researchers agree that prelexical perception, i.e. the mapping from
auditory to phonological representations, is a language-dependent process for allspeakers from about 9 months of age (Werker and Tees 1984; Jusczyk, Cutler, andRedantz 1993; Polka and Werker 1994). This language dependence is enough reason forus as linguists to want to model prelexical perception by linguistic means, e.g. to modelit by Optimality-Theoretic constraint ranking, as has been done before by Boersma(1997, 1998, 1999, 2000), Hayes (2001), Escudero and Boersma (2003, 2004), andPater (2004).vii Tesar�s (1997, 1998) and Tesar & Smolensky�s (2000) Optimality-Theoretic modelling of the process of robust interpretive parsing, i.e. a mapping fromunanalysed (�overt�) sequences of syllables with stress marks to full abstracthierarchical foot structures, can also be seen as a case of Optimality-Theoreticmodelling of perception, an idea that was pursued by Apoussidou & Boersma (2003,2004).viii
In our special case of L2 acquisition, perception can depend on the language thatlearners think they are listening to: the likelihood of mapping [æ] to the Dutch lexicalvowel symbol /#/D depends on whether the learner thinks she is hearing Dutch (morelikely) or Spanish (less likely), as we mentioned in §1.4. We therefore model thebehaviour of the learner with two separate perception grammars, one for her Dutchperception, which does not change during her learning of Spanish, and one for herSpanish perception, which starts out as a clone of her Dutch perception grammar andsubsequently develops towards a more Spanish-appropriate grammar by the lexicon-driven optimization we introduced in §1.5.
2.1. Tableaus and constraints that model perception
Optimality-Theoretic perception grammars use the same decision scheme as themore usual Optimality-Theoretic production grammars. Whereas a production grammartakes an underlying lexical representation as its input and yields a pronunciation orsurface structure as its output (Prince and Smolensky 1993, McCarthy and Prince 1995),a perception grammar takes an auditory representation as its input and yields aphonological surface structure as its output.
The perceptual process that we restrict ourselves to in this paper is staticcategorization, where the inputs are static (temporally constant) values of auditoryfeatures and the output candidates are language-specific phonological features orphonemes. Escudero & Boersma (2003) proposed that this mapping is evaluated by thenegatively formulated constraint template in (5), which directly relates auditory featurevalues to phonological categories. The reason for its negative formulation will bediscussed in §4.5.
�8�
(5) Arbitrary cue constraints
�A value x on the auditory continuum f should not be mapped to the phonologicalcategory y.�
For our case, the perception of Dutch and Spanish vowels, the relevant auditorycontinua are the first formant (F1), the second formant (F2), and duration, and therelevant phonological categories are the 12 Dutch vowel symbols. Examples of therelevant cue constraints (the term is by Boersma 2005 and Escudero 2005) are therefore�an F1 of 531 Hz is not /!/D�, or �an F2 of 1585 Hz is not /e"/D�, or �a duration of 150ms is not /y/D�. We propose that these cue constraints are arbitrary, i.e. they exist forany auditory value and any vowel category, regardless of whether that auditory value isa plausible cue for that vowel category. Thus while a typical F1 value for /i/D is 280Hz, we indiscriminately allow the presence of constraints like �an F1 of 280 Hz is not/i/D� and �an F1 of 900 Hz is not /i/D�. It is the ranking of these constraints, not theirpresence, that determines what auditory values map to what vowel categories. Thus, inorder to make it unlikely that an auditory input with an F1 of 900 Hz will ever beperceived as /i/D, the constraint �an F1 of 900 Hz is not /i/D� should be ranked veryhigh, and in order to allow that [i]-like auditory events can be perceived as /i/D at all,the constraint �an F1 of 280 Hz is not /i/D� should be ranked rather low.
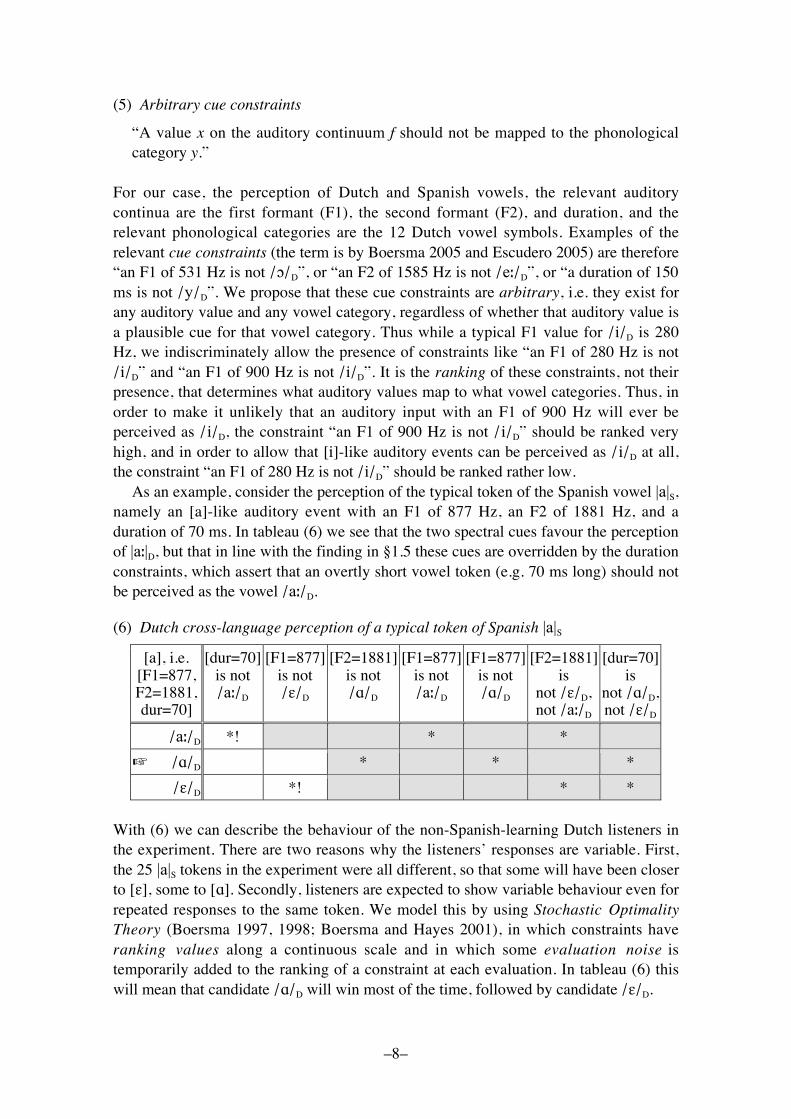
As an example, consider the perception of the typical token of the Spanish vowel |a|S,namely an [a]-like auditory event with an F1 of 877 Hz, an F2 of 1881 Hz, and aduration of 70 ms. In tableau (6) we see that the two spectral cues favour the perceptionof |a"|D, but that in line with the finding in §1.5 these cues are overridden by the durationconstraints, which assert that an overtly short vowel token (e.g. 70 ms long) should notbe perceived as the vowel /a"/D.
(6) Dutch cross-language perception of a typical token of Spanish |a|S
[a], i.e.[F1=877,F2=1881,dur=70]
[dur=70]is not/a"/D
[F1=877]is not/#/D
[F2=1881]is not/$/D
[F1=877]is not/a"/D
[F1=877]is not/$/D
[F2=1881]is
not /#/D,not /a"/D
[dur=70]is
not /$/D,not /#/D
/a"/D *! * *
! /$/D * * *
/#/D *! * *
With (6) we can describe the behaviour of the non-Spanish-learning Dutch listeners inthe experiment. There are two reasons why the listeners� responses are variable. First,the 25 |a|S tokens in the experiment were all different, so that some will have been closerto [#], some to [$]. Secondly, listeners are expected to show variable behaviour even forrepeated responses to the same token. We model this by using Stochastic OptimalityTheory (Boersma 1997, 1998; Boersma and Hayes 2001), in which constraints haveranking values along a continuous scale and in which some evaluation noise istemporarily added to the ranking of a constraint at each evaluation. In tableau (6) thiswill mean that candidate /$/D will win most of the time, followed by candidate /#/D.
�9�
In general, the candidates in a tableau should be all 12 vowels. Since that wouldrequire including all 36 relevant cue constraints, we simplified tableau (6) to includeonly three candidates, so that we need only consider 9 constraints. The remaining ninecandidate vowels can be ruled out by constraints such as �an F1 of 877 Hz is not /i/D�and �an F2 of 1881 Hz is not /!/D�, which are probably ranked far above �a duration of70 ms is not /a"/D�, since there were no �i� or �!� responses at all for intended |a|S.Tableau (6) also abstracts away from constraints such as �an F1 of 280 Hz is not /#/D�that refer to auditory feature values that do not occur in the input of this tableau. Suchconstraints do exist and are ranked along the same continuum as the nine constraints in(6); the constraint �an F1 of 280 Hz is not /#/D� can interact with six of the nineconstraints in (6), namely when the input contains a combination of an F1 of 280 Hzwith either an F2 of 1881 Hz or a duration of 70 ms.
Since the four long Dutch vowels play no role in the identifications in (1) or in theperception experiment reported in §1.3, we will from now on ignore these long vowelsand consider only the eight short vowels as possible candidates. This allows us to ignorethe duration constraints and to focus on the spectral cues alone.
2.2. Lexicon-driven perceptual learning in Optimality Theory
A tableau is just a description of how perception can be modelled in OptimalityTheory. A more explanatory account involves showing how the ranking of so manyconstraints can be learned. This section describes Boersma�s (1997, 1998) proposal forlexicon-driven optimization of an Optimality-Theoretic perception grammar, as it wasfirst applied to the ranking of arbitrary cue constraints in L1 and L2 acquisition byEscudero & Boersma (2003, 2004).
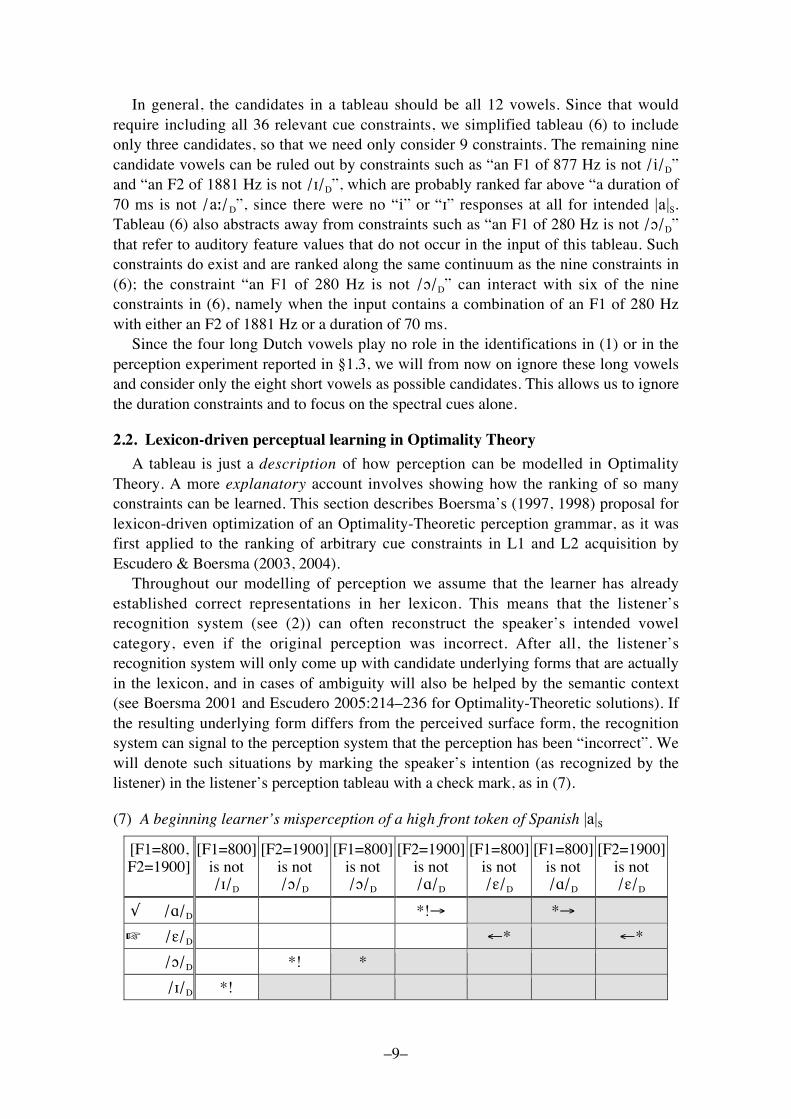
Throughout our modelling of perception we assume that the learner has alreadyestablished correct representations in her lexicon. This means that the listener�srecognition system (see (2)) can often reconstruct the speaker�s intended vowelcategory, even if the original perception was incorrect. After all, the listener�srecognition system will only come up with candidate underlying forms that are actuallyin the lexicon, and in cases of ambiguity will also be helped by the semantic context(see Boersma 2001 and Escudero 2005:214�236 for Optimality-Theoretic solutions). Ifthe resulting underlying form differs from the perceived surface form, the recognitionsystem can signal to the perception system that the perception has been �incorrect�. Wewill denote such situations by marking the speaker�s intention (as recognized by thelistener) in the listener�s perception tableau with a check mark, as in (7).
(7) A beginning learner�s misperception of a high front token of Spanish |a|S
[F1=800,F2=1900]
[F1=800]is not/!/D
[F2=1900]is not/#/D
[F1=800]is not/#/D
[F2=1900]is not/$/D
[F1=800]is not/%/D
[F1=800]is not/$/D
[F2=1900]is not/%/D
! /$/D *!" *"
! /%/D #* #*
/#/D *! *
/!/D *!
�10�
We can assume that the constraint �an F1 of 800 Hz is not /!/D� in (7) is ranked lowerthan the constraint �an F1 of 877 Hz is not /!/D� in (6), because 800 Hz is closer totypical F1 values of |!|D than 877 Hz is. By this lower ranking, the constraint �an F1 of800 Hz is not /!/D� can be ranked below �an F2 of 1900 Hz is not /"/D�, which is ofcourse ranked at nearly the same height as �an F2 of 1881 Hz is not /"/D� in (6). Thisdifference between (6) and (7) now makes /!/D the winner. However, if the learner�spostperceptual recognition tells her she should have perceived /"/D because therecognized lexeme contains the vowel |"|D, she can mark this candidate in the tableau(�!�), and when she notices that this form is different from her winning candidate /!/D,she can take action by changing her perception system. The changes are depicted in thetableau by arrows: the learner will raise the ranking of the two constraints that prefer theform she considers correct (�"�) and lower the ranking of the two constraints thatprefer her incorrectly winning candidate (�#�), thus making it more probable thatauditory events with an F1 of 800 Hz or an F2 of 1900 Hz will be perceived as /"/D atfuture occasions, at least when she is listening to Spanish.
In order to prove that the learning algorithm just described works for Dutch learnersof Spanish throughout their L1 and L2 acquisition, we will show two computersimulations. Section 3 will simulate a simplified problem, namely the L1 and L2acquisition of the mapping from a single auditory continuum (F1) to four vowel heights(exemplified by /"/D, /!/D, /#/D, and /i/D). Section 4 will fully simulate the L1 and L2acquisition of the mapping from two auditory continua (F1 and F2) to the 12 Dutchvowels and, later, the 5 Spanish vowels of Figure 1.
3. One-dimensional vowel lossWe will first simulate the acquisition of a simplified vowel system, one in which a
single auditory continuum, namely F1, is mapped to only four vowels. This initialsimplification is necessary in order for us to be able to illustrate with explicit graphicshow constraint rankings in the perception grammar can lead to an optimal perception inL1 and L2. The two-dimensional case of §4 will then be a straightforward extension.
3.1. The L1 language environment
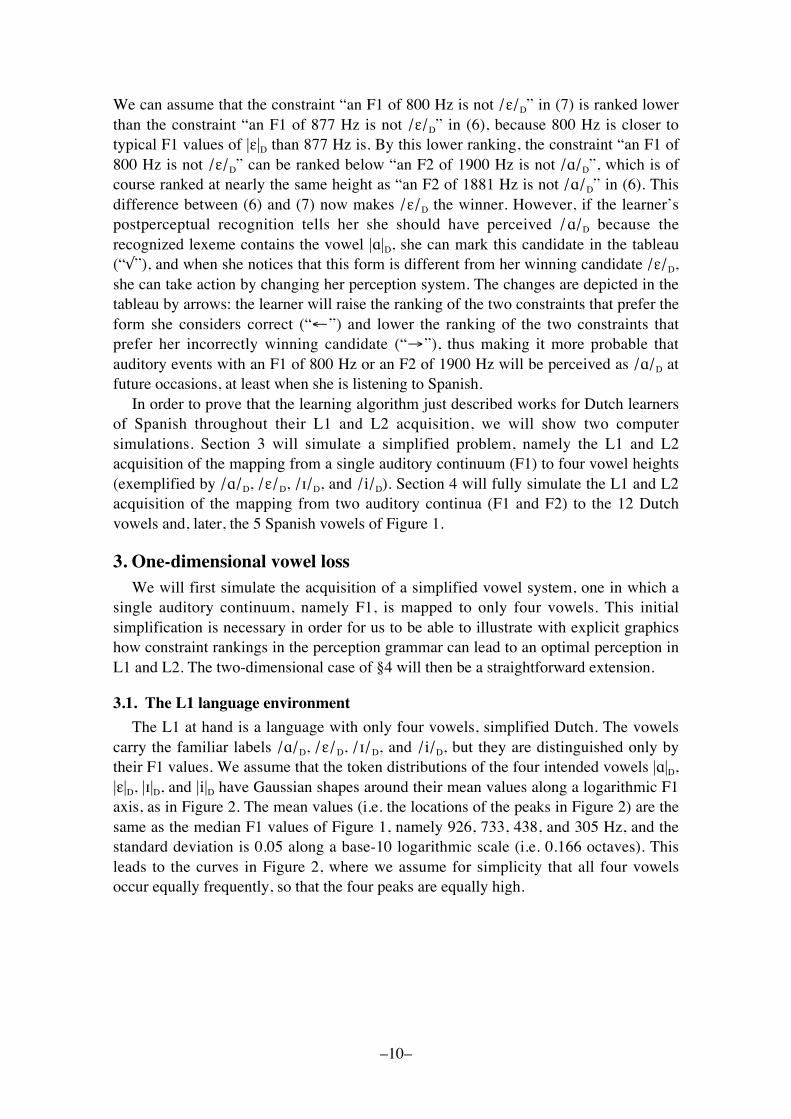
The L1 at hand is a language with only four vowels, simplified Dutch. The vowelscarry the familiar labels /"/D, /!/D, /#/D, and /i/D, but they are distinguished only bytheir F1 values. We assume that the token distributions of the four intended vowels |"|D,|!|D, |#|D, and |i|D have Gaussian shapes around their mean values along a logarithmic F1axis, as in Figure 2. The mean values (i.e. the locations of the peaks in Figure 2) are thesame as the median F1 values of Figure 1, namely 926, 733, 438, and 305 Hz, and thestandard deviation is 0.05 along a base-10 logarithmic scale (i.e. 0.166 octaves). Thisleads to the curves in Figure 2, where we assume for simplicity that all four vowelsoccur equally frequently, so that the four peaks are equally high.
�11�
ŠAŠ
824
ŠεŠ
567
ŠIŠ
365
ŠiŠ
1000150 1500200 300 400 500 700F1 (Hz)
Optimal F1 boundaries (Hz)
Prob
abili
ty d
ensi
ty
Fig. 2. Idealized token distributions for four short Dutch vowels.
3.2. Optimal L1 perception
Figure 2, then, describes the distributions of speakers� productions of the fourintended vowels in a large corpus of one-dimensional Dutch. The task of the listeners isto map each incoming F1 value on one of the vowel categories /!/D, /"/D, /#/D, and/i/D, in preparation for subsequent access of a word containing one of the underlyingvowels |!|D, |"|D, |#|D, and |i|D. The question now is: what would be an optimal strategyfor a listener? We propose that the optimal strategy is to minimize the discrepancybetween the perceived vowel and the recognized vowel, i.e. to minimize the number ofcases where the listener perceives a certain vowel (e.g. /"/D) but subsequently finds adifferent vowel (e.g. |#|D) in her lexicon (we call such a situation a perception error).
A general strategy that achieves this minimization of the number of perception errorsis the maximum likelihood strategy (Helmholtz 1910), where the listener perceives anygiven F1 value as the vowel that was most likely to have been intended by the speaker.In Figure 2 we see that if a listener hears an F1 value of 400 Hz, it is most likely thatthis was a token of an intended vowel |#|D. We know this because for an F1 of 400 Hzthe distribution curve for |#|D lies above the distribution curves for the other threevowels. In general, any F1 value should be perceived as the vowel whose curve ishighest. Which curve is highest in Figure 2 is determined by the three main cuttingpoints of the curves, which lie at 365, 567, and 824 Hz. Given the distributions inFigure 2, then, a maximum-likelihood strategy entails that the listener should perceiveall incoming F1 values below 365 Hz as /i/D, all F1 values between 365 and 567 Hz as/#/D, all F1 values between 567 and 824 Hz as /"/D, and all F1 values above 824 Hz as/!/D. If the listener indeed uses these three optimal boundaries as her criteria forperception, she will achieve a correctness percentage of 90.5, i.e., of all F1 values thatwill be drawn according to the distributions of Figure 2 (with equal probabilities foreach of the four intended vowels) she will perceive 90.5 percent as the same vowel asshe will subsequently find in her lexicon. The remaining 9.5 percent are cases ofperception errors, caused by the overlap in the curves of Figure 2 (i.e. in 9.5 percent ofthe productions an F1 value crosses the boundary with a neighbouring vowel).
�12�
The reader will have noticed that our definition of optimal perception (minimizingthe number of perception errors) is related to our operationalization of lexicon-drivenlearning (§2.2), which changes the perception grammar every time the listener makes aperception error. The simulation of the following section will show that lexicon-drivenperceptual learning with the GLA indeed leads to optimal boundaries in the listener.
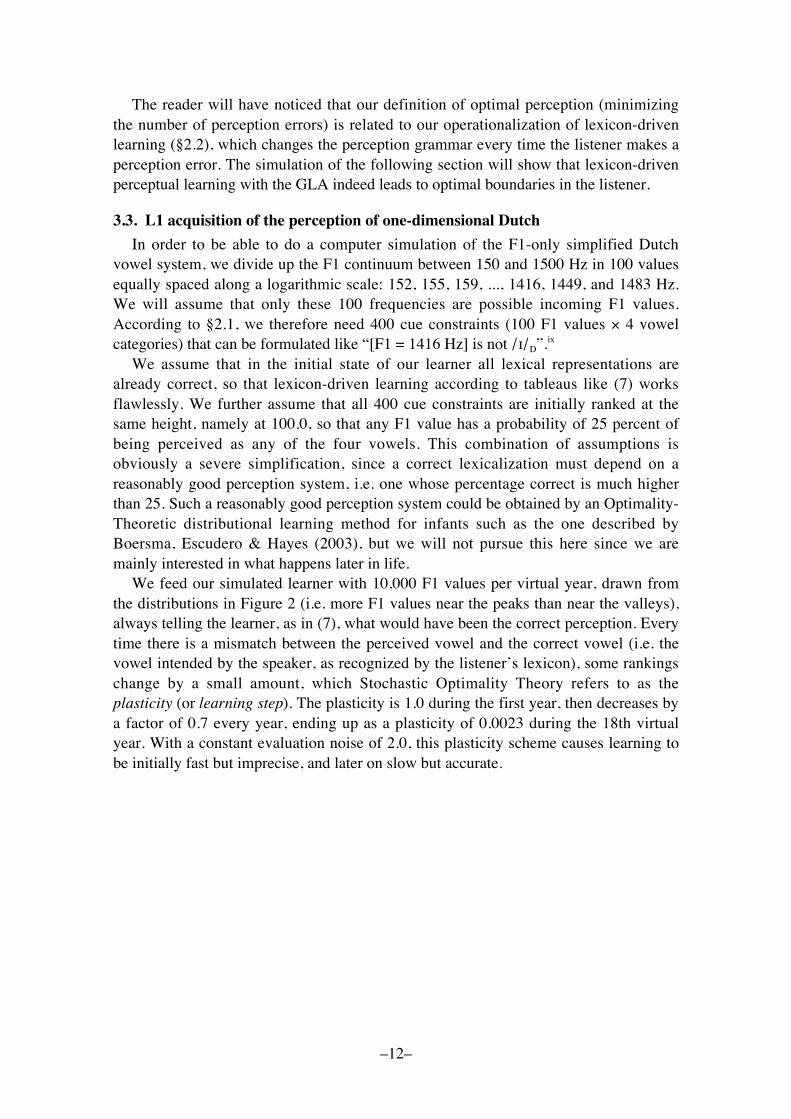
3.3. L1 acquisition of the perception of one-dimensional Dutch
In order to be able to do a computer simulation of the F1-only simplified Dutchvowel system, we divide up the F1 continuum between 150 and 1500 Hz in 100 valuesequally spaced along a logarithmic scale: 152, 155, 159, ..., 1416, 1449, and 1483 Hz.We will assume that only these 100 frequencies are possible incoming F1 values.According to §2.1, we therefore need 400 cue constraints (100 F1 values ! 4 vowelcategories) that can be formulated like �[F1 = 1416 Hz] is not /!/D�.ix
We assume that in the initial state of our learner all lexical representations arealready correct, so that lexicon-driven learning according to tableaus like (7) worksflawlessly. We further assume that all 400 cue constraints are initially ranked at thesame height, namely at 100.0, so that any F1 value has a probability of 25 percent ofbeing perceived as any of the four vowels. This combination of assumptions isobviously a severe simplification, since a correct lexicalization must depend on areasonably good perception system, i.e. one whose percentage correct is much higherthan 25. Such a reasonably good perception system could be obtained by an Optimality-Theoretic distributional learning method for infants such as the one described byBoersma, Escudero & Hayes (2003), but we will not pursue this here since we aremainly interested in what happens later in life.
We feed our simulated learner with 10,000 F1 values per virtual year, drawn fromthe distributions in Figure 2 (i.e. more F1 values near the peaks than near the valleys),always telling the learner, as in (7), what would have been the correct perception. Everytime there is a mismatch between the perceived vowel and the correct vowel (i.e. thevowel intended by the speaker, as recognized by the listener�s lexicon), some rankingschange by a small amount, which Stochastic Optimality Theory refers to as theplasticity (or learning step). The plasticity is 1.0 during the first year, then decreases bya factor of 0.7 every year, ending up as a plasticity of 0.0023 during the 18th virtualyear. With a constant evaluation noise of 2.0, this plasticity scheme causes learning tobe initially fast but imprecise, and later on slow but accurate.
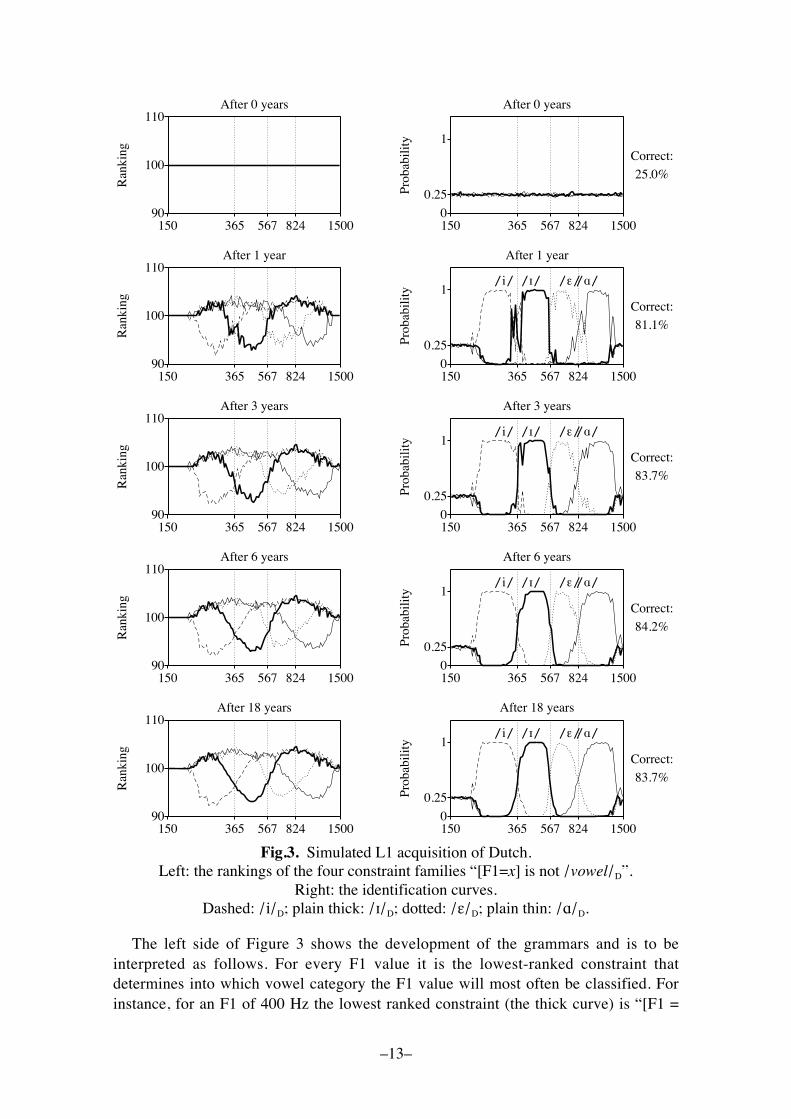
�13�
824567365150 150090
100
110R
anki
ngAfter 0 years
824567365150 15000
0.25
1
Prob
abili
ty
After 0 years
Correct:
25.0%
824567365150 150090
100
110
Ran
king
After 1 year
/A/
824
/ε/
567
/I/
365
/i/
150 15000
0.25
1
Prob
abili
ty
After 1 year
Correct:
81.1%
824567365150 150090
100
110
Ran
king
After 3 years
/A/
824
/ε/
567
/I/
365
/i/
150 15000
0.25
1
Prob
abili
tyAfter 3 years
Correct:
83.7%
824567365150 150090
100
110
Ran
king
After 6 years
/A/
824
/ε/
567
/I/
365
/i/
150 15000
0.25
1
Prob
abili
ty
After 6 years
Correct:
84.2%
824567365150 150090
100
110
Ran
king
After 18 years
/A/
824
/ε/
567
/I/
365
/i/
150 15000
0.25
1
Prob
abili
ty
After 18 years
Correct:
83.7%
Fig.3. Simulated L1 acquisition of Dutch.Left: the rankings of the four constraint families �[F1=x] is not /vowel/D�.
Right: the identification curves.Dashed: /i/D; plain thick: /!/D; dotted: /"/D; plain thin: /#/D.
The left side of Figure 3 shows the development of the grammars and is to beinterpreted as follows. For every F1 value it is the lowest-ranked constraint thatdetermines into which vowel category the F1 value will most often be classified. Forinstance, for an F1 of 400 Hz the lowest ranked constraint (the thick curve) is �[F1 =
�14�
400 Hz] is not /!/D�. Tableau (8) shows that the low ranking of this constraintdetermines the winning candidate, irrespective of the relative ranking of the other threerelevant constraints.
(8) Perception determined by the lowest curve
[F1=400] [F1=400]is not/"/D
[F1=400]is not/#/D
[F1=400]is not/i/D
[F1=400]is not/!/D
/"/D *!
/#/D *!
! /!/D *
/i/D *!
Every grammar leads to its own perception pattern. In the course of the 18 virtual yearswe see that the crossing points of the constraint curves come to lie close to the optimalboundaries of 365, 567, and 824 Hz. If a listener with the 18th-year grammar in Figure3 were to have an evaluation noise to zero, her percentage correct would be about 90.5,just as for the maximum-likelihood listener in §3.2 (the percentage correct can beestimated by running 100,000 F1 values, distributed as in Figure 2, through thegrammar and counting the number of correct output vowels). If we assume, however,that the listener has an evaluation noise of 2.0, just as during learning, the percentagecorrect is a bit lower. It can be shown (Boersma 1997) that in the one-dimensional casethe resulting perception grammar is probability matching, i.e. the probability ofperceiving a certain F1 value as a certain vowel comes to approximate the probabilitythat this F1 value had been intended as that vowel. For instance, we can read off Figure2 that an F1 value of 400 Hz has 90 percent chance of having been intended as |!|D and10 percent chance of having been intended as |i|D. When confronted with an auditoryinput of 400 Hz, a probability-matching listener will perceive it 90 percent of the timeas /!/D and 10 percent of the time as /i/D. Exactly this is what our learner comes to do,improving her perception of the whole distribution from 25 percent correct to 83.7percent correct, which is the same value that can be computed from Figure 2.x In therest of this paper we will call probability-matching behaviour �optimal�, and forgetabout maximum-likelihood behaviour, which never occurs in practice anyway.
The right side of Figure 3 shows our virtual listener�s identification curves (as knownfrom many perception experiments with real listeners), i.e. for each of the four vowels acurve that shows for every F1 value how often that F1 value is perceived as that vowel.These curves are computed by running each of the 100 F1 values through the grammar1,000 times and counting how often each of the four possible vowels is the winner. Thevirtual learner grows increasingly confident of her category boundaries, which becomeoptimal for her language environment.
3.4. L2 acquisition of the perception of one-dimensional Spanish
After having learned Dutch for 18 years, our virtual learner starts learning Spanish.Our one-dimensional Spanish has the three vowels |a|S, | e |S, and | i |S, whose F1
�15�
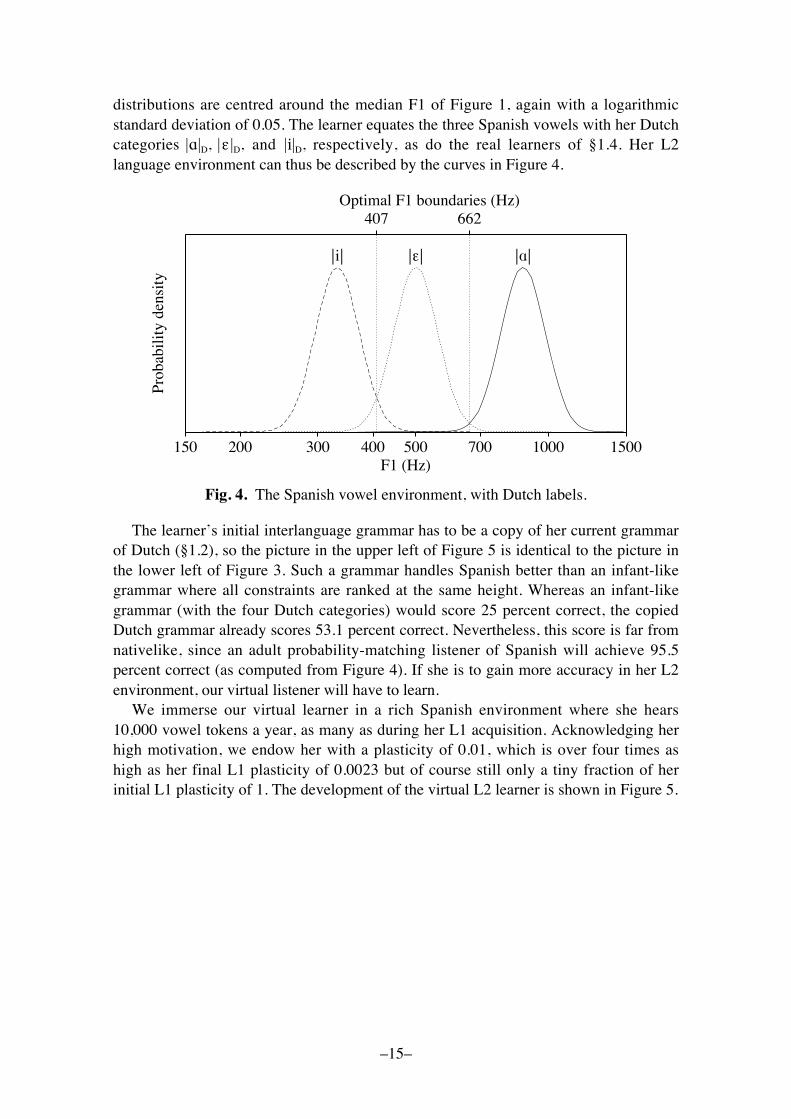
distributions are centred around the median F1 of Figure 1, again with a logarithmicstandard deviation of 0.05. The learner equates the three Spanish vowels with her Dutchcategories |!|D, |" |D, and |i|D, respectively, as do the real learners of §1.4. Her L2language environment can thus be described by the curves in Figure 4.
ŠAŠ
662
ŠεŠ
407
ŠiŠ
1000150 1500200 300 400 500 700F1 (Hz)
Optimal F1 boundaries (Hz)
Prob
abili
ty d
ensi
ty
Fig. 4. The Spanish vowel environment, with Dutch labels.
The learner�s initial interlanguage grammar has to be a copy of her current grammarof Dutch (§1.2), so the picture in the upper left of Figure 5 is identical to the picture inthe lower left of Figure 3. Such a grammar handles Spanish better than an infant-likegrammar where all constraints are ranked at the same height. Whereas an infant-likegrammar (with the four Dutch categories) would score 25 percent correct, the copiedDutch grammar already scores 53.1 percent correct. Nevertheless, this score is far fromnativelike, since an adult probability-matching listener of Spanish will achieve 95.5percent correct (as computed from Figure 4). If she is to gain more accuracy in her L2environment, our virtual listener will have to learn.
We immerse our virtual learner in a rich Spanish environment where she hears10,000 vowel tokens a year, as many as during her L1 acquisition. Acknowledging herhigh motivation, we endow her with a plasticity of 0.01, which is over four times ashigh as her final L1 plasticity of 0.0023 but of course still only a tiny fraction of herinitial L1 plasticity of 1. The development of the virtual L2 learner is shown in Figure 5.
�16�
662407150 150090
100
110R
anki
ngAfter 0 years
/A/
662
/ε/
407
/I//i/
150 15000
0.25
1
Prob
abili
ty
After 0 years
Correct:
53.1%
662407150 150090
100
110
Ran
king
After 1 year
/A/
662
/ε/
407
/I//i/
150 15000
0.25
1
Prob
abili
ty
After 1 year
Correct:
62.6%
662407150 150090
100
110
Ran
king
After 3 years
/A/
662
/ε/
407
/I//i/
150 15000
0.25
1
Prob
abili
tyAfter 3 years
Correct:
80.3%
662407150 150090
100
110
Ran
king
After 6 years
/A/
662
/ε/
407
/I//i/
150 15000
0.25
1
Prob
abili
ty
After 6 years
Correct:
88.9%
662407150 150090
100
110
Ran
king
After 18 years
/A/
662
/ε/
407
/I//i/
150 15000
0.25
1
Prob
abili
ty
After 18 years
Correct:
94.0%
Fig. 5. Simulated L2 acquisition of Spanish.Left: the rankings of the four constraint families �[F1=x] is not /vowel/D�.
Right: the identification curves.Dashed: /i/D; plain thick: /!/D; dotted: /"/D; plain thin: /#/D.
The main feature of the development is the fall of the /!/D category. Whenever thelearner perceives an incoming F1 value as /!/D, the interlanguage lexicon, which doesnot contain any instances of |!|D, will tell her that she should have perceived a differentvowel, most often /i/D or /e/D. In all these cases, one of the constraints �[F1=x] is not
�17�
/!/D� will rise along the ranking scale, thus making it less likely that the nextocccurrence of the same F1 value will again be perceived as /!/D.
The learner�s proficiency clearly improves, although despite her complete immersionin her L2 environment, despite her raised motivation, and despite her full access to anL1-like learning mechanism (the GLA), she has trouble achieving complete nativelikecompetence (i.e. 95.5%), even in 18 years. This small failure is mainly due to theplasticity of 0.01, which stresses adultlike precision rather than infantlike learningspeed.
4. Two-dimensional vowel loss and shift of |!|DAfter the oversimplification of §3, our second simulation reflects a more realistic
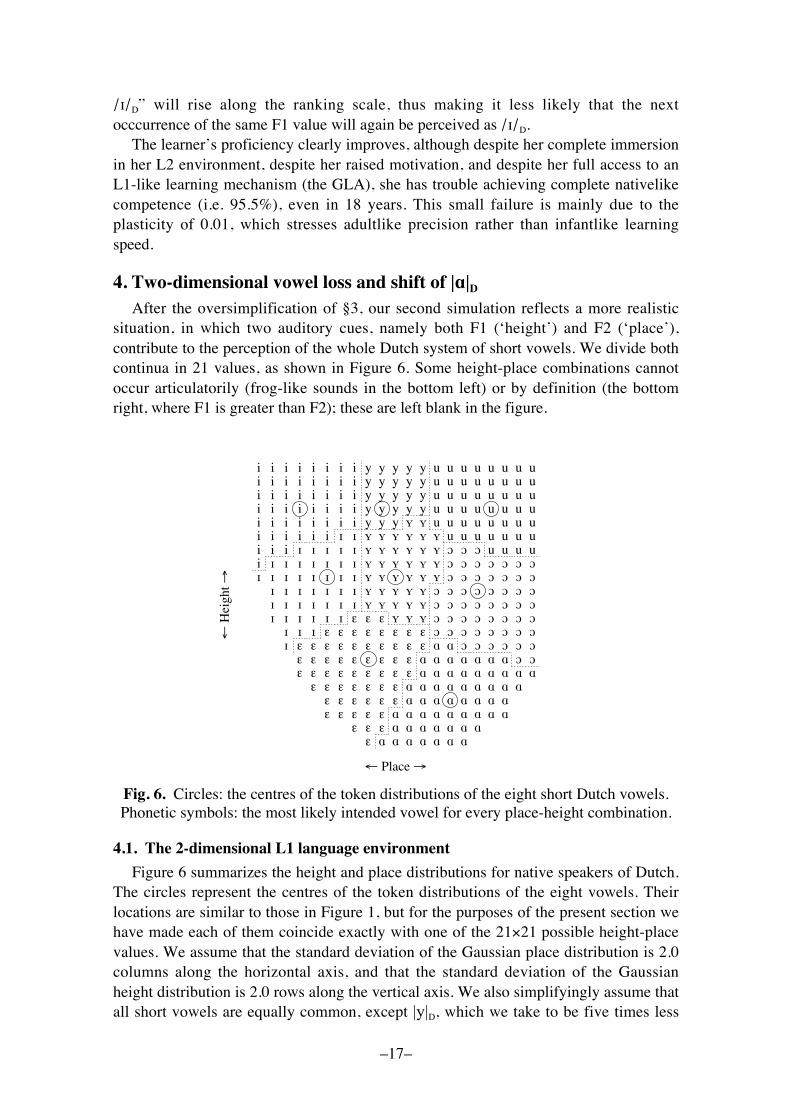
situation, in which two auditory cues, namely both F1 (�height�) and F2 (�place�),contribute to the perception of the whole Dutch system of short vowels. We divide bothcontinua in 21 values, as shown in Figure 6. Some height-place combinations cannotoccur articulatorily (frog-like sounds in the bottom left) or by definition (the bottomright, where F1 is greater than F2); these are left blank in the figure.
ε A A A A A A Aε ε ε A A A A A A A
ε ε ε ε ε A A A A A A A A Aε ε ε ε ε ε A A A A A A A A
ε ε ε ε ε ε ε A A A A A A A A Aε ε ε ε ε ε ε ε ε A A A A A A A A Aε ε ε ε ε ε ε ε ε A A A A A A A O O
I ε ε ε ε ε ε ε ε ε ε A A O O O O O OI I I ε ε ε ε ε ε ε ε O O O O O O O O
I I I I I I ε ε ε Y Y Y O O O O O O O OI I I I I I I Y Y Y Y Y O O O O O O O OI I I I I I I Y Y Y Y Y O O O O O O O O
I I I I I I I I Y Y Y Y Y Y O O O O O O Oi I I I I I I I Y Y Y Y Y Y O O O O O O Oi i i I I I I I Y Y Y Y Y Y O O O u u u ui i i i i i I I Y Y Y Y Y Y u u u u u u ui i i i i i i i y y y Y Y u u u u u u u ui i i i i i i i y y y y y u u u u u u u ui i i i i i i i y y y y y u u u u u u u ui i i i i i i i y y y y y u u u u u u u ui i i i i i i i y y y y y u u u u u u u u
← Place →
← H
eigh
t →
Fig. 6. Circles: the centres of the token distributions of the eight short Dutch vowels.Phonetic symbols: the most likely intended vowel for every place-height combination.
4.1. The 2-dimensional L1 language environment
Figure 6 summarizes the height and place distributions for native speakers of Dutch.The circles represent the centres of the token distributions of the eight vowels. Theirlocations are similar to those in Figure 1, but for the purposes of the present section wehave made each of them coincide exactly with one of the 21!21 possible height-placevalues. We assume that the standard deviation of the Gaussian place distribution is 2.0columns along the horizontal axis, and that the standard deviation of the Gaussianheight distribution is 2.0 rows along the vertical axis. We also simplifyingly assume thatall short vowels are equally common, except |y|D, which we take to be five times less
�18�
common in this simplified Dutch inventory than every other short vowel. Figure 6 thenshows for each F1-F2 combination what the most likely intended vowel is. The regionsthus attributed to each vowel are delimited by dotted lines in the figure. These�production boundaries� turn out to run at equal distances to the nearest vowels, exceptfor the boundaries around the |y|D area, which reflect the low token frequency of thisvowel.
4.2. Optimal 2-dimensional perception
Since Figure 6 shows the most likely intended productions, the productionboundaries in this figure must indicate the optimal boundaries for perception as well.We can compute that a probability-matching listener would score 78.2% correct. Thefollowing section shows that GLA learners can achieve this optimal perception.
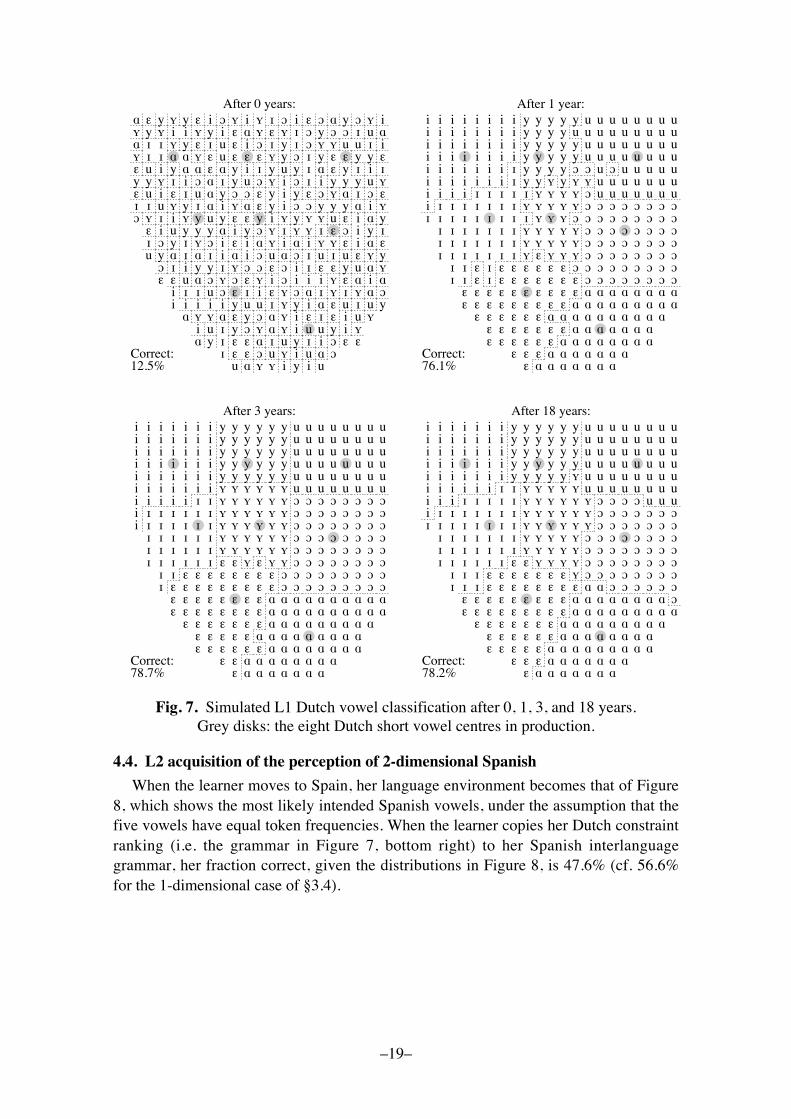
4.3. L1 acquisition of the perception of 2-dimensional Dutch
Analogously to §3.3, we feed a virtual Dutch listener 10,000 F1-F2 tokens a year,drawn randomly from the distribution in Figure 6 (i.e. fewer tokens far away from thevowel centres than close to them, and fewer tokens of |y|D than of every other vowel).
The virtual learner�s grammar contains 336 cue constraints (= (21 height values + 21place values) ! 8 vowels), which start out being ranked at the same height. Subsequentlearning is performed, as before, via 180,000 tableaus, which in case of a misperceptioncause a learning step analogous to that in tableau (7). The evaluation noise and plasticityregime are as in §3.3. There is no simple way to show the grammars or identificationcurves, as there was in the 1-dimensional case of §3.3, but we can compute for everyF1-F2 combination what the most likely perceived vowel is, by running each F1-F2combination through the grammar 1000 times. The results are in Figure 7, which showsthe development of the learner�s performance. While after one year the �perceptionboundaries� (the dotted lines that delimit the most-likely-vowel areas) are still ratherragged, after 18 years they are smooth and very close to the production boundaries ofFigure 6, leading to fractions correct that compare very well with the optimum reportedin §4.2. It turns out that the GLA is indeed capable of creating a stochastic Optimality-Theoretic grammar that exhibits optimal perceptual behaviour.
�19�
u A Y Y i y i uI ε ε O u Y i u A O
A y I ε ε A I u y I i O ε εi u I y O Y A Y i u u y i Y
A Y Y A ε y O A Y i ε I ε i u Yi i i i i y u u I Y y i A ε u I u yi I I u O ε I i ε Y O A I Y I Y A O
ε ε u A O Y O ε Y i O i i i Y ε A i AO I i y y I Y O O ε O i I ε ε y u A Y
u y A I A I i A i O u A O I u I u ε Y yI O y I Y O i ε i A Y i A i Y Y ε i A εε i u y y y A i y O Y I Y Y I ε O i y I
O Y I i Y y u y ε ε y i Y y Y Y u ε i A yI I u Y y I A i Y A ε y i O O y y y A i Yε u i ε I u A y O O ε y i y ε O Y A I O εy y Y I i O A I y u O Y i O I i y y y u Yε u i y A A ε A y i I y u y I A ε y I i IY I I A A Y ε u ε ε ε Y y O I y ε ε y y εA I I Y y ε I u ε i O I y I O Y Y u u I iY y Y i i Y y i ε A Y ε Y I O y O O I u AA ε y Y y ε i O Y i Y I O i ε O A y O Y i
Correct:12.5%
After 0 years:
ε A A A A A A A
ε ε ε A A A A A A Aε ε ε ε ε ε A A A A A A A Aε ε ε ε ε ε ε A A A A A A A
ε ε ε ε ε ε A A A A A A A A A Aε ε ε ε ε ε ε ε ε A A A A A A A A Aε ε ε ε ε ε ε ε ε ε A A A A A A A A
I I ε I ε ε ε ε ε ε ε O O O O O O O OI I ε I ε ε ε ε ε ε O O O O O O O O O
I I I I I I I Y ε Y Y Y O O O O O O O OI I I I I I I Y Y Y Y Y O O O O O O O OI I I I I I I Y Y Y Y Y O O O O O O O O
I I I I I I I I I Y Y Y O O O O O O O O Oi I I I I I I I Y Y Y Y Y O O O O O O O Oi i i i I I I I I Y Y Y Y O u u u u u u ui i i i i i i I y y Y y Y Y u u u u u u ui i i i i i i I y y y y O O u O u u u u ui i i i i i i i y y y y y u u u u u u u ui i i i i i i i y y y y y u u u u u u u ui i i i i i i i y y y y u u u u u u u u ui i i i i i i i y y y y y u u u u u u u u
Correct:76.1%
After 1 year:
ε A A A A A A Aε ε A A A A A A A A
ε ε ε ε ε ε A A A A A A A Aε ε ε ε ε A A A A A A A A A
ε ε ε ε ε ε ε A A A A A A A A Aε ε ε ε ε ε ε ε A A A A A A A A A Aε ε ε ε ε ε ε ε A A A A A A A A A A
I ε ε ε ε ε ε ε ε ε O O O O O O O O OI I ε ε ε ε ε ε ε ε O O O O O O O O O
I I I I I I ε ε Y ε Y Y O O O O O O O OI I I I I I Y Y Y Y Y Y O O O O O O O OI I I I I I Y Y Y Y Y Y O O O O O O O O
i I I I I I I Y Y Y Y Y Y O O O O O O O Oi I I I I I I Y Y Y Y Y Y O O O O O O O Oi i i i i I I Y Y Y Y Y Y O O O O O O O Oi i i i i i i Y Y Y Y Y Y u u u u u u u ui i i i i i i y y y y y y u u u u u u u ui i i i i i i y y y y y y u u u u u u u ui i i i i i i y y y y y y u u u u u u u ui i i i i i i y y y y y y u u u u u u u ui i i i i i i y y y y y y u u u u u u u u
Correct:78.7%
After 3 years:
ε A A A A A A A
ε ε ε A A A A A A Aε ε ε ε ε A A A A A A A A Aε ε ε ε ε ε A A A A A A A A
ε ε ε ε ε ε ε A A A A A A A A Aε ε ε ε ε ε ε ε ε A A A A A A A A Aε ε ε ε ε ε ε ε ε A A A A A A A A O
I I I ε ε ε ε ε ε ε ε A A O O O O O OI I I ε ε ε ε ε ε ε Y O O O O O O O O
I I I I I I ε ε Y Y Y Y O O O O O O O OI I I I I I I Y Y Y Y Y O O O O O O O OI I I I I I I Y Y Y Y Y O O O O O O O O
I I I I I I I I Y Y Y Y Y Y O O O O O O Oi I I I I I I I Y Y Y Y Y Y O O O O O O Oi i i I I I I I Y Y Y Y Y Y O O O O u u ui i i i i i I I Y Y Y Y Y u u u u u u u ui i i i i i i y y y y y Y u u u u u u u ui i i i i i i y y y y y y u u u u u u u ui i i i i i i y y y y y y u u u u u u u ui i i i i i i y y y y y y u u u u u u u ui i i i i i i y y y y y y u u u u u u u u
Correct:78.2%
After 18 years:
Fig. 7. Simulated L1 Dutch vowel classification after 0, 1, 3, and 18 years.Grey disks: the eight Dutch short vowel centres in production.
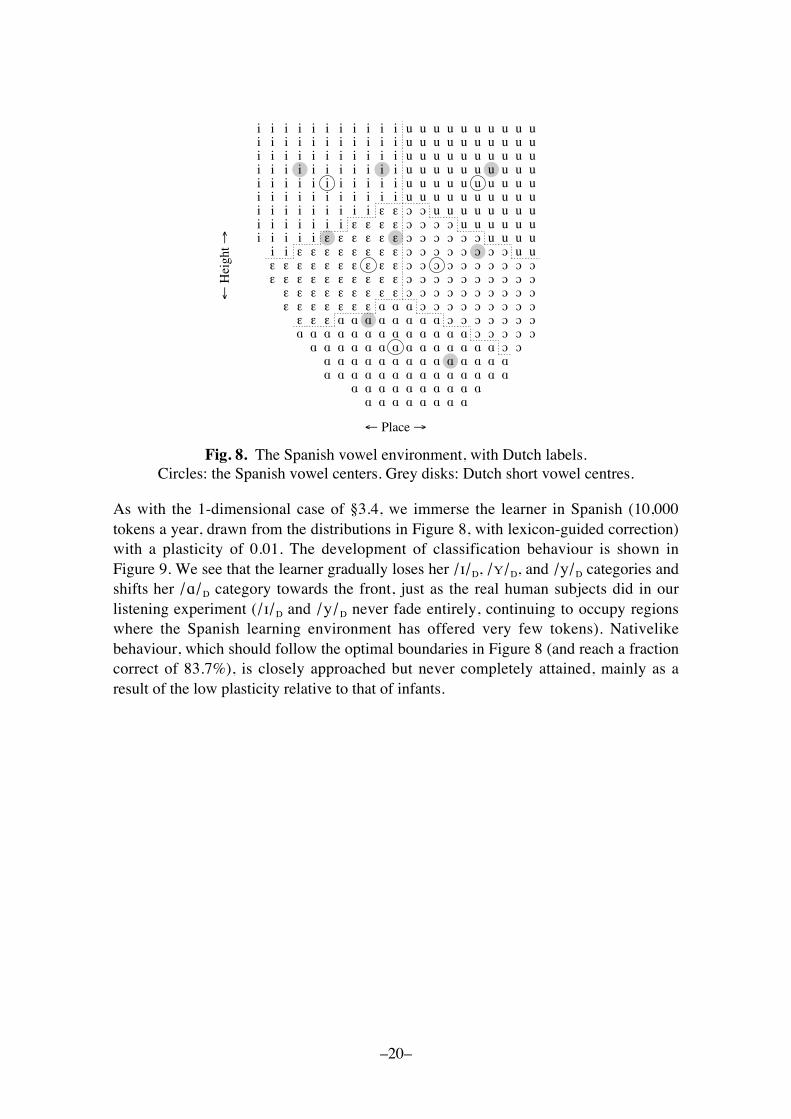
4.4. L2 acquisition of the perception of 2-dimensional Spanish
When the learner moves to Spain, her language environment becomes that of Figure8, which shows the most likely intended Spanish vowels, under the assumption that thefive vowels have equal token frequencies. When the learner copies her Dutch constraintranking (i.e. the grammar in Figure 7, bottom right) to her Spanish interlanguagegrammar, her fraction correct, given the distributions in Figure 8, is 47.6% (cf. 56.6%for the 1-dimensional case of §3.4).
�20�
A A A A A A A AA A A A A A A A A A
A A A A A A A A A A A A A AA A A A A A A A A A A A A A
A A A A A A A A A A A A A A O OA A A A A A A A A A A A A O O O O Oε ε ε A A A A A A A A O O O O O O O
ε ε ε ε ε ε ε A A A O O O O O O O O Oε ε ε ε ε ε ε ε ε O O O O O O O O O O
ε ε ε ε ε ε ε ε ε ε O O O O O O O O O Oε ε ε ε ε ε ε ε ε ε O O O O O O O O O Oi i ε ε ε ε ε ε ε ε O O O O O O O O u u
i i i i i ε ε ε ε ε ε O O O O O O u u u ui i i i i i i ε ε ε ε O O O O u u u u u ui i i i i i i i i ε ε O O u u u u u u u ui i i i i i i i i i i u u u u u u u u u ui i i i i i i i i i i u u u u u u u u u ui i i i i i i i i i i u u u u u u u u u ui i i i i i i i i i i u u u u u u u u u ui i i i i i i i i i i u u u u u u u u u ui i i i i i i i i i i u u u u u u u u u u
← Place →
← H
eigh
t →
Fig. 8. The Spanish vowel environment, with Dutch labels.Circles: the Spanish vowel centers. Grey disks: Dutch short vowel centres.
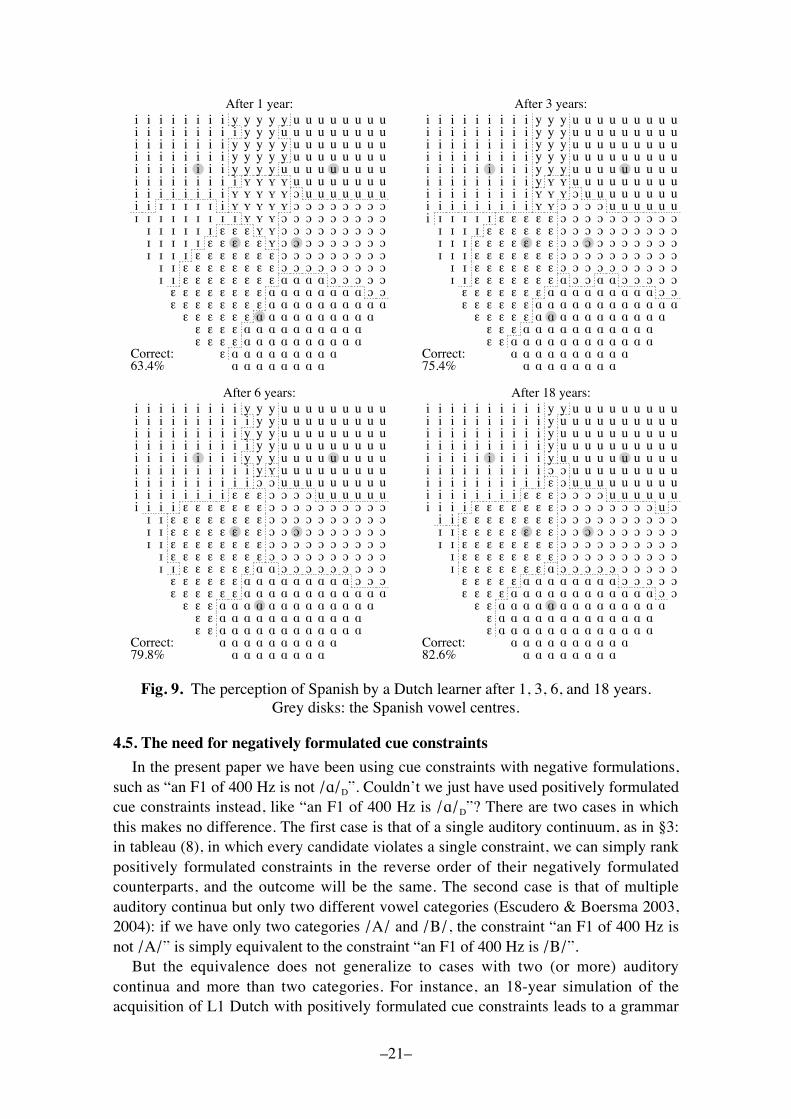
As with the 1-dimensional case of §3.4, we immerse the learner in Spanish (10,000tokens a year, drawn from the distributions in Figure 8, with lexicon-guided correction)with a plasticity of 0.01. The development of classification behaviour is shown inFigure 9. We see that the learner gradually loses her /!/D, /"/D, and /y/D categories andshifts her /#/D category towards the front, just as the real human subjects did in ourlistening experiment (/!/D and /y/D never fade entirely, continuing to occupy regionswhere the Spanish learning environment has offered very few tokens). Nativelikebehaviour, which should follow the optimal boundaries in Figure 8 (and reach a fractioncorrect of 83.7%), is closely approached but never completely attained, mainly as aresult of the low plasticity relative to that of infants.
�21�
A A A A A A A Aε A A A A A A A A A
ε ε ε ε A A A A A A A A A Aε ε ε ε A A A A A A A A A A
ε ε ε ε ε ε A A A A A A A A A Aε ε ε ε ε ε ε ε A A A A A A A A A Aε ε ε ε ε ε ε ε A A A A A A A A O O
I I ε ε ε ε ε ε ε ε A A A A O O O O OI I ε ε ε ε ε ε ε ε O O O O O O O O O
I I I I ε ε ε ε ε ε ε O O O O O O O O OI I I I I ε ε ε ε ε Y O O O O O O O O OI I I I I I ε ε ε Y Y O O O O O O O O O
I I I I I I I I I Y Y Y O O O O O O O O Oi i I I I I I i Y Y Y Y Y O O O O O O O Oi i i i i i i i Y Y Y Y Y O u u u u u u ui i i i i i i i i Y Y Y Y u u u u u u u ui i i i i i i i y y y y u u u u u u u u ui i i i i i i i y y y y y u u u u u u u ui i i i i i i i y y y y y u u u u u u u ui i i i i i i i i y y y u u u u u u u u ui i i i i i i i y y y y y u u u u u u u u
Correct:63.4%
After 1 year:
A A A A A A A A
A A A A A A A A A Aε ε A A A A A A A A A A A Aε ε ε A A A A A A A A A A A
ε ε ε ε ε A A A A A A A A A A Aε ε ε ε ε ε A A A A A A A A A A A Aε ε ε ε ε ε ε A A A A A A A A A O O
I I ε ε ε ε ε ε ε A O O A A O O O O OI I ε ε ε ε ε ε ε O O O O O O O O O O
I I I ε ε ε ε ε ε ε O O O O O O O O O OI I I ε ε ε ε ε ε ε O O O O O O O O O OI I I I ε ε ε ε ε ε O O O O O O O O O O
i I I I I I ε ε ε ε ε O O O O O O O O O Oi i i i i i i i i Y Y O O O O u u u u u ui i i i i i i i i Y Y Y O u u u u u u u ui i i i i i i i i y Y Y u u u u u u u u ui i i i i i i i i y y y u u u u u u u u ui i i i i i i i i y y y u u u u u u u u ui i i i i i i i i y y y u u u u u u u u ui i i i i i i i i y y y u u u u u u u u ui i i i i i i i i y y y u u u u u u u u u
Correct:75.4%
After 3 years:
A A A A A A A AA A A A A A A A A A
ε ε A A A A A A A A A A A Aε ε A A A A A A A A A A A A
ε ε ε A A A A A A A A A A A A Aε ε ε ε ε ε A A A A A A A A A A A Aε ε ε ε ε ε A A A A A A A A A O O O
I I ε ε ε ε ε ε A A O O O O O O O O OI ε ε ε ε ε ε ε ε O O O O O O O O O O
I I ε ε ε ε ε ε ε ε O O O O O O O O O OI I ε ε ε ε ε ε ε ε O O O O O O O O O OI I ε ε ε ε ε ε ε ε O O O O O O O O O O
i i i i ε ε ε ε ε ε ε O O O O O O O O O Oi i i i i i i i ε ε ε O O O O u u u u u ui i i i i i i i i i O O u u u u u u u u ui i i i i i i i i i y Y u u u u u u u u ui i i i i i i i i y y y u u u u u u u u ui i i i i i i i i i y y u u u u u u u u ui i i i i i i i i y y y u u u u u u u u ui i i i i i i i i i y y u u u u u u u u ui i i i i i i i i y y y u u u u u u u u u
Correct:79.8%
After 6 years:
A A A A A A A A
A A A A A A A A A Aε A A A A A A A A A A A A Aε A A A A A A A A A A A A A
ε ε A A A A A A A A A A A A A Aε ε ε ε A A A A A A A A A A A A O Oε ε ε ε ε A A A A A A A A O O O O O
I ε ε ε ε ε ε ε A O O O O O O O O O OI ε ε ε ε ε ε ε ε O O O O O O O O O O
I I ε ε ε ε ε ε ε ε O O O O O O O O O OI I ε ε ε ε ε ε ε ε O O O O O O O O O Oi i ε ε ε ε ε ε ε ε O O O O O O O O O O
i i i i ε ε ε ε ε ε ε O O O O O O O O u Oi i i i i i i i ε ε ε O O O O u u u u u ui i i i i i i i i i ε O u u u u u u u u ui i i i i i i i i i O O u u u u u u u u ui i i i i i i i i i y u u u u u u u u u ui i i i i i i i i i y u u u u u u u u u ui i i i i i i i i i y u u u u u u u u u ui i i i i i i i i i y u u u u u u u u u ui i i i i i i i i i y y u u u u u u u u u
Correct:82.6%
After 18 years:
Fig. 9. The perception of Spanish by a Dutch learner after 1, 3, 6, and 18 years.Grey disks: the Spanish vowel centres.
4.5. The need for negatively formulated cue constraints
In the present paper we have been using cue constraints with negative formulations,such as �an F1 of 400 Hz is not /!/D�. Couldn�t we just have used positively formulatedcue constraints instead, like �an F1 of 400 Hz is /!/D�? There are two cases in whichthis makes no difference. The first case is that of a single auditory continuum, as in §3:in tableau (8), in which every candidate violates a single constraint, we can simply rankpositively formulated constraints in the reverse order of their negatively formulatedcounterparts, and the outcome will be the same. The second case is that of multipleauditory continua but only two different vowel categories (Escudero & Boersma 2003,2004): if we have only two categories /A/ and /B/, the constraint �an F1 of 400 Hz isnot /A/� is simply equivalent to the constraint �an F1 of 400 Hz is /B/�.
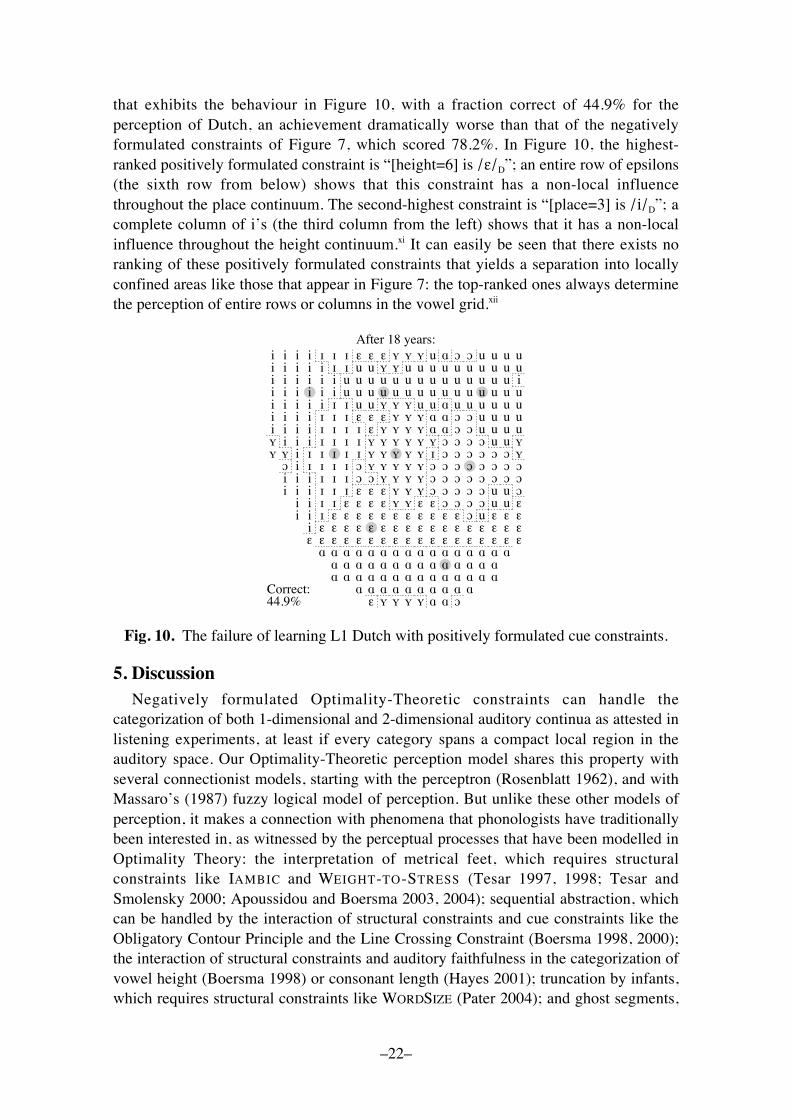
But the equivalence does not generalize to cases with two (or more) auditorycontinua and more than two categories. For instance, an 18-year simulation of theacquisition of L1 Dutch with positively formulated cue constraints leads to a grammar
�22�
that exhibits the behaviour in Figure 10, with a fraction correct of 44.9% for theperception of Dutch, an achievement dramatically worse than that of the negativelyformulated constraints of Figure 7, which scored 78.2%. In Figure 10, the highest-ranked positively formulated constraint is �[height=6] is /!/D�; an entire row of epsilons(the sixth row from below) shows that this constraint has a non-local influencethroughout the place continuum. The second-highest constraint is �[place=3] is /i/D�; acomplete column of i�s (the third column from the left) shows that it has a non-localinfluence throughout the height continuum.xi It can easily be seen that there exists noranking of these positively formulated constraints that yields a separation into locallyconfined areas like those that appear in Figure 7: the top-ranked ones always determinethe perception of entire rows or columns in the vowel grid.xii
ε Y Y Y Y A A OA A A A A A A A A A
A A A A A A A A A A A A A AA A A A A A A A A A A A A A
A A A A A A A A A A A A A A A Aε ε ε ε ε ε ε ε ε ε ε ε ε ε ε ε ε εi ε ε ε ε ε ε ε ε ε ε ε ε ε ε ε ε ε
i i I ε ε ε ε ε ε ε ε ε ε ε O u ε ε εi i I I ε ε ε ε Y Y ε ε O O O O u u ε
i i i I I I ε ε ε Y Y Y O O O O O u u Oi i i I I I O O Y Y Y Y O O O O O O O OO i I I I I O Y Y Y Y Y O O O O O O O O
Y Y i I I I I I Y Y Y Y Y I O O O O O O YY i i i I I I I Y Y Y Y Y Y O O O O u u Yi i i i I I I I ε Y Y Y Y A A O O u u u ui i i i I I I ε ε ε Y Y Y A A O O u u u ui i i i i I I u u Y Y Y u u A u u u u u ui i i i i i u u u u u u u u u u u u u u ui i i i i i u u u u u u u u u u u u u u ii i i i i I I u u Y Y u u u u u u u u u ui i i i I I I ε ε ε Y Y Y u A O O u u u u
Correct:44.9%
After 18 years:
Fig. 10. The failure of learning L1 Dutch with positively formulated cue constraints.
5. DiscussionNegatively formulated Optimality-Theoretic constraints can handle the
categorization of both 1-dimensional and 2-dimensional auditory continua as attested inlistening experiments, at least if every category spans a compact local region in theauditory space. Our Optimality-Theoretic perception model shares this property withseveral connectionist models, starting with the perceptron (Rosenblatt 1962), and withMassaro�s (1987) fuzzy logical model of perception. But unlike these other models ofperception, it makes a connection with phenomena that phonologists have traditionallybeen interested in, as witnessed by the perceptual processes that have been modelled inOptimality Theory: the interpretation of metrical feet, which requires structuralconstraints like IAMBIC and WEIGHT-TO-STRESS (Tesar 1997, 1998; Tesar andSmolensky 2000; Apoussidou and Boersma 2003, 2004); sequential abstraction, whichcan be handled by the interaction of structural constraints and cue constraints like theObligatory Contour Principle and the Line Crossing Constraint (Boersma 1998, 2000);the interaction of structural constraints and auditory faithfulness in the categorization ofvowel height (Boersma 1998) or consonant length (Hayes 2001); truncation by infants,which requires structural constraints like WORDSIZE (Pater 2004); and ghost segments,
�23�
which can be handled by the interaction of structural and cue constraints (Boersma2005).
The general usefulness of modelling perception in Optimality Theory extends to thespecific kinds of cue constraints described here, which are not specific to the task oflearning a smaller L2 vowel system. The same kind of constraints have been applied tolearning to perceive a larger L2 vowel system, i.e. an inventory with new sounds (fromSpanish to English: Escudero & Boersma 2004), and to learning an equally large L2vowel system, i.e. an inventory with similar but non-identical sounds (from CanadianEnglish to Canadian French: Escudero 2005), and they have been combined withauditory-to-auditory constraints in the modelling of L1 category formation (Boersma,Escudero & Hayes 2003).
Optimality-Theoretic accounts of perception and its acquisition thus bridge the gapbetween phonological theory and the computational modelling of human speechprocessing.
ReferencesApoussidou, Diana and Paul Boersma 2003 The learnability of Latin stress. Proceedings of the
Institute of Phonetic Sciences Amsterdam 25: 101�148.Apoussidou, Diana and Paul Boersma 2004 Comparing two Optimality-Theoretic learning
algorithms for Latin stress. In Vineeta Chand, Ann Kelleher, Angelo J. Rodríguez and BenjaminSchmeiser (eds.), Proceedings of the 23rd West Coast Conference of Formal Linguistics, 29�42.Somerville, MA: Cascadilla.
Boersma, Paul 1997 How we learn variation, optionality, and probability. Proceedings of theInstitute of Phonetic Sciences Amsterdam 21: 43�58.
Boersma, Paul 1998 Functional Phonology. PhD dissertation, University of Amsterdam. TheHague: Holland Academic Graphics.
Boersma, Paul 1999 On the need for a separate perception grammar. Manuscript, University ofAmsterdam. [Rutgers Optimality Archive 358]
Boersma, Paul 2000 The OCP in the perception grammar. Manuscript, University of Amsterdam.[Rutgers Optimality Archive 435]
Boersma, Paul 2001 Phonology-semantics interaction in Optimality Theory, and its acquisition. InRobert Kirchner, Wolf Wikeley, & Joe Pater (eds.), Papers in Experimental and TheoreticalLinguistics, Volume 6, 24�35. Edmonton: University of Alberta.
Boersma, Paul 2005 Some listener-oriented accounts of hache aspiré in French. Rutgers OptimalityArchive 730. Revised version to appear in Lingua.
Boersma, Paul, Paola Escudero and Rachel Hayes 2003 Learning abstract phonological fromauditory phonetic categories: An integrated model for the acquisition of language-specific soundcategories. Proceedings of the 15th International Congress of Phonetic Sciences, 1013�1016.
Boersma, Paul and Bruce Hayes 2001 Empirical tests of the Gradual Learning Algorithm.Linguistic Inquiry 32: 45�86.
Bradlow, Ann 1995 A comparative study of English and Spanish vowels. Journal of the AcousticalSociety of America 97: 1916�1924.
Bradlow, Ann 1996 A perceptual comparison of the |i|-|e| and |u|-|o| contrasts in English and inSpanish: Universal and language-specific aspects. Phonetica 53: 55�85.
Broselow, Ellen 2003 Language contact phonology: richness of the stimulus, poverty of the base. InKeir Moulton and Matthew Wolf (eds.), NELS 34: Proceedings of the 34th Annual Meeting of theNorth-Eastern Linguistic Society. Amherst: Graduate Linguistic Student Association of theUniversity of Massachusetts.
Curtin, Suzanne, Toben H. Mintz and M.H. Christiansen 2005 Stress changes therepresentational landscape: Evidence from word segmentation. Cognition 96: 233�262.
Escudero, Paola 2005 The Attainment of Optimal Perception in Second-Language Acquisition. Ph.D.dissertation, University of Utrecht. Utrecht: Landelijke Onderzoeksschool Taalwetenschap.
�24�
Escudero, Paola and Paul Boersma 2002 The subset problem in L2 perceptual development: Multiple-category assimilation by Dutch learners of Spanish. In Barbora Skarabela, Sarah Fish and AnnaH.-J. Do (eds.), Proceedings of the 26th annual Boston University Conference on LanguageDevelopment, 208�219. Somerville, MA: Cascadilla.
Escudero, Paola and Paul Boersma 2003 Modelling the perceptual development of phonologicalcontrasts with Optimality Theory and the Gradual Learning Algorithm. In Sudha Arunachalam,Elsi Kaiser and Alexander Williams (eds.), Proceedings of the 25th Annual Penn LinguisticsColloquium. Penn Working Papers in Linguistics 8.1, 71�85.
Escudero, Paola and Paul Boersma 2004 Bridging the gap between L2 speech perception research andphonological theory. Studies in Second Language Acquisition 26: 551�585.
Escudero, Paola and Paul Boersma to appear Language modes and perceptual development inDutch learners of Spanish.
Gerrits, Ellen 2001 The categorisation of speech sounds by adults and children. PhD dissertation,University of Utrecht.
Hayes, Rachel 2001 An Optimality-Theoretic account of novel phonetic category formation insecond language learning. Manuscript, University of Arizona.
Helmholtz, H. von 1910 Handbuch der physiologischen Optik. Vol. 3. Hamburg: LeopoldVoss.
Jusczyk, Peter W., Anne Cutler and N.J. Redanz 1993 Infants� preference for the predominantstress patterns of English words. Child Development 64: 675�687.
Jusczyk, Peter W., Derek M. Houston and M. Newsome 1999 The beginnings of wordsegmentation in English-learning infants. Cognitive Psychology 39: 159-207.
Kenstowicz, Michael 2001 The role of perception in loanword phonology. Linguistique africaine20.
Koopmans-van Beinum, Florien J. 1980 Vowel contrast reduction. An acoustic and perceptual studyof Dutch vowels in various speech conditions. PhD dissertation, University of Amsterdam.
Legendre, Géraldine, Yoshiro Miyata, and Paul Smolensky 1990 Harmonic Grammar � a formalmulti-level connectionist theory of linguistic well-formedness: theoretical foundations.Proceedings of the Twelfth Annual Conference of the Cognitive Science Society, 884�891.Cambridge, MA: Erlbaum.
Liljencrants, Johan and Björn Lindblom 1972 Numerical simulation of vowel quality systems: therole of perceptual contrast. Language 48: 839�862.
Lindblom, Björn 1986 Phonetic universals in vowel systems. In John J. Ohala and Jeri J. Jaeger(eds.), Experimental Phonology, 13�44. Orlando: Academic Press.
McQueen, James M. and Anne Cutler 1997 Cognitive processes in speech perception. InWilliam J. Hardcastle and John Laver (eds.), The Handbook of Phonetic Sciences, 566�585.Oxford: Blackwell.
McQueen, James M. 2005 Speech perception. In K. Lamberts and R. Goldstone (eds.), TheHandbook of Cognition, 255�275. London: Sage Publications.
Massaro, Dominic William 1987 Speech Perception by Ear and Eye: A Paradigm forPsychological Inquiry. Hillsdale: Lawrence Erlbaum.
Pater, Joe 2004 Bridging the gap between perception and production with minimally violableconstraints. In René Kager, Joe Pater and Wim Zonneveld (eds.), Constraints in PhonologicalAcquisition, 219�244. Cambridge: Cambridge University Press.
Polka, Linda and Janet F. Werker 1994 Developmental changes in perception of non-native vowelcontrasts. Journal of Experimental Psychology: Human Perception and Performance 20: 421�435.
Polka, Linda, Megha Sundara and Stephanie Blue 2002 The role of language experience in wordsegmentation: A comparison of English, French, and bilingual infants. Paper presented at the143rd Meeting of the Acoustical Society of America: Special Session in Memory of Peter Jusczyk,Pittsburgh, Pennsylvania.
Pols, Louis C.W., H.R.C. Tromp and Reinier Plomp 1973 Frequency analysis of Dutch vowels from50 male speakers. Journal of the Acoustical Society of America 53: 1093�1101.
Rosenblatt, Frank 1962 Principles of Neurodynamics; Perceptrons and the Theory of BrainMechanisms. Washington: Spartan Books.
Smolensky, Paul 1996 On the comprehension/production dilemma in child language. LinguisticInquiry 27: 720�731.
Tesar, Bruce 1997 An iterative strategy for learning metrical stress in Optimality Theory. InElizabeth Hughes, Mary Hughes and Annabel Greenhill (eds.), Proceedings of the 21st AnnualBoston University Conference on Language Development, 615�626. Somerville, MA: Cascadilla.
Tesar, Bruce 1998 An iterative strategy for language learning. Lingua 104: 131�145.Tesar, Bruce and Paul Smolensky 2000 Learnability in Optimality Theory. Cambridge, MA: MIT
Press.
�25�
Werker, Janet F. and R.C. Tees 1984 Cross-language speech perception: evidence for perceptualreorganization during the first year of life. Infant Behavior and Development 7: 49�63.
Yip, Moira 2006 The symbiosis between perception and grammar in loanword phonology.Lingua 116: 950�975.
i We use pipes in order to distinguish underlying forms from phonological surfacestructures, which are given between /slashes/, and auditory phonetic forms, which aregiven in an approximate IPA transcription between [square brackets].ii Escudero (2005: 214�236) investigates and models (in Optimality Theory) thepossibility that category reuse is not an �easy� instantaneous act that occurs magically atthe start of L2 acquisition after all. Escudero proposes instead that category reusegradually emerges as an automatic result of an initial creation of lexical items withmultiple underlying phonological representations and a subsequent reduction of thislexical variability by the process of message-driven learning of recognition.iii Nor less similar. A theory of phonology that regards all vowels as a combination ofinnate (hence crosslinguistically identical) phonological feature values may evenconsider every vowel at the left in (1) as featurally identical to its counterpart at theright.iv We use slashes (�/�) for perceived phonological surface representations. We assumethat these representations consist of the same kinds of discrete arbitrary symbols aslexical representations, because the task of the perception process is to turn raw auditorydata into discrete representations that are maximally suited for lexical access. See (2) foran explicit model.v Deeper mechanisms than perceived similarity may play a role as well, such aschoosing categories that are peripheral in the L1, in order to improve production in sucha way that other listeners� comprehension improves. This may contribute to linking |a|Sto |!|D rather than to |"|D. Such a bias towards peripherality also follows automatically(i.e. without goal orientation) from Escudero�s (2005: 214�236) model of selectingunderlying representations (cf. fn. 2).vi In Optimality-Theoretic terms, having to map a perceived /k"s#/ to an underlying|k!s#| can be said to involve a faithfulness violation in the recognition grammar(Boersma 2001).vii Not included in this list are those who model comprehension as a single mapping inOptimality Theory, namely Smolensky (1996), Kenstowicz (2001), Broselow (2003),and Yip (2006), nor developments more recent than the present paper, such as Boersma(2005) and Escudero (2005).viii We have to point out that Smolensky (p.c.) does not consider perception and robustinterpretive parsing to be the same, because our auditory form is more peripheral andcontinuous than Tesar & Smolensky�s overt form, which has already been analysed intodiscrete syllables. However, we see no reason why the language-specific construction offeet should not be handled in parallel with more peripheral-looking processes like thelanguage-specific mapping from vowel duration to e.g. stress in Italian or to vowellength in Czech. Until there is evidence for prelexical sequential modularity, we willsubsume all these processes under the single umbrella of �perception�. The literature onthe perception of foot structure by infants (e.g. Jusczyk, Houston, and Newsome 1999;Polka, Sundara, and Blue 2002; Curtin, Mintz, and Christiansen 2005) usually talksabout �word segmentation�, but uses perceptual terminology like �cue weighting�.
�26�
ix A more sophisticated discretization of the F1 continuum, as used by Boersma (1997),would involve taking many more F1 values and allowing the learning algorithm tochange the ranking of some neighbouring constraints by a value that decreases with thedistance to the incoming F1. This would lead to results similar to those obtained by thesimplified discretization of the present paper.x Given a distribution where p(f, v) denotes the probability that a token drawn randomlyfrom the language environment has an F1 of f Hz and was intended as the vowel v (i.e.!f,v p(f, v) = 1), the fraction correct for a maximum-likelihood listener can be computedas !f maxv p(f, v), and the fraction correct for a probability-matching listener can becomputed as !f (!v p(f, v)2 / !v p(f, v)).xi Computationally inclined readers may wonder why one cannot successively eraselines and columns with identical symbols from Figure 10 until the figure is empty. Thisis because Figure 10 is based on repeated stochastic evaluations (§4.3), not on a fixedranking.xii We repeated the same simulations with OT�s predecessor Harmonic Grammar (HG;Legendre, Miyata, and Smolensky 1990), where the ranking values are additive weights.With the same type of evaluation noise that turns OT into Stochastic OT, our�Stochastic HG� learners end up with a good separation of the categories, scoring about78% correct, both for negatively and positively formulated cue constraints. Whether realhumans use OT with negative constraints or HG with negative or positive constraintscannot be assessed on the basis of our data or simulations. Biological reality may wellbe more complex than both OT and HG.


![SSC - prepadda.comprepadda.com/wp-content/uploads/english/ARTICLE IMPORTANT NOTES[].pdf Means to say ( ) Vowel Consonant Consonant Vowel Vowel = Vowel Consonant = Consonant ... I had](https://img.pdfslide.us/doc/110x75/5e4437036ae6ba6d743ded6b/ssc-prepaddacomprepaddacomwp-contentuploadsenglisharticle-important-notes.jpg)