Embed Size (px)
Citation preview

INTERNATIONAL ELECTRONIC JOURNAL OF MATHEMATICS EDUCATION e-ISSN: 1306-3030. 2019, Vol. 14, No. 1, 169-182
https://doi.org/10.29333/iejme/3985
Article History: Received 29 September 2018 Revised 5 October 2018 Accepted 8 October 2018 © 2019 by the authors; licensee Modestum Ltd., UK. Open Access terms of the Creative Commons Attribution 4.0 International License (http://creativecommons.org/licenses/by/4.0/) apply. The license permits unrestricted use, distribution, and reproduction in any medium, on the condition that users give exact credit to the original author(s) and the source, provide a link to the Creative Commons license, and indicate if they made any changes.
OPEN ACCESS
Learning to Make Sense of Fractions: Some Insights from the Malaysian Primary 4 Pupils
Liew-Kee Kor 1*, Sian-Hoon Teoh 2, Siti Syardia Erdina Binti Mohamed 2, Parmjit Singh 2
1 Universiti Teknologi MARA (UiTM), Kedah, MALAYSIA 2 Universiti Teknologi MARA (UiTM), Selangor, MALAYSIA * CORRESPONDENCE: [email protected]
ABSTRACT The teaching and learning fractions is one of the most problematic areas in primary school mathematics. A large number of studies have engaged paper-and-pencil test to measure students’ instrumental understanding about fractions but few have sought to learn about children’s fraction sense. This paper reports a study that investigated fraction sense possessed by the Malaysian primary pupils. A 16-item Fraction Sense Test (FST) was developed and administered to a group of 198 Primary 4 pupils to test their fraction sense in solving problems about fractions. From the FST result, six respondents were selected from the low ability, intermediate ability, and high ability group. These respondents underwent a series of clinical interviews. Results show that the low and intermediate achievers lack fraction sense. The high achievers demonstrated flexibility in visualizing and recognizing the representations of unfamiliar fractions. They developed mental referents for fractions. They noticed the number of parts and were aware that these parts must be equal when comparing fractions. They could visualize and perform operations mentally with larger value numerators and denominators. They have good sense of estimation and applied equivalence of fractions. These findings are useful to teachers who prepare teaching activities to enhance fraction sense. Keywords: fraction sense, fractions, primary mathematics, clinical interview
INTRODUCTION Fractions are complex, yet important concepts in mathematics. Fractions are heavily used in various
measurements and calculation (Van de Walle, Karp, & Bay-Williams, 2013) as well as providing the foundations on which algebraic thinking and proportional reasoning are built (Chinnappan, 2005; Clarke, Roche, & Mitchell, 2008; Wijaya, 2017). Over the years, the teaching of fractions continues to attract the attention of mathematics teachers and education researchers worldwide. However, teaching and learning fractions is still perceived as one of the most problematic areas in primary school mathematics (Charalambous & Pitta-Pantazi, 2007; Wijaya, 2017). Siegler, Fazio, Bailey, and Zhou (2013) assert that poor fraction knowledge at the elementary level predicts low mathematics achievement and algebra knowledge in high school. Likewise, Braithwaite, Pyke, and Siegler (2017) believe that failure to master fraction arithmetic hinders children in learning more advanced mathematics and hence hampers their occupational success. Bruce, Chang, Flynn and Yearley (2013) observe that a weak foundation in fractions can eventually cut students off from higher mathematics. There are also claims that learners’ struggle in fractions pervades from elementary through middle grades, high school, and college, with many learners never reaching proficiency in fraction arithmetic (Gabriel et al., 2013 as cited in Bentley & Bossé, 2018). Bentley and Bossé’s (2018) study

Kor et al.
170 http://www.iejme.com
has proven Gabriel et al.’s claim when they found evidences showing that college students committed mistakes in incorrectly applying fraction operations and they concluded that these students possess the same misunderstandings and misconceptions as elementary students. Yet, other researchers (for example, Behr, Harel, Post & Lesh, 1993) argue that ramifications in learning fractions pose obstacles to the mathematical maturation of children.
Despite its long-standing challenges inherent in teachers’ teaching strategies, studies on the teaching and learning of fractions showed students around the world have difficulties in learning about fractions. According to Fazio and Siegler (2011) the average student never gains a conceptual knowledge of fractions in many countries. Gabriel et al. (2013) acknowledge that fractions are amongst the most difficult mathematical topics in primary education. In particular in topic involving fraction operations, pupils seemed to apply procedures they do not fully understand. Moreover, Bentley and Bossé’s (2018) work shows that among some misconceptions commonly conceived by students such as fraction equivalence, common denominators, the algorithm, etc., fraction operations are most crucial to understanding of fractions. Interestingly, in a recent study by Siti Nurhani Abdul Ghani and Siti Mistima Maat’s (2018) study on misconceptions of fraction among Malaysian Year 4 pupils, they found that adding two fractions with different denominators is the mistake that was often committed by these pupils.
Many Malaysian students performed poorly in fractions (Abdul Halim Abdullah, Nur Liyana Zainal Abidin, & Marlina Ali, 2015). The evidence was manifested in the low mathematics achievement in the Third International Mathematics and Science Study (TIMSS), where the Malaysian Grade 8 students’ average percent correct in Number was 39 in TIMSS 2011 against the international average of 43, indicating the performance of our students on fractions was below international standards (Mullis, Martin, Foy, & Arora, 2012). Notably in the TIMSS Eighth Grade Mathematics, fractions are a topic in the number content domain and received 30 percent of the assessment emphasis. Meanwhile, in another international assessment of mathematics, the Programme for International Student Assessment (PISA) organized by the Organization for Economic Co-operation and Development (OECD), the average scores obtained by Malaysian students in Quantity in PISA 2012 were 409; the scores were below the overall OECD average of 495 (Abdul Halim Abdullah et al., 2015).
It is indeed worthwhile for teachers and educators to spend time and effort to help students to achieve a solid foundation in fractions in the elementary years in particular if this can ensure student success in later mathematics, career and life. In so doing, apart from exposing teachers to a variety of ways to improve initial fraction instruction for early elementary years, greater emphasis should also be given to children’s methods of visualizing and solving problems on fractions. To date, a large number of studies have engaged paper-and-pencil test to measure students’ instrumental understanding about fractions but few have sought to learn about children’s fraction sense. This paper reports a study that investigated in-depth pupils’ fraction sense in solving questions about fractions in particular questions about fraction “concept”, “representation”, and “operations”.
The Concept of Fraction
Kieren (1993), a prominent researcher in the domain of fractions was the first to suggest that fractions are built not on a single construct but on several interrelated sub-constructs. The works of Behr et al. (1993) and Lamon (1999) extended Kieren’s conceptualization and they have consequently identified a five sub-construct theoretical model of fractions. These sub-constructs are: part–whole, ratio, quotient, operator, and measure. This means that a particular fraction can represent five different meanings depending on the context. For instance, the fraction 2/3 can be conceived as a part of a whole (two out of three equal parts), as a quotient (two divided by three), an operator (two-third of a quantity), a ratio (two parts to three parts), and finally as measure (as a point on a number line) (Pantziara & Philippou, 2012).
It is well documented that one of the main factors contributing to the complexity of learning fractions is the multifaceted notion encompassing five interrelated sub-constructs (i.e., part-whole, ratio, operator, quotient, and measure). Kilpatrick, Swafford and Findell (2001) noted that much of the confusion with fractions is associated with different interpretations (constructs), representations (models), and coding conventions.
There are debates on the factors that led to students’ difficulty in understanding fractions. Wittmann (2013) argues that most of students’ errors involving operations with fractions are due to the inconsistency in the teaching methods. In this aspect, Lazića, Abramovichb, Mrđaa, and Romano (2017) studied the

INT ELECT J MATH ED
http://www.iejme.com 171
methodological approach of introducing fractions through propaedeutic learning and examined the effects of such approach in terms of student achievement in elementary mathematics education. They found that students achieve significantly better results in the propaedeutic learning approach when compared to students who have not used this method.
What is Fraction Sense?
Mcintosh, Reys and Reys (1992, p.3) defined number sense as
a person’s general understanding of number and operations along with the ability and inclination to use this understanding in flexible ways to make mathematical judgements and to develop useful strategies for handling numbers and operations.
Fractions are numbers and like common sense, fraction sense is an abstract concept. The definition of fraction sense comes in several versions. McNamara and Shaughnessy (2015) contended that fraction sense is an essential component to students’ success with fraction operations. They describe fraction sense as
a deep and flexible understanding of fractions that is not dependent on any one context or type of problem… Students with fraction sense can reason about fractions and don’t apply rules and procedures blindly; nor do they give nonsensical answers to problems involving fractions (p. xvii).
According to Carpenter, Fennema and Romberg (1993), a person who possesses fraction sense understands both numerator and denominator and the quantities they represent separately, and together they represent a single entity. In addition, Way (2011) refers fraction sense to a collection of connected fundamental concepts about fractions. It involves a variety of ways in which fractions can be represented. She explicates fraction sense in three aspects: (1) flexibility with visual representations of fractions, (2) a sense of the quantities represented by fractions, and (3) reasoning about relationships between the numbers. In short, fraction sense can be seen as a bigger set that embraces fraction concepts and cognitive skills such as visualization and, logical reasoning.
Taking into consideration McIntosh et al.’s number sense and the aforementioned definitions of fraction sense, the present study conceptualized fraction sense to encompass four fundamental components: (1) concepts - know that in fraction both numerator and denominator represent a single entity; (2) visualization - flexible with fraction representations; (3) strategy - apply useful tactics in solving fractions operations; and (4) rationalization - estimate and reason logically about fractions.
The Malaysian School Setting
In 2011, there was a major curriculum reform in Malaysian primary schools. The Primary School Standard Curriculum or more commonly known in the Malay Language as Kurikulum Standard Sekolah Rendah (KSSR) was implemented. KSSR has four Rs indicating Reading, wRiting, aRithmatic and Reasoning. The emphasis on teaching and learning in mathematics in particular, is on mastery of knowledge and understanding. Ideally, the move was intended to enable students to apply what they learned in concepts, principles, and process of mathematics (Tan, Zaleha Ismail, & Mardhiyana Abidin, 2018).
The mathematics topics in KSSR are: Numbers and Operations; Measurements and Geometry; Relationship and Algebra; Statistics and Probability. “Fractions” is a subtopic in Numbers and Operations. In Primary Year 4 (10-year-old), pupils learn about concept, comparing/ordering, equivalence, addition, subtraction, multiplication, division and problem solving in fractions.
METHODOLOGY
Population and Sample of the Study
The present study is part of a larger study that engaged 396 Year 4 and Year 5 pupils from five different National Primary Schools in a district at the central of Peninsular Malaysia. The rationale for using primary school students is based on Kass and Maddux’s (2005) developmental theory of learning, which suggests that students develop the ability to visualize abstract information and internalize concepts between the ages of 8 to 11. Consequently, Year 4 pupils are capable of presenting fraction sense problems by translating the linguistic information and developing schematic visuals of the problems.

Kor et al.
172 http://www.iejme.com
In this study, six respondents (10-year-old) were selected from 198 Year 4 pupils to participate in the clinical interview based on the achievement scores in the Fraction Sense Test (FST). The cutoff marks for each level were: low (below 40), intermediate (40-79); and high (80 and above). The percentage distribution of the three ability groups from the total sample (n = 396) was 51.5, 47.2, and 1.3 respectively. Table 1 displays the demographic profile of the six respondents.
Clinical Interview as a Research Tool
The structure of clinical interview allows teachers to gain insight into the mathematical thinking of a child (Ginsburg, Jacobs, & Lopez, 1998) in a more in-depth way (Ginsburg, 1997). In this regard, the purpose of clinical interview is not to point out right or wrong answers or to teach the interviewee something, but it works to elicit and expose the thinking of the interviewee to the interviewer (Ginsburg et al., 1998).
The interviews in this study focused on the Number domain in the mathematical content. The aim was to explicate the 10-year-old children’s fraction sense and the nature of their thought. Gould (2011) states that asking the right question is pivotal to finding out what students think. He added that researchers can gain greater insights into students’ current understanding of fractions if students are required to explain their reasoning when comparing the size of fractions. In this study, respondents’ thinking was discussed in accordance to the four components stated in the definition of fraction sense.
The Test
A newly developed instrument called the Fraction Sense Test (FST) was adapted from the original “Number Sense Test” developed by McIntosh et al. (1992) to test respondents’ fraction sense in general. The instrument consisted of 16 multiple choice questions: seven items focus on understanding and use of the meaning and size of fractions (Fraction Concept), four items on understanding and use of equivalent forms and representations of fractions (Fraction Representation), and five items on understanding the meaning and effect of operations (Effect of Operation). Results from the pilot study indicate a significant correlation (r= 0.914, p < .05) from the test-retest reliability for FST. Table 2 shows some of the FST items.
Table 1. Demographic Profile of the Respondents Respondent Gender FST scores (Total = 100%) Level of abilities (based on FST scores)
R1 Male 12.5 Low ( <40) R2 Female 12.5 Low (<40) R3 Male 50 Intermediate (40-79) R4 Female 56 Intermediate (40-79) R5 Male 87.5 High (≥80) R6 Female 87.5 High (≥80)

INT ELECT J MATH ED
http://www.iejme.com 173
The Setting
Prior to the clinical interview, all Year 4 pupils sat for the FST. The test was scored and pupils were divided into low achievers, intermediate achievers, and high achievers according to the achievement scores (see Table 1). From the test, three test items scored the lowest percent correct were chosen for clinical interview. Table 3 displays the three chosen items for the interview. This study employed qualitative approach to collect data for fraction sense. In the clinical interview, the think-aloud method was applied to prompt respondents to verbalize their thinking in providing reason to explain their responses (Patton, 2002).
Table 2. Some Examples of Test Items in FST Component Item Concept 4. Find the difference between the shaded areas of R and S.
R S
A. Slightly less than 45 C. Slightly less than 1
4
B. A lot more than 34 D. A lot more than 1
2
7. Choose which of the following is best to represent a fraction between 1 and 2. A. 5
7 C. 1
3
B. 53 D. 19
9
Representation 8. Estimate the possible answer for x + y.
+ A. 1
2 C. 1 1
4
B. 34 D. 1 3
4
10.Choose a fraction that represents the number of shaded circles from the whole diagram. A. 1
2 B. 2
6 C. 4
6 D. 4
2
Operation 16. Without using calculation, which total is more than 1?
A. 25 + 3
7 C. 3
8 + 2
11
B. 4
5 + 1
2 D. 1
2 + 2
9
0 1 y 0 x 1
Kor et al.
174 http://www.iejme.com
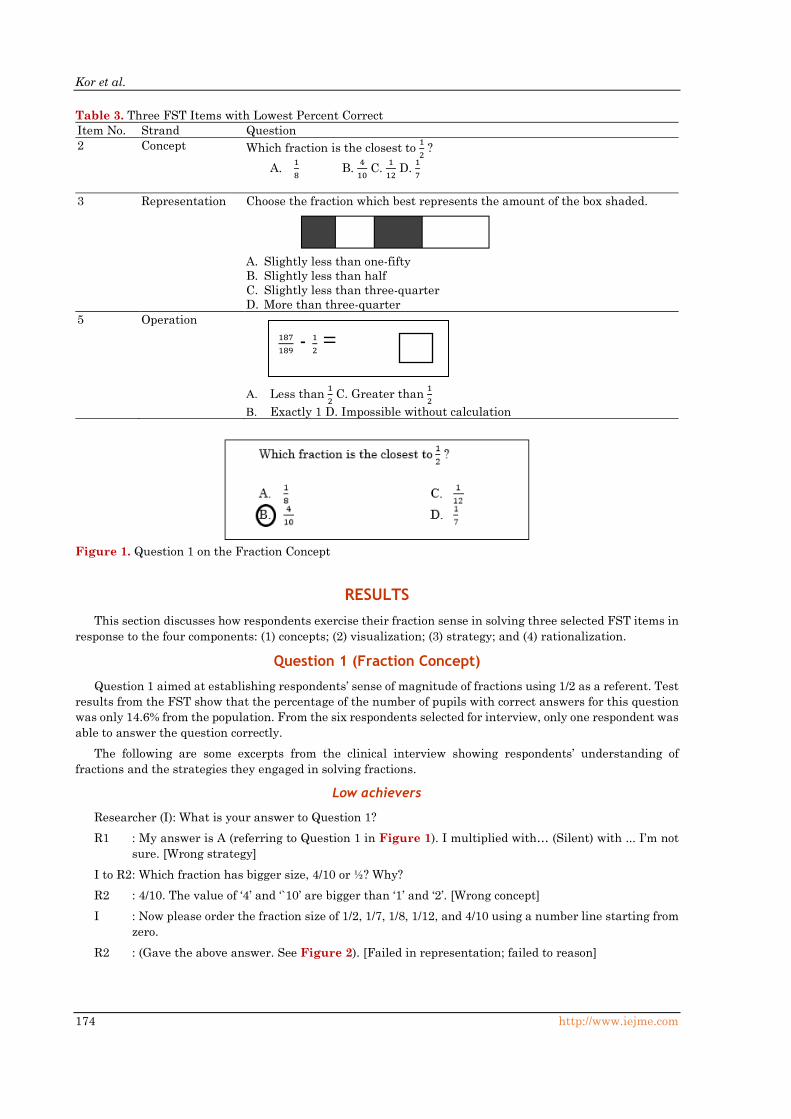
RESULTS This section discusses how respondents exercise their fraction sense in solving three selected FST items in
response to the four components: (1) concepts; (2) visualization; (3) strategy; and (4) rationalization.
Question 1 (Fraction Concept)
Question 1 aimed at establishing respondents’ sense of magnitude of fractions using 1/2 as a referent. Test results from the FST show that the percentage of the number of pupils with correct answers for this question was only 14.6% from the population. From the six respondents selected for interview, only one respondent was able to answer the question correctly.
The following are some excerpts from the clinical interview showing respondents’ understanding of fractions and the strategies they engaged in solving fractions.
Low achievers
Researcher (I): What is your answer to Question 1? R1 : My answer is A (referring to Question 1 in Figure 1). I multiplied with… (Silent) with ... I’m not
sure. [Wrong strategy] I to R2 : Which fraction has bigger size, 4/10 or ½? Why? R2 : 4/10. The value of ‘4’ and ‘`10’ are bigger than ‘1’ and ‘2’. [Wrong concept] I : Now please order the fraction size of 1/2, 1/7, 1/8, 1/12, and 4/10 using a number line starting from
zero. R2 : (Gave the above answer. See Figure 2). [Failed in representation; failed to reason]
Table 3. Three FST Items with Lowest Percent Correct Item No. Strand Question 2 Concept Which fraction is the closest to 1
2 ?
A. 18 B. 4
10 C. 1
12 D. 1
7
3 Representation Choose the fraction which best represents the amount of the box shaded.
A. Slightly less than one-fifty B. Slightly less than half C. Slightly less than three-quarter D. More than three-quarter
5 Operation A. Less than 1
2 C. Greater than 1
2
B. Exactly 1 D. Impossible without calculation
Figure 1. Question 1 on the Fraction Concept
187189
- 12 =

INT ELECT J MATH ED
http://www.iejme.com 175
I : Now show me ½ and 4/10 in two separate diagrams. R2 : (Gave the following answer. See Figure 3). [Failed in concept and representation; failed to reason] Remark: R2 understands the concept of unit fraction but was unable to use the same understanding with
non-unit fractions. R2 only notice the number of parts, without realizing the parts must be equal.
Intermediate achievers
R3 : I think the answer is D because all the other fractions are bigger than one-half. [Failed to understand fraction concept]
R4 : I don’t know the answer. I assumed the answer is D. [Wild guess] I to R3 : Now which fraction has bigger size, 6/8 or 5/6? R3 : Hmm… I think 6/8. [Failed to understand fraction concept; failed to visualize] I : Can you justify your answer? R3 : (long pause) I’m not sure. I feel like ‘6 and 8’ are bigger than ‘5 and 6’. [Wrong concept; failed to
visualize; failed to justify; incorrect strategy] I : Alright, then how about 5/10 and 8/20? R3 : I think 8/20. [Failed to estimate; incorrect strategy]
High achievers
R6 : I think the answer is B. Because if I change 4/10 to 5/10, the answer will be 1/2. So I think B is the closest answer. [Useful strategy; good visualization and estimation]
I : How do you know 5/10 is equal to 1/2? R6 : Because 5 divided by 5 is equal to 1, and 10 divided by 5 is equal to 2. [Understand the concept] I : Do you mean equivalent fraction? R6 : Yes. I forgot the term.
Question 2 (Multiple Representations)
Question 2 (see Figure 4) investigates respondents’ ability to translate the diagrammatic representation of a fraction and to gauge their abilities in estimating or identifying the size of fractions. Only 38.15% of the population managed to give the correct answer to this item. Furthermore, only two out of the selected six respondents who are high achievers were able to answer the question correctly.
Figure 2. R2’s Order of Fractions on a Number Line
Figure 3. R2’s Circles Representation of One-Half and Four-Tenths

Kor et al.
176 http://www.iejme.com
Low achievers
I : What is your answer and how do you get the answer? R2 : My answer is A. [Wrong answer] I : Why did you choose A? R2 : Oh, no. I meant B. [No knowledge of fraction concept] I : Okay, B. What’s your reason for this? R2 : Because… Err… I don’t know. [Failed to visualize; failed to reason] I : Did you just guess the answer? R2 : (Nodded) [No strategy]
Intermediate achievers
R3 and R4 had admitted that they did not know the appropriate method to solve the fraction problems in the item and took a wild guess with the answers provided.
High achievers
I : How did you get B as your answer? R6 : Err… I just imagine. [Visualization] I : Tell me how? R6 : I think, if the shaded areas are placed next to each other, it will be easier to see how big the overall
shaded area is. So I drag this box (pointing at the bigger shaded area) to here (pointing at the gap between the two shaded areas). [Indicate strategy]
I : So what is your answer? R6 : I think the answer is slightly less than a half. [Justify] R5 who also provided the correct answer proposed a quite similar strategy which is visualizing the size of
the total shaded area. I : What is your answer? R5 : My answer is B. I : How do you solve that? R5 : I tried to divide the bar into six parts. From there I imagine the size of the shaded region. I think
the region only takes about half of the whole diagram. So, I’m quite sure the answer is B. [Strategy and justify the answer]
I : Why did you choose six parts? Why not five or three? R5 : (silence) I : Never mind, can you draw for me so that I can understand more? R5 sketched the ‘imaginative’ fraction onto a paper and then drew the actual image on the question paper.
The ‘imaginative’ fraction is displayed in Figure 5.
Figure 4. Question 2 Adopted from FST Item 3

INT ELECT J MATH ED
http://www.iejme.com 177
Remark: Based on Figure 5, it is clear that R5 was able to provide an alternative strategy to determine the size of the fraction. Firstly, the middle point of the bar was identified and marked as the midpoint. Based on the midpoint, the bar was divided into six equally partitioned parts which were then marked at every equal interval. The number of shaded boxes was then determined. R5 visualized using the knowledge of part-in-whole that “three boxes out of six have been shaded which is also equals to half of the whole diagram”. Consequently, the option B which is closest to the answer was selected.
Question 3 (Effect of Operation)
Question 3 presented in Figure 6 investigates respondents’ abilities to understand the effects of subtraction involving two fractions and the size of fractions.
Only 23.2% of the population managed to provide the correct answer. In the interview R5 was the only one who was able to obtain the answer accurately.
Low achievers
R1 : This is difficult. The fraction is too big. I can’t answer it without calculating. [Failed to conceptualize fraction size; failed to visualize; failed to estimate]
R2 : Hmm… I can’t solve this. I think I need to make some calculations. [Failed to visualize; failed to estimate]
Intermediate achievers
R4 : I’m not sure. I think I have to calculate. [Failed to visualize; failed to estimate] I : Why do you need to calculate? R4 : Because…. the fraction is too big. [Failed to conceptualize fraction size; failed to visualize; failed
to justify] R1, R2 and R4 believed that written calculation is the only method they could use to solve Question 3. The
interviewer then asked R1 to solve a simpler subtraction in fraction 4/5 – 1/2. Below is R1’s approach to solve the problem (see Figure 7).
Figure 5. R5’s Tactics in Answering Question 2
Figure 6. Question 3 Adopted from FST Item 5

Kor et al.
178 http://www.iejme.com
Similarly, R4 were asked to solve Item 2 again by referring to R1’s approach. Below is R4’s attempt without success due to carelessness which R4 discovered later after rechecking the solution steps (see Figure 8).
R4 amended the calculation and eventually provided the correct answer to Question 3 which is 185/378. I : Now, what is your answer to Question 3? R4 : (Long silence). I think it’s C (greater than half). [Failed to visualize; failed to estimate] I : Can you explain your answer? R4 : Because this fraction is big, so it has to be greater. [Failed to conceptualize fraction size; failed to
visualize; failed to justify] Remark: R1 and R2 were unable to solve the question correctly. R3 and R4 were able to solve the problems
but were unable to visualize the actual size of the fraction.
High achievers
R5 : My answer is A. Remark: R5 was the only one who answered correctly using logic sense. R5 was capable of providing
rationalization for every option to the answer. R6 had provided good fraction sense in explaining answer for similar question with smaller fraction.
DISCUSSION The summary of the findings is displayed in Table 4. The results are calibrated according to the knowledge
possessed by the three groups of respondents (Low/Intermediate/High) in the four components of the fraction sense.
In Table 4, it is clear that the low (L) and intermediate (I) ability groups lack fraction sense in answering questions about fraction concept (Question 1) and representation (Question 2).
Figure 7. R1’s Written Calculation
Figure 8. R4’s Written Calculation

INT ELECT J MATH ED
http://www.iejme.com 179
Fractions sense as numbers are supported by several concepts. Among these concepts is the development of strategies for comparing the size of fractions (Way, 2013). Question 1 provides a basis for developing a sense of magnitude of fractions using 1/2 as a referent. It was found that the low and intermediate respondents managed to perform the task correctly for unit fractions but were unable to obtain the right answer for non-unit fractions. When comparing two fractions, they exhibited lack of fraction sense in thinking that a fraction simply indicates the number of parts into which a whole has been divided, and that it does not matter if the parts are unequal in size. Such misconception was observed when they were asked to draw fractions using area diagrams (e.g. in Figure 3). Gould (2011) argues that such phenomenon indicates that these respondents were not aware of the need to have equal wholes to compare fraction quantities.
The higher achievers showed that they have mastered all the four components of fraction sense. They were able to apply estimation and mental calculation in solving fractions problems. These respondents mentally simplified fractions by dividing the numerator and the denominator with the same number. Such ability is in tandem with Anghileri (2000) belief that skills such as estimation, good prediction and mental computation are essential in fraction sense.
Question 2 is prone more to strategy testing. Respondents must develop a good understanding of the strategies, for instance, modeling fractions using a range of representations such as area diagrams for working with fractions in this question. Again the low and intermediate achievers used wild guesses to get the answer and they have failed to show sign any fraction sense. Such observation supported Way’s (2013) contention that students with insufficient fraction sense are not able to visualize the part-whole problem. Only the high achievers had demonstrated fraction sense strategies to solve Question 2 correctly.
Question 3 was designed to estimate fractions using benchmark numbers to decide if a fraction is closest to 0, ½ or 1. This study shows that large fraction figures pose obstacles and impede respondents’ abilities to visualize the actual size of the fractions. The low achievers did not possess any fraction sense in solving this question. The intermediate achievers managed to answer correctly using pencil and paper calculation but were not able to estimate the answer (see Figure 8). This group was given a “partial knowledge” in concept and strategy because the respondents could solve similar task with simpler fractions but has difficulty using the same method to solve large fraction numbers. Notably, all except one respondent (R5) perceived that it was not possible to solve fraction problems involving large numerators and denominators without using written calculations. This finding is consistent with Liu, Xin and Li’s (2012) work that children believe that when the numerator or denominator is larger, the value of the fraction also becomes larger.
Above all, only the high performing respondents demonstrated strong abilities in understanding fraction concepts, visualizing, applying tactics of solving the problem, and exercising good estimation in solving all three questions. This group possesses fraction sense that enables them the solve fraction problems successfully. They have shown their ability to adapt new strategy when the task changes. Their problem solving abilities support Way’s (2011) allegation that fraction sense is not associated with procedural understanding but it is building conceptual understanding of fractions that forms a basis for developing appropriate strategies in mathematical tasks.
Table 4. Summary of Findings Four components of fraction sense
Question Ability group Concept Visualization Strategy Rationalization 1 L x x x x I x x x x H √ √ √ √
2 L x x x x I x x x x H √ √ √ √
3 L x x x x I x x H √ √ √ √
Note. L: Low; I: Intermediate; H: High (√): possess full knowledge ;( ): partial knowledge; (x): no knowledge (wild guess)

Kor et al.
180 http://www.iejme.com
CONCLUSION The present study was to explicate 10-year-old’s fraction sense when solving problem related to fraction
concept, representation, and operation. A qualitative approach using clinical interview was employed to extricate in-depth thinking of the pupils. Results show that the low and intermediate achievers in fraction sense did not possess the basic concepts nor the processes required in the learning of fractions. They were weak in concept, visualization, strategy, and rationalization of fractions. They applied the rules blindly most of the times when encountered with unfamiliar fractions and show a lack of understanding of how and why a procedure works. They gave a wild guess to get the answer and explain their answers with faulty reasoning. Such occurrence matches Way’s (2013) description that student who lack in fraction sense often struggle with fractions, or relies on memorized procedures without understanding how they work. It supports Woodward’s (1998) finding that students would abandon the understandings they had established for fractions when confronted with situations that were unfamiliar.
Those with high scores in fraction sense in this study were observed to possess all the necessary skills to solve fractions problems. They understand that a fraction is a number. Also, they demonstrate the flexibility in visualizing and recognizing the representations of commonly encountered fractions (Way, 2013). Seemingly fraction sense has enabled this group of pupils to solve various fraction problems with more sophisticated concepts and processes, such as equivalence and the operations of larger value fractions. Likewise, fraction sense has also provided a basis for this group to develop appropriate strategies and tactics in finding solutions to solving unfamiliar fractions.
So what have we learned from the Malaysian Primary 4 pupils with fraction sense? Firstly, we learned that the respondents could consistently apply the estimation and equivalence of fraction, for example, they changed 4/10 to 5/10 to get 1/2, they estimated that 88/89 is almost 1 or they justified that 187/189 is close to 189/189 which is one. They could justify the option to the correct answer logically, for example one of the respondents debated, “…all of the other options do not make sense...The answer for C also seems illogical. If a half has been subtracted, there is no way the answer could be more than a half” (R5). But those lack fraction sense continued to struggle with fraction that is too big for them to handle as informed by Woodward (1998) that students succumbed to disorientation from their understanding of fractions when working with notations not easily compared to benchmarks.
Secondly, respondents with high fraction sense could visualize the size of the total shaded area. They could transfer the imaginative image to the area diagram to check the answer. They were able to apply alternative strategies such as dividing into equal partitions, using paper folding technique and knowledge of part-whole to determine the size of the fraction. In contrast, those with insufficient fraction sense were unable to solve non-unit fractions. They were not aware that all parts must be equal when comparing fractions. They lack sense of estimation and relied heavily on written calculations to solve unfamiliar fractions.
Last but not least, we concur with Way’s (2013) statement that fraction sense thrives with experience and familiarity whereby the process of acquisition is longitudinal rather than through explicit teaching of procedures or rules. As such the above findings are useful for teachers who prepare teaching activities to enhance fraction sense. Researchers in the future may enlarge the scope of study and increase the number of the questions to gain more insights into children’s fraction sense.
Disclosure statement No potential conflict of interest was reported by the authors.
Notes on contributors Liew-Kee Kor – Universiti Teknologi MARA (UiTM), Kedah, Malaysia. Sian-Hoon Teoh – Universiti Teknologi MARA (UiTM), Selangor, Malaysia. Siti Syardia Erdina Binti Mohamed – Universiti Teknologi MARA (UiTM), Selangor, Malaysia. Parmjit Singh – Universiti Teknologi MARA (UiTM), Selangor, Malaysia.

INT ELECT J MATH ED
http://www.iejme.com 181
REFERENCES Abdul Ghani SN, & Maat SM (2018). Misconception of fraction among middle grade Year Four pupils at
primary school. Research on Education and Psychology (REP), 2(1), 111-125. Retrieved from http://journalrep.com
Abdul Halim Abdullah, Nur Liyana Zainal Abidin, & Marlina Ali. (2015). Analysis of students’ errors in solving higher order thinking skills (HOTS): Problems for the topic of fraction. Asian Social Science, 11(21), 133-142. https://doi.org/10.5539/ass.v11n21p133
Anghileri, J. (2000) Teaching number sense. London: Continuum. Behr, M., Harel, G., Post, T., & Lesh, R. (1993). Rational Numbers: Toward a Semantic Analysis - Emphasis
on the Operator Construct. In T. Carpenter, E. Fennema & T. Romberg (Eds.), Rational Numbers: An Integration of Research (pp. 13-47). Hillsdale, NJ: Lawrence Erlbaum Associates.
Bentley, B., & Bossé, M. J. (2018). College students’ understanding of fraction operations. International Electronic Journal of Mathematics Education, 13(3), 233-247. https://doi.org/10.12973/iejme/3881
Braithwaite, D. W., Pyke, A. A., & Siegler, R. S. (2017). A computational model of fraction arithmetic. Psychological Review, 124(5), 603-625. https://doi.org/10.1037/rev0000072
Bruce, C., Chang, D., Flynn, T., & Yearley, S. (2013). Foundations to learning and teaching fractions: Addition and subtraction. Curriculum and Assessment Branch: Ontario Ministry of Education. Retrieved from http://www.edugains.ca/resourcesDP/Resources/PlanningSupports/FINALFoundationstoLearningandTeachingFractions.pdf
Carpenter, T. P., Fennema, E., Romberg, T. A. (1993) Toward a unified discipline of scientific inquiry. In T.P. Carpenter, E. Fennema and T.A. Romberg (Eds.), Rational Numbers: An Integration of Research (pp. 1–11). New Jersey: Lawrence Erlbaum Associates.
Charalambous, C. Y., & Pitta-Pantazi, D. (2007). Drawing on a theoretical model to study students’ understandings of fractions. Educational Studies in Mathematics, 64, 293-316 https://doi.org/10.1007/s10649-006-9036-2
Chinnappan, M. (2005). Children’s mappings of part-whole construct of fractions. In P. Clarkson & A. Downtown (Eds.), Conference of the Mathematics Education Research Group of Australasia (pp. 241-248). Sydney: MERGA.
Clarke, D., Roche, A., & Mitchell, A. (2008). Practical tips for making fractions come alive and make sense. Mathematics Teaching in the Middle School, 13(7), 372-379.
Fazio, L., & Siegler, R. (2011). Teaching fractions. Retrieved from http://unesdoc.unesco.org/images/0021/ 002127/212781e.pdf
Gabriel, F., Coché, F., Szucs, D., Carette, V., Rey, B., & Content, A. (2013). A componential view of children’s difficulties in learning fractions. Frontiers in Psychology, 4, 715. https://doi.org/10.3389/fpsyg.2013. 00715
Ginsburg, H. P. (1997). Entering the child’s mind: The clinical interview in psychological research and practice. New York: Cambridge University Press. https://doi.org/10.1017/CBO9780511527777
Ginsburg, H. P., Jacobs, S. F., & Lopez, L. S. (1998). The teacher’s guide to flexible interviewing in the classroom: Learning what children know about math. Boston: Allyn and Bacon.
Gould, P. (2011). Developing an understanding of the size of fractions. In J., Way, & J., Bobis (Eds.), Fractions: Teaching for understanding (pp.63–70). Adelaide: The Australian Association of Mathematics Teachers (AAMT). Retrieved from https://www.aamt.edu.au/content/download/19931/273047/file/tdt_F_gould1. pdf
Kass, C. E., & Maddux, C. D. (2005). A human development view of learning disabilities: From theory to practice (2nd ed.). Springfield, IL, US: Charles C Thomas Publisher.
Kieren, T. E. (1993). Rational and fractional numbers: From quotient fields to recursive understanding. In T. P. Carpenter, E. Fennema & T. A. Romberg (Eds.), Rational numbers: An integration of research (pp. 49-84). Hillsdale, NJ: Lawrence Erlbaum.
Kilpatrick, J., Swafford, J., & Findell, B. (2001). Adding it up: Helping children learn mathematics. Washington, DC: National Academy Press.
Lamon, J. (1999). Teaching fractions and ratios for understanding: Essential content and instructional strategies for children. Nova Jersey: Lawrence Erlbaum.

Kor et al.
182 http://www.iejme.com
Lazića, B., Abramovichb, S., Mrđaa, M., & Romano, D. A. (2017). On the teaching and learning of fractions through a conceptual generalization approach. International Electronic Journal of Mathematics Education, Vol.12, No. 8, 749-767.
Liu, C., Xin, Z., & Li, X. (2012). The development of Chinese students’ understanding of the concept of fractions from fifth to eighth grade. Journal of Mathematics Education, 5(1), 45-62.
McIntosh, A., Reys, B. J., & Reys, R. E. (1992). A proposed framework for examining basic number sense. For the Learning of Mathematics, 12, 2-8.
McNamara, J., & Shaughnessy, M. M. (2015) (2nd ed.). Beyond pizzas & pies, Grades 3-5: 10 Essential Strategies for Supporting Fraction Sense. CA: Math Solutions
Mullis, I.V.S., Martin, M.O., Foy, P., & Arora, A. (2012). TIMSS 2011 International Results in Mathematics. Chestnut Hill, MA: TIMSS & PIRLS International Study Center, Boston College.
Pantziara, M., & Philippou, G. (2012). Levels of students’ “conception” of fractions. Educational Studies in Mathematics, 79(1), 61-83. https://doi.org/10.1007/s10649-011-9338-x
Patton, M. Q. (2002). Qualitative interviewing. Qualitative Research and Evaluation Methods, 3, 344-347. Siegler, R. S., Fazio, L. K., Bailey, D. H., & Zhou, X. (2013). Fractions: The new frontier for theories of
numerical development. Trends in Cognitive Science, 17, 13–19. https://doi.org/10.1016/j.tics.2012. 11.004
Tan, K. J., Ismail Z, & Abidin M (2018). A comparative analysis on cognitive domain for the Malaysian primary four textbook series. EURASIA Journal of Mathematics, Science and Technology Education, 14(4), 1273-1286. https://doi.org/10.29333/ejmste/82625
Van de Walle, J. A., Karp, K. S., & Bay-Williams, J. M. (2013). Elementary and middle school mathematics: Teaching developmentally (8th ed.). Upper Saddle River, NJ: Pearson.
Way, J. (2011). Developing number sense using learning objects. In J., Way, & J., Bobis (Eds.), Fractions: Teaching for understanding (pp.153–166). Adelaide: The Australian Association of Mathematics Teachers (AAMT) Inc.
Way, J. (2013). AAMT - Top Drawer Teachers resource: Fractions. Retrieved from https://topdrawer.aamt.edu. au/Fractions/Good-teaching/Fraction-sense/Fractions-as-numbers
Wijaya, A. (2017). The relationships between Indonesian fourth graders’ difficulties in fractions and the opportunity to learn fractions: A snapshot of TIMSS results. International Journal of Instruction, 10(4), 221-236. https://doi.org/10.12973/iji.2017.10413a
Wittmann, G. (2013). The consistency of students’ error patterns in solving computationalproblems with fractions. In B. Ubuz, C. Haser & M. A. Mariotti (Eds.), Proceedings of the 8th Congress of the European Society for Research in Mathematics Education (pp.393–402). Antalya.
Woodward, T. L. (1998). An exploration of grade 8 students’ fraction sense. Thesis submitted in partial fulfillment of the requirements for the degree of Master of Arts in the Faculty of Education, Simon Fraser University. Retrieved from https://www.collectionscanada.gc.ca/obj/s4/f2/dsk2/ftp01/ MQ37668.pdf
Zazkis, R., & Hazzan, O. (1999). Interviewing in Mathematics Education Research: Choosing the Questions. Journal of Mathematical Behavior, 17(4), 429-439. https://doi.org/10.1016/S0732-3123(99)00006-1
http://www.iejme.com