Embed Size (px)
Citation preview
1
Cornell Notes
Learning Target:
I can create and use frequency tables for
categorical data. (Standard S.ID.5)
Name:
Class: Coord. Algebra
Period:
Date: January 27, 2015
Questions Notes
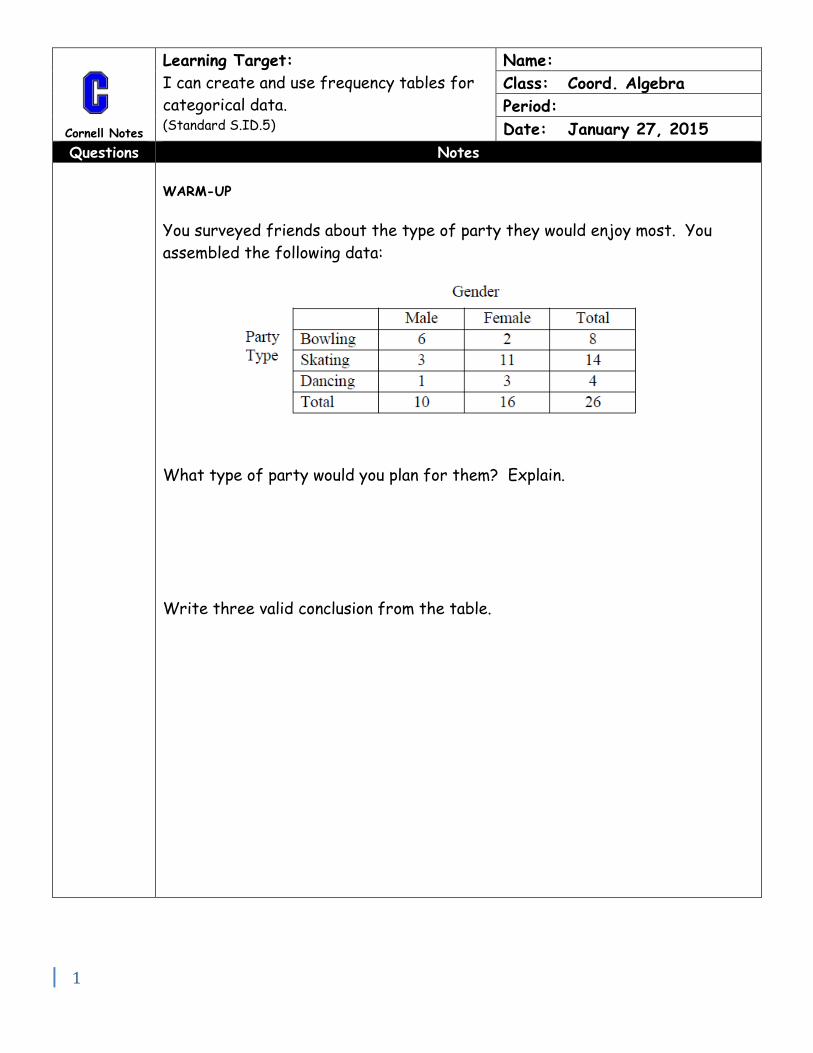
WARM-UP
You surveyed friends about the type of party they would enjoy most. You
assembled the following data:
What type of party would you plan for them? Explain.
Write three valid conclusion from the table.
2
Cornell
Notes
Learning Target:
I can create and use frequency tables for
categorical data. (Standard S.ID.5)
Name:
Class: Coord. Algebra
Period:
Date: January 27, 2015
Notes
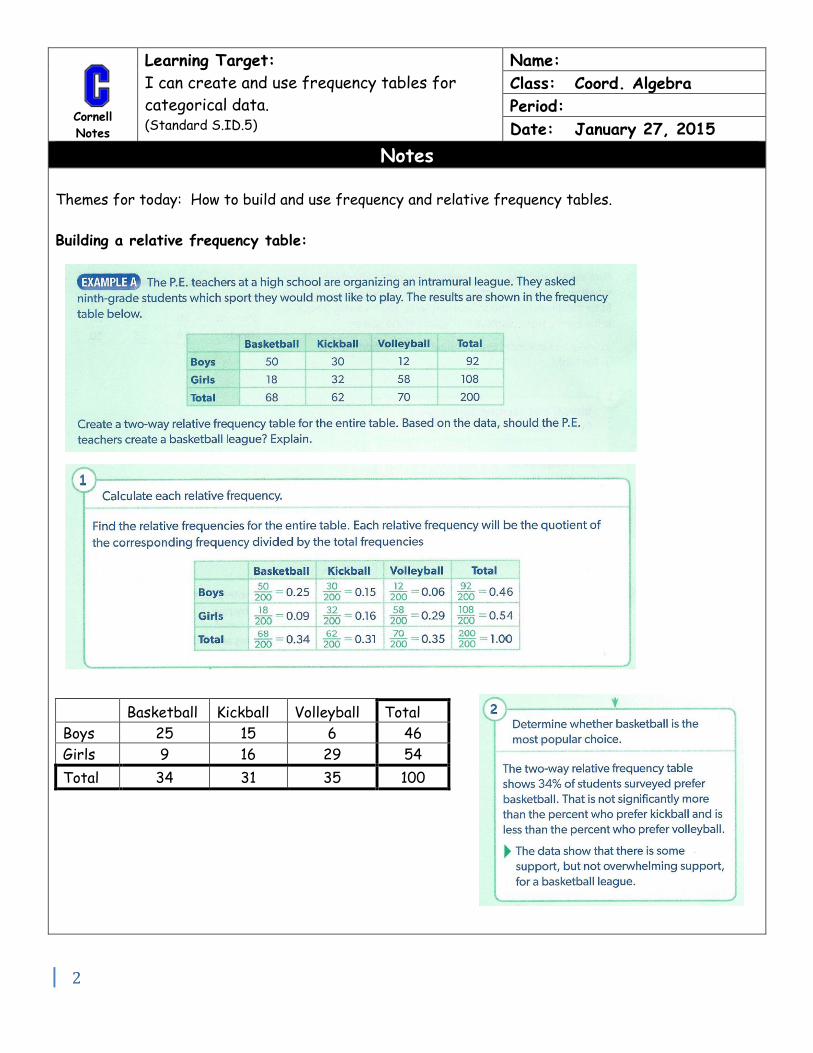
Themes for today: How to build and use frequency and relative frequency tables.
Building a relative frequency table:
Basketball Kickball Volleyball Total
Boys 25 15 6 46
Girls 9 16 29 54
Total 34 31 35 100
3
Cornell Notes
Learning Target:
I can create and use frequency tables for
categorical data. (Standard S.ID.5)
Name:
Class: Coord. Algebra
Period:
Date: January 27, 2015
Notes
4
Cornell Notes
Learning Target:
I can create and use frequency tables for
categorical data. (Standard S.ID.5)
Name:
Class: Coord. Algebra
Period:
Date: January 27, 2015
Notes
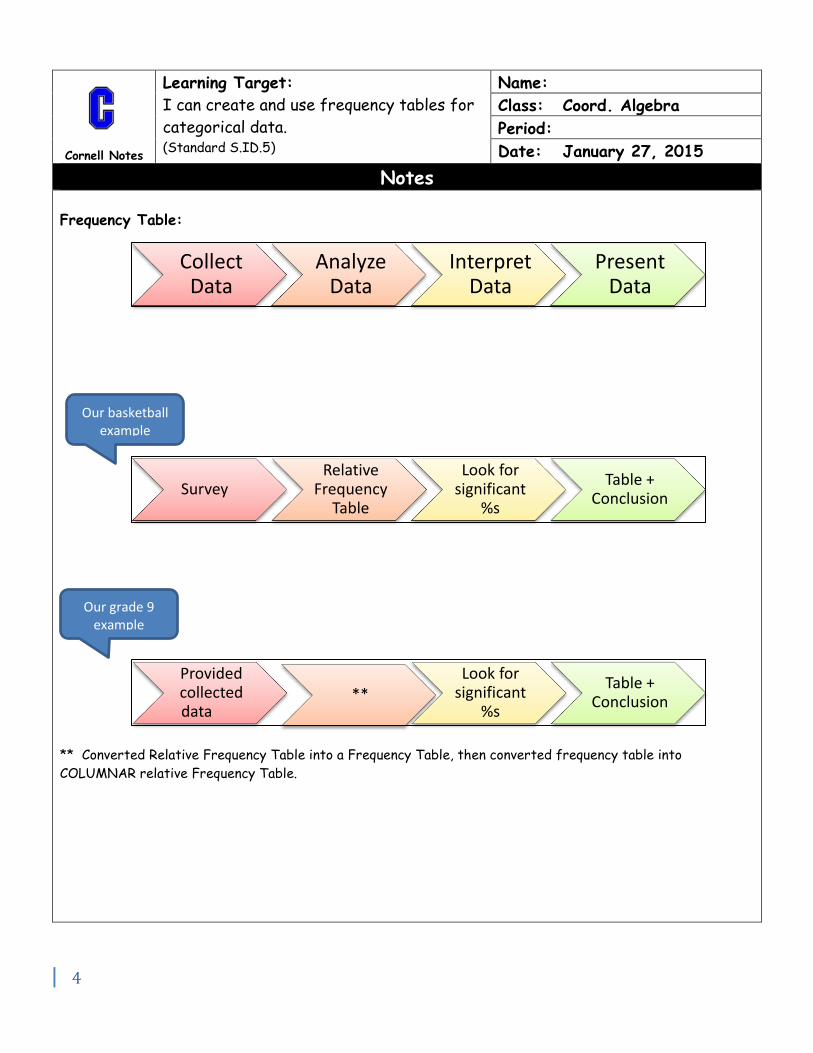
Frequency Table:
** Converted Relative Frequency Table into a Frequency Table, then converted frequency table into
COLUMNAR relative Frequency Table.
Collect Data
Analyze Data
Interpret Data
Present Data
Survey Relative
Frequency Table
Look for significant
%s
Table + Conclusion
Our basketball example
Our grade 9 example
Provided collected data
** Look for
significant %s
Table + Conclusion
5
Cornell Notes
Learning Target:
I can create and use frequency tables for
categorical data. (Standard S.ID.5)
Name:
Class: Coord. Algebra
Period:
Date: January 27, 2015
Questions Notes
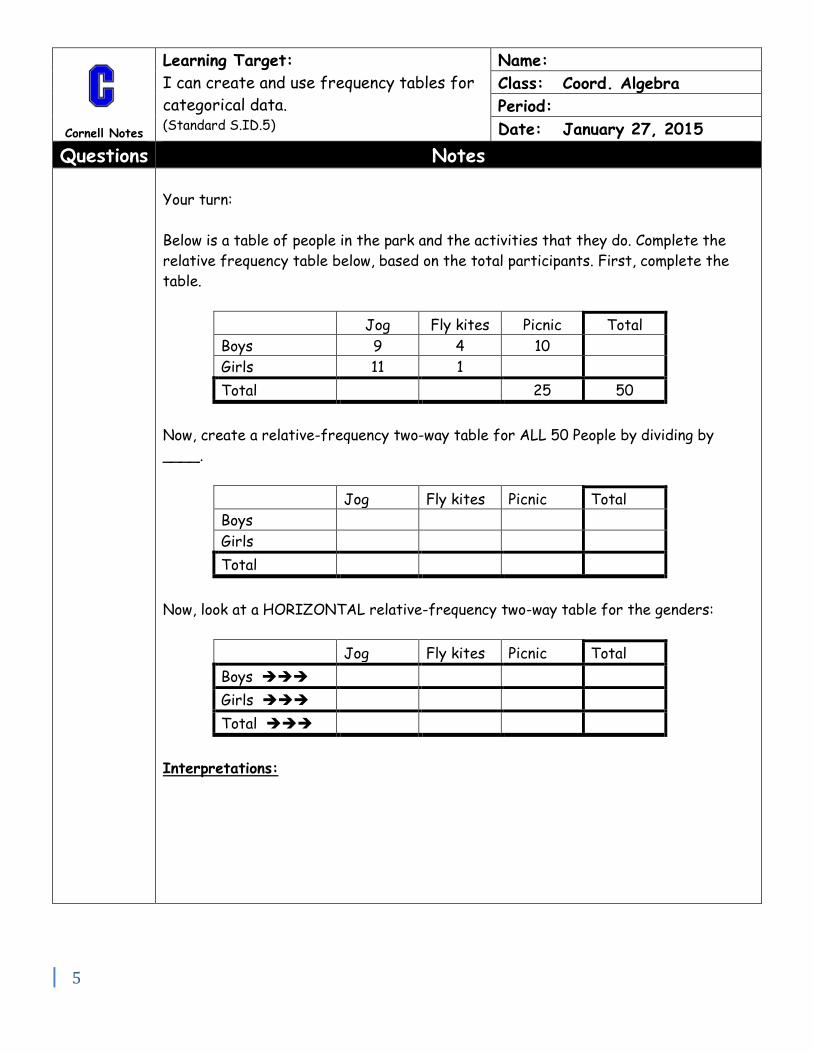
Your turn:
Below is a table of people in the park and the activities that they do. Complete the
relative frequency table below, based on the total participants. First, complete the
table.
Jog Fly kites Picnic Total
Boys 9 4 10
Girls 11 1
Total 25 50
Now, create a relative-frequency two-way table for ALL 50 People by dividing by
____.
Jog Fly kites Picnic Total
Boys
Girls
Total
Now, look at a HORIZONTAL relative-frequency two-way table for the genders:
Jog Fly kites Picnic Total
Boys
Girls
Total
Interpretations:
6
Cornell Notes
Learning Target:
I can create and use frequency tables for
categorical data. (Standard S.ID.5)
Name:
Class: Coord. Algebra
Period:
Date: January 27, 2015
Questions Notes
Wrap-up (key learnings)
1.
2.
Key Learnings:
7
Cornell Notes
Learning Target:
I can create and use frequency tables for
categorical data. (Standard S.ID.5)
Name: TEACHERS’ NOTES
Class: Coord. Algebra
Period:
Date: January 27, 2015
Questions Notes
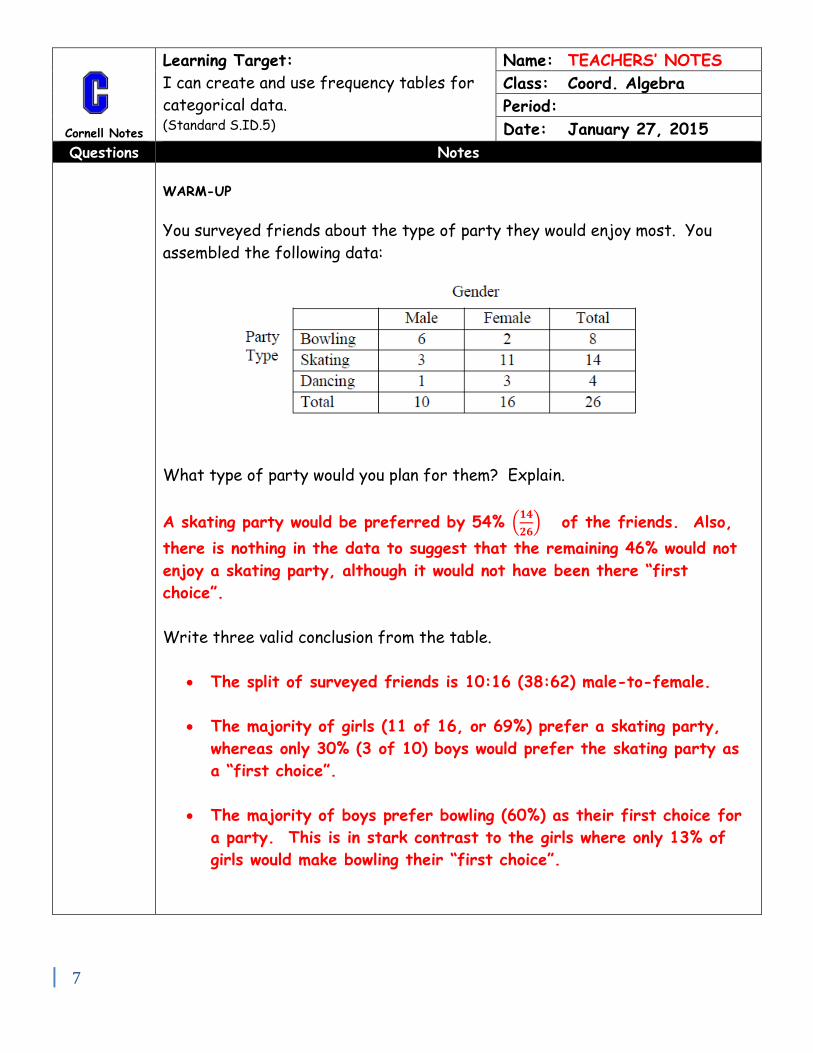
WARM-UP
You surveyed friends about the type of party they would enjoy most. You
assembled the following data:
What type of party would you plan for them? Explain.
A skating party would be preferred by 54% (𝟏𝟒
𝟐𝟔) of the friends. Also,
there is nothing in the data to suggest that the remaining 46% would not
enjoy a skating party, although it would not have been there “first
choice”.
Write three valid conclusion from the table.
The split of surveyed friends is 10:16 (38:62) male-to-female.
The majority of girls (11 of 16, or 69%) prefer a skating party,
whereas only 30% (3 of 10) boys would prefer the skating party as
a “first choice”.
The majority of boys prefer bowling (60%) as their first choice for
a party. This is in stark contrast to the girls where only 13% of
girls would make bowling their “first choice”.
8
Cornell
Notes
Learning Target:
I can create and use frequency
tables for categorical data. (Standard S.ID.5)
Name: TEACHERS’ NOTES
Class: Coord. Algebra
Period:
Date: January 27, 2015
Notes
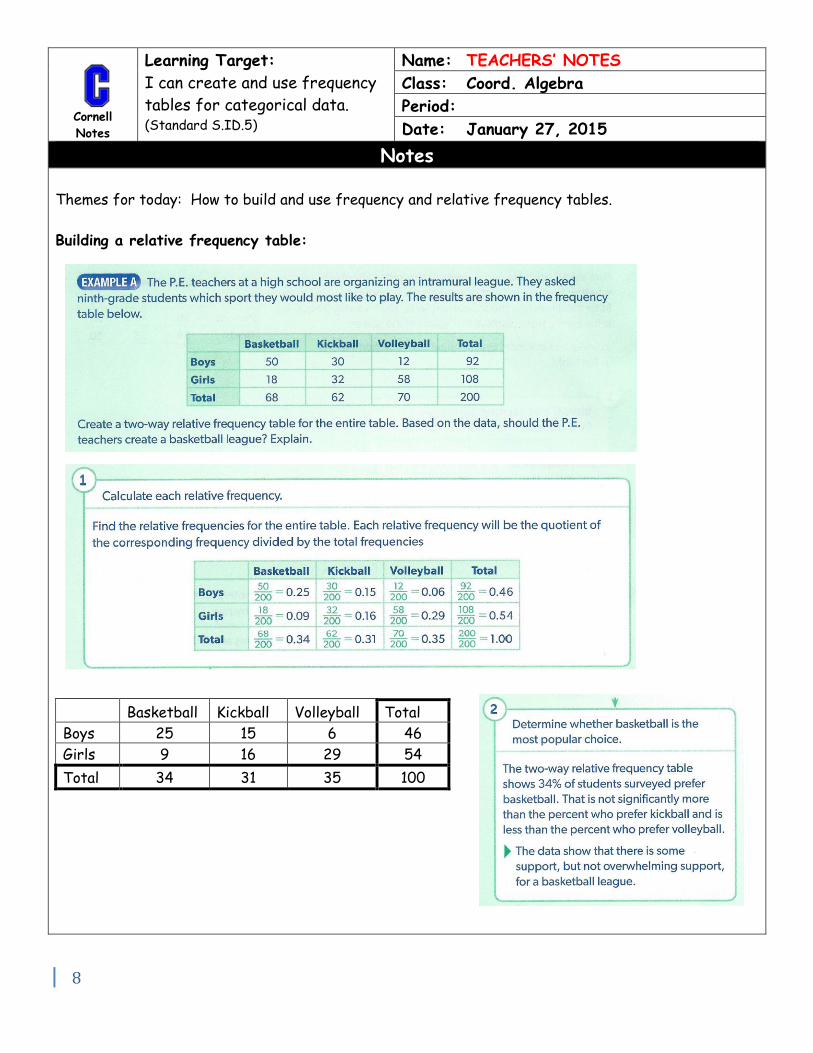
Themes for today: How to build and use frequency and relative frequency tables.
Building a relative frequency table:
Basketball Kickball Volleyball Total
Boys 25 15 6 46
Girls 9 16 29 54
Total 34 31 35 100
9
Cornell Notes
Learning Target:
I can create and use frequency tables for
categorical data. (Standard S.ID.5)
Name: TEACHERS’ NOTES
Class: Coord. Algebra
Period:
Date: January 27, 2015
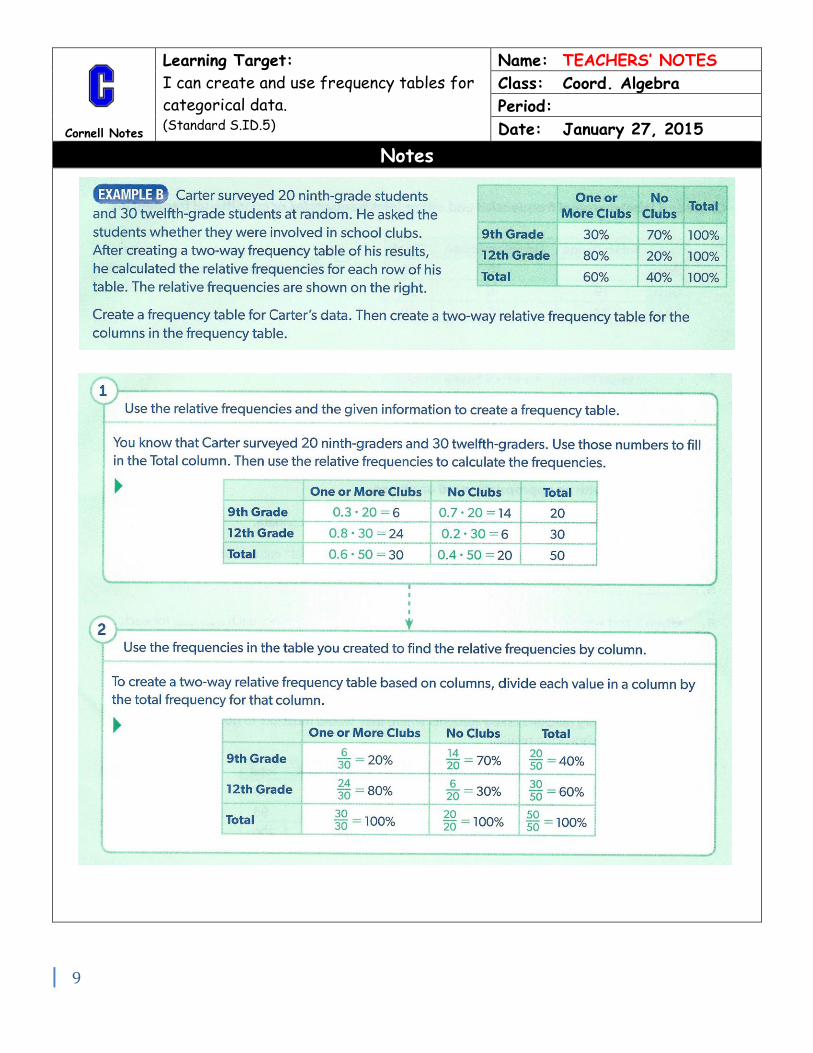
Notes
10
Cornell Notes
Learning Target:
I can create and use frequency tables for
categorical data. (Standard S.ID.5)
Name: TEACHERS’ NOTES
Class: Coord. Algebra
Period:
Date: January 27, 2015
Notes
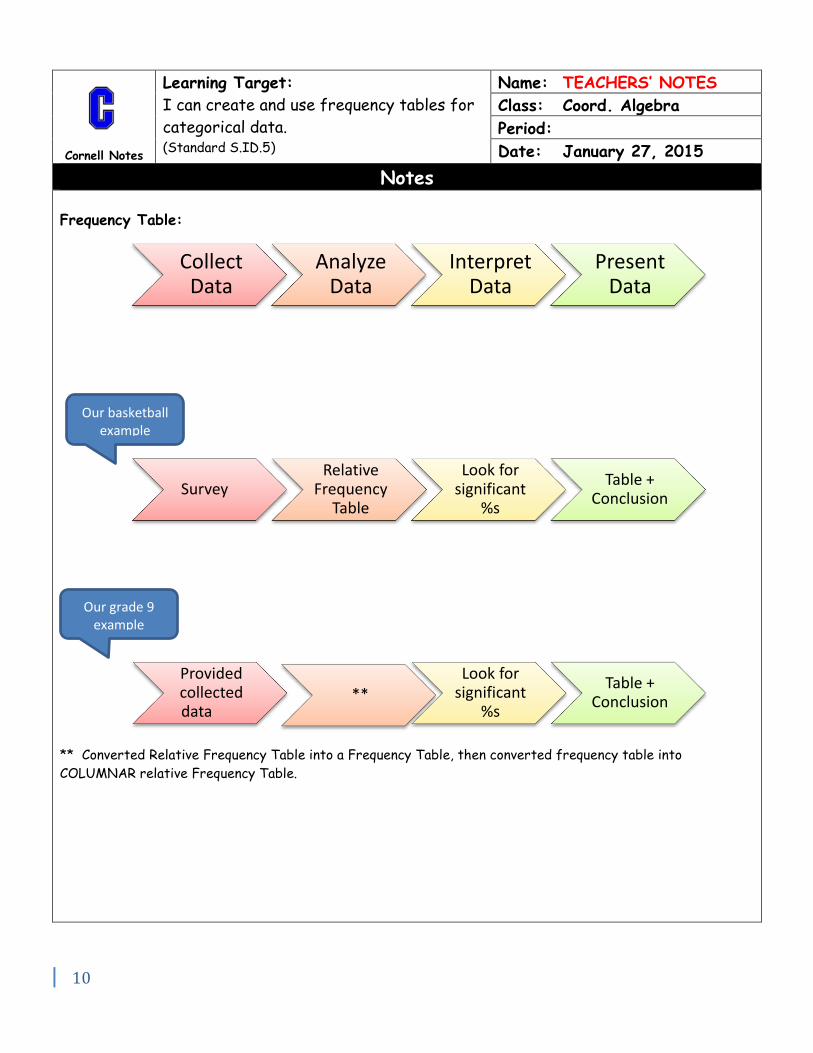
Frequency Table:
** Converted Relative Frequency Table into a Frequency Table, then converted frequency table into
COLUMNAR relative Frequency Table.
Collect Data
Analyze Data
Interpret Data
Present Data
Survey Relative
Frequency Table
Look for significant
%s
Table + Conclusion
Our basketball example
Our grade 9 example
Provided collected data
** Look for
significant %s
Table + Conclusion
11
Cornell Notes
Learning Target:
I can create and use frequency tables for
categorical data. (Standard S.ID.5)
Name: TEACHERS’ NOTES
Class: Coord. Algebra
Period:
Date: January 27, 2015
Questions Notes
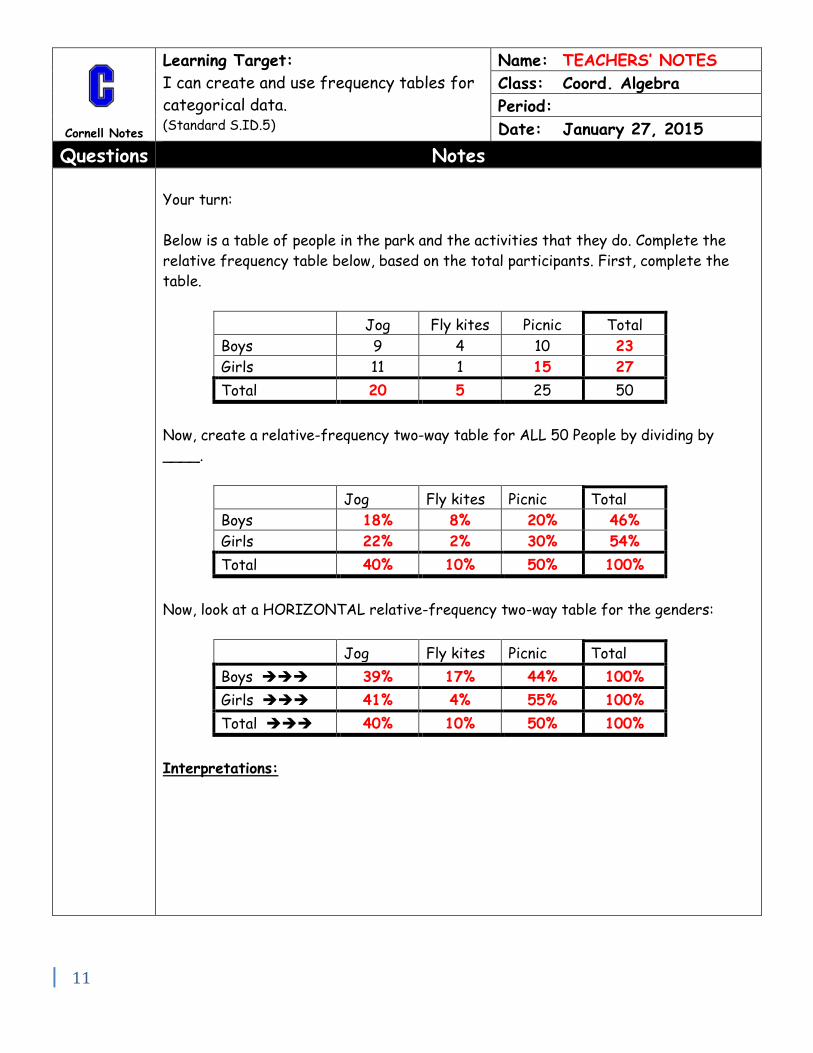
Your turn:
Below is a table of people in the park and the activities that they do. Complete the
relative frequency table below, based on the total participants. First, complete the
table.
Jog Fly kites Picnic Total
Boys 9 4 10 23
Girls 11 1 15 27
Total 20 5 25 50
Now, create a relative-frequency two-way table for ALL 50 People by dividing by
____.
Jog Fly kites Picnic Total
Boys 18% 8% 20% 46%
Girls 22% 2% 30% 54%
Total 40% 10% 50% 100%
Now, look at a HORIZONTAL relative-frequency two-way table for the genders:
Jog Fly kites Picnic Total
Boys 39% 17% 44% 100%
Girls 41% 4% 55% 100%
Total 40% 10% 50% 100%
Interpretations:
12
Cornell Notes
Learning Target:
I can create and use frequency tables for
categorical data. (Standard S.ID.5)
Name: TEACHERS’ NOTES
Class: Coord. Algebra
Period:
Date: January 27, 2015
Questions Notes
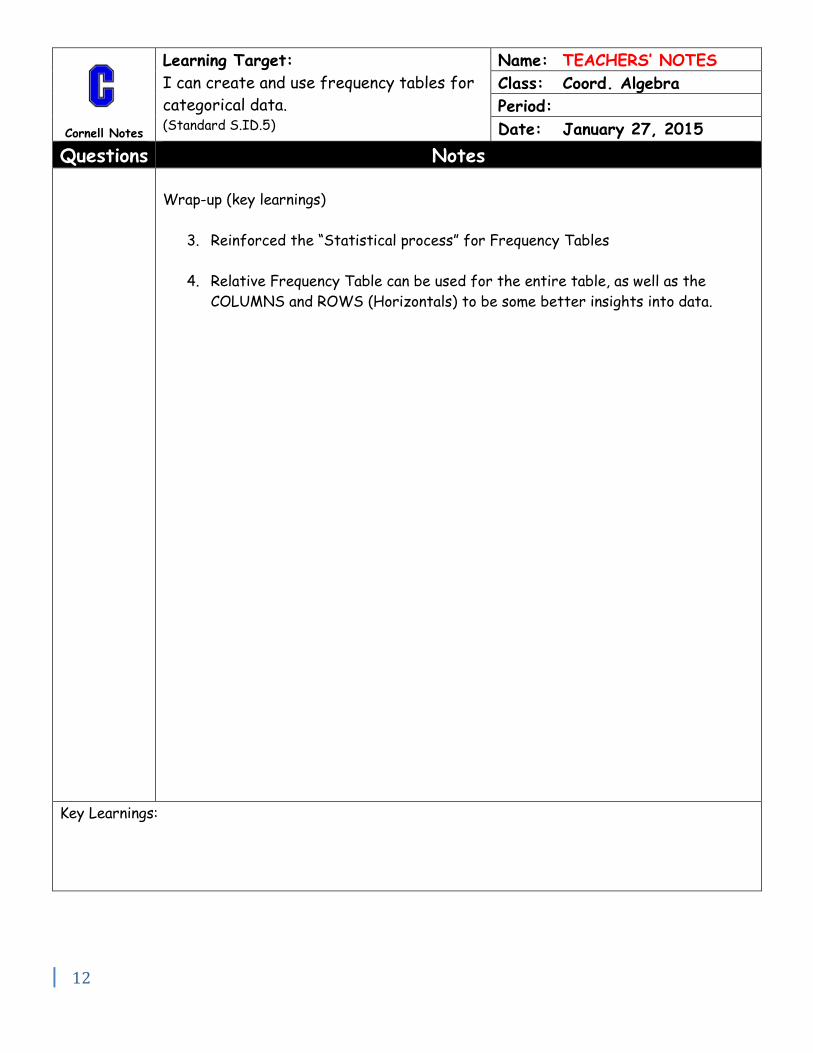
Wrap-up (key learnings)
3. Reinforced the “Statistical process” for Frequency Tables
4. Relative Frequency Table can be used for the entire table, as well as the
COLUMNS and ROWS (Horizontals) to be some better insights into data.
Key Learnings:


![anais - SBSeg16sbseg2016.ic.uff.br/pt/files/anais/completos/ST7-1.pdf · 1. get descriptions() server descriptions loop [for each server] 2 create target() target ID 3' create task(target](https://img.pdfslide.us/doc/110x75/5aed2fcd7f8b9a3b2e902b4f/anais-get-descriptions-server-descriptions-loop-for-each-server-2-create.jpg)