Embed Size (px)
Citation preview
Paper ID #32435
Learning Strategy and Verbal-Visual Preferences for Chemical EngineeringStudents
Dr. Charles E. Baukal Jr. P.E., John Zink Co. LLC
Charles E. Baukal, Jr. has a Ph.D. in Mechanical Engineering, an Ed.D., and Professional EngineeringLicense. He is the Director of the John Zink Institute which offers continuing professional developmentfor engineers and technicians. He has nearly 35 years of industrial experience and 30 years of teaching ex-perience as an adjunct. He is the author/editor of 14 books on industrial combustion and 2 on engineeringeducation. He is an inventor on 11 U.S. patents.
c©American Society for Engineering Education, 2021
Chemical Engineering Students’ Learning Preferences at a Midwestern University
Keywords: chemical engineering students; learning strategy preferences; verbal-visual preferences
Introduction
There continues to be calls for improving engineering education. For example, the National Academy of Engineering publication entitled Educating the Engineer of 2020 [1] calls for the reinvention of engineering education. An important finding of that study was the importance of addressing how students learn in addition to what they learn and recommended more research into engineering education. This included how to better serve students with different learning styles and how to determine pedagogical approaches that excite them.
The purpose of the ongoing research study reported here is to address the current lack of information about learning strategy and verbal-visual preferences of chemical engineering students by determining those preferences for a sample of those students. The following research questions were considered: (1) What are the learning strategy and verbal-visual preference profiles for chemical engineering students?, (2) How do the learning strategy and verbal-visual preferences of chemical engineering students compare to the established norms for the general population?, and (3) What are the relationships of chemical engineering students’ learning strategy and verbal-visual preferences to the demographic variables of gender, age range, class in school, ethnicity, native country, and native language?
Learner Preferences
Learning strategy and verbal-visual preferences are briefly discussed in this section. More detailed discussions of these are available elsewhere [2].
Learning Strategy Preference
A potentially beneficial alternative to the standard definitions and assessments for learning styles is known as learning strategies. Learning strategy preferences, like traditional learning styles, are important characteristics that vary among learners. Conti and Fellenz [3] defined learning strategies as “techniques or skills that an individual elects to use in order to accomplish a learning task.” Learning styles are believed to be stable and deeply ingrained processes for processing information [4]. In contrast, learning strategies are believed to be less rigid and are more related to personal preferences and choices made by learners during learning tasks [5]. Learning strategy preference is a potentially important learner variable [6] that could be used by instructors to enhance students’ learning experiences [7].
Through a complex and lengthy process, Conti and his associates [3], [8], [9], [10] developed and validated the instrument known as Assessing The Learning Strategies of AdultS or ATLAS. An important advantage of this instrument is that it is simple to administer and is currently the generally-accepted method for measuring learning strategy preferences [7]. Three distinct learning strategy groups were identified: Navigators, Problem Solvers, and Engagers [10].
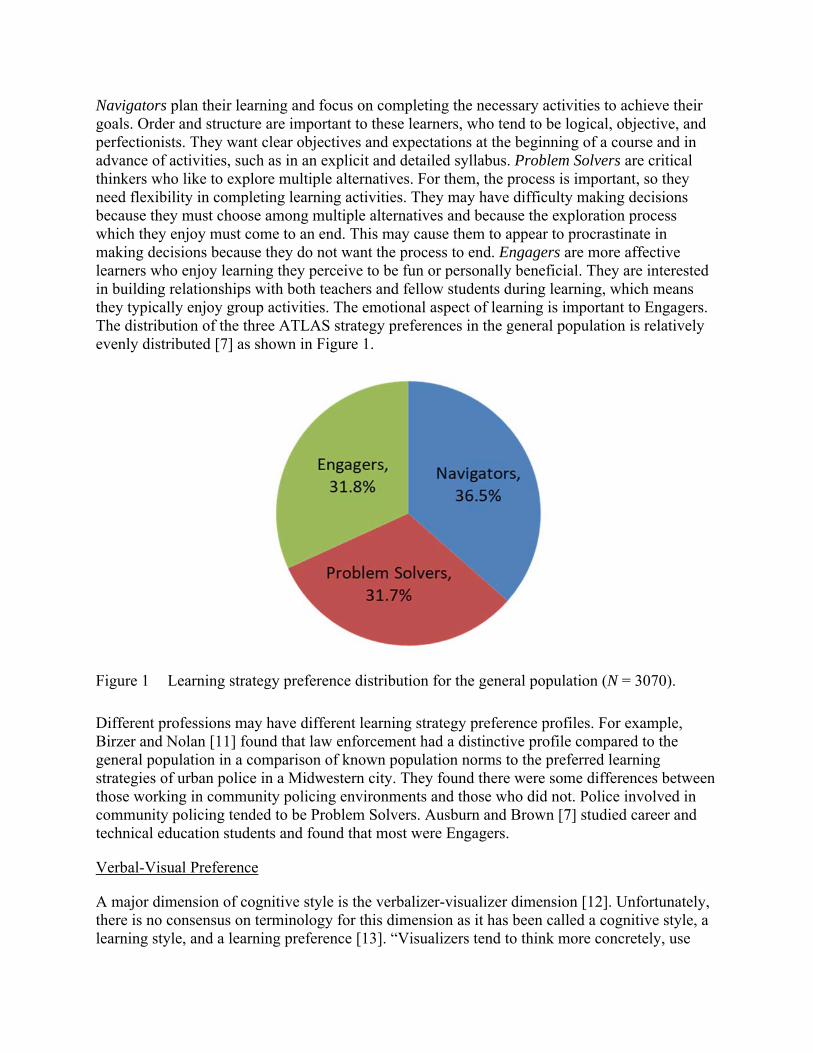
Navigators plan their learning and focus on completing the necessary activities to achieve their goals. Order and structure are important to these learners, who tend to be logical, objective, and perfectionists. They want clear objectives and expectations at the beginning of a course and in advance of activities, such as in an explicit and detailed syllabus. Problem Solvers are critical thinkers who like to explore multiple alternatives. For them, the process is important, so they need flexibility in completing learning activities. They may have difficulty making decisions because they must choose among multiple alternatives and because the exploration process which they enjoy must come to an end. This may cause them to appear to procrastinate in making decisions because they do not want the process to end. Engagers are more affective learners who enjoy learning they perceive to be fun or personally beneficial. They are interested in building relationships with both teachers and fellow students during learning, which means they typically enjoy group activities. The emotional aspect of learning is important to Engagers. The distribution of the three ATLAS strategy preferences in the general population is relatively evenly distributed [7] as shown in Figure 1.
Figure 1 Learning strategy preference distribution for the general population (N = 3070).
Different professions may have different learning strategy preference profiles. For example, Birzer and Nolan [11] found that law enforcement had a distinctive profile compared to the general population in a comparison of known population norms to the preferred learning strategies of urban police in a Midwestern city. They found there were some differences between those working in community policing environments and those who did not. Police involved in community policing tended to be Problem Solvers. Ausburn and Brown [7] studied career and technical education students and found that most were Engagers.
Verbal-Visual Preference
A major dimension of cognitive style is the verbalizer-visualizer dimension [12]. Unfortunately, there is no consensus on terminology for this dimension as it has been called a cognitive style, a learning style, and a learning preference [13]. “Visualizers tend to think more concretely, use
imagery, and personalize information. While learning, they prefer graphs, diagrams, or pictures added to text-based material. Verbalizers prefer to process information from words, either by reading or listening, rather than through images” [14]. Learners who have no strong preference for either verbal or visual processing are referred to as flexible stylists, also called bimodal or mixed processors [15]. More visual learners may approach learning tasks with visual learning strategies, while more verbal learners may use more verbal strategies [16]. When given a choice, verbalizers tend to select more verbal content and visualizers tend to select more visual content [17].
Many instruments have been developed to measure this cognitive style. Richardson [18] developed a 15-item questionnaire called VVQ (verbal and visual questions). His research showed 15 to 25% of people tested fell into what he called either habitual verbalizers or habitual visualizers, with the balance in between. He recommended using 15% verbalizers and 15% visualizers with the balance in between for research purposes. Felder and Silverman [19] wrote a highly cited paper on learning and teaching styles in engineering education. One of the five dimensions they discussed was visual-auditory. An instrument was developed that is a self-scoring 44-item questionnaire called the Index of Learning Styles or ILS [20]. Montgomery [21] used the ILS instrument to sample the learning styles of 143 students in an introductory sophomore-level chemical engineering class. She found that 69% were visual and 30% were verbal (1% were reported as None). Multimedia software was developed for the course, in part because multimedia software favors visual learners which was the overwhelming majority of the students.
The verbalizer-visualizer preference, as measured by the Verbal-Visual Learning Style Rating (VVLSR) established by Mayer and Massa [22], represents the perceptual cognitive aspect of adult learning styles. This instrument was validated against a number of other instruments and was used here because of its simplicity (a single question). It was used here to examine possible relationships between perceptual/cognitive learning preferences and demographics.
Methodology
This study used a quantitative descriptive design based on survey methodology, which uses instruments such as questionnaires to collect information from one or more groups of subjects [23]. Starting in the semesters beginning with the fall of 2012 and continuing to the spring of 2020, a total of 184 chemical engineering students from one private Midwestern university were sampled to determine their learning strategy preferences and verbal-visual cognitive styles. The sample was a convenience sample as the students were in classes taught by the author, some of which also included mechanical, electrical, and petroleum engineering students. Three instruments were used in that study: a demographics questionnaire, ATLAS, and the VVLSR. The former is given in the Appendix and the latter two are given in reference 2. The demographics questionnaire was used to collect information such as gender, age range, year in college, major, ethnicity, native language, and native country. The surveys were completely voluntary and anonymous. The response rate was high (well over 75%) but not measured.
Results and Discussion
The learning strategy and verbal-visual preferences of the participants sampled are given next.
Demographics
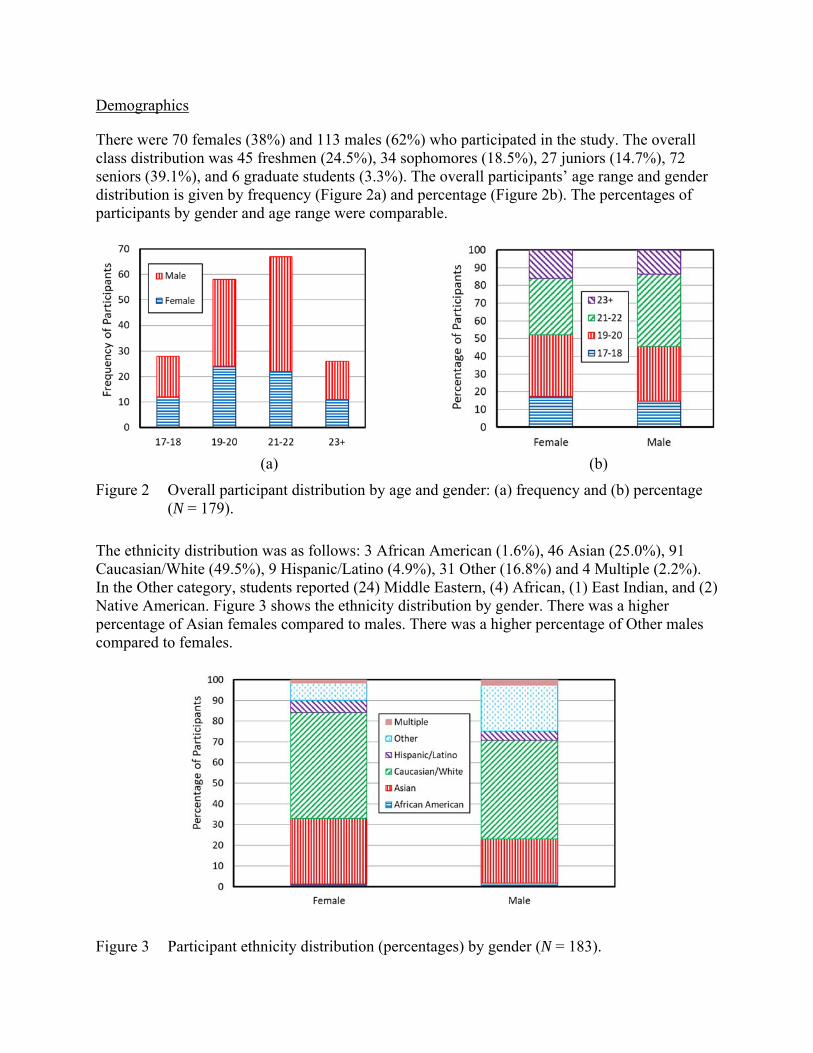
There were 70 females (38%) and 113 males (62%) who participated in the study. The overall class distribution was 45 freshmen (24.5%), 34 sophomores (18.5%), 27 juniors (14.7%), 72 seniors (39.1%), and 6 graduate students (3.3%). The overall participants’ age range and gender distribution is given by frequency (Figure 2a) and percentage (Figure 2b). The percentages of participants by gender and age range were comparable.
(a) (b)
Figure 2 Overall participant distribution by age and gender: (a) frequency and (b) percentage (N = 179).
The ethnicity distribution was as follows: 3 African American (1.6%), 46 Asian (25.0%), 91 Caucasian/White (49.5%), 9 Hispanic/Latino (4.9%), 31 Other (16.8%) and 4 Multiple (2.2%). In the Other category, students reported (24) Middle Eastern, (4) African, (1) East Indian, and (2) Native American. Figure 3 shows the ethnicity distribution by gender. There was a higher percentage of Asian females compared to males. There was a higher percentage of Other males compared to females.
Figure 3 Participant ethnicity distribution (percentages) by gender (N = 183).
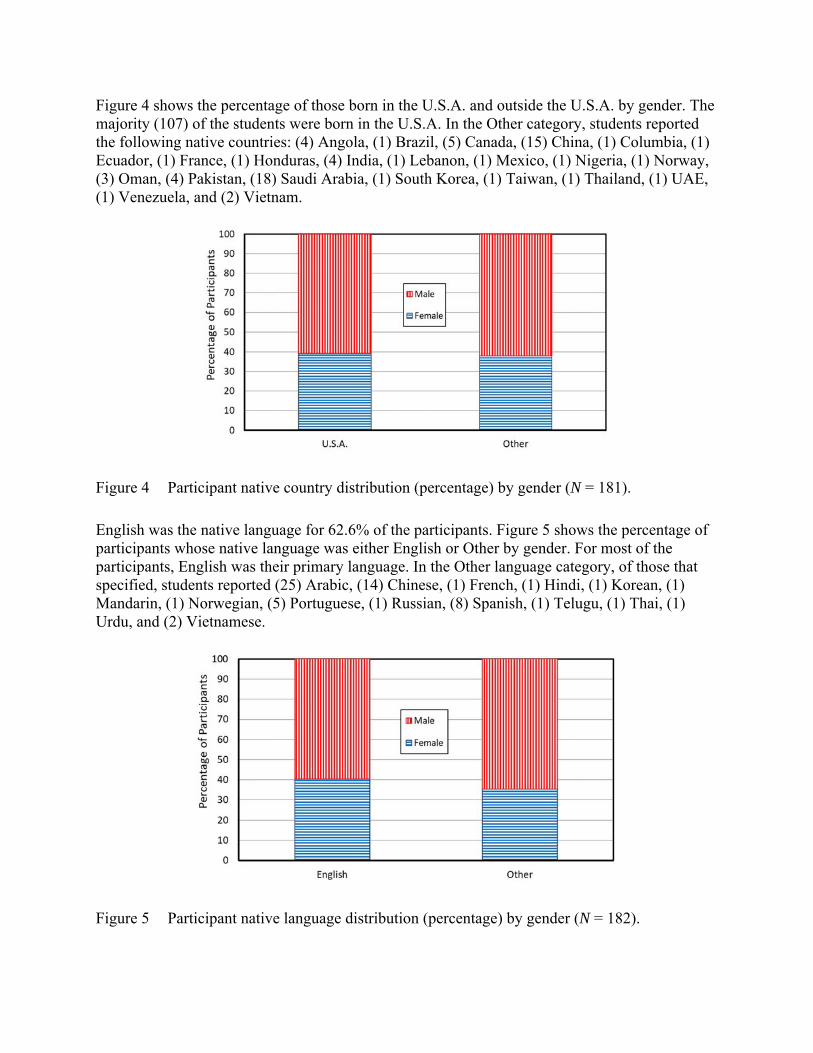
Figure 4 shows the percentage of those born in the U.S.A. and outside the U.S.A. by gender. The majority (107) of the students were born in the U.S.A. In the Other category, students reported the following native countries: (4) Angola, (1) Brazil, (5) Canada, (15) China, (1) Columbia, (1) Ecuador, (1) France, (1) Honduras, (4) India, (1) Lebanon, (1) Mexico, (1) Nigeria, (1) Norway, (3) Oman, (4) Pakistan, (18) Saudi Arabia, (1) South Korea, (1) Taiwan, (1) Thailand, (1) UAE, (1) Venezuela, and (2) Vietnam.
Figure 4 Participant native country distribution (percentage) by gender (N = 181).
English was the native language for 62.6% of the participants. Figure 5 shows the percentage of participants whose native language was either English or Other by gender. For most of the participants, English was their primary language. In the Other language category, of those that specified, students reported (25) Arabic, (14) Chinese, (1) French, (1) Hindi, (1) Korean, (1) Mandarin, (1) Norwegian, (5) Portuguese, (1) Russian, (8) Spanish, (1) Telugu, (1) Thai, (1) Urdu, and (2) Vietnamese.
Figure 5 Participant native language distribution (percentage) by gender (N = 182).
Learning Strategy Preference
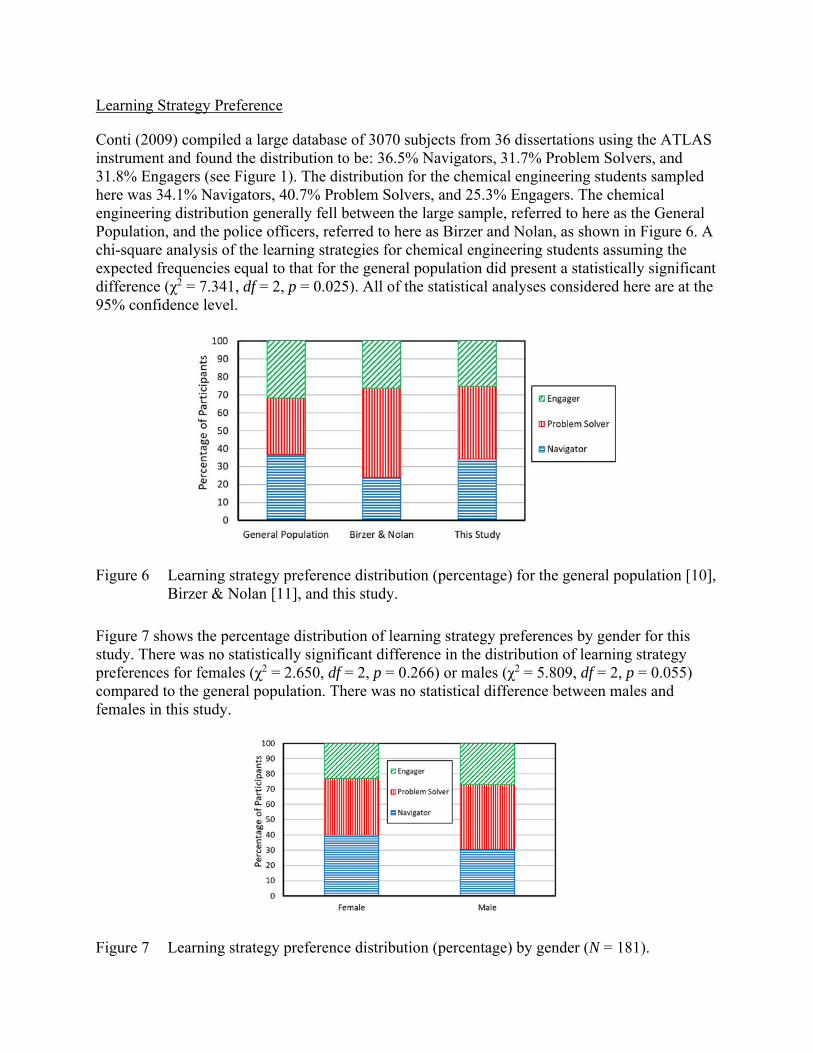
Conti (2009) compiled a large database of 3070 subjects from 36 dissertations using the ATLAS instrument and found the distribution to be: 36.5% Navigators, 31.7% Problem Solvers, and 31.8% Engagers (see Figure 1). The distribution for the chemical engineering students sampled here was 34.1% Navigators, 40.7% Problem Solvers, and 25.3% Engagers. The chemical engineering distribution generally fell between the large sample, referred to here as the General Population, and the police officers, referred to here as Birzer and Nolan, as shown in Figure 6. A chi-square analysis of the learning strategies for chemical engineering students assuming the expected frequencies equal to that for the general population did present a statistically significant difference (χ2 = 7.341, df = 2, p = 0.025). All of the statistical analyses considered here are at the 95% confidence level.
Figure 6 Learning strategy preference distribution (percentage) for the general population [10], Birzer & Nolan [11], and this study.
Figure 7 shows the percentage distribution of learning strategy preferences by gender for this study. There was no statistically significant difference in the distribution of learning strategy preferences for females (χ2 = 2.650, df = 2, p = 0.266) or males (χ2 = 5.809, df = 2, p = 0.055) compared to the general population. There was no statistical difference between males and females in this study.
Figure 7 Learning strategy preference distribution (percentage) by gender (N = 181).
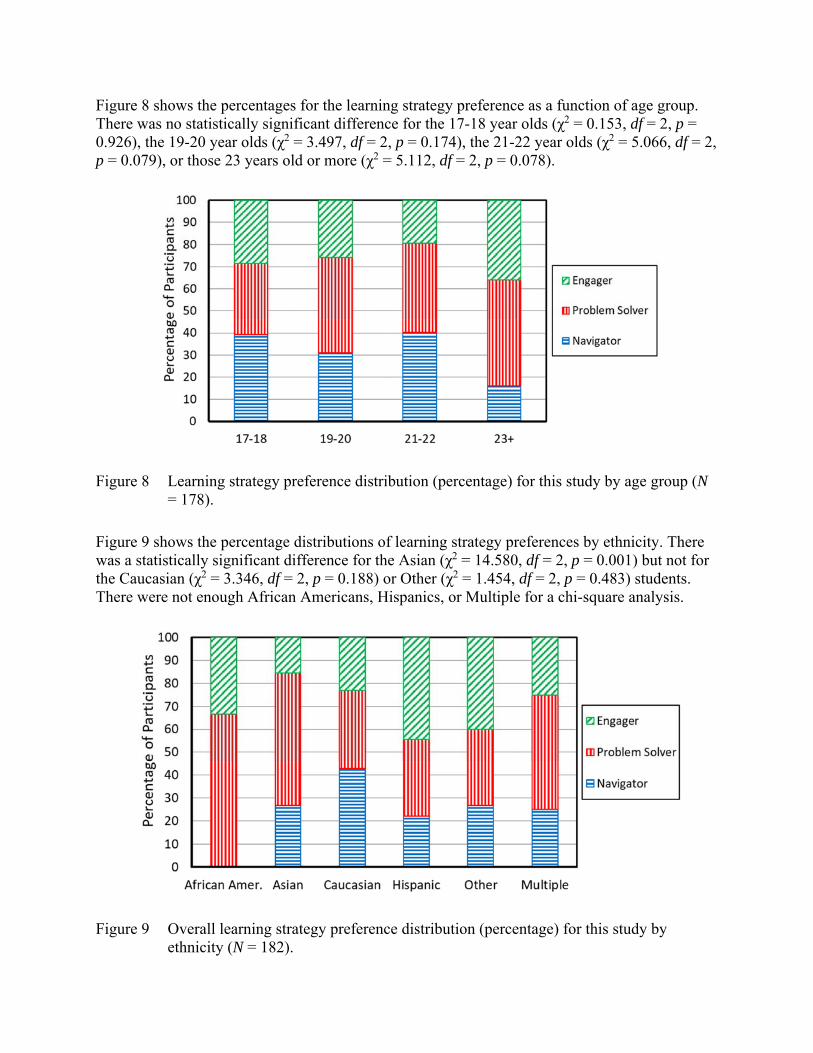
Figure 8 shows the percentages for the learning strategy preference as a function of age group. There was no statistically significant difference for the 17-18 year olds (χ2 = 0.153, df = 2, p = 0.926), the 19-20 year olds (χ2 = 3.497, df = 2, p = 0.174), the 21-22 year olds (χ2 = 5.066, df = 2, p = 0.079), or those 23 years old or more (χ2 = 5.112, df = 2, p = 0.078).
Figure 8 Learning strategy preference distribution (percentage) for this study by age group (N = 178).
Figure 9 shows the percentage distributions of learning strategy preferences by ethnicity. There was a statistically significant difference for the Asian (χ2 = 14.580, df = 2, p = 0.001) but not for the Caucasian (χ2 = 3.346, df = 2, p = 0.188) or Other (χ2 = 1.454, df = 2, p = 0.483) students. There were not enough African Americans, Hispanics, or Multiple for a chi-square analysis.
Figure 9 Overall learning strategy preference distribution (percentage) for this study by ethnicity (N = 182).
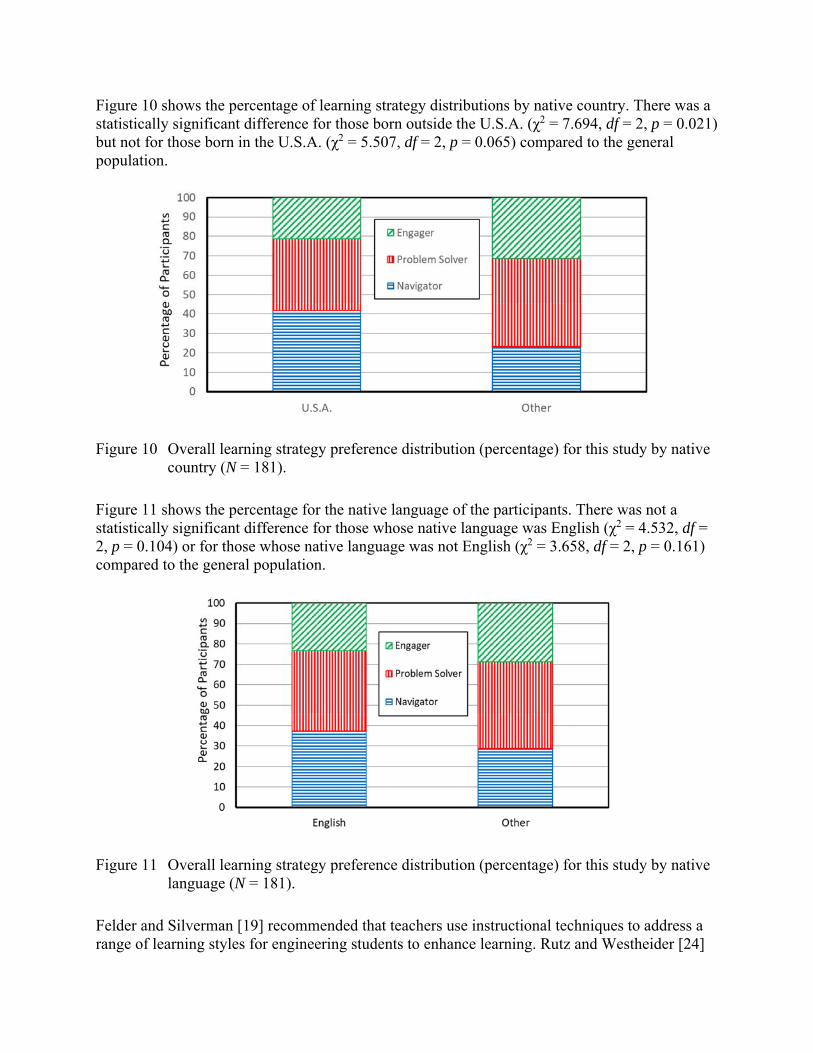
Figure 10 shows the percentage of learning strategy distributions by native country. There was a statistically significant difference for those born outside the U.S.A. (χ2 = 7.694, df = 2, p = 0.021) but not for those born in the U.S.A. (χ2 = 5.507, df = 2, p = 0.065) compared to the general population.
Figure 10 Overall learning strategy preference distribution (percentage) for this study by native country (N = 181).
Figure 11 shows the percentage for the native language of the participants. There was not a statistically significant difference for those whose native language was English (χ2 = 4.532, df = 2, p = 0.104) or for those whose native language was not English (χ2 = 3.658, df = 2, p = 0.161) compared to the general population.
Figure 11 Overall learning strategy preference distribution (percentage) for this study by native language (N = 181).
Felder and Silverman [19] recommended that teachers use instructional techniques to address a range of learning styles for engineering students to enhance learning. Rutz and Westheider [24]
recommended that teachers use a variety of instructional methods to engage all learners. Because the learning strategy preference profile measured in this study was comparable among the three preference categories, it is recommended that instructors use a variety of instructional techniques to meet the entire range of student preferences.
Verbal-Visual Preference
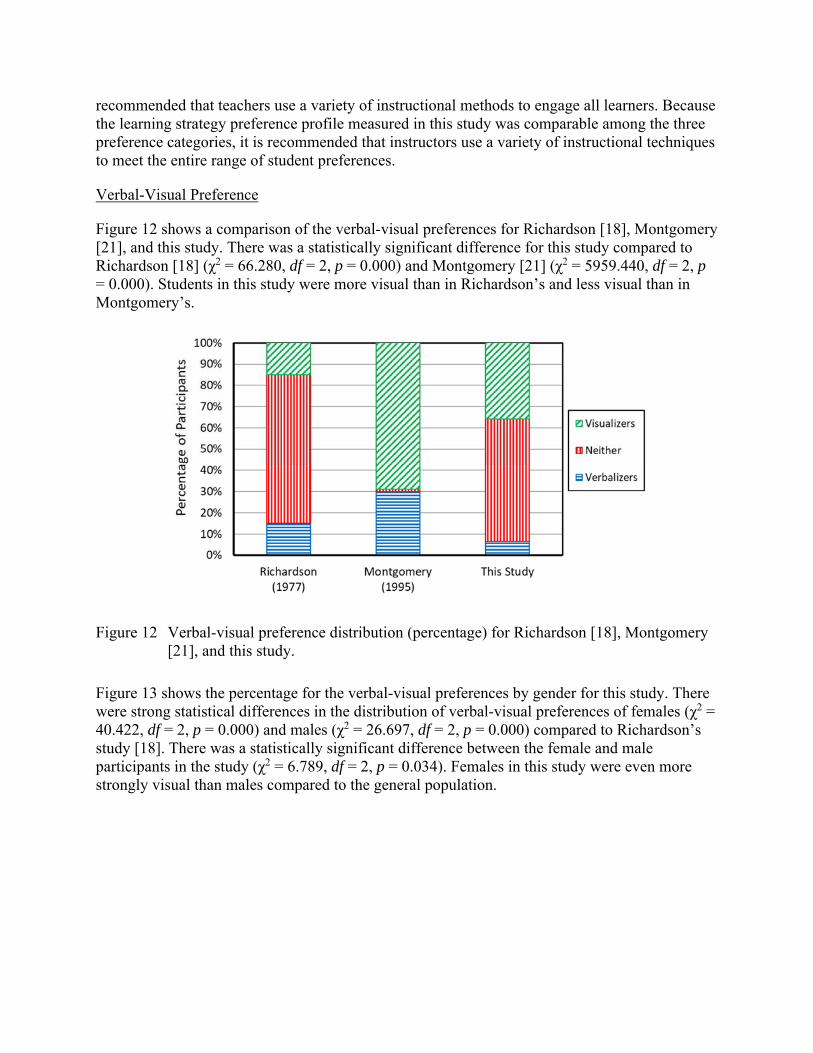
Figure 12 shows a comparison of the verbal-visual preferences for Richardson [18], Montgomery [21], and this study. There was a statistically significant difference for this study compared to Richardson [18] (χ2 = 66.280, df = 2, p = 0.000) and Montgomery [21] (χ2 = 5959.440, df = 2, p = 0.000). Students in this study were more visual than in Richardson’s and less visual than in Montgomery’s.
Figure 12 Verbal-visual preference distribution (percentage) for Richardson [18], Montgomery [21], and this study.
Figure 13 shows the percentage for the verbal-visual preferences by gender for this study. There were strong statistical differences in the distribution of verbal-visual preferences of females (χ2 = 40.422, df = 2, p = 0.000) and males (χ2 = 26.697, df = 2, p = 0.000) compared to Richardson’s study [18]. There was a statistically significant difference between the female and male participants in the study (χ2 = 6.789, df = 2, p = 0.034). Females in this study were even more strongly visual than males compared to the general population.
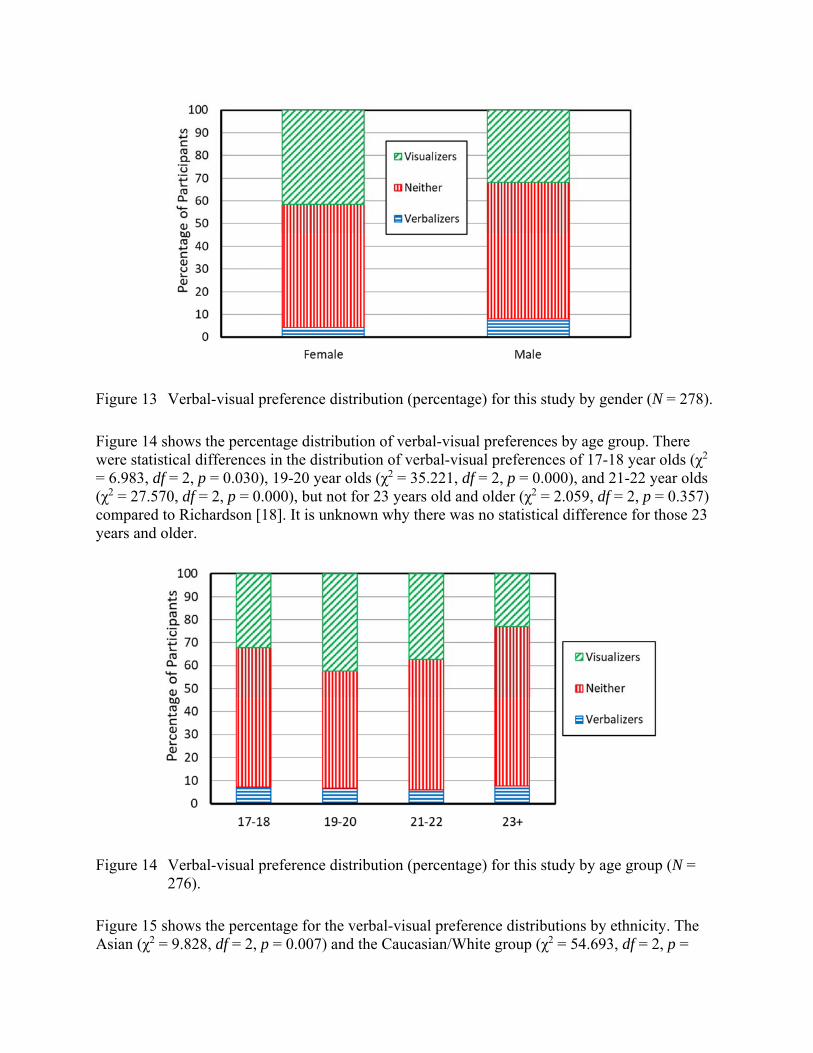
Figure 13 Verbal-visual preference distribution (percentage) for this study by gender (N = 278).
Figure 14 shows the percentage distribution of verbal-visual preferences by age group. There were statistical differences in the distribution of verbal-visual preferences of 17-18 year olds (χ2 = 6.983, df = 2, p = 0.030), 19-20 year olds (χ2 = 35.221, df = 2, p = 0.000), and 21-22 year olds (χ2 = 27.570, df = 2, p = 0.000), but not for 23 years old and older (χ2 = 2.059, df = 2, p = 0.357) compared to Richardson [18]. It is unknown why there was no statistical difference for those 23 years and older.
Figure 14 Verbal-visual preference distribution (percentage) for this study by age group (N = 276).
Figure 15 shows the percentage for the verbal-visual preference distributions by ethnicity. The Asian (χ2 = 9.828, df = 2, p = 0.007) and the Caucasian/White group (χ2 = 54.693, df = 2, p =
0.000) were statistically different than Richardson’s [18] profile. There were not enough in the other ethnic categories for a chi-square analysis.
Figure 15 Verbal-visual preference distribution (percentage) by ethnicity (N = 278).
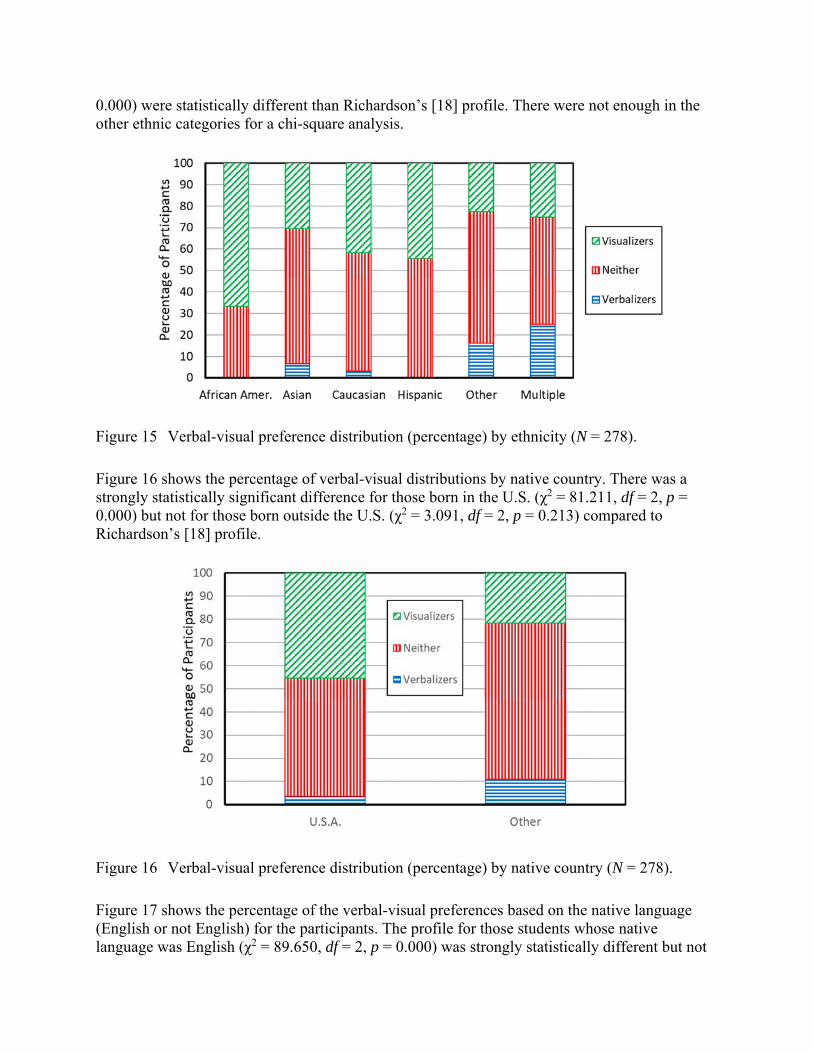
Figure 16 shows the percentage of verbal-visual distributions by native country. There was a strongly statistically significant difference for those born in the U.S. (χ2 = 81.211, df = 2, p = 0.000) but not for those born outside the U.S. (χ2 = 3.091, df = 2, p = 0.213) compared to Richardson’s [18] profile.
Figure 16 Verbal-visual preference distribution (percentage) by native country (N = 278).
Figure 17 shows the percentage of the verbal-visual preferences based on the native language (English or not English) for the participants. The profile for those students whose native language was English (χ2 = 89.650, df = 2, p = 0.000) was strongly statistically different but not
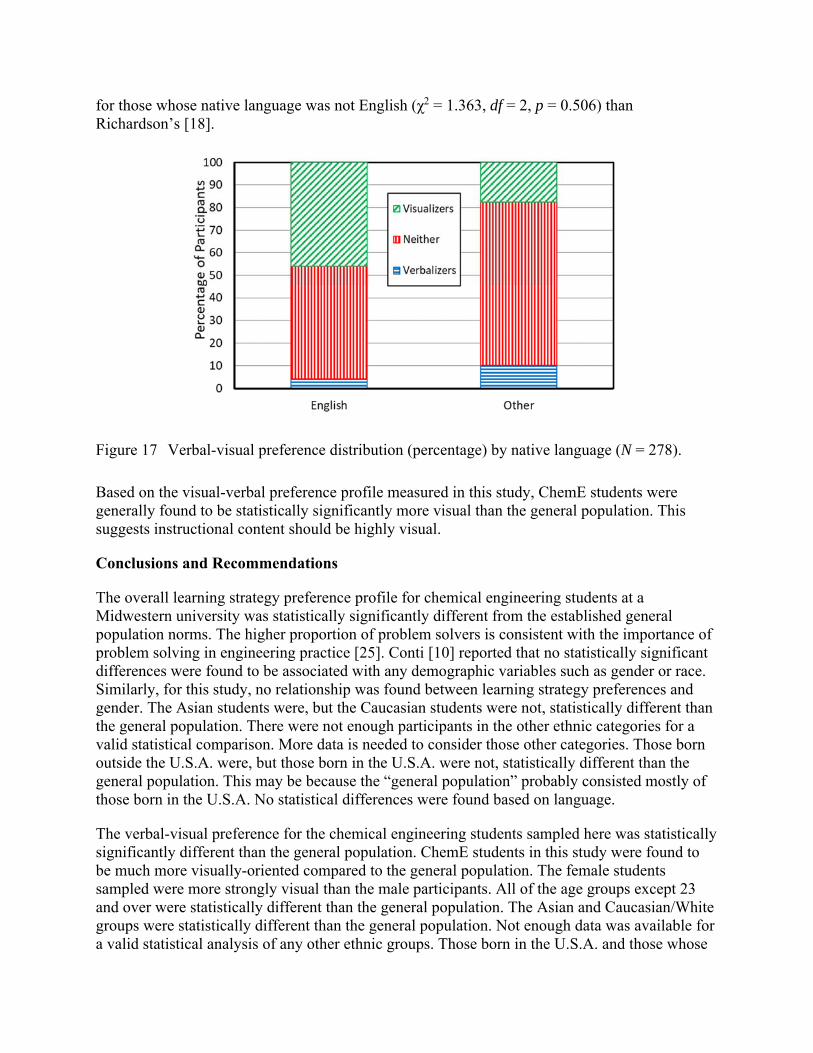
for those whose native language was not English (χ2 = 1.363, df = 2, p = 0.506) than Richardson’s [18].
Figure 17 Verbal-visual preference distribution (percentage) by native language (N = 278).
Based on the visual-verbal preference profile measured in this study, ChemE students were generally found to be statistically significantly more visual than the general population. This suggests instructional content should be highly visual.
Conclusions and Recommendations
The overall learning strategy preference profile for chemical engineering students at a Midwestern university was statistically significantly different from the established general population norms. The higher proportion of problem solvers is consistent with the importance of problem solving in engineering practice [25]. Conti [10] reported that no statistically significant differences were found to be associated with any demographic variables such as gender or race. Similarly, for this study, no relationship was found between learning strategy preferences and gender. The Asian students were, but the Caucasian students were not, statistically different than the general population. There were not enough participants in the other ethnic categories for a valid statistical comparison. More data is needed to consider those other categories. Those born outside the U.S.A. were, but those born in the U.S.A. were not, statistically different than the general population. This may be because the “general population” probably consisted mostly of those born in the U.S.A. No statistical differences were found based on language.
The verbal-visual preference for the chemical engineering students sampled here was statistically significantly different than the general population. ChemE students in this study were found to be much more visually-oriented compared to the general population. The female students sampled were more strongly visual than the male participants. All of the age groups except 23 and over were statistically different than the general population. The Asian and Caucasian/White groups were statistically different than the general population. Not enough data was available for a valid statistical analysis of any other ethnic groups. Those born in the U.S.A. and those whose
native language was English were, but those born outside the U.S.A. and whose native language was not English were not, statistically different than the general population.
Before these results can be generalized for all chemical engineering students, much more data should be collected from other universities, including both public and private. More students are needed in a wider range of ethnicities. For example, other specific languages, cultures, and countries could be investigated.
Given the narrow scope of this study, preliminarily the results of this study have implications for the instructional strategies used to teach ChemE students or the how to teach and not what to teach. This study suggests that a range of techniques should be used as the ChemE students sampled were comparably divided among the three learning strategy preferences. Instructional content should be highly visual which is the preferred verbal-visual style for most ChemE students. Instructors must be careful not to disproportionately design instructional materials and methods for their own learning strategy and verbal-visual preferences and instead should use a variety of techniques to address the preferences of all students.
Instructors might consider administering the ATLAS instrument at the beginning of a course, both to find out the learning strategy profile of those enrolled in the class and so the students themselves find out their own preference and understand the other preferences. It may be helpful to discuss at the beginning of a course that activities targeted for one learning strategy preference may be less than desirable for those students with other preferences. For example, Navigators prefer more efficient activities (e.g., the instructor directly gives them the answer) while Problem Solvers prefer to explore solutions on their own. Another example is that Navigators often prefer to work by themselves because they have more control over the process, whereas Engagers prefer to work in groups because of the interaction.
Since many ChemE students will go into the workforce after graduation, they need to be prepared to work with people having all three learning strategy preferences. While they may not themselves prefer certain types of activities, they should at least be able to tolerate them as they may have to experience them in the work environment. Through knowledge of the learning strategies concept and the ATLAS instrument, it may be possible to improve instructional practice in engineering education and to better prepare ChemEs to engage effectively with their colleagues in the classroom and later in the workplace. Increasing visual learning content should be more effective in helping ChemE students learn new content.
References
[1] National Academy of Engineering, Educating the Engineer of 2020: Adapting Engineering Education to the New Century, National Academies Press, Washington, DC, 2005.
[2] C. E. Baukal, Learner Preferences for Continuing Engineering Education, Lambert, Mauritius, 2017.
[3] G. J. Conti and R. A. Fellenz, Assessing adult learning strategies, retrieved from ERIC database (ED339847), 1991.
[4] L. J. Ausburn and F. Ausburn, Cognitive styles: Some information and implications for instructional design, Educational Communication and Technology, vol. 26, no. 4, pp. 337-354, 1978.
[5] R. M. Smith, Learning How to Learn: Applied Theory for Adults, Prentice Hall, Englewood Cliffs, NJ, 1982.
[6] L. J. Ausburn, Course Design Elements Most Valued by Adult Learners in Blended Online Education Environments: An American Perspective, Educational Media International, vol. 41, no. 4, pp. 327-337, 2004.
[7] L. J. Ausburn and D. Brown, Learning Strategy Patterns and Instructional Preferences of Career and Technical Education Students, Journal of Industrial Teacher Education, vol. 43, no. 4, pp. 6-39, 2006.
[8] R. A. Fellenz and G. J. Conti, Self-knowledge inventory of lifelong learning strategies (SKILLS) manual, Center for Adult Learning Research, Bozeman, MT, 1993.
[9] G. J. Conti and R. C. Kolody, The use of learning strategies: An international perspective, Proceedings of the 36 Annual Adult Education Research Conference, Edmonton, Alberta, Canada, pp. 77-82, 1995.
[10] G. J. Conti, Development of a user-friendly instrument for identifying the learning strategy preference of adults, Teaching and Teacher Education, vol. 25, pp. 887-896, 2009.
[11] M. L. Birzer and R. E. Nolan, Learning strategies of selected urban police related to community policing, Policing, vol. 25, no. 2, pp. 242-255, 2002.
[12] A. Paivio, Imagery and Verbal Processes, Holt, Rinehart & Winston, New York, 1971.
[13] J. L. Plass, D. M. Chun, R. E. Mayer, and D. Leutner, Supporting visual and verbal learning preferences in a second-language multimedia learning environment. Journal of Educational Psychology, vol. 90, no. 1, pp. 25-36, 1998.
[14] D. H. Jonassen and B.L. Grabowski, Handbook of Individual Differences, Learning, and Instruction, Lawrence Erlbaum, Hillsdale, NJ, 1993.
[15] Y. W. Ong and D. Milcech, Comparison of the Cognitive Styles Analysis and the Style of Processing Scale, Perceptual and Motor Skills, vol. 99, pp. 155-162, 2004.
[16] J. R. Kirby, P. J. Moore, and N. J. Schofield, Verbal and visual learning styles, Contemporary Educational Psychology, vol. 13, no. 2, pp. 169-184, 1988.
[17] R. J. Riding and M. Watts, The effect of cognitive style on the preferred format of instructional material, Educational Psychology, vol. 17, nos. 1-2, pp. 179-183, 1997.
[18] A. Richardson, Verbalizer-visualizer: A cognitive style dimension, Journal of Mental Imagery, vol. 1, pp. 109-126, 1977.
[19] R. M. Felder and L. K. Silverman, Learning and Teaching Styles in Engineering Education, Engineering Education, vol. 78, no. 7, pp. 674-681, 1988.
[20] B. A. Solomon and R.M. Felder. Index of Learning Styles Questionnaire, 1991. Online: http://www.engr.ncsu.edu/learningstyles/ilsweb.html. [Accessed August 16, 2013].
[21] S. M. Montgomery, Addressing diverse learning styles through the use of multimedia, Frontiers in Education Conference, Proceedings, November 1995, Atlanta, GA, pp. 3a2.13 - 3a2.21, 1995.
[22] R. E. Mayer and L.J. Massa, Three facets of visual and verbal learners: Cognitive ability, cognitive style, and learning preference, Journal of Educational Psychology, vol. 95, no. 4, pp. 833-846, 2003.
[23] D. Ary, L.C. Jacobs, A. Razavieh, and C. Sorensen, Introduction to Research in Education, Thomson Wadsworth, Belmont, CA, 2006.
[24] E. Rutz, and V. Westheider. Learning Styles of Engineering & Engineering Technology Students – Similarities, Differences and Implications for Effective Pedagogy, paper 2006-419, Proceedings of the American Society for Engineering Education Annual Conference & Exhibition, Chicago, IL, June 18-21, 2006.
[25] L. Kober, Reaching Students: What Research Says About Effective Instruction in Undergraduate Science and Engineering, Washington, DC: National Academies Press, 2015.
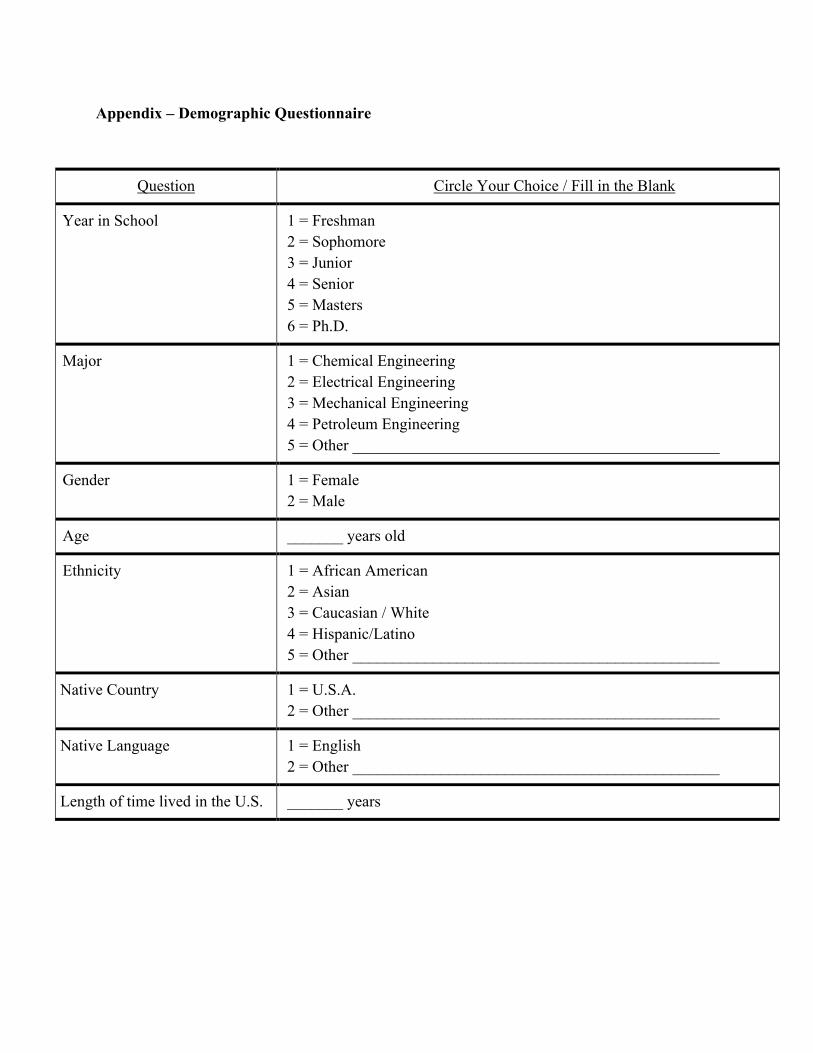
Appendix – Demographic Questionnaire
Question Circle Your Choice / Fill in the Blank
Year in School 1 = Freshman 2 = Sophomore 3 = Junior 4 = Senior 5 = Masters 6 = Ph.D.
Major 1 = Chemical Engineering 2 = Electrical Engineering 3 = Mechanical Engineering 4 = Petroleum Engineering 5 = Other ______________________________________________
Gender 1 = Female 2 = Male
Age _______ years old
Ethnicity 1 = African American 2 = Asian 3 = Caucasian / White 4 = Hispanic/Latino 5 = Other ______________________________________________
Native Country 1 = U.S.A. 2 = Other ______________________________________________
Native Language 1 = English 2 = Other ______________________________________________
Length of time lived in the U.S. _______ years