Embed Size (px)
Citation preview

Learning Session #2
Philadelphia, PAMarch 15, 2012May 22, 2012

Research Team
Dennis McCarty, Ph.D.Raina Croff, Ph.D.
Oregon Health & Science University
Portland, OR
Jay Ford, Ph.D.Kimberly Johnson, MBAUniversity of Wisconsin
NIATxMadison, WI
Mady Chalk, Ph.D.Jack Kemp, MS
Kelly Alanis-Hirsch, Ph.D.Treatment Research Institute
Philadelphia, PA
Laura Schmidt, Ph.D.University of California
Berkley, CA
2
Research Team Roles
Coaching(facilitate adoption of medications,
physician linkages, & change project problem solving)Dennis, Mady, Jack, Kelly, Kim, Jay
Qualitative Evaluation
(Interviews to understand barriers & facilitators)Laura, Raina, Kelly
Quantitative Evaluation
(Examine utilization & expenditure data to compare MAT effectiveness)
All team members
Medication Research Partnership Project
3
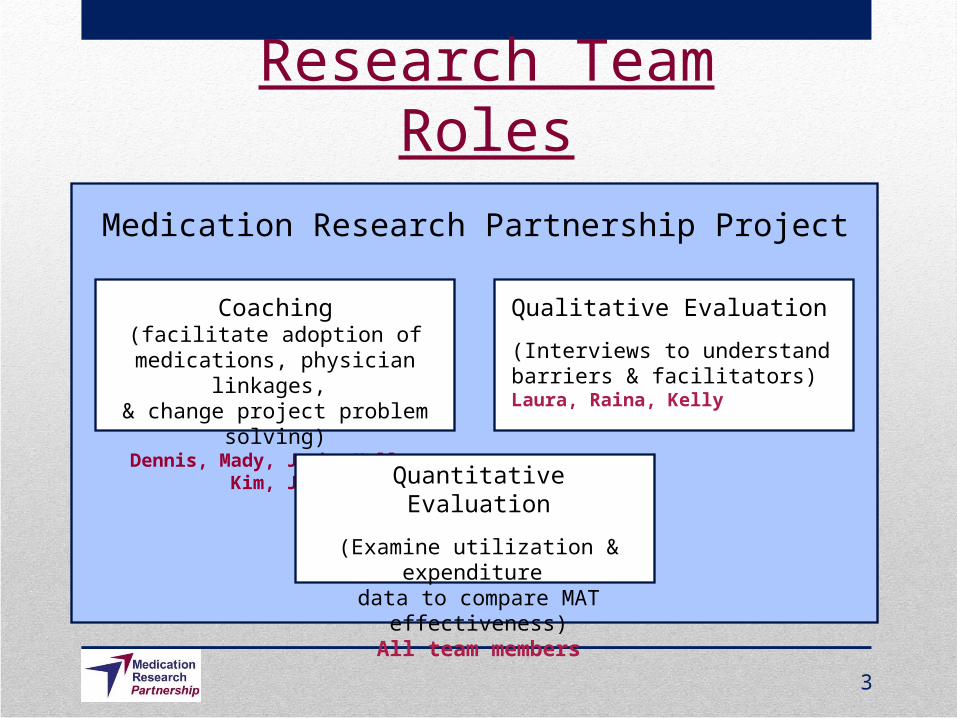
Months 1-7 Months 8-14 Months 15-22 Months 23-41
Oct – May2011 - 2012
Jun – Dec2012
Jan – Aug2013
Sep – Apr2013 - 2015
Change Cycle 1 Change Cycle 2 Change Cycle 3 Follow-up
Learning Session 1 (Oct 2011)
Learning Session 2(May 2012)
Learning Session 3
(TBA)
Learning Session 4
(TBA)
Interview 1 Interviews 2 & 3 Interviews 4 & 5 Interviews 6 &7
Periodic Coaching Calls
Medication Research Partnership Participation Timeline
4
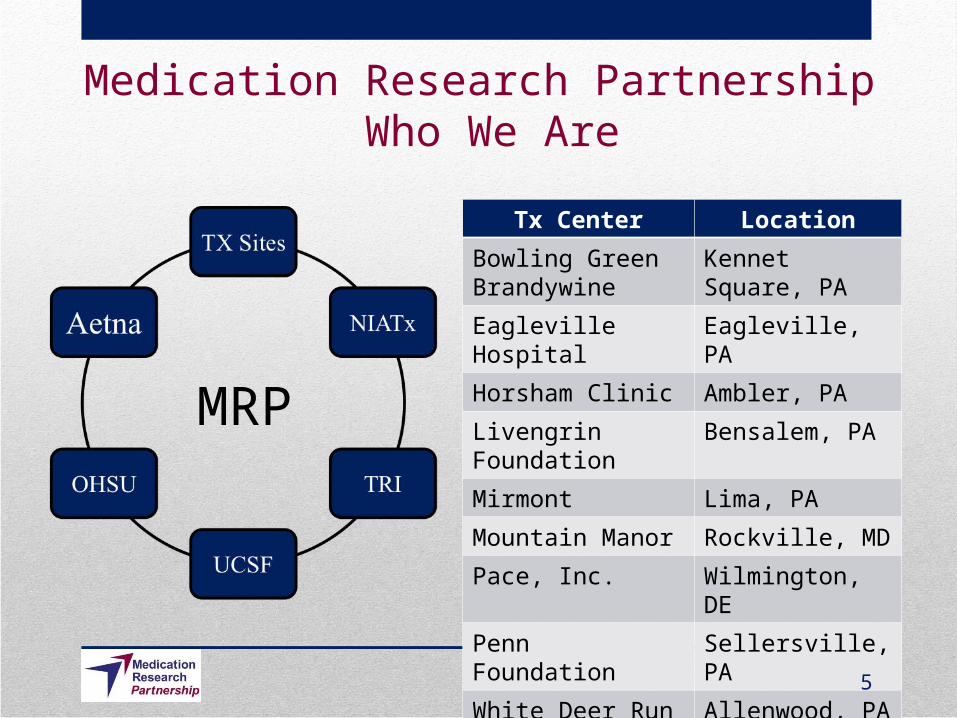
MRP
Tx Center Location
Bowling Green Brandywine
Kennet Square, PA
Eagleville Hospital Eagleville, PA
Horsham Clinic Ambler, PA
Livengrin Foundation Bensalem, PA
Mirmont Lima, PA
Mountain Manor Rockville, MD
Pace, Inc. Wilmington, DE
Penn Foundation Sellersville, PA
White Deer Run Allenwood, PA
Medication Research Partnership Who We Are
5
Medication-Assisted Treatment: Systematic Review and Meta-analysis of Utilization and Cost
Studies
Dennis McCarty, PhD
Medication Research Partnership
Learning Session 2
Philadelphia, PA
May 22, 2012
6
Disclosure and Aim
• A research services agreement with Alkermes supported the analysis (the maker of Vivitrol)
• A systematic review of utilization and cost of health care following pharmacotherapy
• Mark et al. (2010) Am J Managed Care, 879 – 888.
• Baser et al. (2011) Am J Managed Care, S222-S234.
• Baser et al. (2011) Am J Managed Care, S235-S246.
• Bryson et al. (2011) Am J Managed Care, S213-S221.
7
Methods• Electronic literature search and abstract review
• 16 potential studies
• Four included XR-NTX and utilization and cost of care
• A meta-analysis extracted data and estimated overall effects• medication vs. no medication
• compared effects within patients using medication
• Effect measured as standard mean difference
8

Results
• Patients using medication had lower healthcare utilization and cost of care
• XR-NTX patients had more days of medication
• Compared to other medications, XR-NTX was associated with • fewer detoxification days,
• fewer alcohol and drug-related inpatient days
• lower total costs of care
9
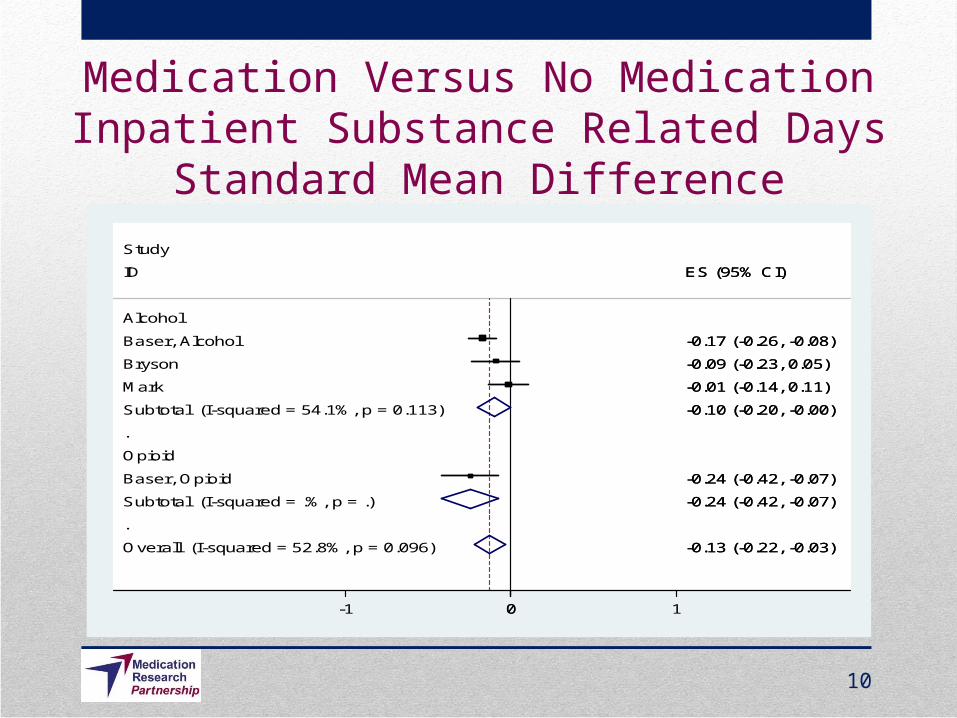
Medication Versus No MedicationInpatient Substance Related Days
Standard Mean Difference
.
.
Overall (I-squared = 52.8%, p = 0.096)
Baser, Opioid
Baser, Alcohol
ID
Opioid
Mark
Subtotal (I-squared = .%, p = .)
Study
Subtotal (I-squared = 54.1%, p = 0.113)
Alcohol
Bryson
-0.13 (-0.22, -0.03)
-0.24 (-0.42, -0.07)
-0.17 (-0.26, -0.08)
ES (95% CI)
-0.01 (-0.14, 0.11)
-0.24 (-0.42, -0.07)
-0.10 (-0.20, -0.00)
-0.09 (-0.23, 0.05)
-0.13 (-0.22, -0.03)
-0.24 (-0.42, -0.07)
-0.17 (-0.26, -0.08)
ES (95% CI)
-0.01 (-0.14, 0.11)
-0.24 (-0.42, -0.07)
-0.10 (-0.20, -0.00)
-0.09 (-0.23, 0.05)
0-1 0 1
10
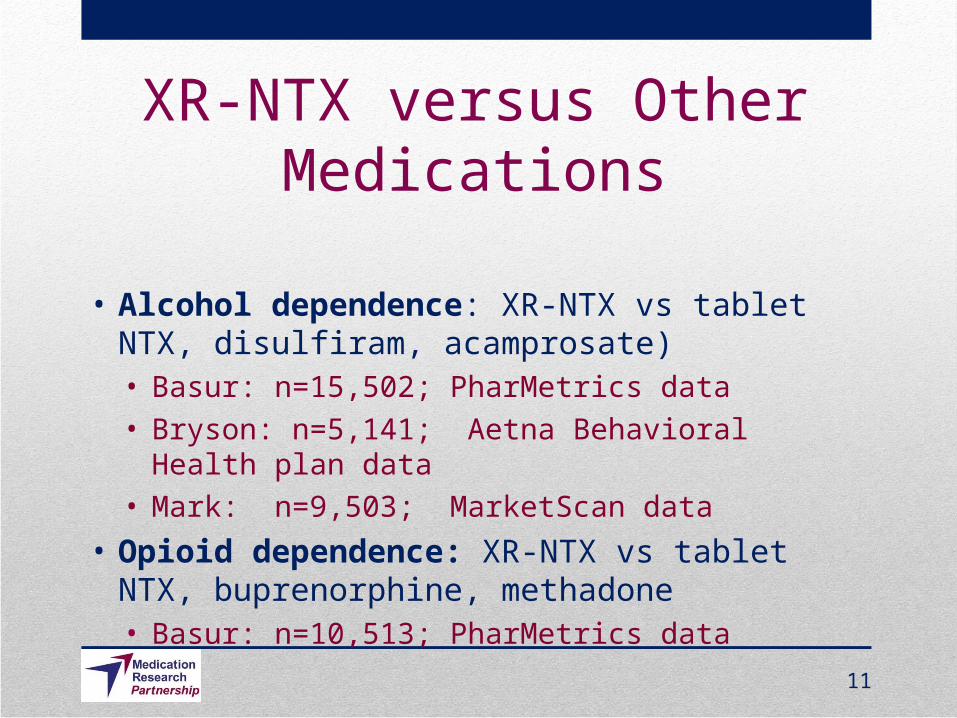
XR-NTX versus Other Medications
• Alcohol dependence: XR-NTX vs tablet NTX, disulfiram, acamprosate)• Basur: n=15,502; PharMetrics data
• Bryson: n=5,141; Aetna Behavioral Health plan data
• Mark: n=9,503; MarketScan data
• Opioid dependence: XR-NTX vs tablet NTX, buprenorphine, methadone• Basur: n=10,513; PharMetrics data
11

Number of Days with Medication Coverage
.
.
Overall (I-squared = 0.0%, p = 0.854)
Subtotal (I-squared = 0.0%, p = 0.723)
Mark
Bryson
Study
Baser, Opioid
Opioid
Alcohol
Subtotal (I-squared = .%, p = .)
Baser, Alcohol
8.38 (5.20, 11.56)
8.57 (5.23, 11.90)
7.20 (-1.24, 15.64)
8.23 (4.27, 12.19)
days covered (95% CI)
6.51 (-4.10, 17.12)
difference in
6.51 (-4.10, 17.12)
11.90 (2.85, 20.95)
8.38 (5.20, 11.56)
8.57 (5.23, 11.90)
7.20 (-1.24, 15.64)
8.23 (4.27, 12.19)
days covered (95% CI)
6.51 (-4.10, 17.12)
difference in
6.51 (-4.10, 17.12)
11.90 (2.85, 20.95)
XR-NTX worse NR-NTX better 0 100
Overall (I-squared = 71.1%, p = 0.031)
Baser
Bryson
Mark
Study
15.08 (5.49, 24.67)
15.84 (3.79, 27.89)
21.85 (14.76, 28.95)
7.20 (-1.10, 15.50)
days covered (95% CI)
difference in
15.08 (5.49, 24.67)
15.84 (3.79, 27.89)
21.85 (14.76, 28.95)
7.20 (-1.10, 15.50)
days covered (95% CI)
difference in
XR-NTX worse NR-NTX better 0 100-10
Tablet Naltrexone Disulfiram
Overall (I-squared = 46.6%, p = 0.154)
Mark
Baser
Study
Bryson
17.84 (10.94, 24.75)
12.60 (5.42, 19.78)
difference in
19.09 (4.56, 33.62)
days covered (95% CI)
22.39 (15.50, 29.28)
17.84 (10.94, 24.75)
12.60 (5.42, 19.78)
difference in
19.09 (4.56, 33.62)
days covered (95% CI)
22.39 (15.50, 29.28)
XR-NTX worse NR-NTX better 0 100-10
Acamprosate
12

Inpatient substance-abuse days*
*Standardized Mean Difference
.
.
Overall (I-squared = 52.8%, p = 0.096)
Subtotal (I-squared = 54.1%, p = 0.113)
Baser, Opioid
Subtotal (I-squared = .%, p = .)
Baser, Alcohol
Bryson
Study
Mark
Alcohol
Opioid
-0.13 (-0.22, -0.03)
-0.10 (-0.20, -0.00)
-0.24 (-0.42, -0.07)
-0.24 (-0.42, -0.07)
-0.17 (-0.26, -0.08)
-0.09 (-0.23, 0.06)
SMD (95% CI)
-0.01 (-0.14, 0.11)
-0.13 (-0.22, -0.03)
-0.10 (-0.20, -0.00)
-0.24 (-0.42, -0.07)
-0.24 (-0.42, -0.07)
-0.17 (-0.26, -0.08)
-0.09 (-0.23, 0.06)
SMD (95% CI)
-0.01 (-0.14, 0.11)
XR-NTX better NR-NTX worse 0-1 0 1
Overall (I-squared = 0.0%, p = 0.425)
Mark
Baser
Study
Bryson
-0.12 (-0.18, -0.06)
-0.07 (-0.18, 0.05)
-0.16 (-0.24, -0.08)
SMD (95% CI)
-0.10 (-0.24, 0.04)
-0.12 (-0.18, -0.06)
-0.07 (-0.18, 0.05)
-0.16 (-0.24, -0.08)
SMD (95% CI)
-0.10 (-0.24, 0.04)
XR-NTX better NR-NTX worse 0-.25 0 .25
Acamprosate
DisulfiramTablet Naltrexone
Overall (I-squared = 29.5%, p = 0.242)
Mark
Bryson
Baser
Study
-0.13 (-0.20, -0.05)
-0.04 (-0.16, 0.08)
-0.15 (-0.30, -0.00)
-0.17 (-0.25, -0.08)
SMD (95% CI)
-0.13 (-0.20, -0.05)
-0.04 (-0.16, 0.08)
-0.15 (-0.30, -0.00)
-0.17 (-0.25, -0.08)
SMD (95% CI)
XR-NTX better NR-NTX worse 0-.25 0 .25
13
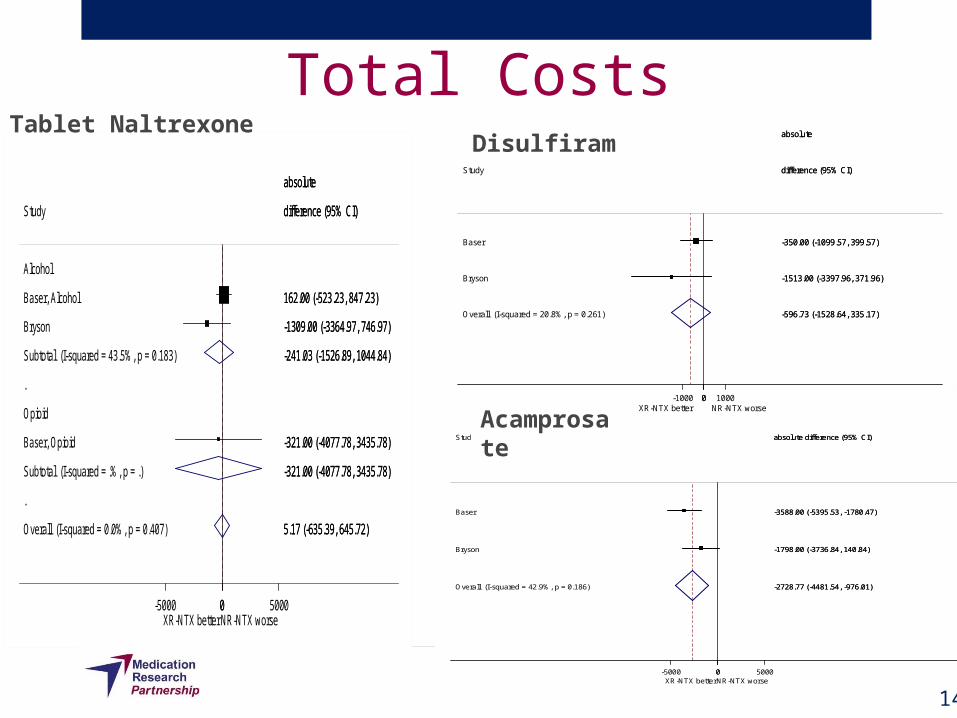
Overall (I-squared = 42.9%, p = 0.186)
Baser
Study
Bryson
-2728.77 (-4481.54, -976.01)
-3588.00 (-5395.53, -1780.47)
absolute difference (95% CI)
-1798.00 (-3736.84, 140.84)
-2728.77 (-4481.54, -976.01)
-3588.00 (-5395.53, -1780.47)
absolute difference (95% CI)
-1798.00 (-3736.84, 140.84)
XR-NTX better NR-NTX worse 0-5000 0 5000
Overall (I-squared = 20.8%, p = 0.261)
Study
Baser
Bryson
-596.73 (-1528.64, 335.17)
difference (95% CI)
-350.00 (-1099.57, 399.57)
-1513.00 (-3397.96, 371.96)
absolute
-596.73 (-1528.64, 335.17)
difference (95% CI)
-350.00 (-1099.57, 399.57)
-1513.00 (-3397.96, 371.96)
absolute
XR-NTX better NR-NTX worse 0-1000 0 1000
Total Costs
.
.
Overall (I-squared = 0.0%, p = 0.407)
Subtotal (I-squared = .%, p = .)
Baser, Opioid
Opioid
Alcohol
Bryson
Subtotal (I-squared = 43.5%, p = 0.183)
Baser, Alcohol
Study
5.17 (-635.39, 645.72)
-321.00 (-4077.78, 3435.78)
-321.00 (-4077.78, 3435.78)
absolute
-1309.00 (-3364.97, 746.97)
-241.03 (-1526.89, 1044.84)
162.00 (-523.23, 847.23)
difference (95% CI)
5.17 (-635.39, 645.72)
-321.00 (-4077.78, 3435.78)
-321.00 (-4077.78, 3435.78)
absolute
-1309.00 (-3364.97, 746.97)
-241.03 (-1526.89, 1044.84)
162.00 (-523.23, 847.23)
difference (95% CI)
XR-NTX better NR-NTX worse 0-5000 0 5000
Tablet Naltrexone
Acamprosate
Disulfiram
14

Discussion & Next Steps
• Patients using medication appear to have fewer detox and inpatient admissions.
• Total costs of care appear to be lower for patients using medication
• XR-NTX was associated with greater savings
• Limitations• Limited numbers of studies
15

Acknowledgements
• Daniel Hartung, Rochell Fu, Katharina Wiest, Mady Chalk, David Gastfriend
• Supported through a research services agreement from Alkermes
• Data presented at the 2012 American Psychiatric Association Annual Meeting
16