Embed Size (px)
Citation preview

Full Terms & Conditions of access and use can be found athttps://www.tandfonline.com/action/journalInformation?journalCode=ymnt21
Mining TechnologyTransactions of the Institutions of Mining and Metallurgy
ISSN: (Print) (Online) Journal homepage: https://www.tandfonline.com/loi/ymnt21
Measuring blast fragmentation at Nui Phao open-pit mine, Vietnam using the Mask R-CNN deeplearning model
Trong Vu, Tran Bao, Quoc Viet Hoang, Carsten Drebenstetd, Pham Van Hoa &Hoang Hung Thang
To cite this article: Trong Vu, Tran Bao, Quoc Viet Hoang, Carsten Drebenstetd, PhamVan Hoa & Hoang Hung Thang (2021): Measuring blast fragmentation at Nui Phao open-pit mine, Vietnam using the Mask R-CNN deep learning model, Mining Technology, DOI:10.1080/25726668.2021.1944458
To link to this article: https://doi.org/10.1080/25726668.2021.1944458
Published online: 30 Jun 2021.
Submit your article to this journal
View related articles
View Crossmark data
Measuring blast fragmentation at Nui Phao open-pit mine, Vietnam using theMask R-CNN deep learning modelTrong Vu a, Tran Baob, Quoc Viet Hoangc, Carsten Drebenstetdd, Pham Van Hoab and Hoang Hung Thanga
aSurface Mining Department, Quang Ninh University of Industry, Dong Trieu, Vietnam; bSurface Mining Department, Hanoi University ofMining and Geology, Hanoi, Vietnam; cSchool of Resources and Safety Engineering, Central South University-Hunan Changsha, Changsha,People’s Republic of China; dSurface Mining Department, TU Bergakademie Freiberg, Freiberg, Germany
ABSTRACTBlast fragmentation size distribution is one of the most critical factors in evaluating the blastingresults and affecting the downstream mining and processing operations in open-pit mines.Image-based methods are widely applied to address the problem but require heavy userinteraction and experience. This study deployed a deep learning model Mask R-CNN todevelop an automatic measurement method of blast fragmentation. The model was trainedusing images captured from real blasting sites in Nui Phao open-pit mine in Vietnam. Thetrained model reported high average precision scores (Intersection over Union, IoU = 0.5)92% and 83% for bounding box and segmentation masks, respectively. The results lay asolid technical basis for the automated measurement of blast fragmentation in open-pit mines.
ARTICLE HISTORYReceived 7 April 2021Revised 8 June 2021Accepted 9 June 2021
KEYWORDSBlast fragmentationmeasurement; open-pitmine; deep learning; image-based method; Mask R-CNN
Introduction
Rock blast fragmentation measurement is the centraltask to evaluate blasting results in the mining industry.This measurement supplies valuable information foroptimising blasting and downstream operations,including digging, loading, hauling, and crushing.For process integration and optimisation methods,measurement of the run of mine fragmentation isessential for model calibration purposes and sub-sequent application in scenario-based simulations(Onederra et al. 2010). Typically, the measurementdeploys cumulative passing size distribution (CDF)or sieving curve to represent muck pile fragmentationcharacteristics after blasting. The CDF curve describesthe sieving analysis using screens with a known meshsize. The screen retains fragments larger than thatmesh size and conversely. The fragments caught oneach screen are then weighed and used to constructthe CDF.
Blasting in mining usually generates a widespreadmuck pile containing thousands of fragments of var-ious sizes and shapes. Whereas quick and accuratemeasurement is essential to analyse blasting fragmen-tation. Direct methods, such as sieving or screening,can give high accurate CDF of blasting fragmentationbut is costly, time-consuming, and inconvenient (Sud-hakar et al. 2006). Prediction methods have beenapplied widely. Some experimental fragmentationmodels, such as Larrson’s equation, SveDeFo formula,or Kuzram model, are indirect methods that evaluatethe blasting fragmentation, but their accuracy is
questioned (Thornton et al., 2001; Chakraborty et al.2004; Siddiqui 2009). Artificial Intelligence has gradu-ally been utilised to predict blast fragmentation size inthe past few years. Many researchers have been appliedmachine learning algorithms such as Support VectorMachine (Shi et al. 2012), fuzzy logic (Monjezi et al.2009), Artificial Neural Network (Kulatilake et al.2010; Sayadi et al. 2013; Enayatollahi et al. 2014) todevelop their predictive fragmentation models. Never-theless, the practicality of these models is a problemdue to the complicated nature of blast parametersinfluencing fragmentation, such as blast design par-ameters, explosive properties, or rock mass properties.
In recent years, computer vision methods based onimage processing have developed and become fam-iliar. They implement the tasks referred to as instancesegmentation, which localises and segments the rockfragments on digital images. Split Desktop, WipFrag,FragScan, and GoldSize are the most popular compu-ter programs operating on these methods (Hunteret al. 1990). Computer vision methods are economi-cally feasible and practical than direct methods. How-ever, they cannot resolve fragments ranging in sizefrom metres down to some microns. Consequently,they merge smaller fragments into larger ones or sep-arate larger ones into smaller ones and result in a stee-per or more uniform CDF than sieving (Hunter et al.1990; Ouchterlony and Sanchidrián 2019; Schenk et al.2019). Although some programmes introduce correc-tion techniques to increase the quality of measure-ment, their results still strongly depend on user
© 2021 Institute of Materials, Minerals and Mining and The AusIMM Published by Taylor & Francis on behalf of the Institute and The AusIMM
CONTACT Trong Vu [email protected] Surface Mining Department, Quang Ninh University of Industry, Yen Tho, Dong Trieu, Quang Ninh,Vietnam
MINING TECHNOLOGYhttps://doi.org/10.1080/25726668.2021.1944458
intervention, expert knowledge, and the form of imageacquisition (Thornton et al., 2001; Chakraborty et al.2004). Onederra et al. (2015) introduced 3D high-res-olution laser scanning as an alternative technique tomeasure blast fragmentation and to improve 2D ima-ging systems. However, this method needs a highinitial investment in hardware and training workersto operate the scanner and software.
In the past decade, computer vision has evolveddramatically using machine learning methods. Theprimary idea is to use deep learning frameworkstrained using a massive volume of image data collectedthrough sensors or the internet to understand pre-cisely which real-word object makes up an image.Deep learning models like Fast/Faster R-CNN (Gir-shick 2015; Ren et al. 2015) and Fully ConvolutionalNetwork (FCN) (Long et al. 2015) are the core systemsfor segmentation and localisation of objects in theimage, respectively. For example, DeepMask (Pinheiroet al. 2015), SharpMask (Pinheiro et al. 2016), and thefollowing work (Dai et al. 2016) use Region-BasedConvolutional Neural Networks (R-CNN) to segmentobjects and then Fast-RCNN to classify them. Daiet al. (2016) also proposed three hierarchical stages,including bounding-box proposals, segmentation,and classification. The problem with all these methodsis slow and less accurate because of the distinct orsequential implementation of these detection steps.
Recently, Li et al. (2017) merged segment proposalsand object detection in a system named ‘fully convolu-tional instance segmentation’ (FCIS) to fully convolu-tionally predict a set of position-sensitive outputchannels. Solving object class, boxes, and masks inone step make the system fast. Nevertheless, FCISexposes the problem with overlapping instances andpseudo edges.
The deep learning model Mask R-CNN (He et al.2017) is considered a state-of-art algorithm and out-performs others in the instance segmentation pro-blem. It has shown that superior performance in
natural object detection, but studies using Mask R-CNN in blasting fragmentation analysis is minimal.This application was first used by Fabian Schenket al. (2019) to analyse the distribution of rock frag-ments in the blasting muck pile. The input image data-set was collected and trained in the laboratory beforebeing tested on real-world large UAV images. Theexperiments were promising, but the accuracy indetecting small fragments need to be improved.
Our study explores the deep learning model MaskR-CNN to automatically and quickly measure blastfragmentation at a low cost. We trained the Mask R-CNNmodel only using annotation from digital imagescollected directly on mine sites and then conducted aninference to generate the final segmentation image.The trained Mask R-CNN was evaluated using twostandard metrics in object detection to highlight theperformance. Furthermore, the method is comparedwith the SplitDesktop software to assess the accuracy.
The paper proceeds as follows. Section ‘Nui Phaoopen-pit mine, Vietnam’ describes the study area,where Section ‘Methodology’ proposes the usedmethod for blast fragmentation measurement. Section‘Results’ presents the results. Discussion in section‘Discussion’ and conclusion in section ‘Conclusions’complete the paper.
Nui Phao open-pit mine, Vietnam
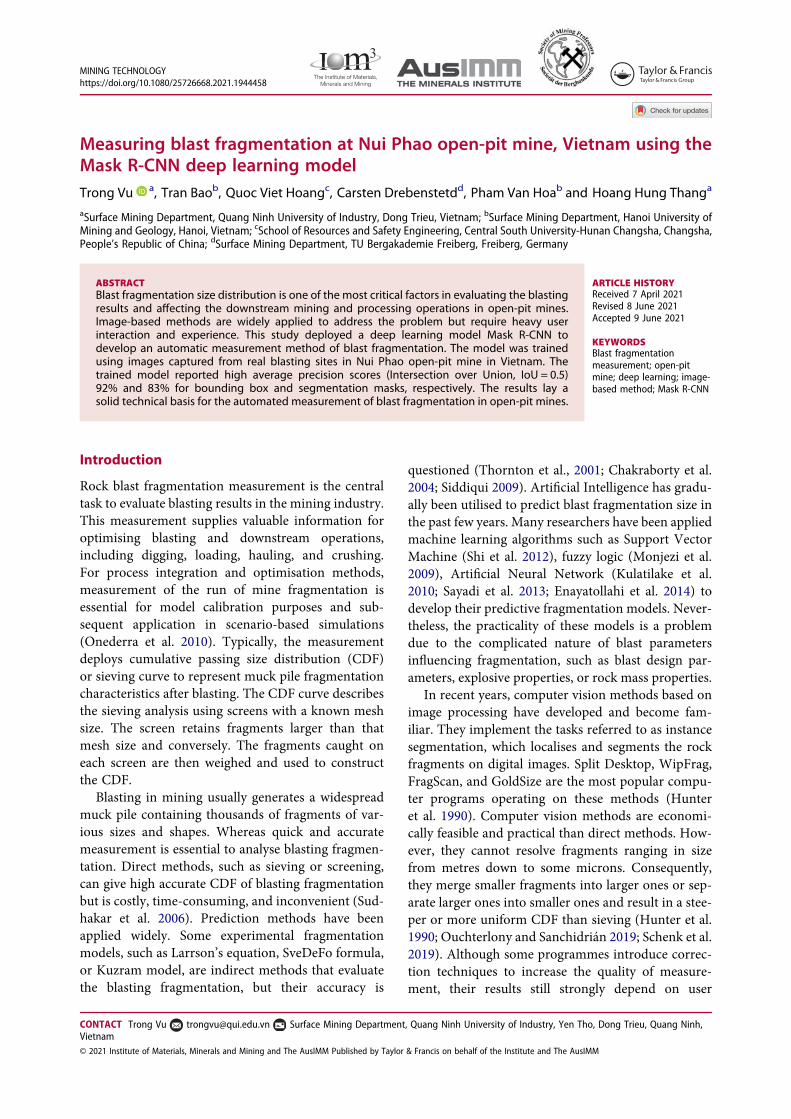
Nui Phao mine is located in the northern part of Viet-nam in Thai Nguyen province, approximately 80 kmnorthwest of Hanoi capital by road. The mine rep-resents one of the world’s largest identified tungstenreserve outside China. Nui Phao is a typical open-pitmine extracting 6.5 million m3 materials with about3.7 million ore in 2017. Of this, 3.5 m3 required blast-ing. Figure 1 presents the location of the mine and theoverview of its mining site.
The mine applies the bench blasting technique forbreaking waste rock and ore. To measure the blast
Figure 1. Location and mining site of Nui Phao open-pit mine. ‘Images are available in colour online.’
2 T. VU ET AL.
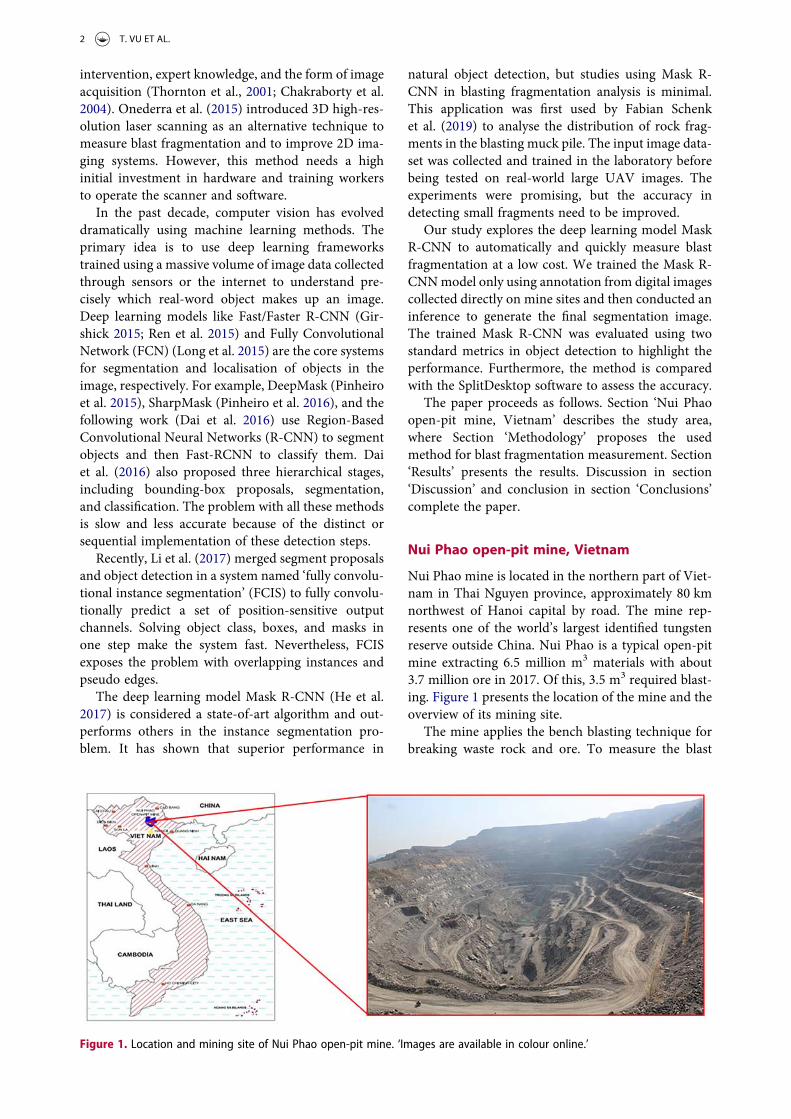
fragmentation, the images are captured from the front,middle and back sections of each blast muck pile toensure that the size distributions in the images rep-resent the muck pile as a whole. Split Desktop (SplitEngineering LLC 2016) is then deployed to digitalisedthe images and produce the CDF. The capture ofimages for blast fragmentation measurement is illus-trated in Figure 2.
Methodology
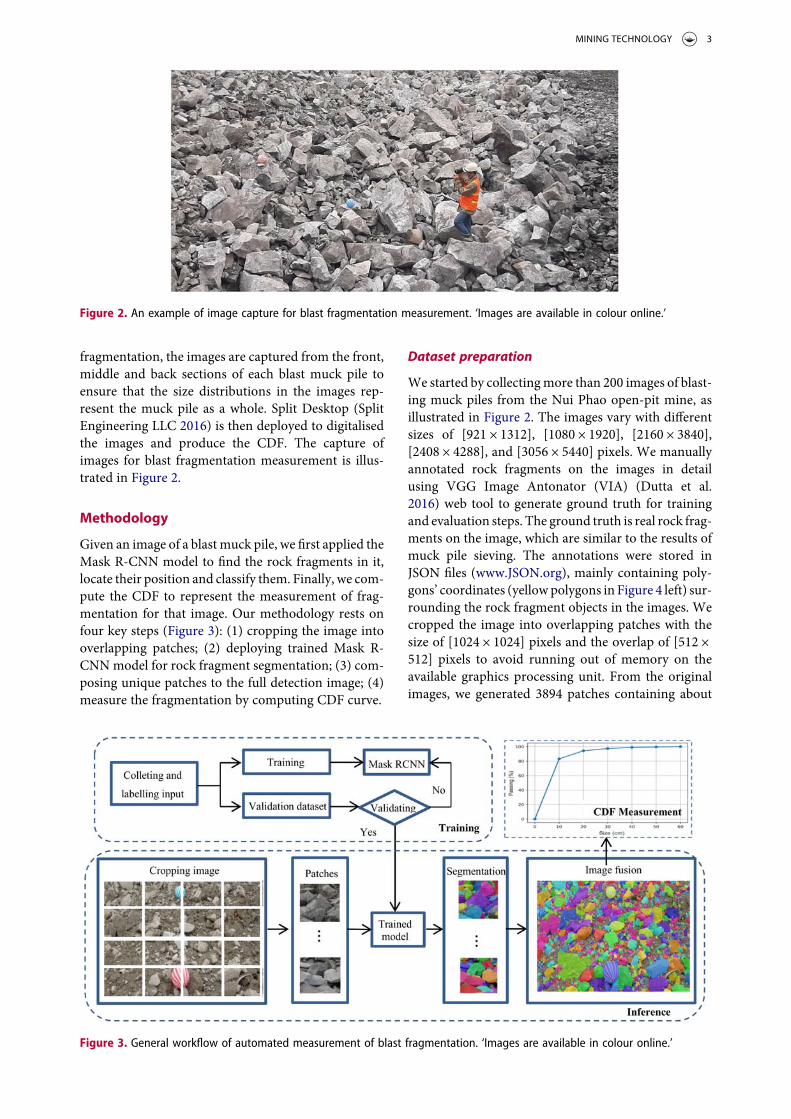
Given an image of a blast muck pile, we first applied theMask R-CNN model to find the rock fragments in it,locate their position and classify them. Finally, we com-pute the CDF to represent the measurement of frag-mentation for that image. Our methodology rests onfour key steps (Figure 3): (1) cropping the image intooverlapping patches; (2) deploying trained Mask R-CNNmodel for rock fragment segmentation; (3) com-posing unique patches to the full detection image; (4)measure the fragmentation by computing CDF curve.
Dataset preparation
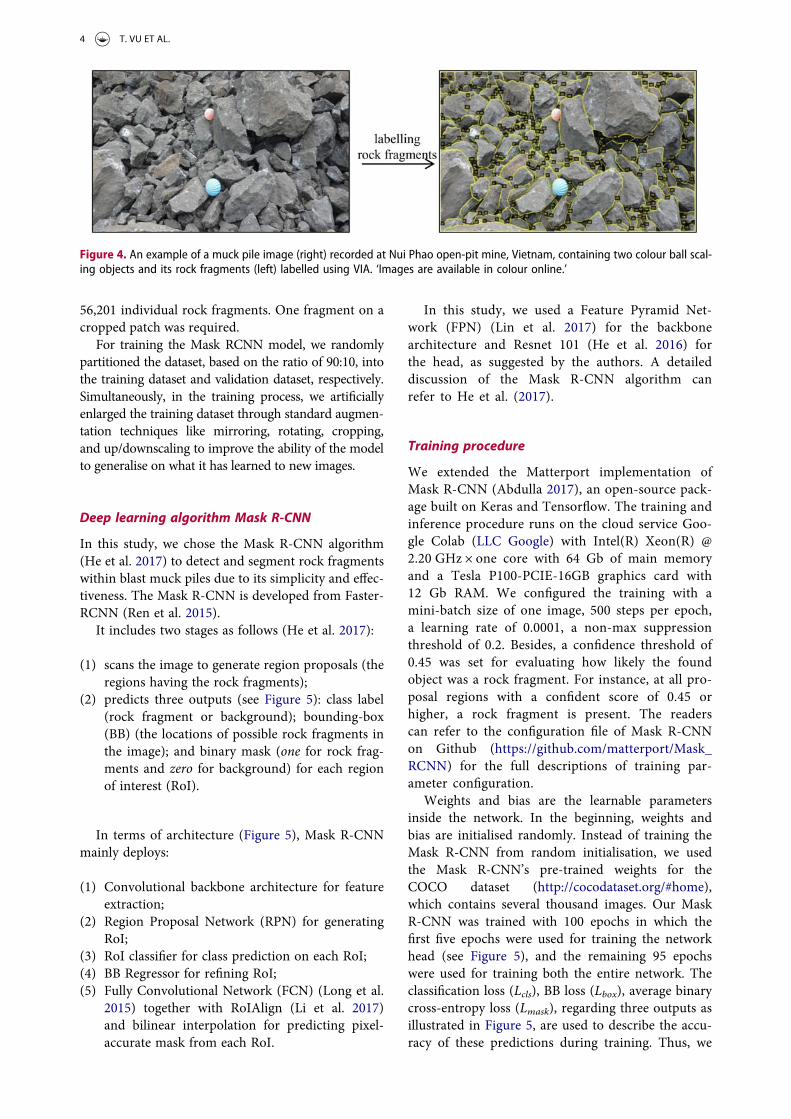
We started by collectingmore than 200 images of blast-ing muck piles from the Nui Phao open-pit mine, asillustrated in Figure 2. The images vary with differentsizes of [921 × 1312], [1080 × 1920], [2160 × 3840],[2408 × 4288], and [3056 × 5440] pixels. We manuallyannotated rock fragments on the images in detailusing VGG Image Antonator (VIA) (Dutta et al.2016) web tool to generate ground truth for trainingand evaluation steps. The ground truth is real rock frag-ments on the image, which are similar to the results ofmuck pile sieving. The annotations were stored inJSON files (www.JSON.org), mainly containing poly-gons’ coordinates (yellowpolygons in Figure 4 left) sur-rounding the rock fragment objects in the images. Wecropped the image into overlapping patches with thesize of [1024 × 1024] pixels and the overlap of [512 ×512] pixels to avoid running out of memory on theavailable graphics processing unit. From the originalimages, we generated 3894 patches containing about
Figure 2. An example of image capture for blast fragmentation measurement. ‘Images are available in colour online.’
Figure 3. General workflow of automated measurement of blast fragmentation. ‘Images are available in colour online.’
MINING TECHNOLOGY 3
56,201 individual rock fragments. One fragment on acropped patch was required.
For training the Mask RCNN model, we randomlypartitioned the dataset, based on the ratio of 90:10, intothe training dataset and validation dataset, respectively.Simultaneously, in the training process, we artificiallyenlarged the training dataset through standard augmen-tation techniques like mirroring, rotating, cropping,and up/downscaling to improve the ability of the modelto generalise on what it has learned to new images.
Deep learning algorithm Mask R-CNN
In this study, we chose the Mask R-CNN algorithm(He et al. 2017) to detect and segment rock fragmentswithin blast muck piles due to its simplicity and effec-tiveness. The Mask R-CNN is developed from Faster-RCNN (Ren et al. 2015).
It includes two stages as follows (He et al. 2017):
(1) scans the image to generate region proposals (theregions having the rock fragments);
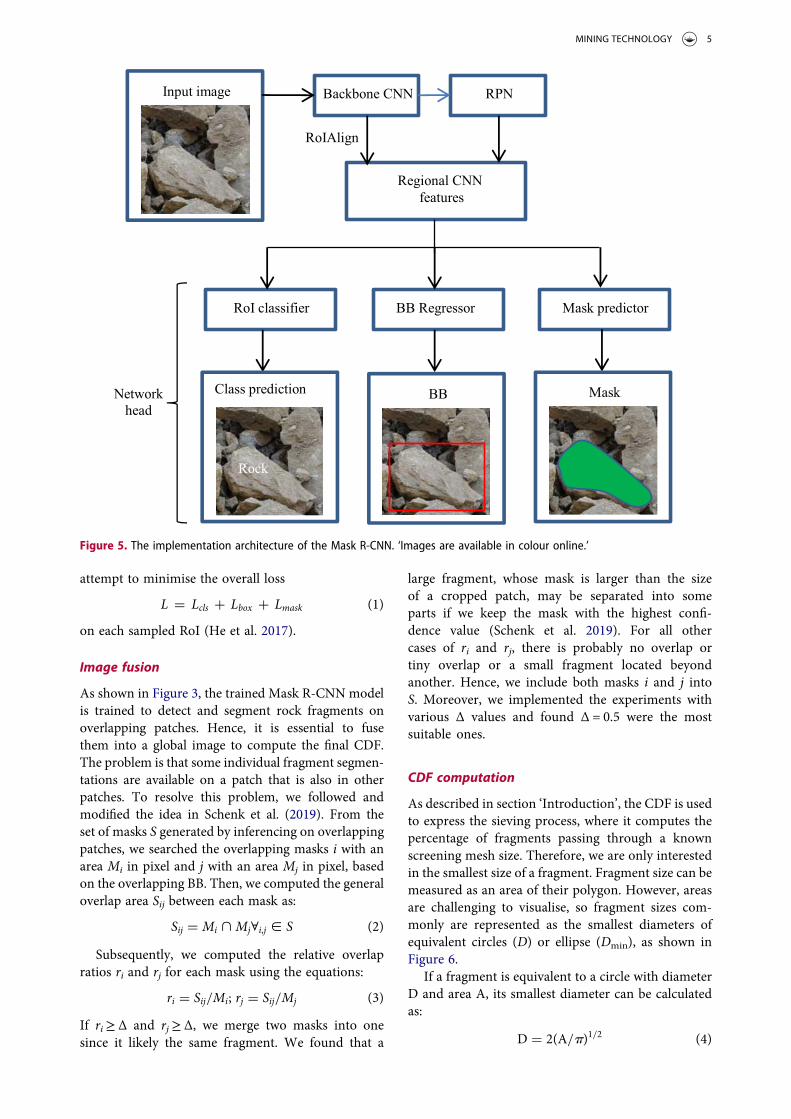
(2) predicts three outputs (see Figure 5): class label(rock fragment or background); bounding-box(BB) (the locations of possible rock fragments inthe image); and binary mask (one for rock frag-ments and zero for background) for each regionof interest (RoI).
In terms of architecture (Figure 5), Mask R-CNNmainly deploys:
(1) Convolutional backbone architecture for featureextraction;
(2) Region Proposal Network (RPN) for generatingRoI;
(3) RoI classifier for class prediction on each RoI;(4) BB Regressor for refining RoI;(5) Fully Convolutional Network (FCN) (Long et al.
2015) together with RoIAlign (Li et al. 2017)and bilinear interpolation for predicting pixel-accurate mask from each RoI.
In this study, we used a Feature Pyramid Net-work (FPN) (Lin et al. 2017) for the backbonearchitecture and Resnet 101 (He et al. 2016) forthe head, as suggested by the authors. A detaileddiscussion of the Mask R-CNN algorithm canrefer to He et al. (2017).
Training procedure
We extended the Matterport implementation ofMask R-CNN (Abdulla 2017), an open-source pack-age built on Keras and Tensorflow. The training andinference procedure runs on the cloud service Goo-gle Colab (LLC Google) with Intel(R) Xeon(R) @2.20 GHz × one core with 64 Gb of main memoryand a Tesla P100-PCIE-16GB graphics card with12 Gb RAM. We configured the training with amini-batch size of one image, 500 steps per epoch,a learning rate of 0.0001, a non-max suppressionthreshold of 0.2. Besides, a confidence threshold of0.45 was set for evaluating how likely the foundobject was a rock fragment. For instance, at all pro-posal regions with a confident score of 0.45 orhigher, a rock fragment is present. The readerscan refer to the configuration file of Mask R-CNNon Github (https://github.com/matterport/Mask_RCNN) for the full descriptions of training par-ameter configuration.
Weights and bias are the learnable parametersinside the network. In the beginning, weights andbias are initialised randomly. Instead of training theMask R-CNN from random initialisation, we usedthe Mask R-CNN’s pre-trained weights for theCOCO dataset (http://cocodataset.org/#home),which contains several thousand images. Our MaskR-CNN was trained with 100 epochs in which thefirst five epochs were used for training the networkhead (see Figure 5), and the remaining 95 epochswere used for training both the entire network. Theclassification loss (Lcls), BB loss (Lbox), average binarycross-entropy loss (Lmask), regarding three outputs asillustrated in Figure 5, are used to describe the accu-racy of these predictions during training. Thus, we
Figure 4. An example of a muck pile image (right) recorded at Nui Phao open-pit mine, Vietnam, containing two colour ball scal-ing objects and its rock fragments (left) labelled using VIA. ‘Images are available in colour online.’
4 T. VU ET AL.
attempt to minimise the overall loss
L = Lcls + Lbox + Lmask (1)
on each sampled RoI (He et al. 2017).
Image fusion
As shown in Figure 3, the trained Mask R-CNNmodelis trained to detect and segment rock fragments onoverlapping patches. Hence, it is essential to fusethem into a global image to compute the final CDF.The problem is that some individual fragment segmen-tations are available on a patch that is also in otherpatches. To resolve this problem, we followed andmodified the idea in Schenk et al. (2019). From theset of masks S generated by inferencing on overlappingpatches, we searched the overlapping masks i with anarea Mi in pixel and j with an area Mj in pixel, basedon the overlapping BB. Then, we computed the generaloverlap area Sij between each mask as:
Sij = Mi >Mj∀i,j [ S (2)
Subsequently, we computed the relative overlapratios ri and rj for each mask using the equations:
ri = Sij/Mi; rj = Sij/Mj (3)
If ri≥ Δ and rj≥ Δ, we merge two masks into onesince it likely the same fragment. We found that a
large fragment, whose mask is larger than the sizeof a cropped patch, may be separated into someparts if we keep the mask with the highest confi-dence value (Schenk et al. 2019). For all othercases of ri and rj, there is probably no overlap ortiny overlap or a small fragment located beyondanother. Hence, we include both masks i and j intoS. Moreover, we implemented the experiments withvarious Δ values and found Δ = 0.5 were the mostsuitable ones.
CDF computation
As described in section ‘Introduction’, the CDF is usedto express the sieving process, where it computes thepercentage of fragments passing through a knownscreening mesh size. Therefore, we are only interestedin the smallest size of a fragment. Fragment size can bemeasured as an area of their polygon. However, areasare challenging to visualise, so fragment sizes com-monly are represented as the smallest diameters ofequivalent circles (D) or ellipse (Dmin), as shown inFigure 6.
If a fragment is equivalent to a circle with diameterD and area A, its smallest diameter can be calculatedas:
D = 2(A/p)1/2 (4)
Figure 5. The implementation architecture of the Mask R-CNN. ‘Images are available in colour online.’
MINING TECHNOLOGY 5
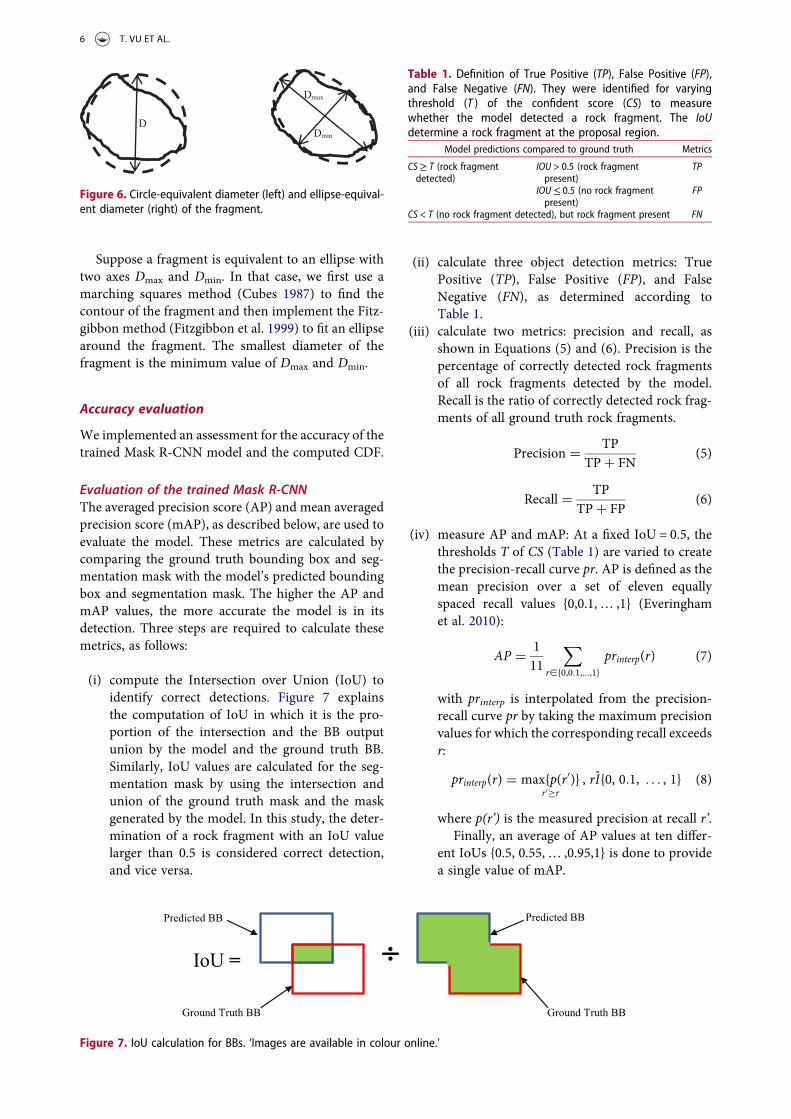
Suppose a fragment is equivalent to an ellipse withtwo axes Dmax and Dmin. In that case, we first use amarching squares method (Cubes 1987) to find thecontour of the fragment and then implement the Fitz-gibbon method (Fitzgibbon et al. 1999) to fit an ellipsearound the fragment. The smallest diameter of thefragment is the minimum value of Dmax and Dmin.
Accuracy evaluation
We implemented an assessment for the accuracy of thetrained Mask R-CNN model and the computed CDF.
Evaluation of the trained Mask R-CNNThe averaged precision score (AP) and mean averagedprecision score (mAP), as described below, are used toevaluate the model. These metrics are calculated bycomparing the ground truth bounding box and seg-mentation mask with the model’s predicted boundingbox and segmentation mask. The higher the AP andmAP values, the more accurate the model is in itsdetection. Three steps are required to calculate thesemetrics, as follows:
(i) compute the Intersection over Union (IoU) toidentify correct detections. Figure 7 explainsthe computation of IoU in which it is the pro-portion of the intersection and the BB outputunion by the model and the ground truth BB.Similarly, IoU values are calculated for the seg-mentation mask by using the intersection andunion of the ground truth mask and the maskgenerated by the model. In this study, the deter-mination of a rock fragment with an IoU valuelarger than 0.5 is considered correct detection,and vice versa.
(ii) calculate three object detection metrics: TruePositive (TP), False Positive (FP), and FalseNegative (FN), as determined according toTable 1.
(iii) calculate two metrics: precision and recall, asshown in Equations (5) and (6). Precision is thepercentage of correctly detected rock fragmentsof all rock fragments detected by the model.Recall is the ratio of correctly detected rock frag-ments of all ground truth rock fragments.
Precision = TPTP+ FN
(5)
Recall = TPTP+ FP
(6)
(iv) measure AP and mAP: At a fixed IoU = 0.5, thethresholds T of CS (Table 1) are varied to createthe precision-recall curve pr. AP is defined as themean precision over a set of eleven equallyspaced recall values {0,0.1,… ,1} (Everinghamet al. 2010):
AP = 111
∑
r[{0,0.1,...,1}
printerp(r) (7)
with printerp is interpolated from the precision-recall curve pr by taking the maximum precisionvalues for which the corresponding recall exceedsr:
printerp(r) = max{p(r′)}r′≥r
, rI{0, 0.1, . . . , 1} (8)
where p(r’) is the measured precision at recall r’.Finally, an average of AP values at ten differ-
ent IoUs {0.5, 0.55,… ,0.95,1} is done to providea single value of mAP.
Figure 6. Circle-equivalent diameter (left) and ellipse-equival-ent diameter (right) of the fragment.
Figure 7. IoU calculation for BBs. ‘Images are available in colour online.’
Table 1. Definition of True Positive (TP), False Positive (FP),and False Negative (FN). They were identified for varyingthreshold (T ) of the confident score (CS) to measurewhether the model detected a rock fragment. The IoUdetermine a rock fragment at the proposal region.
Model predictions compared to ground truth Metrics
CS≥ T (rock fragmentdetected)
IOU > 0.5 (rock fragmentpresent)
TP
IOU≤ 0.5 (no rock fragmentpresent)
FP
CS < T (no rock fragment detected), but rock fragment present FN
6 T. VU ET AL.
Evaluation of CDF measurementWe compared our measurement method to the com-mercial SplitDesktop software to evaluate fragmenta-tion results. SplitDesktop was set to automaticallydelineates rock fragments using its image filter. Sincethe SplitDesktop approximates the rock fragments aselliptical objects (La Rosa et al. 2001), we also appliedthis strategy to compute the CDF sieving curve, as dis-cussed in section ‘CDF computation’.
Results
Training optimisation
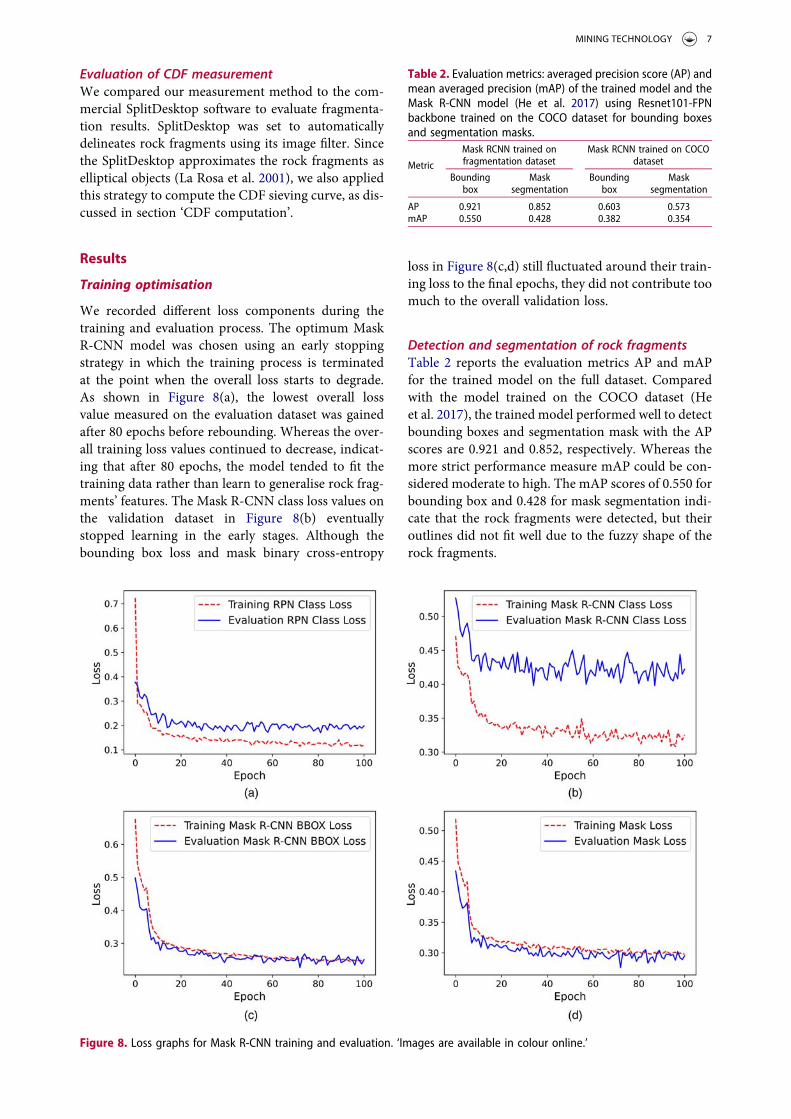
We recorded different loss components during thetraining and evaluation process. The optimum MaskR-CNN model was chosen using an early stoppingstrategy in which the training process is terminatedat the point when the overall loss starts to degrade.As shown in Figure 8(a), the lowest overall lossvalue measured on the evaluation dataset was gainedafter 80 epochs before rebounding. Whereas the over-all training loss values continued to decrease, indicat-ing that after 80 epochs, the model tended to fit thetraining data rather than learn to generalise rock frag-ments’ features. The Mask R-CNN class loss values onthe validation dataset in Figure 8(b) eventuallystopped learning in the early stages. Although thebounding box loss and mask binary cross-entropy
loss in Figure 8(c,d) still fluctuated around their train-ing loss to the final epochs, they did not contribute toomuch to the overall validation loss.
Detection and segmentation of rock fragmentsTable 2 reports the evaluation metrics AP and mAPfor the trained model on the full dataset. Comparedwith the model trained on the COCO dataset (Heet al. 2017), the trained model performed well to detectbounding boxes and segmentation mask with the APscores are 0.921 and 0.852, respectively. Whereas themore strict performance measure mAP could be con-sidered moderate to high. The mAP scores of 0.550 forbounding box and 0.428 for mask segmentation indi-cate that the rock fragments were detected, but theiroutlines did not fit well due to the fuzzy shape of therock fragments.
Figure 8. Loss graphs for Mask R-CNN training and evaluation. ‘Images are available in colour online.’
Table 2. Evaluation metrics: averaged precision score (AP) andmean averaged precision (mAP) of the trained model and theMask R-CNN model (He et al. 2017) using Resnet101-FPNbackbone trained on the COCO dataset for bounding boxesand segmentation masks.
Metric
Mask RCNN trained onfragmentation dataset
Mask RCNN trained on COCOdataset
Boundingbox
Masksegmentation
Boundingbox
Masksegmentation
AP 0.921 0.852 0.603 0.573mAP 0.550 0.428 0.382 0.354
MINING TECHNOLOGY 7

Fragmentation measurementWe conducted case studies from the validation datasetwith different fragment sizes and compositions to evalu-ate the accuracyof themeasurementmethod. In total,wetested four typical image scenes: (1) boulder rock image;(2) densely packed rock image; (3) coloured rock textureimage; (4) dust mixing with rocks image. We comparedour measurement method to the commercial SplitDesk-top software to evaluate fragmentation results.
(1) Boulder rock image
This case study illustrates a fragmentation measure-ment result on the boulder rock image (Figure 9(a)).Figure 9(d) shows our fragmentation measurementusing the Mask R-CNN model was close to the CDFcomputed on ground truth. As shown in Figure 9(c,d), the CDF caused by SplitDesktop was steeper inthe upper part where the large fragments tend to beseparated into smaller pieces, while it was more gentlein the lower part where the small fragments weremerged into larger ones. The trained Mask R-CNNmodel (Figure 9(b)) successfully detected small frag-ments (smaller than 20 cm). The error occurred forthe larger fragments, likely due to the image fusionprocess used to join the image cropping patches.
(2) Densely packed rock image
In case study 2, the number of fragments on the imageincreased significantly (Figure 10(a)). Figure 10(d)
shows that the CDF computed by our measurementwas slightly different from the ground truth. Similarto case study 1, SplitDesktop regularly merged smallerfragments into larger ones, making its CDF utterlydifferent from the ground truth, as shown in Figures10(c,d). Therefore, it requires a tedious effort to editthe delineation manually.
(3) Coloured rock texture image
In case study 3, we continue to test our measurementon a rock image containing rock fragments with var-ious colour texture (Figure 11(a)). Consequently, theeffect of rock texture did not dramatically affect thetrained Mask R-CNN’s performance (Figure 11(b)).In contrast, SplitDesktop merged adjacent fragmentswith the same colour into larger ones (Figure 11(c))and generated a more gentle CDF curve than theground truth (Figure 11(d)).
(4) Dust mixing with rocks image
In Figure 12(a), the whole rock image is not fully occu-pied by the fragments. Parts of non-fragments regionsare background or covered by dust. Based on theground truth image observation, the trained MaskR-CNN was challenging to detect the fragments cov-ered by the dust, even though they can be distin-guished by human vision. In Figure 12(b,c), thetrained Mask R-CNN could determine fore and
Figure 9. Prediction results of boulder rock fragments usingMaskR-CNNmodel and SplitDesktop. ‘Images areavailable in colour online.’
8 T. VU ET AL.

Figure 10. Prediction results of densely packed rock fragments using Mask R-CNN model and SplitDesktop. ‘Images are availablein colour online.’
Figure 11. Prediction results of coloured rock texture image using Mask R-CNN model and SplitDesktop. ‘Images are available incolour online.’
MINING TECHNOLOGY 9
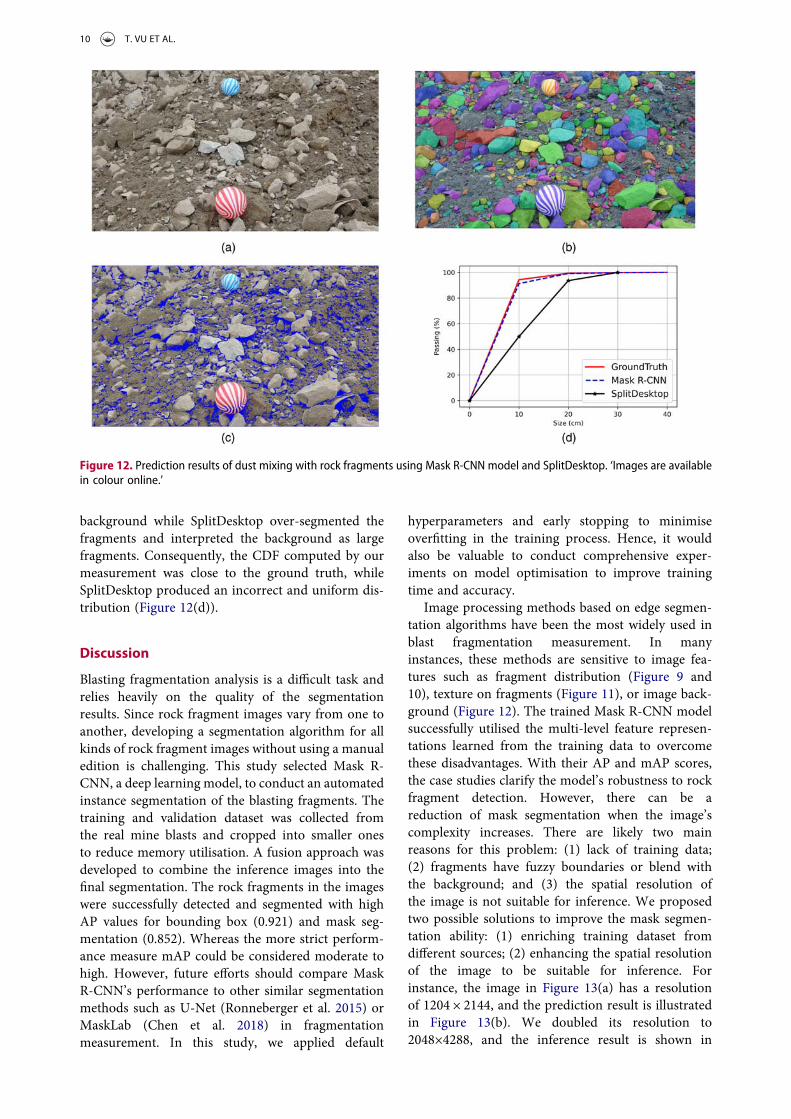
background while SplitDesktop over-segmented thefragments and interpreted the background as largefragments. Consequently, the CDF computed by ourmeasurement was close to the ground truth, whileSplitDesktop produced an incorrect and uniform dis-tribution (Figure 12(d)).
Discussion
Blasting fragmentation analysis is a difficult task andrelies heavily on the quality of the segmentationresults. Since rock fragment images vary from one toanother, developing a segmentation algorithm for allkinds of rock fragment images without using a manualedition is challenging. This study selected Mask R-CNN, a deep learning model, to conduct an automatedinstance segmentation of the blasting fragments. Thetraining and validation dataset was collected fromthe real mine blasts and cropped into smaller onesto reduce memory utilisation. A fusion approach wasdeveloped to combine the inference images into thefinal segmentation. The rock fragments in the imageswere successfully detected and segmented with highAP values for bounding box (0.921) and mask seg-mentation (0.852). Whereas the more strict perform-ance measure mAP could be considered moderate tohigh. However, future efforts should compare MaskR-CNN’s performance to other similar segmentationmethods such as U-Net (Ronneberger et al. 2015) orMaskLab (Chen et al. 2018) in fragmentationmeasurement. In this study, we applied default
hyperparameters and early stopping to minimiseoverfitting in the training process. Hence, it wouldalso be valuable to conduct comprehensive exper-iments on model optimisation to improve trainingtime and accuracy.
Image processing methods based on edge segmen-tation algorithms have been the most widely used inblast fragmentation measurement. In manyinstances, these methods are sensitive to image fea-tures such as fragment distribution (Figure 9 and10), texture on fragments (Figure 11), or image back-ground (Figure 12). The trained Mask R-CNN modelsuccessfully utilised the multi-level feature represen-tations learned from the training data to overcomethese disadvantages. With their AP and mAP scores,the case studies clarify the model’s robustness to rockfragment detection. However, there can be areduction of mask segmentation when the image’scomplexity increases. There are likely two mainreasons for this problem: (1) lack of training data;(2) fragments have fuzzy boundaries or blend withthe background; and (3) the spatial resolution ofthe image is not suitable for inference. We proposedtwo possible solutions to improve the mask segmen-tation ability: (1) enriching training dataset fromdifferent sources; (2) enhancing the spatial resolutionof the image to be suitable for inference. Forinstance, the image in Figure 13(a) has a resolutionof 1204 × 2144, and the prediction result is illustratedin Figure 13(b). We doubled its resolution to2048×4288, and the inference result is shown in
Figure 12. Prediction results of dust mixing with rock fragments using Mask R-CNN model and SplitDesktop. ‘Images are availablein colour online.’
10 T. VU ET AL.
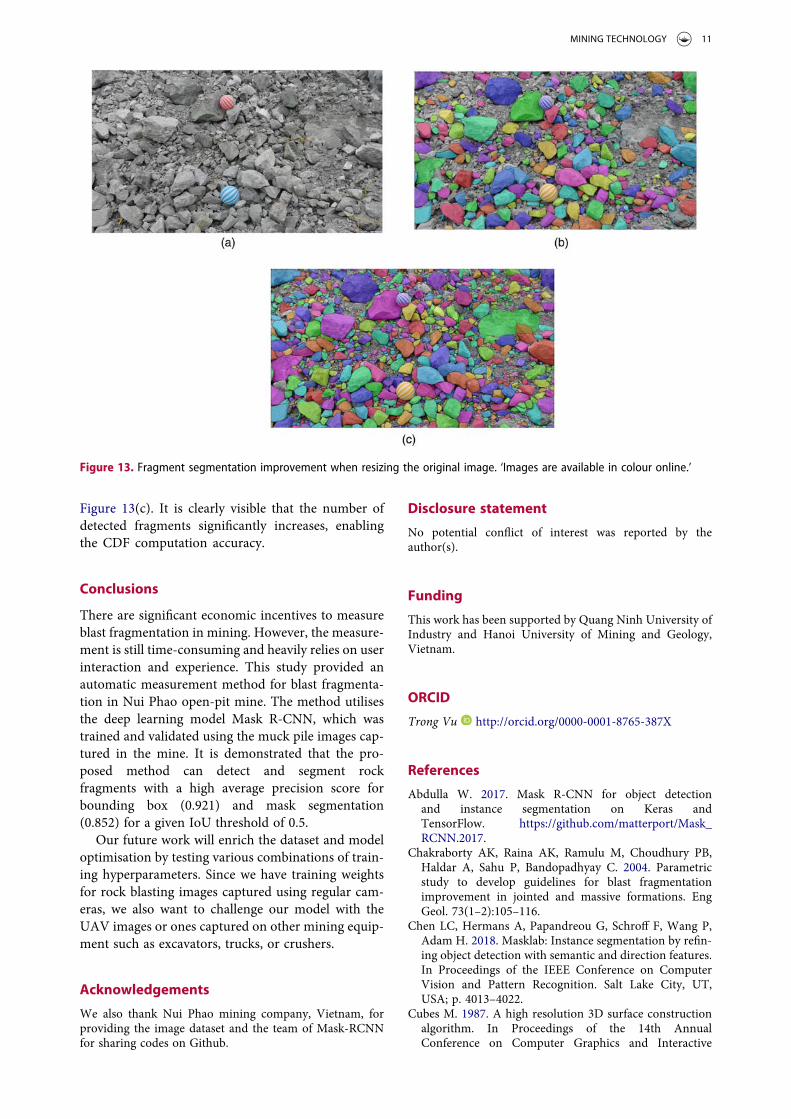
Figure 13(c). It is clearly visible that the number ofdetected fragments significantly increases, enablingthe CDF computation accuracy.
Conclusions
There are significant economic incentives to measureblast fragmentation in mining. However, the measure-ment is still time-consuming and heavily relies on userinteraction and experience. This study provided anautomatic measurement method for blast fragmenta-tion in Nui Phao open-pit mine. The method utilisesthe deep learning model Mask R-CNN, which wastrained and validated using the muck pile images cap-tured in the mine. It is demonstrated that the pro-posed method can detect and segment rockfragments with a high average precision score forbounding box (0.921) and mask segmentation(0.852) for a given IoU threshold of 0.5.
Our future work will enrich the dataset and modeloptimisation by testing various combinations of train-ing hyperparameters. Since we have training weightsfor rock blasting images captured using regular cam-eras, we also want to challenge our model with theUAV images or ones captured on other mining equip-ment such as excavators, trucks, or crushers.
Acknowledgements
We also thank Nui Phao mining company, Vietnam, forproviding the image dataset and the team of Mask-RCNNfor sharing codes on Github.
Disclosure statement
No potential conflict of interest was reported by theauthor(s).
Funding
This work has been supported by Quang Ninh University ofIndustry and Hanoi University of Mining and Geology,Vietnam.
ORCID
Trong Vu http://orcid.org/0000-0001-8765-387X
References
Abdulla W. 2017. Mask R-CNN for object detectionand instance segmentation on Keras andTensorFlow. https://github.com/matterport/Mask_RCNN.2017.
Chakraborty AK, Raina AK, Ramulu M, Choudhury PB,Haldar A, Sahu P, Bandopadhyay C. 2004. Parametricstudy to develop guidelines for blast fragmentationimprovement in jointed and massive formations. EngGeol. 73(1–2):105–116.
Chen LC, Hermans A, Papandreou G, Schroff F, Wang P,Adam H. 2018. Masklab: Instance segmentation by refin-ing object detection with semantic and direction features.In Proceedings of the IEEE Conference on ComputerVision and Pattern Recognition. Salt Lake City, UT,USA; p. 4013–4022.
Cubes M. 1987. A high resolution 3D surface constructionalgorithm. In Proceedings of the 14th AnnualConference on Computer Graphics and Interactive
Figure 13. Fragment segmentation improvement when resizing the original image. ‘Images are available in colour online.’
MINING TECHNOLOGY 11

Techniques; July. New York (NY): Association forComputing Machinery. p. 163–169.
Dai J, He K, Li Y, Ren S, Sun J. 2016. Instance-sensitive fullyconvolutional networks. In European Conference onComputer Vision; Oct 8. Cham: Springer. p. 534–549.
Dutta A, Gupta A, Zissermann A. 2016. VGG ImageAntonator (VIA). [accessed 2020 June 2]. http://www.robots.ox.ac.uk/~vgg/software/%0Avia/via.html.
Enayatollahi I, Bazzazi AA, Asadi A. 2014. Comparisonbetween neural networks and multiple regression analysisto predict rock fragmentation in open-pit mines. RockMech Rock Eng. 47(2):799–807.
Everingham M, Van Gool L, Williams CK, Winn J,Zisserman A. 2010. The pascal visual object classes(voc) challenge. Int J Comput Vision. 88(2):303–338.
Fitzgibbon A, Pilu M, Fisher RB. 1999. Direct least squarefitting of ellipses. IEEE Trans Pattern Anal Mach Intell.21(5):476–480.
Girshick R. 2015. Fast r-cnn. Proceedings of the IEEEInternational Conference on Computer Vision.Santiago, Chile; p. 1440–1448.
He K, Gkioxari G, Dollár P, Girshick R. 2017. Mask r-cnn.Proceedings of the IEEE International Conference onComputer Vision. Venice, Italy; p. 2961–2969.
He K, Zhang X, Ren S, Sun J. 2016. Proceedings of the 2016IEEE Conference on Computer Vision and PatternRecognition. Las Vegas, NV, USA: IEEE: Piscataway,NJ, USA, 2016; p. 770–778. doi:10.1109/CVPR.2016.90.
Hunter GC, McDermott C, Miles NJ, Singh A, Scoble MJ.1990. A review of image analysis techniques formeasuring blast fragmentation. Min Sci Technol. 11(1):19–36.
Kulatilake PH, Qiong W, Hudaverdi T, Kuzu C. 2010. Meanparticle size prediction in rock blast fragmentation usingneural networks. Eng Geol. 114(3–4):298–311.
La Rosa DM, Girdner K, Valery W, Abramson S. 2001.Recent applications of the SPLIT on-line image analysissystem. p. 15–19.
Li Y, Qi H, Dai J, Ji X, Wei Y. 2017. Fully convolutionalinstance-aware semantic segmentation. Proceedings ofthe IEEE Conference on Computer Vision and PatternRecognition. Honolulu, HI, USA; p. 2359–2367.
Lin TY, Dollár P, Girshick R, He K, Hariharan B, Belongie S.2017. Feature pyramid networks for object detection.Proceedings of the IEEE Conference on ComputerVision and Pattern Recognition. Honolulu, HI, USA; p.2117–2125.
LLC Google. Google Colab. [accessed 2020 June 2]. https://colab.research.google.com/notebooks/intro.ipynb.
Long J, Shelhamer E, Darrell T. 2015. Fully convolutionalnetworks for semantic segmentation. Proceedings of theIEEE Conference on Computer Vision and PatternRecognition. Boston, MA, USA; p. 3431–3440.
Monjezi M, Rezaei M, Varjani AY. 2009. Prediction of rockfragmentation due to blasting in Gol-E-gohar iron mineusing fuzzy logic. Int J Rock Mech Min Sci. 46(8):1273–1280.
Onederra I, Mardones F, Scherpenisse C. 2010. Applicationof stochastic approach to blast fragmentation modelling.Min Technol. 119(4):221–232.
Onederra I, Thurley MJ, Catalan A. 2015. Measuring blastfragmentation at esperanza mine using high-resolution3D laser scanning. Min Technol. 124(1):34–36.
Ouchterlony F, Sanchidrián JA. 2019. A review of develop-ment of better prediction equations for blast fragmenta-tion. J Rock Mech Geotech Eng. 11(5):1094–1109.
Pinheiro PO, Collobert R, Dollár P. 2015. Learning to seg-ment object candidates. arXiv preprint arXiv:1506.06204.
Pinheiro PO, Lin TY, Collobert R, Dollár P. 2016. Learningto refine object segments. European Conference onComputer Vision; Oct 8. Cham: Springer. p. 75–91
Ren S, He K, Girshick R, Sun J. 2015. Faster r-cnn: towardsreal-time object detection with region proposal networks.arXiv preprint arXiv:1506.01497.
Ronneberger O, Fischer P, Brox T. 2015. U-net: convolu-tional networks for biomedical image segmentation.International Conference on Medical Image Computingand Computer-Assisted Intervention; Oct 5. Cham:Springer. p. 234–241.
Sayadi A, Monjezi M, Talebi N, Khandelwal M. 2013. Acomparative study on the application of various artificialneural networks to simultaneous prediction of rock frag-mentation and backbreak. J Rock Mech Geotech Eng. 5(4):318–324.
Schenk F, Tscharf A, Mayer G, Fraundorfer F. 2019.Automatic muck pile characterization from UAV images.ISPRS annals of the photogrammetry. Remote Sens SpatInf Sci. 4(W5):163–170.
Shi XZ, Jian ZH, Wu BB, Huang D, Wei WE. 2012. Supportvector machines approach to mean particle size of rockfragmentation due to bench blasting prediction. TransNonferrous Met Soc China. 22(2):432–441.
Siddiqui FI. 2009. Measurement of size distribution ofblasted rock using digital image processing. Eng Sci. 20(2):81–93.
Split Engineering LLC. 2016. Split-desktop 3.0 manual.Sudhakar J, Adhikari GR, Gupta RN. 2006. Comparison of
fragmentation measurements by photographic andimage analysis techniques. Rock Mech Rock Eng. 39(2):159–168.
Thornton DM, Kanchibotla SS, Esterle JS. 2001. A fragmen-tation model to estimate ROM size distribution of softrock types. Proceedings of the Twenty-Seventh AnnualConference on Explosives and Blasting Technique, VolI; Jan 1. International Society of Explosives Engineers.p. 41–53.
12 T. VU ET AL.


![arXiv:1809.08545v3 [cs.CV] 16 Apr 2019 · 3.1. Bounding Box Parameterization Based on a two-stage object detector Faster R-CNN or Mask R-CNN [42,17] shown in Figure3, we propose to](https://img.pdfslide.us/doc/110x75/5f0e99687e708231d44003ae/arxiv180908545v3-cscv-16-apr-2019-31-bounding-box-parameterization-based.jpg)

![cs230.stanford.educs230.stanford.edu/files_winter_2018/projects/6937153.pdf · 3.3.2 Mask RCNN Mask R-CNN is an extension of the Faster RCNN model [2]. Faster R-CNN is a Region Proposal](https://img.pdfslide.us/doc/110x75/5e448090b525a912e76a06e0/cs230-332-mask-rcnn-mask-r-cnn-is-an-extension-of-the-faster-rcnn-model-2.jpg)


![Deep-6DPose: Recovering 6D Object Pose from a Single RGB Image · Faster R-CNN [27] and instance segmentation method Mask R-CNN [9] is the Region Proposal Network — RPN. The core](https://img.pdfslide.us/doc/110x75/5ecc609fb8c6ff0d7514b718/deep-6dpose-recovering-6d-object-pose-from-a-single-rgb-image-faster-r-cnn-27.jpg)
![Telecommunication Products - Trendtek jointing pits.pdf · [01] UG2006 - P6 Pit UG2007 - P7 Pit UG2008 - P8 Pit UG2900 - P9 Pit UG2001 - P1 Pit UG2002 - P2 Pit UG2003 - P3 Pit UG2004](https://img.pdfslide.us/doc/110x75/5a7969077f8b9ab9308d3433/telecommunication-products-jointing-pitspdf01-ug2006-p6-pit-ug2007-p7-pit.jpg)


![Supplementary Material for DepthLab: Real-time 3D ......Software and Technology (UIST). ACM, 14. [6]Kaiming He, Georgia Gkioxari, Piotr Dollár, and Ross Girshick. 2017. Mask R-CNN](https://img.pdfslide.us/doc/110x75/5f7318b8f0736953d255f3c8/supplementary-material-for-depthlab-real-time-3d-software-and-technology.jpg)


![TensorMask: A Foundation for Dense Object Segmentation · rate predictions, as pioneered by Faster R-CNN [34] and Mask R-CNN [17] for bounding-box object detection and instance segmentation,](https://img.pdfslide.us/doc/110x75/5e386a20c7754528ff72ed34/tensormask-a-foundation-for-dense-object-segmentation-rate-predictions-as-pioneered.jpg)